appdynamics for node.js beta
TRANSCRIPT
Copyright © AppDynamics 2012-2014 Page 1
AppDynamics Pro DocumentationVersion 3.8.x
AppDynamics for Node.js Beta

Copyright © AppDynamics 2012-2014 Page 2
1. AppDynamics for Node.js Beta . . . . . . . . . . . . . . . . . . . . . . . . . . . . . . . . . . . . . . . . . . . . . 31.1 Requirements for Node.js Beta . . . . . . . . . . . . . . . . . . . . . . . . . . . . . . . . . . . . . . . . . 31.2 AppDynamics for Node.js Architecture . . . . . . . . . . . . . . . . . . . . . . . . . . . . . . . . . . . 31.3 Supported Environments and Versions for Node.js . . . . . . . . . . . . . . . . . . . . . . . . . . 41.4 Install the App Agent for Node.js . . . . . . . . . . . . . . . . . . . . . . . . . . . . . . . . . . . . . . . . 51.5 Uninstall the App Agent for Node.js . . . . . . . . . . . . . . . . . . . . . . . . . . . . . . . . . . . . . . 81.6 Configure AppDynamics for Node.js . . . . . . . . . . . . . . . . . . . . . . . . . . . . . . . . . . . . . 8
1.6.1 Configure Transaction Detection for Node.js . . . . . . . . . . . . . . . . . . . . . . . . . . . 81.6.2 Configure Error Detection for Node.js . . . . . . . . . . . . . . . . . . . . . . . . . . . . . . . . 12
1.7 Monitor Node.js Applications . . . . . . . . . . . . . . . . . . . . . . . . . . . . . . . . . . . . . . . . . . . 131.7.1 Monitor Node.js Business Transactions . . . . . . . . . . . . . . . . . . . . . . . . . . . . . . 141.7.2 Monitor Node.js Processes . . . . . . . . . . . . . . . . . . . . . . . . . . . . . . . . . . . . . . . . 141.7.3 Monitor Node.js Backends . . . . . . . . . . . . . . . . . . . . . . . . . . . . . . . . . . . . . . . . . 19
1.8 Troubleshoot Node.Js Application Problems . . . . . . . . . . . . . . . . . . . . . . . . . . . . . . . 201.8.1 Troubleshoot Slow Response Times for Node.js . . . . . . . . . . . . . . . . . . . . . . . . 20
Copyright © AppDynamics 2012-2014 Page 3
AppDynamics for Node.js BetaThis information covers using and configuring the Agent for Node.js.
For general information about AppDynamics see and AppDynamics Essentials AppDynamics.Features
Monitor Node.jsApplications
Troubleshoot Node.js Application Problems
Install AppDynamics forNode.js
Configure AppDynamicsfor Node.js
Supported Environmentsand Versions for Node.js
Requirements for Node.js Beta
The Node.js agent requires a 3.8 AppDynamics on-premise Controller. See Controller System for information on sizing your Controller.Requirements
You can download the controller from .the AppDynamics download site
A license file is required. Contact the Node.js beta manager at [email protected] aboutobtaining a license and accessing the agent download site.
AppDynamics for Node.js Architecture
The AppDynamics agent for Node.js instruments a single Node.js process. Instrumentationenables the agent to discover, map and track metrics for business transactions, applicationservices, and backends in your Node.js application. Typically there is a one-to-onecorrespondence between a process and a Node.js application but sometimes an applicationconsists of multiple processes.
This agent communicates with a Java proxy dameon that handles the communication between theNode.js agent and the AppDynamics Controller. The proxy reports the performance metrics to theController, where the data is stored, baselined, and analyzed. You can access this performancedata interactively using the Browser UI or programmatically using the AppDynamics REST API.

Copyright © AppDynamics 2012-2014 Page 4
The proxy component is automatically started when you start the Node.js app agent.
Supported Environments and Versions for Node.js
Supported Platform Matrix for the App Agent for Node.jsNode.js VersionsOperating SystemsTransaction NamingHTTP Exit PointsDatabase Exit PointsCache Exit Points
Supported Platform Matrix for the App Agent for Node.js
Node.js Versions
Supported Node.js Versions
0.8 +
Operating Systems
Supported Operating System
Linux 32-bit
Linux 64-bit
Mac OSX v10.9.2

Copyright © AppDynamics 2012-2014 Page 5
Transaction Naming
Entry Type Default Transaction Naming
Node.js Web URI
HTTP Exit Points
Supported HTTP Exit Points
Node.js HTTP client library
See for information about the Node.js HTTP client library.http://nodejs.org/api/http.html
Database Exit Points
Supported Database Exit Points
MongoDB
MySQL
PGSQL
Riak
Cache Exit Points
Supported Cache Exit Points
Memcached
Redis
Install the App Agent for Node.js
Prerequisites for Agent InstallationInstrumenting Node.js Applications
Installing the AgentModifying the Application Code
LogsNode.js Agent LogProxy Log
Installing the Machine Agent on an Node.js Node
Prerequisites for Agent Installation
1. Download the tarball file for the App Agent for Node.js from the AppDynamics beta download. zone
If you do not have access to the beta zone, please request it from your account manager and/oremail the Node.js Product Manager: [email protected].
Copyright © AppDynamics 2012-2014 Page 6
2. Be prepared to provide the following information:
controller host and controller port: These are the host name or IP address and the portnumber of the AppDynamics controller that the agent connects to. On-premise customersestablish these settings when they install the controller.AppDynamics application name: This is the name that you assign to the businessapplication you will monitor with the App Agent for Node.js.AppDynamics tier name: This is the name that you assign to the tier you will monitor with theApp Agent for Node.js.AppDynamics node name: This is the prefix to the dynamically-generated node name of theserver that you will monitor with the App Agent for Node.js. On startup the agent assigns anindex based on the startup of the node processes and appends this index to this prefixspecified to create the node name that is displayed in the AppDynamics console.
3. You need permission to perform a package installation and to edit the application source codeto complete the installation.
Instrumenting Node.js Applications
There are two steps to instrument your Node.js applications:
Installing the AgentModifying the Application Code
Installing the Agent
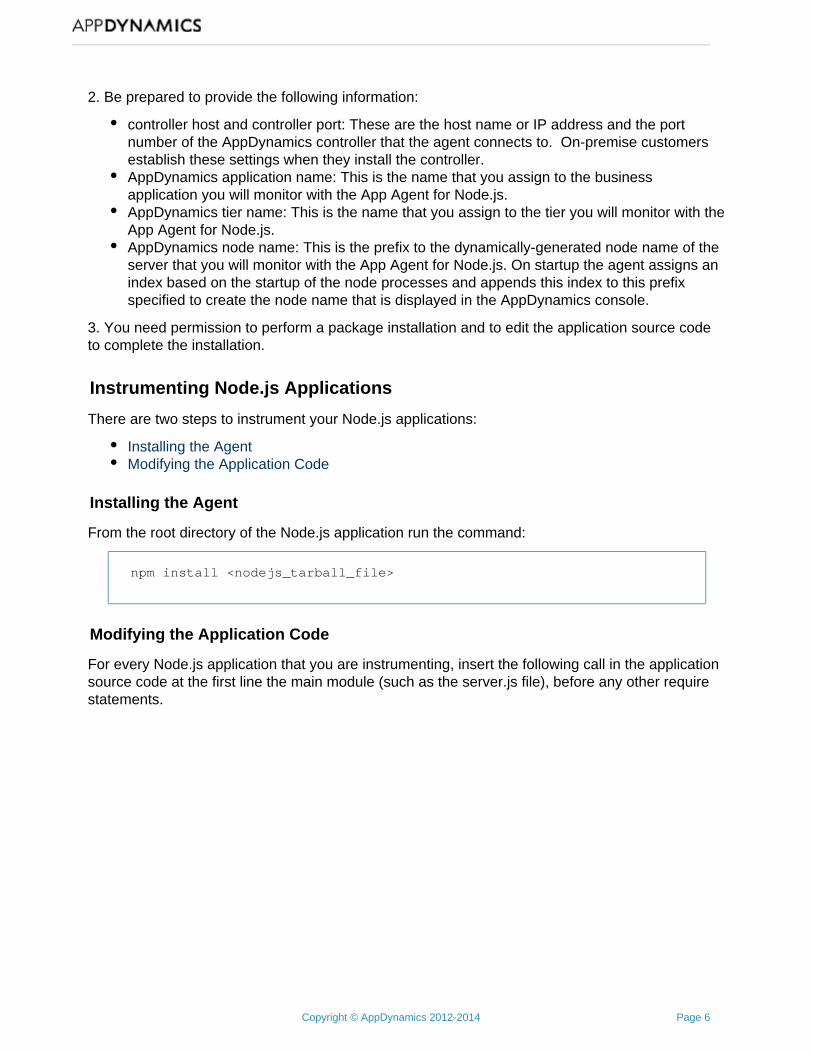
From the root directory of the Node.js application run the command:
npm install <nodejs_tarball_file>
Modifying the Application Code
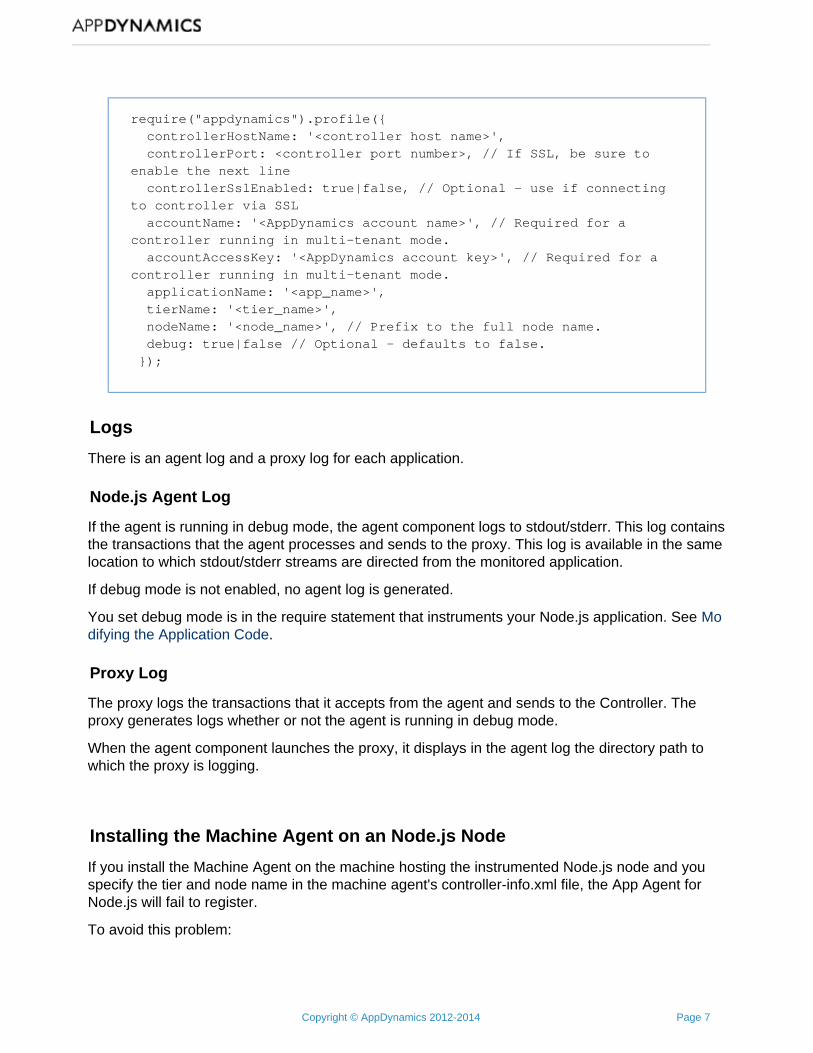
For every Node.js application that you are instrumenting, insert the following call in the applicationsource code at the first line the main module (such as the server.js file), before any other requirestatements.
Copyright © AppDynamics 2012-2014 Page 7
require("appdynamics").profile({ controllerHostName: '<controller host name>', controllerPort: <controller port number>, // If SSL, be sure toenable the next line controllerSslEnabled: true|false, // Optional - use if connectingto controller via SSL accountName: '<AppDynamics account name>', // Required for acontroller running in multi-tenant mode. accountAccessKey: '<AppDynamics account key>', // Required for acontroller running in multi-tenant mode. applicationName: '<app_name>', tierName: '<tier_name>', nodeName: '<node_name>', // Prefix to the full node name. debug: true|false // Optional - defaults to false. });
Logs
There is an agent log and a proxy log for each application.
Node.js Agent Log
If the agent is running in debug mode, the agent component logs stdout/stderr. This log containsto the transactions that the agent processes and sends to the proxy. This log is available in the samelocation to which stdout/stderr streams are directed from the monitored application.
If debug mode is not enabled, no agent log is generated.
You set debug mode is in the require statement that instruments your Node.js application. See Mo.difying the Application Code
Proxy Log
The proxy logs the transactions that it accepts from the agent and sends to the Controller. Theproxy generates logs whether or not the agent is running in debug mode.
When the agent component launches the proxy, it displays in the agent log the directory path towhich the proxy is logging.
Installing the Machine Agent on an Node.js Node
If you install the Machine Agent on the machine hosting the instrumented Node.js node and youspecify the tier and node name in the machine agent's controller-info.xml file, the App Agent forNode.js will fail to register.
To avoid this problem:
Copyright © AppDynamics 2012-2014 Page 8
1.
2.
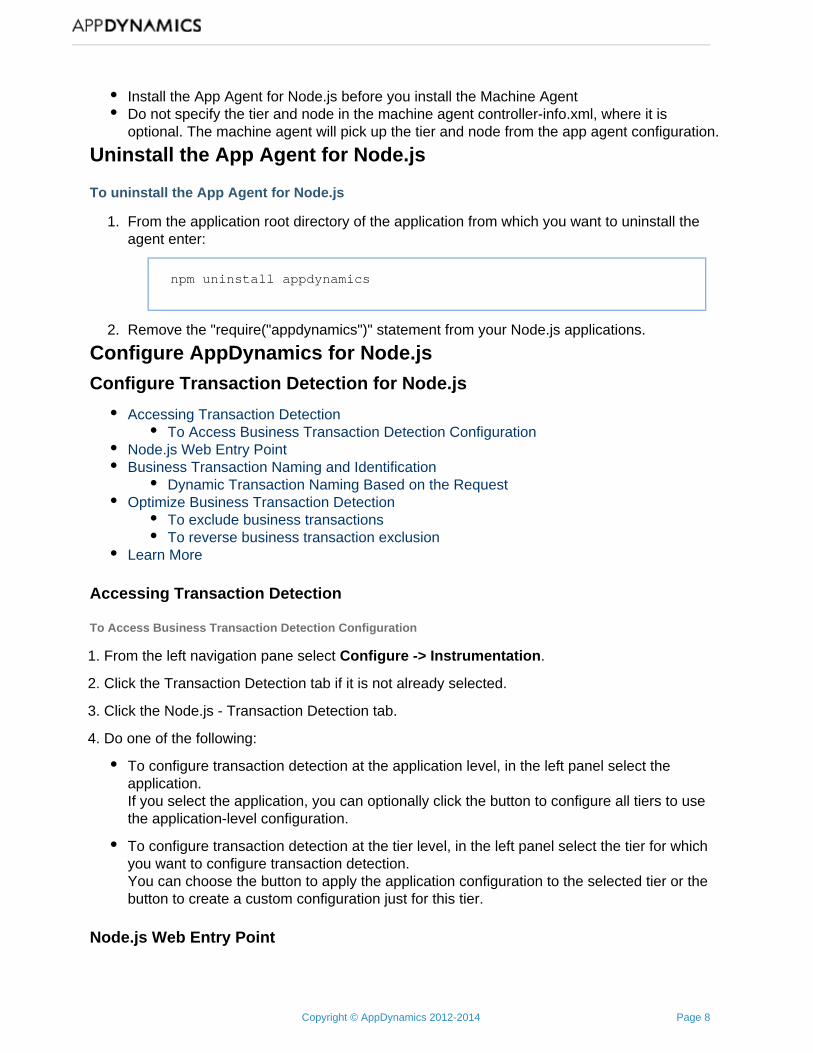
Install the App Agent for Node.js before you install the Machine AgentDo not specify the tier and node in the machine agent controller-info.xml, where it isoptional. The machine agent will pick up the tier and node from the app agent configuration.
Uninstall the App Agent for Node.js
To uninstall the App Agent for Node.js
From the application root directory of the application from which you want to uninstall theagent enter:
npm uninstall appdynamics
Remove the "require("appdynamics")" statement from your Node.js applications.
Configure AppDynamics for Node.js
Configure Transaction Detection for Node.js
Accessing Transaction DetectionTo Access Business Transaction Detection Configuration
Node.js Web Entry PointBusiness Transaction Naming and Identification
Dynamic Transaction Naming Based on the RequestOptimize Business Transaction Detection
To exclude business transactionsTo reverse business transaction exclusion
Learn More
Accessing Transaction Detection
To Access Business Transaction Detection Configuration
1. From the left navigation pane select .Configure -> Instrumentation
2. Click the Transaction Detection tab if it is not already selected.
3. Click the Node.js - Transaction Detection tab.
4. Do one of the following:
To configure transaction detection at the application level, in the left panel select theapplication.If you select the application, you can optionally click the button to configure all tiers to usethe application-level configuration.
To configure transaction detection at the tier level, in the left panel select the tier for whichyou want to configure transaction detection.You can choose the button to apply the application configuration to the selected tier or thebutton to create a custom configuration just for this tier.
Node.js Web Entry Point
Copyright © AppDynamics 2012-2014 Page 9
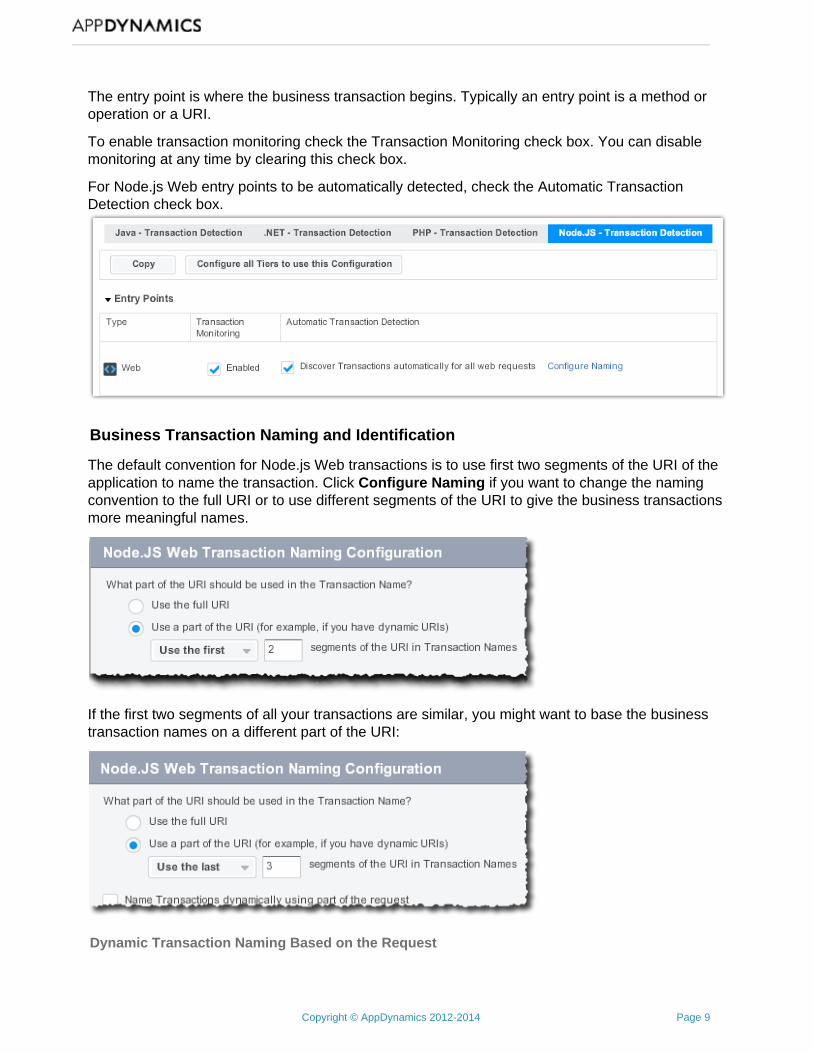
The entry point is where the business transaction begins. Typically an entry point is a method oroperation or a URI.
To enable transaction monitoring check the Transaction Monitoring check box. You can disablemonitoring at any time by clearing this check box.
For Node.js Web entry points to be automatically detected, check the Automatic TransactionDetection check box.
Business Transaction Naming and Identification
The default convention for Node.js Web transactions is to use first two segments of the URI of theapplication to name the transaction. Click if you want to change the namingConfigure Namingconvention to the full URI or to use different segments of the URI to give the business transactionsmore meaningful names.
If the first two segments of all your transactions are similar, you might want to base the businesstransaction names on a different part of the URI:
Dynamic Transaction Naming Based on the Request
Copyright © AppDynamics 2012-2014 Page 10
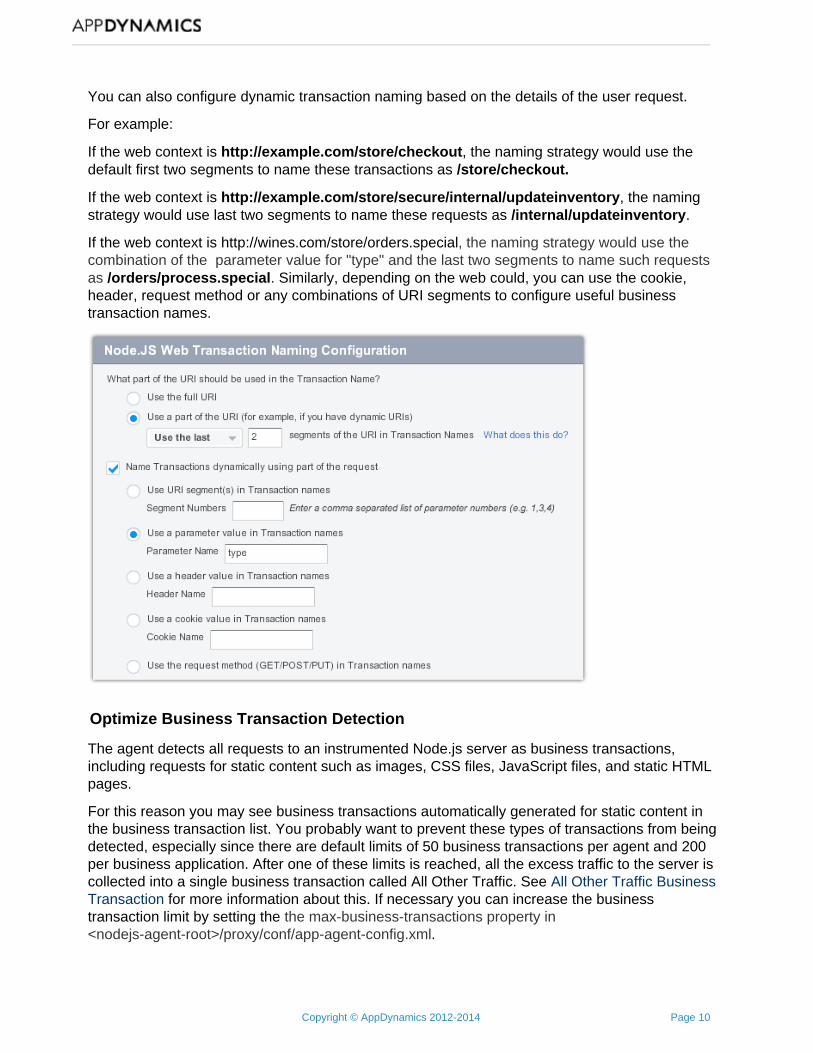
You can also configure dynamic transaction naming based on the details of the user request.
For example:
If the web context is , the naming strategy would use thehttp://example.com/store/checkoutdefault first two segments to name these transactions as /store/checkout.
If the web context is ,/secure/internal/updateinventoryhttp://example.com/store the namingstrategy would use last two segments to name these requests as ./internal/updateinventory
If the web context is http://wines.com/store/orders.special the, the naming strategy would usecombination of the parameter value for "type" and the last two segments to name such requests
. as /orders/process.special Similarly, depending on the web could, you can use the cookie,header, request method or any combinations of URI segments to configure useful businesstransaction names.
Optimize Business Transaction Detection
The agent detects all requests to an instrumented Node.js server as business transactions,including requests for static content such as images, CSS files, JavaScript files, and static HTMLpages.
For this reason you may see business transactions automatically generated for static content inthe business transaction list. You probably want to prevent these types of transactions from beingdetected, especially since there are default limits of 50 business transactions per agent and 200per business application. After one of these limits is reached, all the excess traffic to the server iscollected into a single business transaction called All Other Traffic. See All Other Traffic Business
for more information about this. If necessary you can increase the businessTransactiontransaction limit by setting the the max-business-transactions property in
.<nodejs-agent-root>/proxy/conf/app-agent-config.xml
Copyright © AppDynamics 2012-2014 Page 11
1. 2. 3. 4.
5.
1. 2. 3.
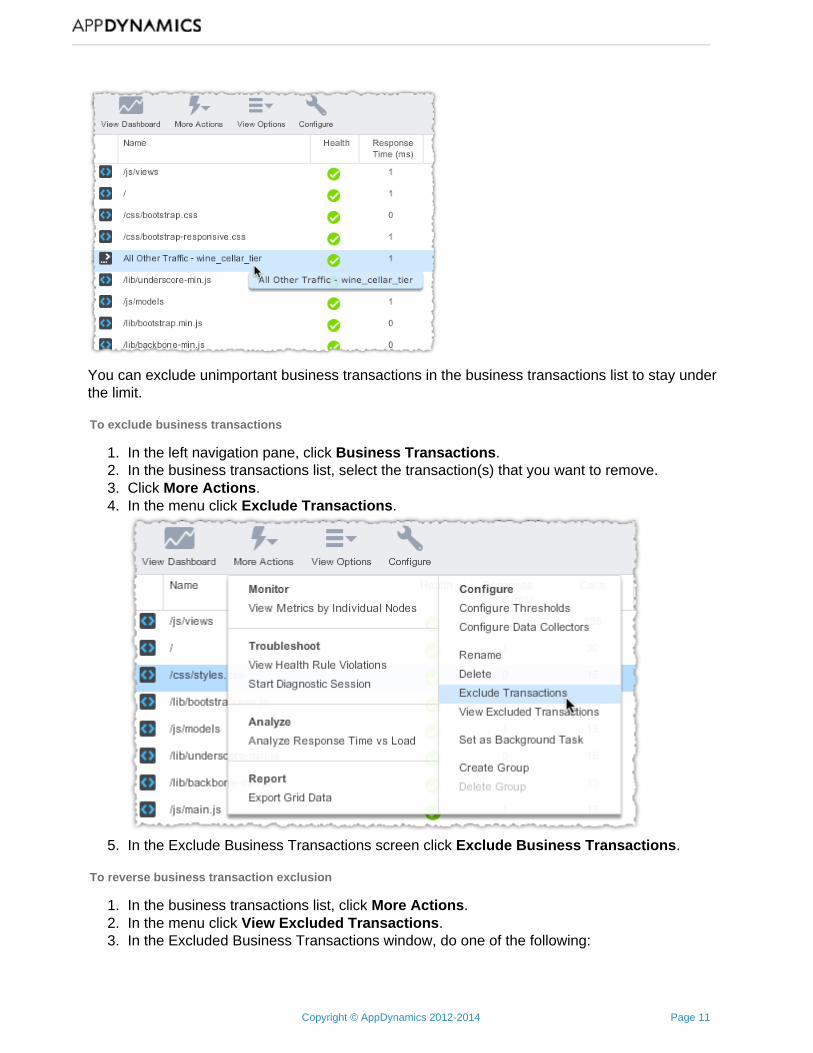
You can exclude unimportant business transactions in the business transactions list to stay underthe limit.
To exclude business transactions
In the left navigation pane, click .Business TransactionsIn the business transactions list, select the transaction(s) that you want to remove.Click .More ActionsIn the menu click .Exclude Transactions
In the Exclude Business Transactions screen click .Exclude Business Transactions
To reverse business transaction exclusion
In the business transactions list, click .More ActionsIn the menu click .View Excluded TransactionsIn the Excluded Business Transactions window, do one of the following:
Copyright © AppDynamics 2012-2014 Page 12
3.
1. 2. 3.
To unexclude all the excluded transactions, click Unexclude All.To unexclude some of the excluded transactions, select the transaction(s) and click U
.nexclude Selected
After a business transaction has been unexcluded, the agent starts monitoring it again and it iscounted toward the business transaction limit.
Learn More
Business Transaction Monitoring
Configure Error Detection for Node.js
Accessing Error Detection Configuration for the Node.js AgentTo Access Error Detection Configuration
Ignoring ExceptionsTo configure the Node.js agent to ignore an exception
You can configure which exceptions and log messages the agent should ignore when reportingerrors. Ignored errors are not be included in the business transaction error count.
These configurations help you reduce the number of errors that the agent reports so you see justthose that are most interested for monitoring and troubleshooting.
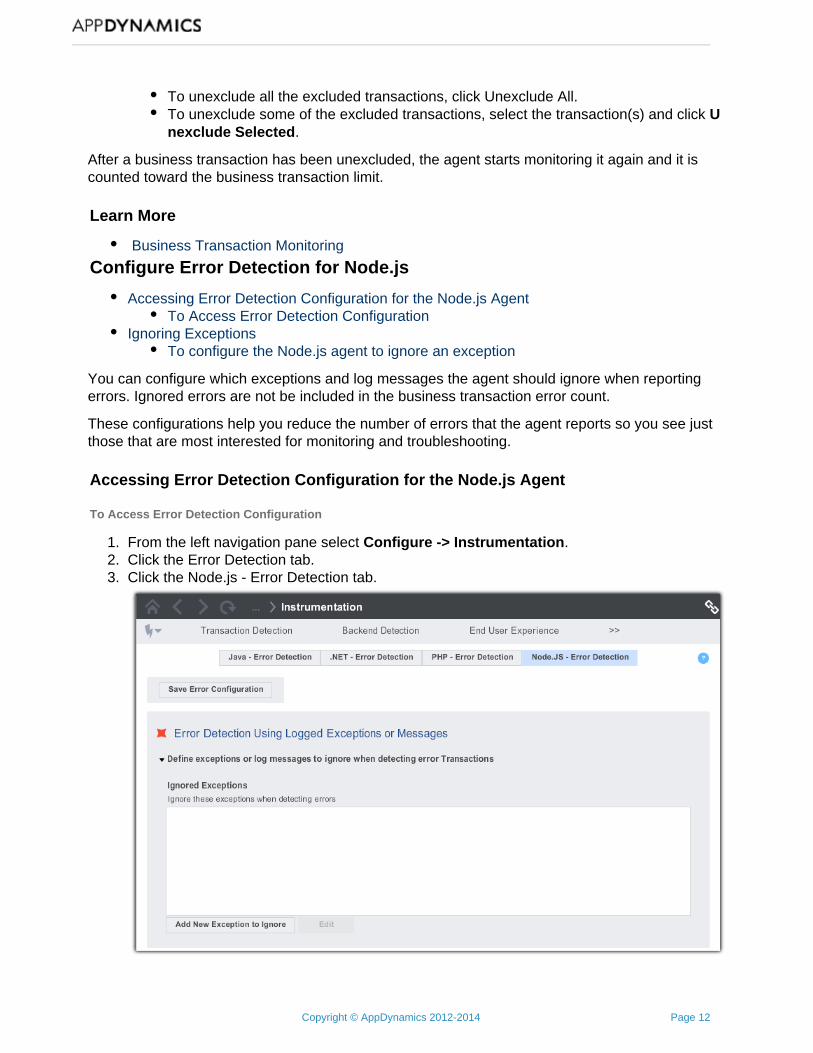
Accessing Error Detection Configuration for the Node.js Agent
To Access Error Detection Configuration
From the left navigation pane select .Configure -> InstrumentationClick the Error Detection tab.Click the Node.js - Error Detection tab.
Copyright © AppDynamics 2012-2014 Page 13
3.
1.
2.
3. 4.
Ignoring Exceptions
Exceptions that are ignored are listed in the Ignored Exceptions list.
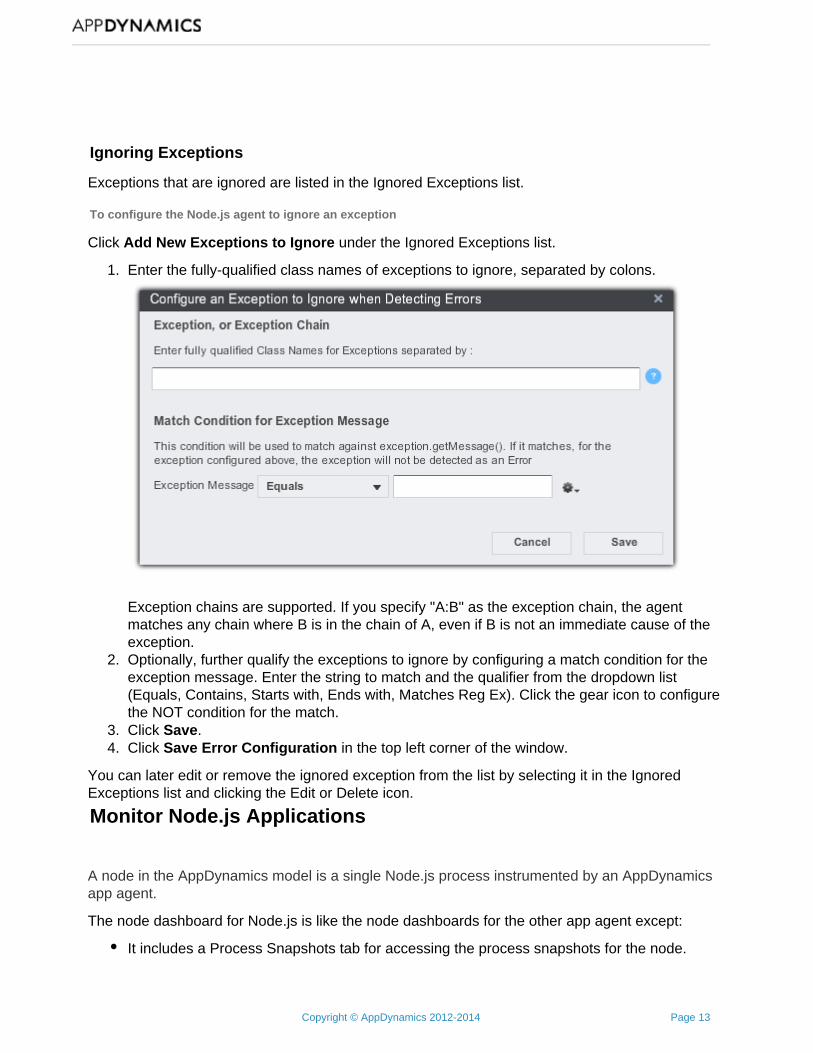
To configure the Node.js agent to ignore an exception
Click under the Ignored Exceptions list.Add New Exceptions to Ignore
Enter the fully-qualified class names of exceptions to ignore, separated by colons.
Exception chains are supported. If you specify "A:B" as the exception chain, the agentmatches any chain where B is in the chain of A, even if B is not an immediate cause of theexception.Optionally, further qualify the exceptions to ignore by configuring a match condition for theexception message. Enter the string to match and the qualifier from the dropdown list(Equals, Contains, Starts with, Ends with, Matches Reg Ex). Click the gear icon to configurethe NOT condition for the match.Click .SaveClick in the top left corner of the window.Save Error Configuration
You can later edit or remove the ignored exception from the list by selecting it in the IgnoredExceptions list and clicking the Edit or Delete icon.
Monitor Node.js Applications
A node in the AppDynamics model is a single Node.js process instrumented by an AppDynamicsapp agent.
The node dashboard for Node.js is like the node dashboards for the other app agent except:
It includes a Process Snapshots tab for accessing the process snapshots for the node.
Copyright © AppDynamics 2012-2014 Page 14
It does not include a Memory tab for monitoring memory usage.
See for general information about node dashboards.Node Dashboard
The tier dashboard for Node.js is similar to the tier dashboards for the other app agents exceptthat it includes a tab for accessing the process snapshots for the nodes contained by the tier.
See for general information about tier dashboards.Tier Dashboard
See for information about process snapshots.Monitor Node.js Processes
Monitor Node.js Business Transactions
See and for general information aboutBusiness Transaction Monitoring Transaction Snapshotsmonitoring business transactions.
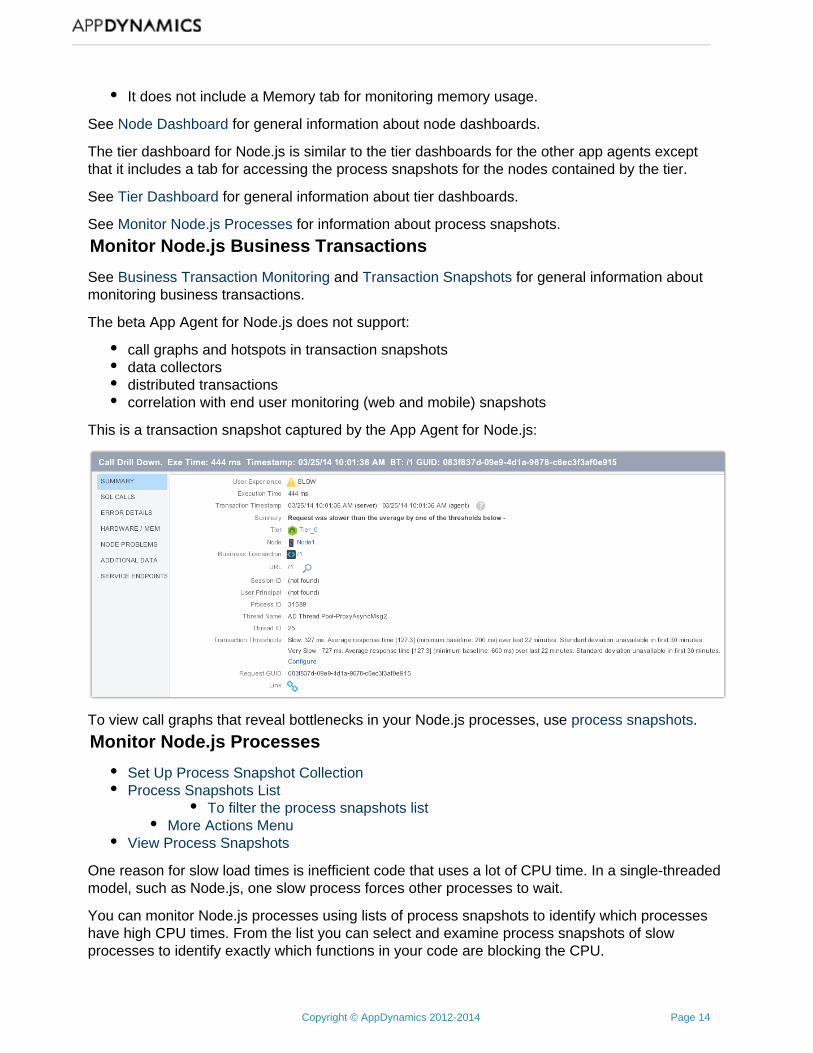
The beta App Agent for Node.js does not support:
call graphs and hotspots in transaction snapshotsdata collectorsdistributed transactionscorrelation with end user monitoring (web and mobile) snapshots
This is a transaction snapshot captured by the App Agent for Node.js:
To view call graphs that reveal bottlenecks in your Node.js processes, use .process snapshots
Monitor Node.js Processes
Set Up Process Snapshot CollectionProcess Snapshots List
To filter the process snapshots listMore Actions Menu
View Process Snapshots
One reason for slow load times is inefficient code that uses a lot of CPU time. In a single-threadedmodel, such as Node.js, one slow process forces other processes to wait.
You can monitor Node.js processes using lists of process snapshots to identify which processeshave high CPU times. From the list you can select and examine process snapshots of slowprocesses to identify exactly which functions in your code are blocking the CPU.
Copyright © AppDynamics 2012-2014 Page 15
1.
2. 3. 4.
5.
6.
1.
2.
A process snapshot describes an instance of a CPU process on an instrumented node.js node. Itgenerates a process-wide call graph for a CPU process over a configurable time range. Processsnapshots are independent of any running business transactions. Process snapshots persist for 14days, unless you archive them in which case they are available forever.
You can monitor process snapshots at the tier level or the node level.
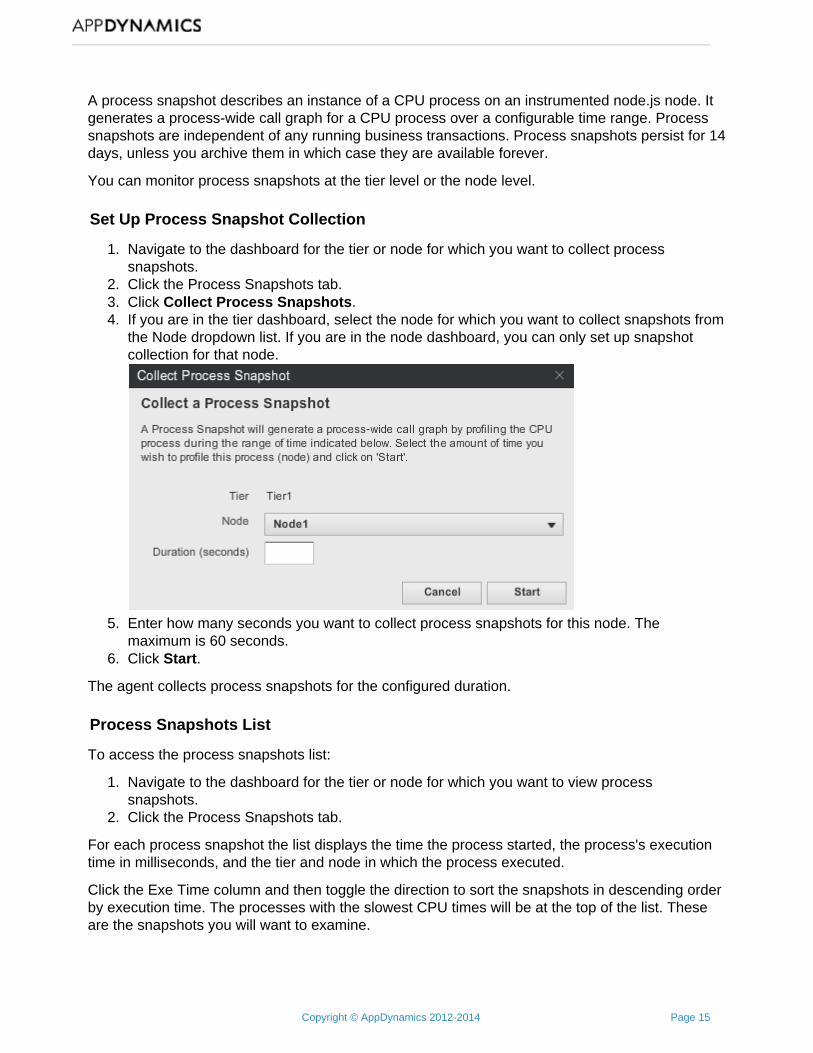
Set Up Process Snapshot Collection
Navigate to the dashboard for the tier or node for which you want to collect processsnapshots.Click the Process Snapshots tab.Click . Collect Process SnapshotsIf you are in the tier dashboard, select the node for which you want to collect snapshots fromthe Node dropdown list. If you are in the node dashboard, you can only set up snapshotcollection for that node.
Enter how many seconds you want to collect process snapshots for this node. Themaximum is 60 seconds.Click .Start
The agent collects process snapshots for the configured duration.
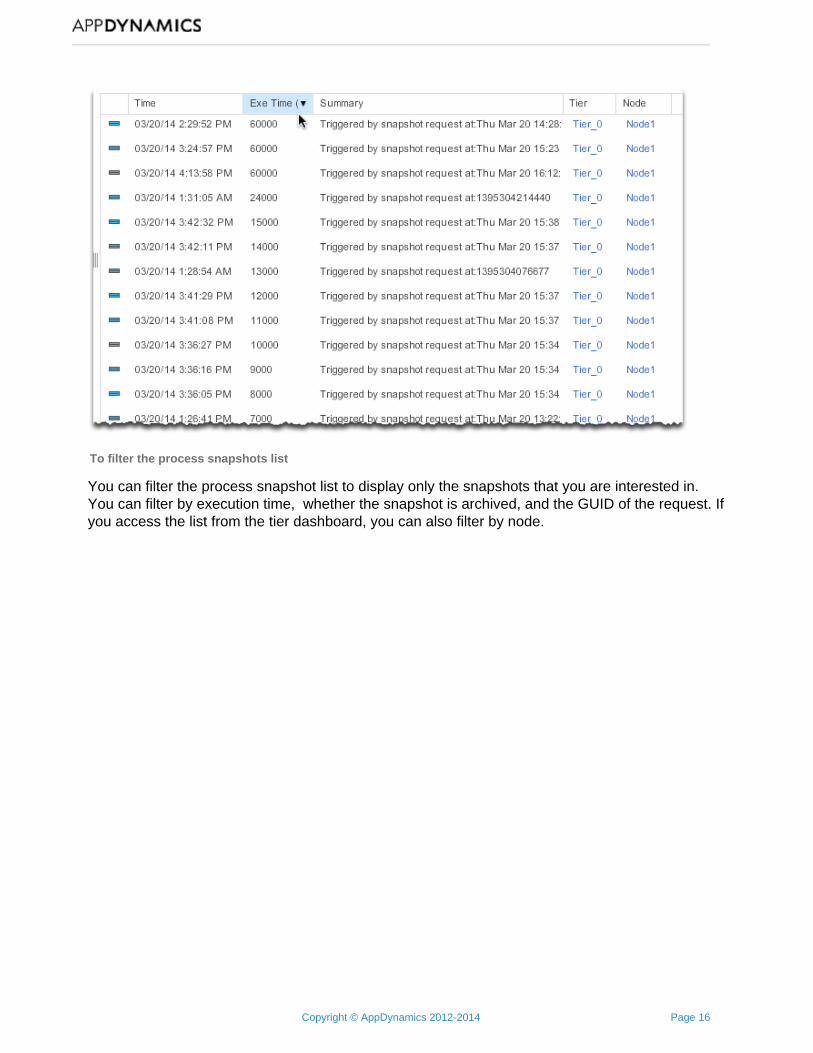
Process Snapshots List
To access the process snapshots list:
Navigate to the dashboard for the tier or node for which you want to view processsnapshots.Click the Process Snapshots tab.
For each process snapshot the list displays the time the process started, the process's executiontime in milliseconds, and the tier and node in which the process executed.
Click the Exe Time column and then toggle the direction to sort the snapshots in descending orderby execution time. The processes with the slowest CPU times will be at the top of the list. Theseare the snapshots you will want to examine.
Copyright © AppDynamics 2012-2014 Page 16
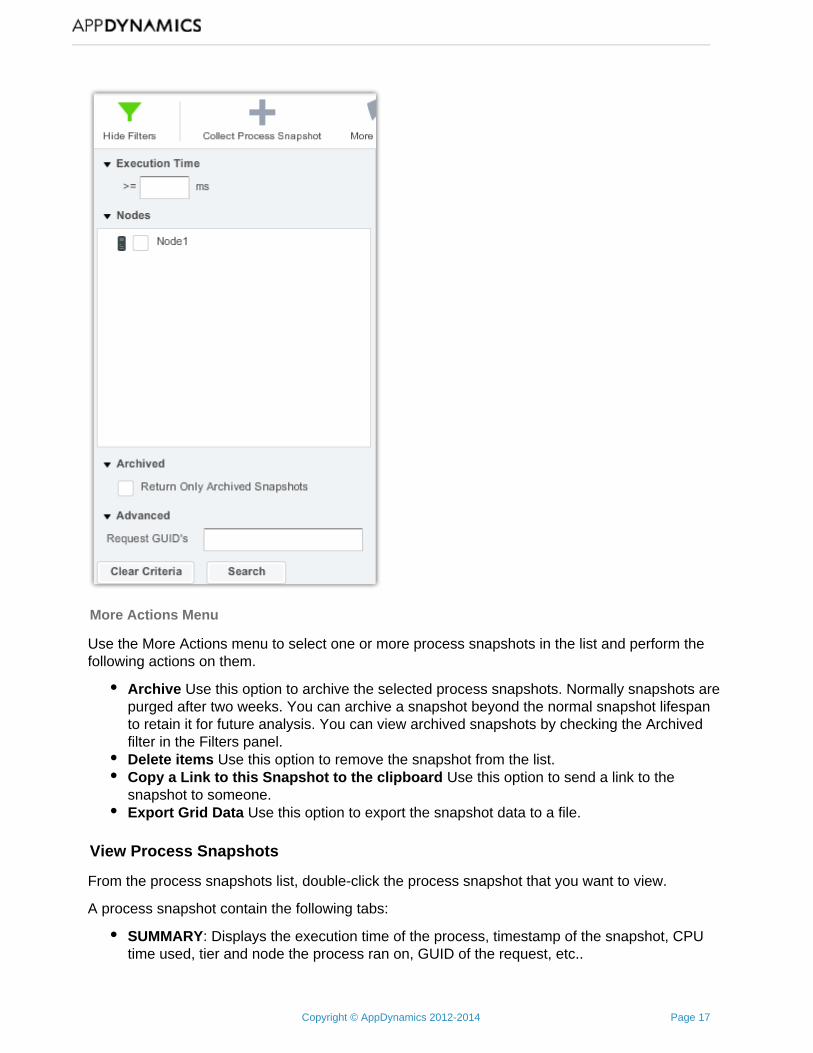
To filter the process snapshots list
You can filter the process snapshot list to display only the snapshots that you are interested in.You can filter by execution time, whether the snapshot is archived, and the GUID of the request. Ifyou access the list from the tier dashboard, you can also filter by node.
Copyright © AppDynamics 2012-2014 Page 17
More Actions Menu
Use the More Actions menu to select one or more process snapshots in the list and perform thefollowing actions on them.
Archive Use this option to archive the selected process snapshots. Normally snapshots arepurged after two weeks. You can archive a snapshot beyond the normal snapshot lifespanto retain it for future analysis. You can view archived snapshots by checking the Archivedfilter in the Filters panel.Delete items Use this option to remove the snapshot from the list.Copy a Link to this Snapshot to the clipboard Use this option to send a link to thesnapshot to someone.Export Grid Data Use this option to export the snapshot data to a file.
View Process Snapshots
From the process snapshots list, double-click the process snapshot that you want to view.
A process snapshot contain the following tabs:
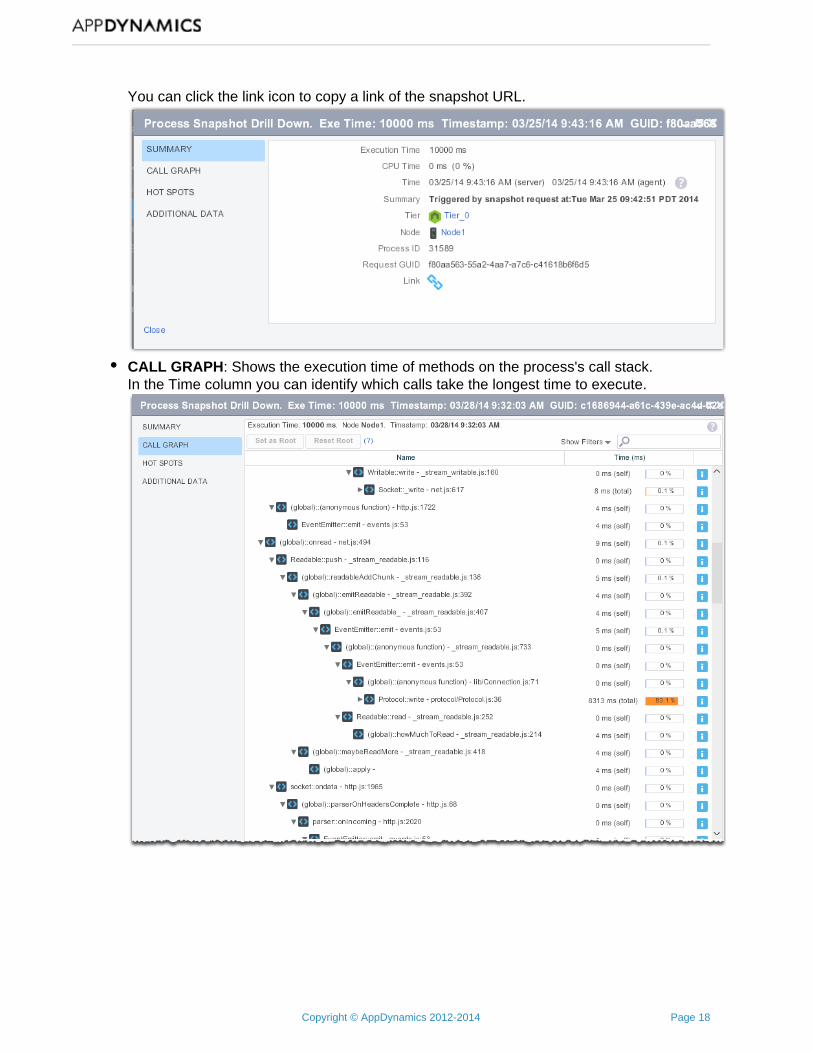
SUMMARY: Displays the execution time of the process, timestamp of the snapshot, CPUtime used, tier and node the process ran on, GUID of the request, etc..
Copyright © AppDynamics 2012-2014 Page 18
You can click the link icon to copy a link of the snapshot URL.
CALL GRAPH: Shows the execution time of methods on the process's call stack.In the Time column you can identify which calls take the longest time to execute.

Copyright © AppDynamics 2012-2014 Page 19
Click the to see more information about a call.
The total processing time displayed for the root element in the call graph includes the CPUidle time.
HOT SPOTS: Sorts the calls by execution time, with the most expensive calls at the top.To see the invocation trace of a single call in the lower panel, select the call in the upperpanel.Use the slider in the upper right corner to filter which calls to display as hot spots. Forexample, the following setting filters out all calls faster than 496 ms from the hot spots list.
ADDITIONAL DATA : Displays the unique id of the process.
Monitor Node.js Backends
A backend is an entity in the AppDynamics model that the app agent does not instrument directly,but monitors traffic flows to it. The App Agent for Node.js monitors flows to database and cacheexit points. See for the current list of supportedSupported Environments and Versions for Node.jsbackends.
You cannot configure detection and naming for Node.js backends.
Copyright © AppDynamics 2012-2014 Page 20
1. 2.
For general information about monitoring backends see:
Backend MonitoringMonitor DatabasesMonitor Remote Services
Troubleshoot Node.Js Application Problems
Troubleshoot Slow Response Times for Node.js
Slow and Stalled TransactionsTo troubleshoot slow and stalled transactions
High CPU TimesTo troubleshoot slow processes
Learn More
When you click the Slow Response Times windowTroubleshoot -> Slow Response Times, opens showing two tabs. You can drill down into transaction issues in the aSlow Transactions tabnd into database or remote services issues in the .Slowest DB & Remote Services tab
Slow and Stalled Transactions
There are many reasons why a business transaction may be slow or stalled.
By default AppDynamics considers a slow transaction one that lasts longer than 3 times thestandard deviation for the last two hours and a very slow transaction 4 times the baseline for thelast two hours.
By default AppDynamics considers a transaction that lasts longer than 45 seconds (4500milliseconds) to be stalled.
You can configure these thresholds to better match your environment. See and Thresholds Config.ure Thresholds
To troubleshoot slow and stalled transactions
Click .Troubleshoot -> Slow Response TimesClick the tab if it is not selected.Slow TransactionsIn the upper pane AppDynamics displays a graph of the slow, very slow, and stalledtransactions for the time period specified in the Time Range drop-down menu. Click the PlotLoad check box to see the load.
Copyright © AppDynamics 2012-2014 Page 21
2.
3. 4.
1. 2. 3.
4.
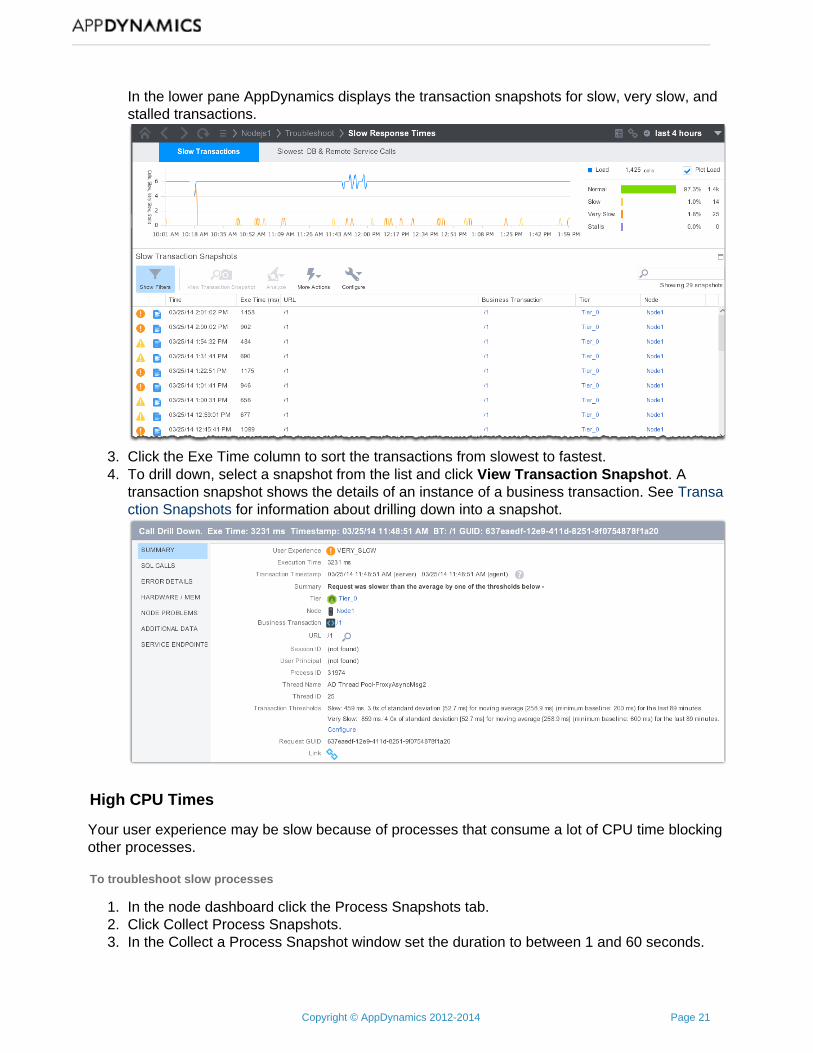
In the lower pane AppDynamics displays the transaction snapshots for slow, very slow, andstalled transactions.
Click the Exe Time column to sort the transactions from slowest to fastest.To drill down, select a snapshot from the list and click . AView Transaction Snapshottransaction snapshot shows the details of an instance of a business transaction. See Transa
for information about drilling down into a snapshot. ction Snapshots
High CPU Times
Your user experience may be slow because of processes that consume a lot of CPU time blockingother processes.
To troubleshoot slow processes
In the node dashboard click the Process Snapshots tab.Click Collect Process Snapshots.In the Collect a Process Snapshot window set the duration to between 1 and 60 seconds.
Copyright © AppDynamics 2012-2014 Page 22
4.
5.
6. 7. 8.
9.
Click Start.In a few minutes you should see some process snapshots in the list.Sort the list by toggling the Exe Time column in the process snapshots list so that thesnapshots for the slowest processes are at the top of the list.Double-click one of the slow process snapshots.In the process snapshot, click the CALL GRAPH tab if it is not selected.Examine the Time column in the call graph to identify which of the calls are slow.
Click the at the end of the row for the slow call to see details.
Learn More
Monitor Node.js Business TransactionsMonitor Node.js ProcessesTransaction SnapshotsConfigure Thresholds