appendices a – d the application of …nathers.gov.au/sites/prod.nathers/files/u20/final...
TRANSCRIPT

4.2 Attachment D
1
APPENDICES A – D
THE APPLICATION OF NATHERS
SOFTWARE IN NORTHERN AUSTRALIAN
CLIMATES
4.2 Attachment D
2
APPENDIX A: TOOLS USED
1.1 ACCUBATCH
The AccuBatch utility allows the user to run many simulations with a wide variety of occupant behaviour
assumptions (including no heating and cooling) over several climates. The results are written to a file which is
easily opened by Excel. Tony Isaacs Consulting developed this tool for the former Department of Climate
Change and Energy Efficiency (DCCEE), and it is now maintained and distributed through CSIRO. This tool has
been used for this project.
Using AccuBatch has several time saving and analysis benefits:
It eliminates transcribing results,
It allows free running mode to be invoked without the need for a separate simulation in the NatHERS
tool,
It can analyse the frequency distribution of temperatures in all zones – this would otherwise require
the temperature file to be cut and paste into a spread sheet for each simulation,
It can change occupant heating and cooling hours of use and thermostats to represent a more
average condition and so give a better indication of actual energy savings,
It allows solutions developed for a particular location to be tested across the various NatHERS
reference locations in the same BCA climate zone for very little additional effort,
It can automatically save hourly energy and temperature files for later analysis, and
It can analyse the frequency distribution of heating and cooling loads to provide a peak load for the
house or a particular room.

4.2 Attachment D
3
1.2 TICTOOL
Tony Isaacs Consulting (TIC) has also developed an extensive range of free running temperature analysis
spread sheets which facilitate easy analysis of hourly temperature files. These were developed through other
similar projects and through the TIC NatHERS assessor practice where they are used to offer extended rating
services. The current 69 climate data files have been analysed to identify 17 different climate periods useful
for the evaluation of temperatures under critical conditions:
i) 1a Day of highest maximum temperature
ii) 1b Day of highest average temperature put in 1a 1b etc.
iii) 1c Day of lowest minimum temperature
iv) 2a Day of lowest average temperature
v) 2b 3 day period of highest average temperature
vi) 2c 3 day period of lowest average temperature
vii) 3a Largest increase in maximum over previous day
viii) 3b Largest decrease in maximum over previous day
ix) 4a Day of highest solar radiation
x) 4b Day of lowest solar radiation
xi) 4c Day of highest solar in ‘summer’ months DJF
xii) 4d Day of lowest solar in ‘summer’ months DJF
xiii) 4e Day of highest solar in ‘winter’ months MJJ
xiv) 4f Day of lowest solar in ‘winter’ months MJJ
xv) 5a Hot Sticky Day – high temperature and humidity
xvi) 5b Windy cool day
xvii) 5c Windy hot day
These spread sheets are used to illustrate the extent of change the various design strategies produce in
internal temperatures under critical climatic conditions. They will be modified to report the extent of window
opening and ceiling fan usage and to show the impact of air movement on comfort.
1.3 CHENATH AND THE ACCURATE SUSTAINABILITY TOOL
The Chenath engine is used as the benchmark in all three of the accredited NatHERS software tools: AccuRate
Sustainability, BERSPro and FirstRate5. It is one of the best credentialed thermal simulation software tools in
the world. Chenath has passed the BESTEST protocol (CSIRO, 2005), which is used internationally to ensure
that thermal simulation tools correctly model heat flows, accurately predict energy loads (cooling and heating)
and can model ‘free running’ (i.e. no air conditioning) temperatures (see Section 3.5.3). BESTEST found
Chenath predictions were in the same range as the best house energy assessment programs in the world, such
as the USA’s Department of Energy’s ‘Energy Plus’ and the UK’s ‘ESP-r’ software engines.
AccuRate Sustainability (version 1.1.4.1) was the software tool used to determine the extent of modifications
required to achieve regulatory compliance and was the latest version available at the time of undertaking the
assessments. It should be noted at that time the BERSPro software had a bug which required all permanent
openings to be treated as ‘controlled openings’. This bug affected the zoning of house designs, where rooms
connected to a large permanent opening needed to be combined into one zone e.g. a kitchen and an adjacent
living area. However because air movement is critical to the performance of houses in hot climates, for this
study all analysis of air speed, affected temperatures and window openings were performed using a pre-
release version of the latest Chenath engine that addressed permanent opening. Consequently, the findings in
this report will not be able to be reproduced exactly with the current NatHERS tools that are now aligned.

4.2 Attachment D
4
The predicted temperatures modelled by Chenath have been compared to a range of real houses and test cells
in Australia, and have been found to replicate real temperature conditions very well. These comparisons with
reality were at the heart of software development by CSIRO. The initial algorithms were developed and tested
by constructing and monitoring a house on their Highett campus (Melbourne, Victoria) in the 1970’s. While the
testing and validation of the software engine to date generally means that the predictions of the engine should
be accurate, the real house tests have been conducted on only a limited range of designs, including a range of
three different designs in Darwin, but have not focussed specifically on house ventilation in tropical and hot
climates. This project therefore focuses on explaining how the Chenath engine employs ventilation for house
designs in these climates.

4.2 Attachment D
5
APPENDIX B: HOW THE CHENATH ENGINE MODELS THERMAL
COMFORT
The Chenath engine was upgraded in response to industry and jurisdictional concerns regarding the inability of
1st generation NatHERS software to appropriately model the impact of air movement on thermal comfort. It is
therefore important to explain the way Chenath models thermal comfort for 2nd generation NatHERS tools.
Houses are heated and cooled to maintain occupant comfort. Table 1 describes the various factors that can
influence occupant comfort and how Chenath models these factors:
Table 1 Effect of various factors on thermal comfort and how Chenath models these factors
Factor Effect on Comfort Modelled in Chenath
Air temperature Our bodies lose heat by contact
with the air
The Chenath engine predicts internal
air temperature
Temperature of surrounding objects,
or radiant temperature
If objects are warmer than us they
make us feel warmer
Chenath engine combines air
temperature and radiant temperature
into the ‘environmental temperature’
to better reflect human perception of
comfort
Amount of moisture in the air or
humidity
We lose heat by sweating. At higher
humidity levels the amount of heat
we can lose through the
evaporation of sweat is reduced.
However, a large range of humidity
provides adequate heat loss and
discomfort is generally only felt at
high humidity when combined with
higher air temperatures.
Chenath engine will turn on cooling if
the air becomes too humid, typically at
a humidity over 50% if the air is at 30
degrees. If there is air movement
provided by opening windows or
ceiling fans Chenath will not cool to
reduce humidity until the humidity
exceeds 90%.
Air movement With higher air speeds the body’s
ability to lose heat by evaporation
of sweat is increased
Chenath engine calculates the wind
speed through each room of the house
if windows are opened. It then
calculates the additional comfort this
air movement provides as a reduction
in perceived temperature. Effects of
ceiling fans are also allowed for.
Activity and clothing As the body is more active it
generates heat and the amount of
clothes affect the body’s ability to
lose heat by providing insulation
e.g. with appropriate clothing it can
feel hot while skiing at sub zero
temperatures.
Thermostat temperatures are set with
household activity levels and clothing
in mind. Bedroom heating
temperatures overnight are set to
lower levels because bedding provides
insulation and the lower metabolic
rate during sleep means a lower
temperature is comfortable.

4.2 Attachment D
6
Factor Effect on Comfort Modelled in Chenath
Personal preference Each body’s ability to lose or gain
heat from the environment is
different, and each person has a
preference for the rate of heat loss
to the environment they consider
comfortable. The ranges of
conditions which will keep most
people comfortable have been
evaluated in many studies.
Those temperatures which satisfy the
greatest proportion of people have
been used as thermostat settings.
These take into account adaptation to
climate as discussed below. Note that
cooling is switched on when it is 2.5
degrees above the thermostat setting
i.e. when it becomes uncomfortable.
Acclimatisation Simply put, if you live in a hot place
you will feel comfortable at higher
temperatures than a person who
lives in a cold place. This is thought
to be in part because people wear
lighter clothes in warmer climates
and in part human adaptation.
Cooling thermostat temperatures are
set according to the comfort
conditions relevant to the climate. This
is based on Australian studies of
acclimatisation.
Figure 1 Occupant comfort with humidity and temperature
The range of temperatures and humidity’s that will produce thermal comfort can also be shown on a
psychrometric chart, as shown in Figure 1. This chart plots temperature on the horizontal axis against the
moisture content of the air on the vertical axis. The ability of air to hold moisture depends on its temperature.
Warmer air can contain much higher levels of moisture than cold air. Once the moisture content gets high
enough it starts to rain, so there is an upper limit on how much moisture air at a certain temperature can
contain. Because of this phenomenon there is a curved line on the psychrometric chart that indicates the
maximum moisture content of air for that temperature. This is also known as the saturation line.
Section 2.2. explains how the Chenath engine responds to humidity in more detail.
4.2 Attachment D
7
1.4 FACTORS AFFECTING INTERNAL AIR MOVEMENT
Air movement can allow people to tolerate higher temperature and humidity with less discomfort. Houses
which can promote better air movement through windows and other openings, as well as fans, will be able to
reduce the amount of time where air conditioning is needed to provide comfort.
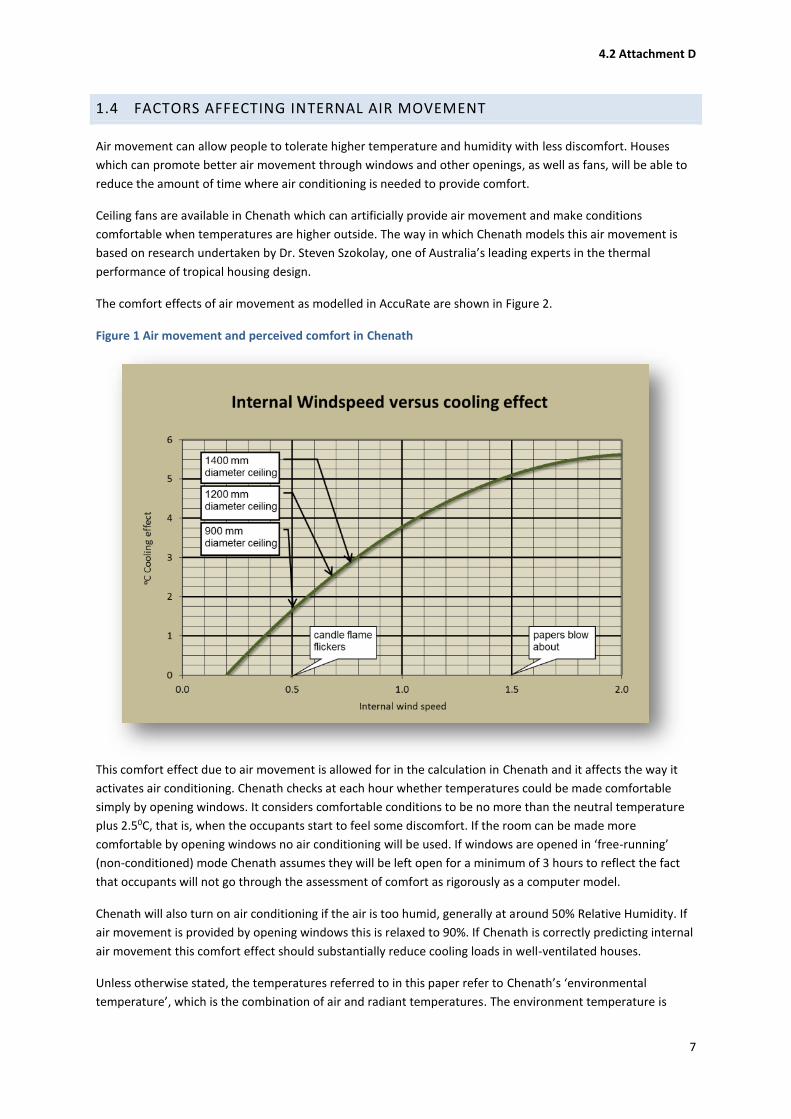
Ceiling fans are available in Chenath which can artificially provide air movement and make conditions
comfortable when temperatures are higher outside. The way in which Chenath models this air movement is
based on research undertaken by Dr. Steven Szokolay, one of Australia’s leading experts in the thermal
performance of tropical housing design.
The comfort effects of air movement as modelled in AccuRate are shown in Figure 2.
Figure 1 Air movement and perceived comfort in Chenath
This comfort effect due to air movement is allowed for in the calculation in Chenath and it affects the way it
activates air conditioning. Chenath checks at each hour whether temperatures could be made comfortable
simply by opening windows. It considers comfortable conditions to be no more than the neutral temperature
plus 2.50C, that is, when the occupants start to feel some discomfort. If the room can be made more
comfortable by opening windows no air conditioning will be used. If windows are opened in ‘free-running’
(non-conditioned) mode Chenath assumes they will be left open for a minimum of 3 hours to reflect the fact
that occupants will not go through the assessment of comfort as rigorously as a computer model.
Chenath will also turn on air conditioning if the air is too humid, generally at around 50% Relative Humidity. If
air movement is provided by opening windows this is relaxed to 90%. If Chenath is correctly predicting internal
air movement this comfort effect should substantially reduce cooling loads in well-ventilated houses.
Unless otherwise stated, the temperatures referred to in this paper refer to Chenath’s ‘environmental
temperature’, which is the combination of air and radiant temperatures. The environment temperature is

4.2 Attachment D
8
reduced by the perceived temperature benefit as a result of air movement. The extent of the improvement in
occupant comfort will depend on the effectiveness of the design in generating potential internal air
movement. This can depend on several factors, as shown in Table 2.
Table 2 Factors influencing air movement through houses and how these are modelled by Chenath
1.4.1 CEILING FANS
Ceiling fans are assumed to provide air speeds and comfort effects as shown in Table 3:
Table 3 Impact of ceiling fans assumed by Chenath when directly below the fan
Fan size
(mm)
Air speed
(m/second)
Comfort effect
(0C)
900 0.5 1.7
1200 0.66 2.4
1400 0.77 2.9
The air speed is assumed to be fully effective over twice the swept area of the fan. If a room is larger than this
area, the impact of the ceiling fan is reduced according to the proportion of the room area and the effective
swept area of the fan. Table 4 shows how the comfort effect of a fan varies with room area and number of
fans.
Table 4 Impact of ceiling fan size and number of fans on comfort in rooms of various sizes
Factor Influence on air movement
Direction and Speed of external wind The higher the external wind speed the higher the internal wind speed if
the house has openings facing the wind. If openings are also on the
opposite side internal air speeds are higher.
Location and size of openings Larger openings generally allow greater air movement, however, the
distribution around the building also has an effect.
Smaller openings on the side facing the wind and larger openings on the
opposite side will promote greater air movement. Openings only on
adjacent sides will generally provide less cross ventilation.
The nature of the opening e.g. awning vs sliding vs casement, determines
the net openable area. For example, the opened sash in an awning
window blocks some air flow. This is modelled by Chenath.
Ventilation path through the building Each time the wind goes through an opening before exiting the house the
internal wind speed is reduced. Houses which are 1 room deep facing the
prevailing cooling wind will have higher internal wind speeds than houses
with complex plans. Houses with larger openings between rooms will
allow greater air movement. This is modelled by Chenath.
4.2 Attachment D
9
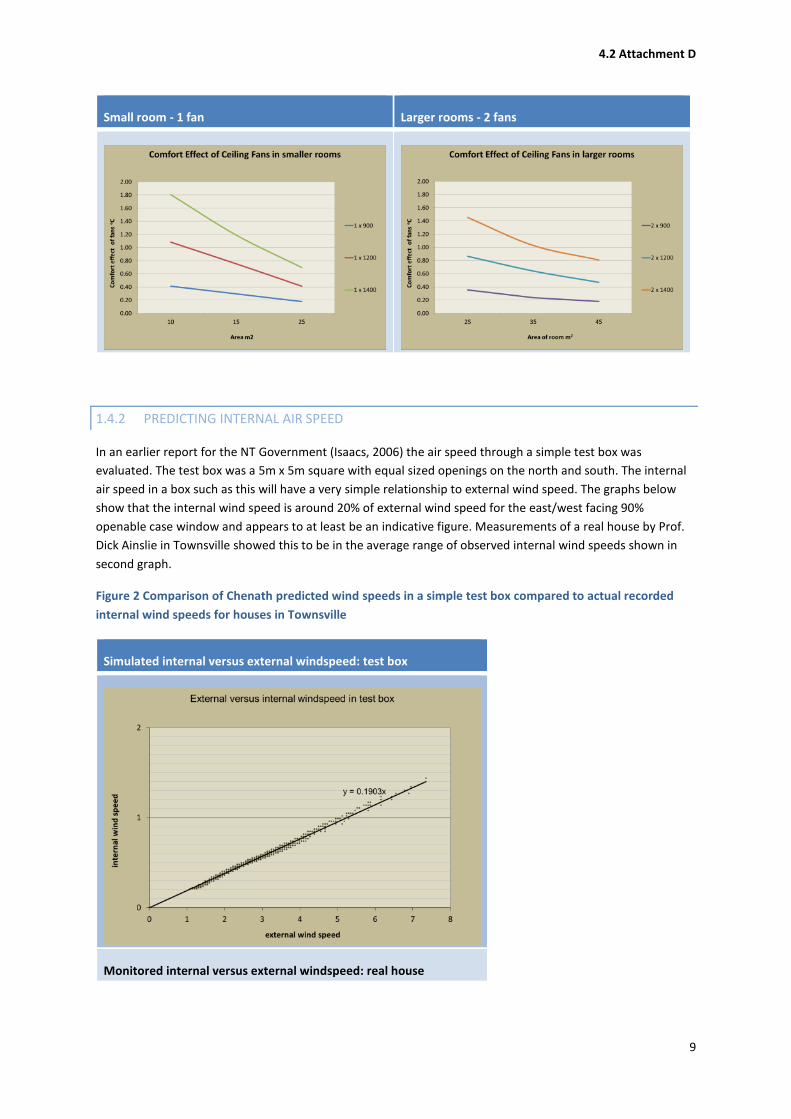
Small room - 1 fan Larger rooms - 2 fans
1.4.2 PREDICTING INTERNAL AIR SPEED
In an earlier report for the NT Government (Isaacs, 2006) the air speed through a simple test box was
evaluated. The test box was a 5m x 5m square with equal sized openings on the north and south. The internal
air speed in a box such as this will have a very simple relationship to external wind speed. The graphs below
show that the internal wind speed is around 20% of external wind speed for the east/west facing 90%
openable case window and appears to at least be an indicative figure. Measurements of a real house by Prof.
Dick Ainslie in Townsville showed this to be in the average range of observed internal wind speeds shown in
second graph.
Figure 2 Comparison of Chenath predicted wind speeds in a simple test box compared to actual recorded
internal wind speeds for houses in Townsville
Simulated internal versus external windspeed: test box
Monitored internal versus external windspeed: real house

4.2 Attachment D
10
Source: NT Government report by Isaacs and personal communication Angelo Delsante CSIRO
1.5 CHENATH SPACE CONDITIONING PROCEDURE
The following section is based on the AccuRate Sustainability help file.
In zones designed as 'Living', 'Living/Kitchen', and 'Other', heating and cooling are available from 0700 to 2400.
In zones designed as 'Bedroom', heating and cooling are available from 1600 to 0900. Although heating and
cooling are available between these times, they are not invoked unless required, as described below.
Heating is applied if the zone temperature at the end of the hour without heating is below the prescribed
heating thermostat setting in Chenath. Additional heating is supplied so that the temperature for the
particular zone at the end of the hour equals the thermostat setting.
Cooling is invoked in a more complicated way. The boundaries of the comfort region on the psychrometric
chart are shown in

4.2 Attachment D
11

4.2 Attachment D
12
Figure 4 Chenath comfort zone with and without air movement
The psychrometric chart shows that when air movement is provided the range of conditions that can be
considered comfortable increases significantly i.e. the expanded blue area (and the red area is for no air
movement). This allows not only higher temperatures to be tolerated but also much higher humidity to be
tolerated as well.
Guide to figure
Top Absolute moisture content = 12 g/kg
Bottom Absolute moisture content = 0 g/kg (normally it is 4 g/kg but Chenath will not invoke cooling
merely because the air is too dry)
Right Effective air temperature allowing for air movement (ET*) line passing through the point
corresponding to (Cooling Thermostat + 2.5) degrees and 50% relative humidity (RH)
Left Not relevant
Notes
1. If at the end of the hour the zone temperature without cooling or ventilation is greater than a trigger
temperature and greater than the outdoor air temperature –4oC, ventilation is switched on (i.e. windows
and other controlled openings in this zone are opened). The trigger temperature is generally 0.5oC below
the cooling thermostat temperature, but with an upper limit of 26°C.
2. The new zone condition (i.e. temperature and moisture content) is calculated and an indoor air speed is
estimated. If the indoor air speed is above 0.2 m/s, the comfort region described above is extended in
Expanded comfort regionExpanded comfort region
(at 1.0 m/s air speed)

4.2 Attachment D
13
two ways:
i. the top boundary becomes the 90% RH line, and
ii. the right boundary becomes an ET* line passing through the point corresponding to (Cooling
Thermostat + 2.5 + dT) and 50% RH, where:
- dT (Impact of temperature of air movement) = 6 x (v - 0.2) - 1.6 x (v - 0.2)², and
- v is the indoor air speed (m/s). An upper limit of 1.5 m/s is imposed on the indoor air speed.
If the zone condition with natural ventilation is within the extended comfort region, cooling is not
invoked.
3. If the zone condition with natural ventilation remains outside the extended comfort region, and ceiling
fans are available in that zone, the indoor air speed calculated from natural ventilation is replaced by an
indoor air speed appropriate to the number of fans and zone floor area (based on the cooling benefit of
the ceiling fans). If the zone condition with ceiling fans and natural ventilation is within the extended
comfort region, cooling is not invoked.
4. If the zone condition with ceiling fans and natural ventilation is still outside the extended comfort region,
the zone openings are closed, ceiling fans (if any) are switched off, and sufficient cooling is applied so that
the zone temperature at the end of the hour is the cooling thermostat setting.
Note that the cooling calculations include a generic model of a residential air conditioner cooling coil, so that
dehumidification occurs when cooling is invoked i.e. moisture condensing due to the cooling of the air. The
energy extracted from the air to reduce its humidity is reported as the latent cooling energy.

4.2 Attachment D
14
APPENDIX C: WIND SPEED AND DIRECTION ANALYSIS FOR SELECTED
CLIMATES
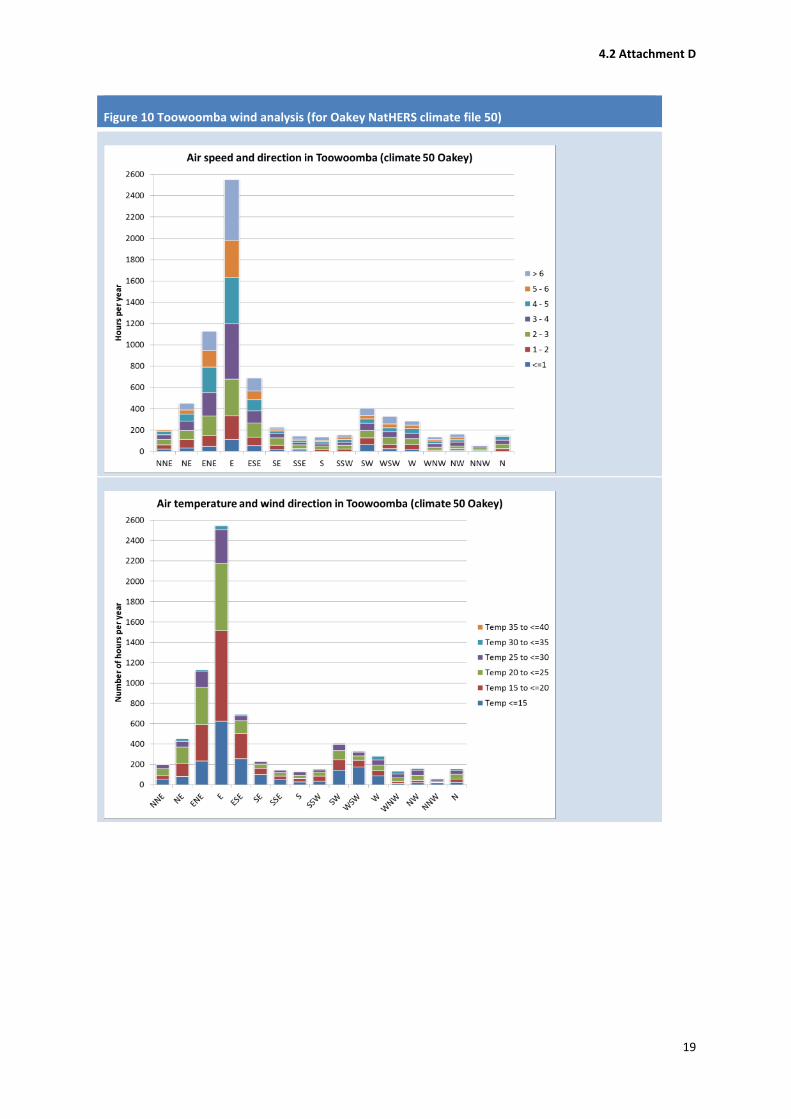
Wind directions which have both wind speeds >3 m/s (measured at weather station – may be as low as 1 m/s
through house) and temperatures between 20 and 30oC will provide the best cross ventilation and should have
windows with the largest openable areas on this orientation.
The wind speeds and directions for the locations used in this study are shown in Figure 5 to 10.
Figure 5 Darwin wind analysis (NatHERS climate file 1)

4.2 Attachment D
15
Figure 6 Townsville wind analysis (NatHERS climate file 5)

4.2 Attachment D
16
Figure 7 Brisbane wind analysis (NatHERS climate file 10)

4.2 Attachment D
17
Figure 8 Alice Springs wind analysis (NatHERS climate file 6)

4.2 Attachment D
18
Figure 9 Emerald wind analysis (for Charleville NatHERS climate file 19)
4.2 Attachment D
19
Figure 10 Toowoomba wind analysis (for Oakey NatHERS climate file 50)
4.2 Attachment D
20
APPENDIX D: HOUSE SELECTION & ASPECTS OF METHODOLOGY
1.5.1 STANDARD HOUSES
Two house designs were selected to be typical of market-led housing in Northern Australian climates. The
houses were selected to:
Be typical of spec house designs being constructed throughout the climate zones evaluated. Both
houses are built in reasonable volume by the housing companies who provided the designs. Similar
houses can be seen in the portfolio of most of the volume housing suppliers who operate in these
climates.
Provide a range of typical house sizes: a smaller single-storey 4 bedroom house and a larger two-
storey 4 bedroom house were selected. The use of a two-storey house design is particularly important
to evaluate as upper floor bedrooms may not perform very well and two-storey construction is being
used increasingly in these regions.
Be as different to the traditional climatic design as possible. The standard houses use slab floors, are
not particularly well designed to promote cross ventilation, provide minimal fixed shading and use
small sliding or awning windows.

4.2 Attachment D
21
1.5.2 HENLEY LUNA 4
Cross ventilation paths (from one external side of the house to the other) are long and must pass through one
or more openings. Only the Living/Kitchen area has openings on more than one side.
4.2 Attachment D
22
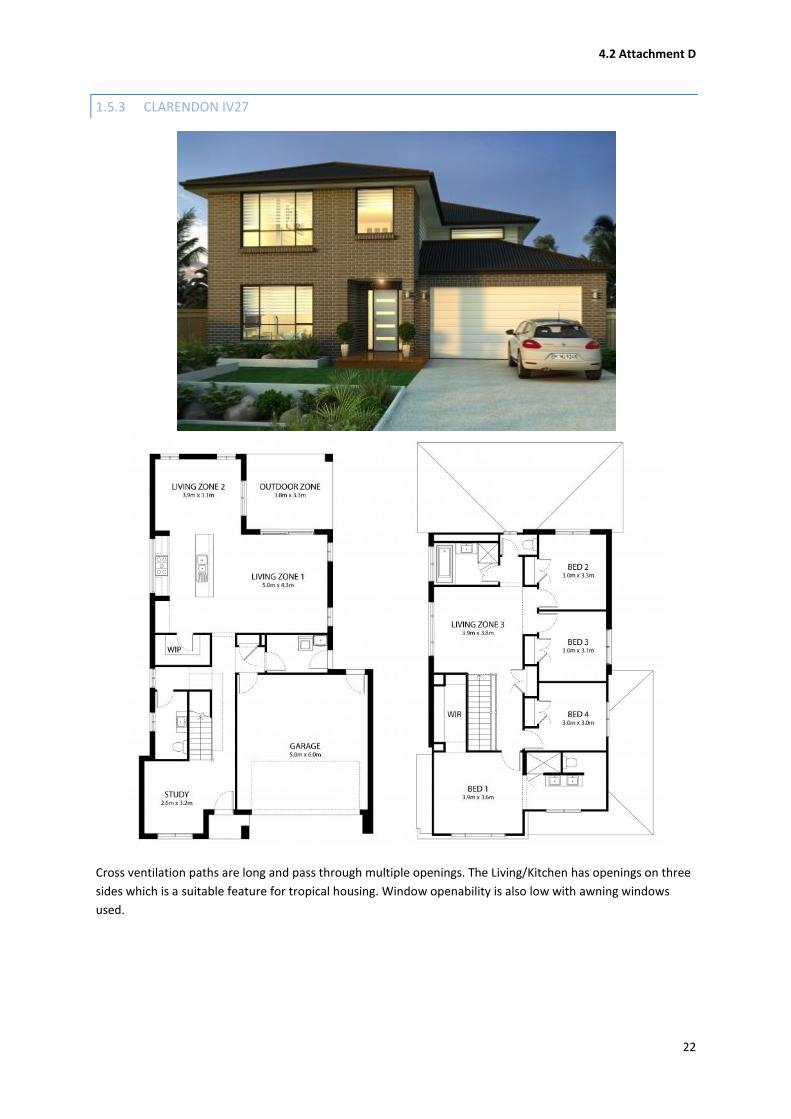
1.5.3 CLARENDON IV27
Cross ventilation paths are long and pass through multiple openings. The Living/Kitchen has openings on three
sides which is a suitable feature for tropical housing. Window openability is also low with awning windows
used.

4.2 Attachment D
23
1.5.4 REGULATORY COMPLIANCE OPTIONS ASSESSED
Each house was assessed and rated to achieve the minimum required level on 4 orientations in each of the 6
reference locations in northern Australia. The techniques used to achieve compliance focused on the market-
led techniques for housing design:
1. Reducing heat flows through walls and ceilings by using high levels of insulation rather than light
colours and shading,
2. Providing air movement with ceiling fans rather than promoting cross ventilation, and
3. Reducing solar gains from windows by using smaller windows with lower solar heat gain coefficients
rather than using shade by verandahs and external screens.
In addition, it was assumed that houses have ceiling fans in all living areas and bedrooms. ABS 2008 found that
in Queensland 66.1% of houses had ceiling fans (73.2% outside the mild Brisbane climate) and 86.3% of houses
in the NT had ceiling fans. 60% of houses in Darwin had between 5 to 8 ceiling fans, and a further 27% had
more than 8 ceiling fans (ABS, 2008). The use of ceiling fans has a substantial benefit in terms of the software
star rating and it is generally cheaper to install fans than to make modifications to the building fabric in tropical
climates. The use of ceiling fans can lower the cost of compliance which means that it is sensible to assume
that houses in hot climates will typically install them.
1.5.4.1 USE OF OUTDOOR LIVING AREAS
In NCC climates 1 and 2 (Darwin, Townsville and Brisbane in this study) a 5 star rating for the building shell is
allowed where it includes a compliant outdoor living area with ceiling fan. An optional credit of 1 star is
available for an outdoor living area under 3.12.0.1 (a)with a Class 1 building in climate zones 1 or 2. The
outdoor living area:
(A) is fully covered with an impervious roof having a Total R-Value of at least 1.5 (for downward heat
flow); and
(B) has at least one permanently installed ceiling fan.
The outdoor living area must also be designed to meet the following criteria:
(i) is directly adjoining, and directly accessible from, a general purpose living area of a Class 1 building
such as a lounge, kitchen, dining or family room, which is not a room for sleeping or specialist tasks
such as a study or home theatre; and
(ii) has a floor area of not less than 12.0 m2; and
(iii) has length and width dimensions of not less than 2.5 m each; and
(iv) has an opening height above floor level of not less than 2.1 m; and
(v) has one side permanently open with a second side either—
(A) permanently open; or
(B) readily openable.
The outdoor living area in each of the two designs selected for this study meet these requirements, and it was
therefore assumed that the ceiling of the outdoor living area is insulated and that a ceiling fan was provided to
gain the optional credit.
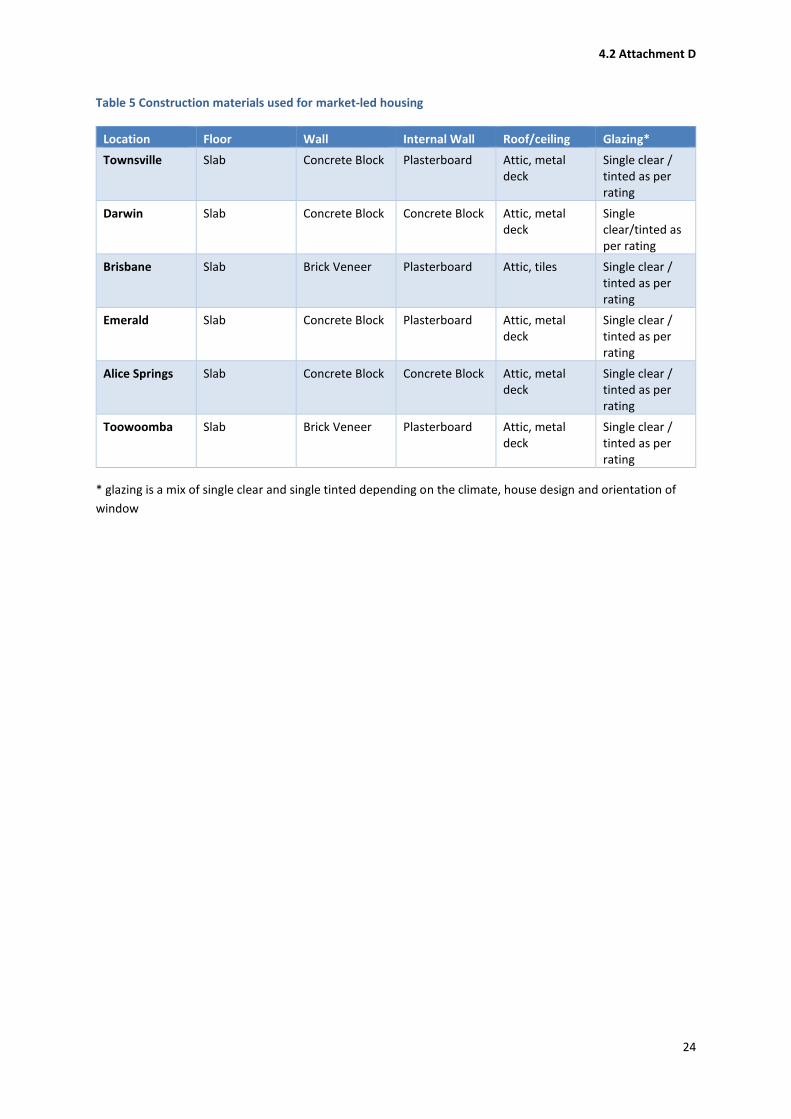
1.5.5 CONSTRUCTION MATERIALS
The house designs were assessed with the most common construction materials used in each location:
4.2 Attachment D
24
Table 5 Construction materials used for market-led housing
Location Floor Wall Internal Wall Roof/ceiling Glazing*
Townsville Slab Concrete Block Plasterboard Attic, metal deck
Single clear / tinted as per rating
Darwin Slab Concrete Block Concrete Block Attic, metal deck
Single clear/tinted as per rating
Brisbane Slab Brick Veneer Plasterboard Attic, tiles Single clear / tinted as per rating
Emerald Slab Concrete Block Plasterboard Attic, metal deck
Single clear / tinted as per rating
Alice Springs Slab Concrete Block Concrete Block Attic, metal deck
Single clear / tinted as per rating
Toowoomba Slab Brick Veneer Plasterboard Attic, metal deck
Single clear / tinted as per rating
* glazing is a mix of single clear and single tinted depending on the climate, house design and orientation of
window
4.2 Attachment D
25
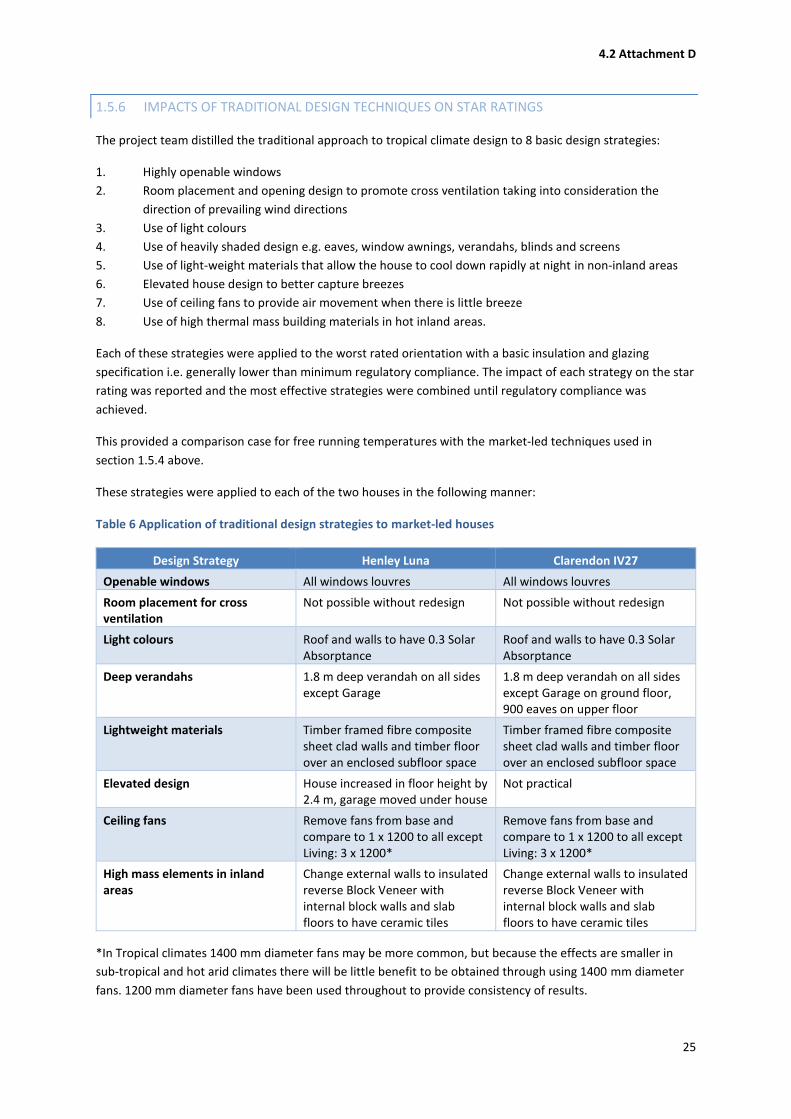
1.5.6 IMPACTS OF TRADITIONAL DESIGN TECHNIQUES ON STAR RATINGS
The project team distilled the traditional approach to tropical climate design to 8 basic design strategies:
1. Highly openable windows
2. Room placement and opening design to promote cross ventilation taking into consideration the
direction of prevailing wind directions
3. Use of light colours
4. Use of heavily shaded design e.g. eaves, window awnings, verandahs, blinds and screens
5. Use of light-weight materials that allow the house to cool down rapidly at night in non-inland areas
6. Elevated house design to better capture breezes
7. Use of ceiling fans to provide air movement when there is little breeze
8. Use of high thermal mass building materials in hot inland areas.
Each of these strategies were applied to the worst rated orientation with a basic insulation and glazing
specification i.e. generally lower than minimum regulatory compliance. The impact of each strategy on the star
rating was reported and the most effective strategies were combined until regulatory compliance was
achieved.
This provided a comparison case for free running temperatures with the market-led techniques used in
section 1.5.4 above.
These strategies were applied to each of the two houses in the following manner:
Table 6 Application of traditional design strategies to market-led houses
Design Strategy Henley Luna Clarendon IV27
Openable windows All windows louvres All windows louvres
Room placement for cross ventilation
Not possible without redesign Not possible without redesign
Light colours Roof and walls to have 0.3 Solar Absorptance
Roof and walls to have 0.3 Solar Absorptance
Deep verandahs 1.8 m deep verandah on all sides except Garage
1.8 m deep verandah on all sides except Garage on ground floor, 900 eaves on upper floor
Lightweight materials Timber framed fibre composite sheet clad walls and timber floor over an enclosed subfloor space
Timber framed fibre composite sheet clad walls and timber floor over an enclosed subfloor space
Elevated design House increased in floor height by 2.4 m, garage moved under house
Not practical
Ceiling fans Remove fans from base and compare to 1 x 1200 to all except Living: 3 x 1200*
Remove fans from base and compare to 1 x 1200 to all except Living: 3 x 1200*
High mass elements in inland areas
Change external walls to insulated reverse Block Veneer with internal block walls and slab floors to have ceramic tiles
Change external walls to insulated reverse Block Veneer with internal block walls and slab floors to have ceramic tiles
*In Tropical climates 1400 mm diameter fans may be more common, but because the effects are smaller in
sub-tropical and hot arid climates there will be little benefit to be obtained through using 1400 mm diameter
fans. 1200 mm diameter fans have been used throughout to provide consistency of results.

4.2 Attachment D
26
1.6 TRADITIONAL HOT CLIMATE HOUSE SELECTION
Demonstrating how climatically appropriate design strategies may benefit volume market-led housing design
is important to show that the traditional techniques are appropriately assessed by software. However, an
assumption used for this study is that the benefits of these techniques may be much greater in houses which
facilitate cross ventilation through good window design and room placement. To investigate this theory, one
house design which demonstrated traditional hot climate design strategies was assessed in each of the four
climate zones (Tropical, Sub Tropical, Warm Temperate and Hot Arid).
Each house was optimised to achieve minimum regulatory compliance in the two climate zones which it was
designed for. Because some of the houses were designed prior to the current regulatory requirement of 6-
stars some significant modifications were required. However, changes were undertaken with a view to
maintaining as many of the core design features as possible.
1.6.1 C19 STYLE HOUSE
This design was developed by Tony Isaacs based on the C19 public housing unit design. It is an elevated design
similar to the government public housing design known as the C19. This house has often been held up as a
model of good tropical design. In the C19 Style house each room has windows on two sides to facilitate cross
ventilation and the design uses deep eaves, verandahs and screens to provide shade.
This house was selected because of its classic cross ventilation design. The house is only one room deep so air
movement is not slowed because it has to pass through internal openings in other rooms. While bedrooms
open directly to the hall, windows in the hall are only a metre away and are directly adjacent with the
bedroom doors.

4.2 Attachment D
27
View from north
Upper Level Plan
Lower Level Plan

4.2 Attachment D
28
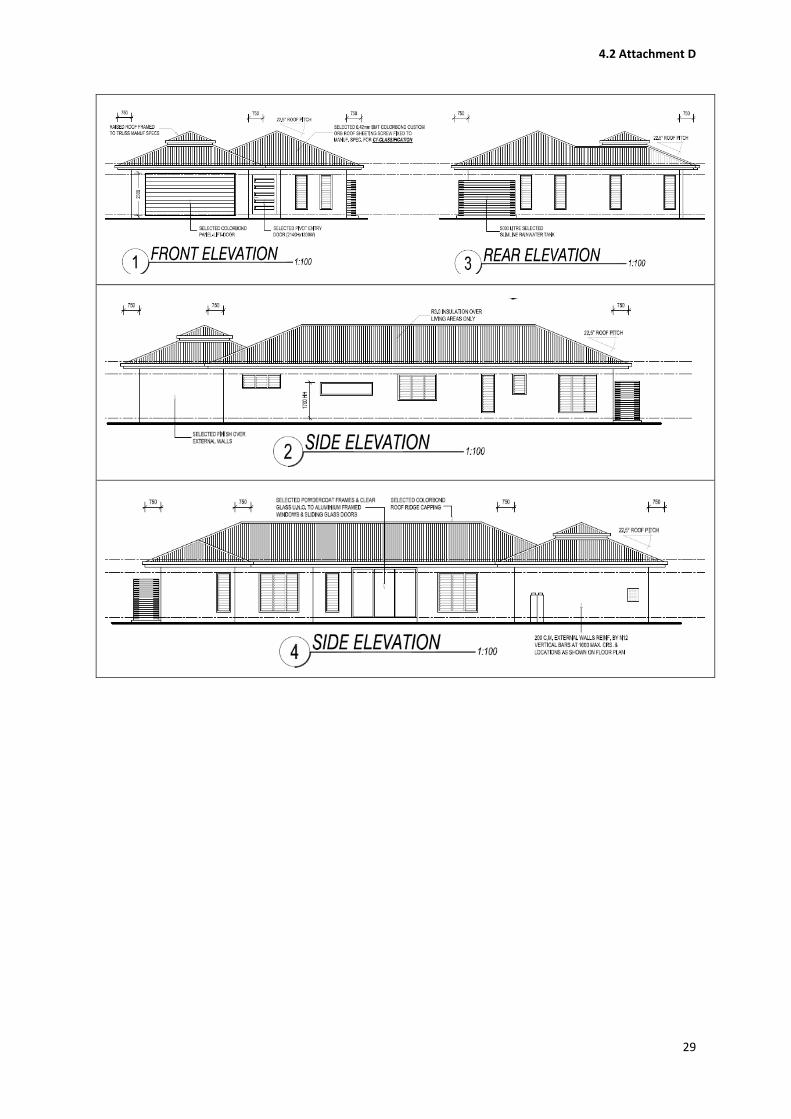
1.6.2 REDLYNCH HOUSE
The design for Redlynch House gained a very high NatHERS star rating in its location of Cairns. It uses louvre
windows, has an outdoor living area and has reasonable cross ventilation to most rooms. This house is an
example of ‘hybrid design’ as it combines features of both energy efficient and free running design. It was
selected to provide an interesting contrast to the more traditional tropical design.
It obtained a rating in excess of 9 stars when assessed in the tropical climate zone, where it was originally
designed for. For Darwin it gained a 7 star rating and in Townsville it was 8 stars. It has a larger area of
windows than usually seen in market-led housing, including highly openable and heavily tinted louvres. Hard
floor surfaces are used throughout to maximise the benefits of the slab floor during the day. All but one room
has windows on two sides to promote cross ventilation. It also has an extensive outdoor living area adjacent to
the main living area and bedroom (identified as ‘patio’ in the drawing below).
While this house is not strictly a traditional hot climate well ventilated design it is closer to the traditional
design than the market-led housing, except that it uses high mass floor and wall materials. It will provide an
interesting contrast to both the traditional and market-led housing, particularly in terms of free running
performance.
Note that the house is not oriented ideally to the north, resulting in the longer sides facing east and west
instead of north and south. This reflects the positioning of the house as built on the property. In its actual
location the house received some beneficial shading by adjacent structures to the west, while the covered
patio provided significant shade on the eastern side. It responded to the less than ideal orientation by using
heavily tinted glazing and external blinds on the western side.
For the purposes of this study, at a 5 star level the kitchen and living areas were re-orientated to the south so
that the design almost achieved 6 stars and then was de-specified down to the 5 stars regulatory compliant
version.
4.2 Attachment D
29

4.2 Attachment D
30
1.6.3 SUB-TROPICAL AND WARM TEMPERATE HOUSE DESIGN: INNOVATION HOUSE (BRISBANE
AND TOOWOOMBA)
This house was constructed on the Gold Coast as a display home by the developer and Gold Coast City Council
about the benefits of good design and innovative technologies for the residential sector. It included well
ventilated sub-tropical design.
As it was designed in 2004 and constructed in 2005, it was not required to meet the current minimum
regulatory rating requirement of 6-stars.

4.2 Attachment D
31
This design for Brisbane received a little under 3 stars. While it performed very well in summer, the large areas
of well shaded glass increased heating requirements significantly for winter, and this is the principle reason for
the low rating.
Note that part of the house was constructed on a timber floor due to the slope of land on the block at the Gold
Coast. For this project the whole house was assumed to be constructed on a slab and this was a better test of
the design concept.

4.2 Attachment D
32
1.6.4 HOT ARID HOUSE DESIGN: SHAYNE’S HOUSE (ALICE SPRINGS AND EMERALD)
This house was designed by Build-Up Designs in the Northern Territory and was used by the Northern Territory
Government as an example of good hot arid housing for a research project in 2006 (Isaacs, 2006). It has a
classic passive solar plan form and uses deep verandahs to provide shade.
While this house was designed before the introduction of minimum regulatory requirements in the Northern
Territory, it achieved a 5 star rating. The house has a large glass area, however, all windows were double
glazed. Because double glazing is rarely used in Alice Springs, for this study a single glazed version was
developed with a reduced glass area.
North
South

4.2 Attachment D
33
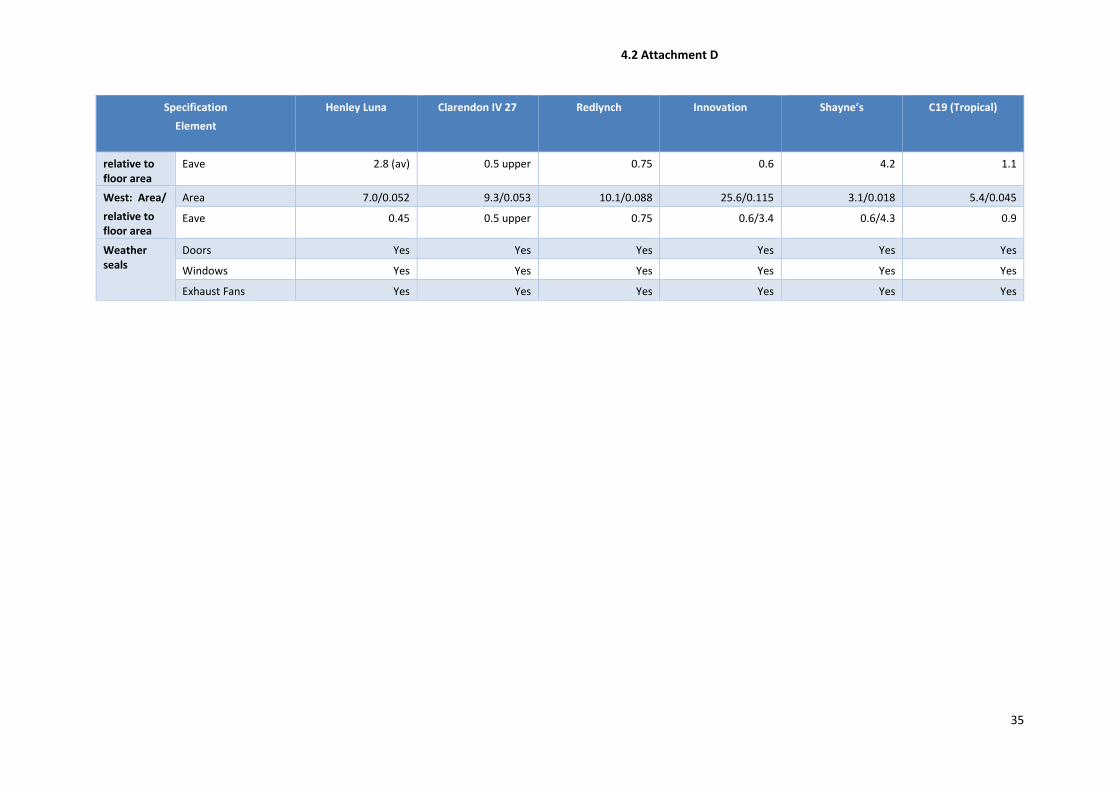
1.7 COMPARISON OF HOUSE DESIGN FEATURES
Table 7 shows the key design and construction features of each of the houses used in this study.
Table 7 Construction and areas of key design features of the houses
Specification
Element
Henley Luna Clarendon IV 27 Redlynch Innovation Shayne’s C19 (Tropical)
Floor area:
Note: Figures after the ‘/’ indicate the size of this element relative to the total floor area of the house
Total (excl garage) 133.5 m2 174.7 m2 115.4 m2 222.8 m2 170.6 m2 120.3 m2
Net Conditioned Floor Area (NCFA)
121.7/0.912 140.0/0.802 103.1/0.893 184.4/0.828 150.2/0.88 99.9/0.83
Hard floor 59.2/0.443 22.7/0.13 115.4/1 22.1/0.099 100.2/0.587 29.2/0.243
Hard floor in Rooms Kit/Din/Liv & wet areas
Kitchen + wet areas All Wet areas (timber on slab not counted)
Only bedrooms carpeted
Lower floor on uncovered slab
Lower Level area 1 133.5 84.5 115.4 152.9 (slab) 170.6 29.2
Lower Level area 2 NA 0 0 65.3 (timber) 0 NA
Upper Level area NA 90.15 NA NA 0 91.1
Conditioned day/proportion house day cond.
72/0.539 100.3/0.574 63.14/0.547 123.97/0.556 92.8/0.544 51/0.424
Conditioned Night 47.8/0.358 49.95/0.286 39.96/0.346 60.43/0.271 52.2/0.306 48.9/0.406
Unconditioned * excl. 13.7/0.103 24.4/0.14 12.33/0.107 33.71/0.151 25.6/0.15 20.4/0.17
External Wall:
Area
relative to floor area
Type As per climate As per climate Concrete block Framed, polystyrene clad
Framed, metal clad Framed, metal clad, concrete block on
lower floor
Area 122.79/0.92 193.76/1.109 167.11/1.448 243.97/1.095 204.75/1.2 258.68/2.15
Internal Wall:
Area/
Type 0 0 0 0 0 0
Area 139.3/1.043 146.98/0.842 108.73/0.942 161.51/0.725 145.32/0.852 62.1/5.8/0.56

4.2 Attachment D
34
Specification
Element
Henley Luna Clarendon IV 27 Redlynch Innovation Shayne’s C19 (Tropical)
relative to floor area
Internal wall to garage:
Area/relative to floor area
Type Plasterboard Plasterboard Concrete Block Plasterboard NA NA
Area 21.18/0.159 26.16/0.15 9.84/0.085 25.56/0.115 NA NA
Ceiling Type Plasterboard Plasterboard Plasterboard NA NA NA
Attic Yes Yes Yes Yes Yes/Cathedral ceiling over living areas
Yes/Cathedral ceiling over living areas
No
Roof ventilators No No No No No NA
Roof Type As per climate Zone As per climate Zone Metal Metal Metal Metal
Surface Area 166.6 (incl. garage) 185.6 261.8 261.2 172 97.7
Ceiling Fans Number 7 9 6 5 3 6
Location Bed & Living rooms 0 Bed & Living rooms Media & bedrooms Liv/Din/Kit All living/bed rooms
Windows: Area/
relative to floor area
Total area 32.1/0.24 40.19/0.23 44.44/0.385 117.02/0.525 75.77/0.444 68.86/0.572
Type Aluminium frame single glazed sliding
Aluminium frame single glazed sliding
Aluminium frame single glazed louvre
Aluminium frame single glazed sliding
Timber frame single glazed sliding/awning
Aluminium frame single glazed louvre
Living Area 22.1/0.166 24.58/0.141 23.29/0.202 85.5/0.384 43.84/0.257 32.47/0.27
Bedrooms Area 7.9/0.059 8.15/0.047 18.21/0.158 20.13/0.09 28.19/0.165 36.47/0.303
Unconditioned 2.1/0.016 7.46/0.043 2.94/0.025 11.39/0.051 3.7/0.022 4.1/0.034
North: Area/
relative to floor area
Area 4.8/0.036 10.2/0.058 9.2/0.08 41.9/0.188 56.4/0.331 37.5/0.312
Eave 0.45 0.5 upper 3.5 lower outdoor room
0.75 0.6/3.2 3 1.1/3.2
East: Area/
relative to floor area
Area 10.2/0.076 12.2/0.07 15.9/0.138 8.0/0.036 4.8/0.028 2.9/0.024
Eave 0.45 0.5 upper 4.0 lower outdoor room
0.75+OOA 0.6 0.9 0.9
South: Area/ Area 10.1/0.076 8.6/0.049 9.2/0.08 41.5/0.186 11.4/0.067 23.0/0.192
4.2 Attachment D
35
Specification
Element
Henley Luna Clarendon IV 27 Redlynch Innovation Shayne’s C19 (Tropical)
relative to floor area
Eave 2.8 (av) 0.5 upper 0.75 0.6 4.2 1.1
West: Area/
relative to floor area
Area 7.0/0.052 9.3/0.053 10.1/0.088 25.6/0.115 3.1/0.018 5.4/0.045
Eave 0.45 0.5 upper 0.75 0.6/3.4 0.6/4.3 0.9
Weather seals
Doors Yes Yes Yes Yes Yes Yes
Windows Yes Yes Yes Yes Yes Yes
Exhaust Fans Yes Yes Yes Yes Yes Yes
4.2 Attachment D
36
The most striking differences in the houses which use traditional well ventilated/passive solar design principles
and the market-led houses are in the wall and window areas. The window areas for the market-led houses are
on average around half the window area per square metre of floor area of the traditional designs. Further, the
traditional designs have much higher wall areas at an average of around 40% more wall area per square metre
of floor area. The traditional designs also concentrate a much higher proportion of window area on the north
and south than the market-led designs which have a fairly random window orientation. Deeper shading is
more prevalent with the traditional designs than the market-led designs and they have light weight walls in all
climates.
1.8 EVALUATION OF BEDROOM PERFORMANCE AND ALTERNATIVE USER
BEHAVIOUR
The performance of bedrooms at night in summer has been found to be critical aspect of the thermal
performance of housing by several studies (e.g. NEEHA, 1991). Studies have shown households in hot climates
use air conditioning in bedrooms more frequently than living rooms despite the fact that night time
temperatures are cooler than daytime. This makes intuitive sense as occupants can tolerate discomfort during
the day, but discomfort during the night may mean going without or disturbed sleep.
For this study the energy loads in bedrooms and living rooms were reported separately. This facilitated
analysis of how well bedroom performance correlated with the software assessment.
In 2006, the Northern Territory House Energy Rating Industry Reference Group (HER IRG) undertook a study of
the impacts of compliance with NatHERS at 5 stars (Isaacs, 2006). This study showed that bedroom energy use
represented between 18 and 23 per cent of the total predicted cooling loads of houses in Darwin and that
houses constructed with concrete block walls had superior ratings to houses constructed with lightweight
walls. This study also showed that free running temperatures in houses with concrete block walls remained at
higher temperatures overnight, even when they had higher star ratings than the houses with lightweight
construction.
Houses with concrete blockwork as their external walls often receive higher star ratings than houses with light
weight walls. Isaacs (2006) found that the advantage of blockwork wall construction in terms of energy rating
occurs during the day. This is because blockwork walls absorb heat during the day and lower the required
cooling load at that time, but given the thermal lag effect of stored heat being re-released into the evening and
night time it results in higher cooling loads. This caused concerns that the software was not delivering optimal
outcomes for housing in tropical climates:
The HER ERG is concerned that, with the current AccuRate occupancy profiles and settings, this mid-day
advantage of blockwork is having a disproportionately large effect on houses' relative final star ratings.
It is thought that blockwork housing is generally rating better than it should compared to lightweight
housing. (Kieboom, 2007)
The market research of Northern Territory households found that when bedrooms are occupied during the
wet season (October to April), air conditioning is generally turned on. By contrast, even when living areas are
occupied a significant proportion of households do not use air conditioning. Table 8 shows the occupancy and
use of air conditioning for the main living room and bedroom 1 on weekends during the wet season for
households in the Northern Territory:
Table 8 Occupancy and use of air-conditioning on weekends during the wet season in the living room and
bedroom 1 for Northern Territory households

4.2 Attachment D
37
Living Room Bedroom 1
Period Occupied
(%)
Air Con on
(%)
% occupied time with
AC
Occupied
(%)
Air Con on
(%)
% occupied time with
AC
12mn - 6am 10 4 40 96 67 70
6am - 9am 85 18 21 53 30 57
9am - 12md 85 18 21 7 5 71
12md - 3pm 84 31 37 11 9 82
3pm - 6pm 86 40 47 9 4 44
6pm - 9pm 93 45 48 12 14 117
9pm - 12mn 71 33 46 79 61 77
Average 37 74
On average the living room is only conditioned for 37 per cent of occupied time, while Bedroom 1 is air
conditioned for 74 per cent of the time it is occupied. In the living room households preferred to keep cool by
using ceiling fans and opening windows far more often than they did in bedrooms. This is consistent with the
theory of human comfort as it is more difficult to maintain comfort while sleeping because half of the body is
insulated by bedding.
The market research also asked households which temperature was used for their air conditioning thermostat.
As would be expected – human perception of comfort varies widely between individuals. Responses varied
from below 20oC to as high as 28oC, with an average of 23oC. This is substantially lower than the 26.5oC used by
the NatHERS scheme. The NatHERS thermostats were developed by calculating free running thermal neutrality
for the hottest 3 months for each climate. It is understood, however, that thermal neutrality in air conditioned
buildings is lower than in free running buildings.
The households surveyed rely much more on air conditioning to provide comfort in bedrooms overnight than
they do in living rooms during the day. This suggests that it could be appropriate to lower the thermostat
setting in the NatHERS behaviour assumptions for these areas, particularly at night. Lowering the thermostat
setting for bedrooms alone would significantly increase the proportion of total NatHERS loads in bedrooms
and hence the potential impact of their performance on the star rating. This change would address a key
concern of the HER IRG.
The market research also found that the hours of use for cooling were much lower than the potential 17 hours
per day of the NatHERS user assumptions (5.8 hours per day in living room and 7.7 hours per day in bedroom 1
during the wet season). However, just because cooling is available for use does not necessarily mean it is used.
This study evaluated how many hours per day cooling was used in the wet season and then compared this to
the reported hours of use observed in the market research before considering any change to the hours of use
in the NatHERS behaviour assumptions.
Limiting the hours of use may have other less desirable outcomes. For instance, if air conditioning is not used
during some hours then the performance of the house is not valued at this time. The market research showed
little use of air conditioning in living areas before mid-day. If these hours were excluded from the NatHERS
behaviour assumptions it is conceivable that a house with large areas of eastern facing windows could meet
the scheme’s target despite significant over-heating during the early hours of the day. In houses which

4.2 Attachment D
38
reported using air conditioning before mid-day, it may be that this was due to solar gains through eastern
facing windows. Therefore there is less reason for changing the hours of use than in the NatHERS thermostat
settings.
This study investigated lowering the bedroom’s thermostat settings. It observed whether the hours of use of
cooling corresponded with the findings of the market research, and then evaluated whether a change may
need to be made to the hours of cooling use in the NatHERS scheme.
Importantly, it should be noted that care must be taken in applying the findings of this market research. It only
surveyed people in Darwin and Alice Springs, and therefore may not be applicable to other tropical climates.
Further, it is not known whether this sample was a statistically representative sample of households in the
climates where it was undertaken. However, its findings point to a potential solution of the HER IRG’s concerns
regarding the NatHERS assessment outcomes. Lower thermostat settings in bedrooms would increase the
proportion of energy loads in bedrooms and potentially make it easier for lightweight housing design - which
have traditionally been found to be most appropriate for tropical climates – to achieve compliance. However,
such a change may inherently result in further issues. Concrete block construction is now prevalent for new
housing across much of northern Australia because it is cheaper than other forms of construction and also for
ease of meeting NCC building requirements for high wind speeds in cyclonic areas. If amending the NatHERS
behaviour assumptions improves the ratings of lightweight buildings it may add significant cost to concrete
block houses. This may have significant impacts on the benefit-cost ratios in these climate zones and any
potential changes that could impact on the energy efficiency stringency under the NCC would expected to be
subject to a Regulatory Impact Statement.