appendices - inflibnetshodhganga.inflibnet.ac.in/bitstream/10603/12721/14/14_appendix.pdf ·...
TRANSCRIPT

145
Appendices
Appendix 1 : Ongoing Hydroelectric Projects and Thermal Projects (Private Sector) in Kerala
Table A.1.1 Ongoing Hydroelectric Projects in Kerala
Name of the Project
Installed
Capacity
MW
Energy
Potential
MU
Major
Works
Started
in
Original
Estimate
in Rs.
lakhs
Latest
Estimate
in Rs.
Lakhs
Remarks
Azhutha Diversion, Idukki 57 1987 290 1446 Partially Commissioned
Kuttiadi Tail Race, Kozhikode 3.75 17.10 1989 397 1494 Commissioned.
Vazhikkadavu Diversion,
Idukki 24 1989 186 1599 Commissioned.
Kuttiadi Additional Extension 100 240.5 2000 6200 22050 Commissioned.
Bhoothathankettu, Ernakulam 16 61.5 1994 3283 Private Sector
Ullungal 7 34 Private Sector
Karikkayam 15 72.7 1994 3860 Private Sector
Kuttiyar Diversion 37 1991 214 2900 Commissioned
Sengulam Augmentation 85 2001 4763 5000 To be completed in 2013
Thottiyar 40 99 13679 20704 To be completed in 2012
Athirappally 163 386 2001 10254 31590 MoEF withdraws clearance
Vadakkepuzha Diversion 12 131 514 Commissioned
Neriamangalam Extension 25 58.27 2003 3506 4776 Commissioned
Sengulam Tail Race 3.60 12.57 To be completed in 2011
Mankulam 40 82 To be completed in 2011
Pallivasal Extension 60 164.87 2007 17500 31000 To be completed in 2012
Adayanpara 3.5 9.01 2007 2132 2132 To be completed in 2010
Barapol I & II 25 60 To be completed in 2011
Chalippuzha 90 Project Report ready
Thoovalar 4 Project Report ready

146
Alamparathodu 3 Project Report ready
Sabarigiri Additional Capacity 35 154.51 94.64 Renovation of Sabarigiri Project
KakkadamPoyil 1 20 55
KakkadamPoyil 2 5 11 To be completed in 2011
AnackamPoyil 7.50 22.63 On the drawing board
Kandappanchal 5 On the drawing board
Pathamkayom 4 On the drawing board
Olickal 4.5 10.18 28.09 On the drawing board
Chathankottu Nada 2 6 14.76 To be completed in 2010
Vilangadu 7.5 22.63 To be completed in 2010
Maniyar Tail Race 4 16 To be completed in 2010
Perunthenaruvi 10 25.77 To be completed in 2010
Marumala 5 On the drawing board
Pathrakadavu, Silent Valley 70 214 24706 Controversial EIA, as good as
abandoned
Poozhithodu 4.80 10.97 2009 2949 3950 To be completed in 2010
Achankovil 30 75.80 To be completed in 2011
Chinnar 24 78 To be completed in 2011
Perunthenaruvi 6 25.77 To be completed in 2010
Chembukadavu III 6 14.92 53.53 On the drawing board
Poovarathodu 2.7 5.88 20.46 On the drawing board
Koodam 4.5 10.5 37.59 On the drawing board
Poringalkuthu 24 Cabinet clearance received
MW- Megawatt; MU- Million units; 1 million=10 lakhs

147
Table A.1.2 Thermal Projects (Private Sector) in Kerala
Name of the Project Installed Capacity
MW
Energy Potential
(MU) Remarks
DCP, Kasaragod 105 749 Work under way
Kannur Power Corporation 513 Work to be started
SASIN, Kochi 679 Work to be started
Cochin Refineries,
Ambalamugal 621 Joint Sector
Source: power system statistics,2009
148
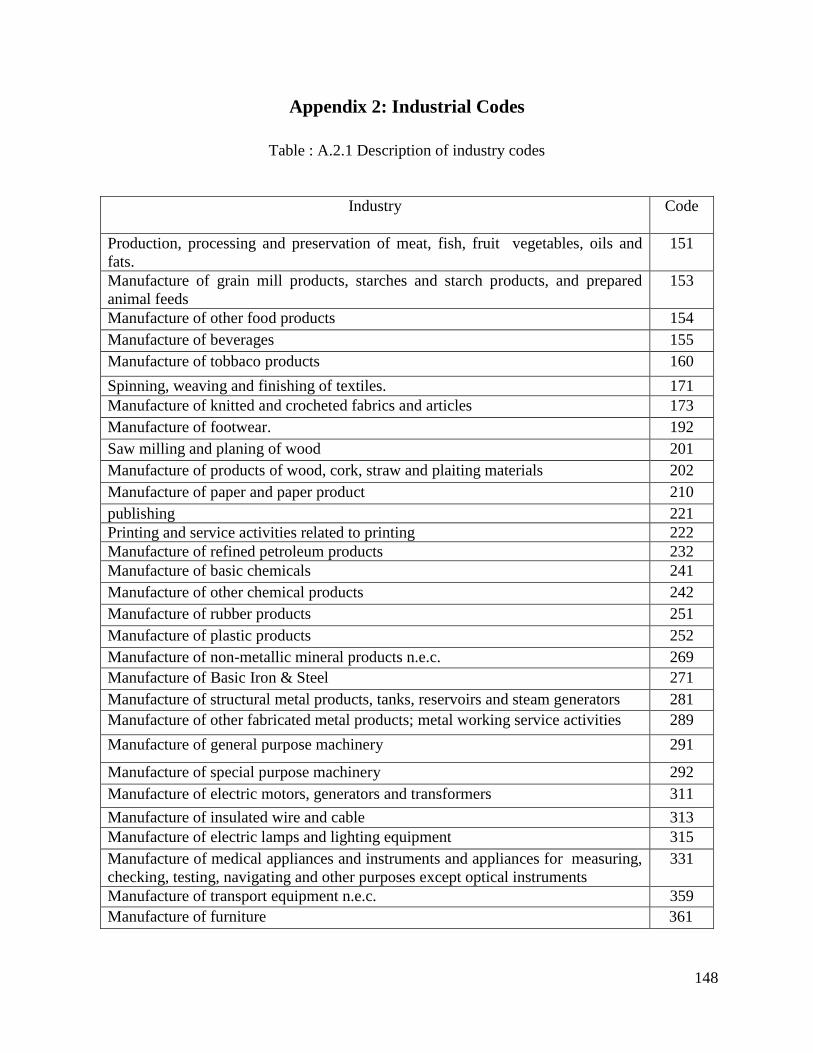
Appendix 2: Industrial Codes
Table : A.2.1 Description of industry codes
Industry
Code
Production, processing and preservation of meat, fish, fruit vegetables, oils and
fats.
151
Manufacture of grain mill products, starches and starch products, and prepared
animal feeds
153
Manufacture of other food products 154
Manufacture of beverages 155
Manufacture of tobbaco products 160
Spinning, weaving and finishing of textiles. 171
Manufacture of knitted and crocheted fabrics and articles 173
Manufacture of footwear. 192
Saw milling and planing of wood 201
Manufacture of products of wood, cork, straw and plaiting materials 202
Manufacture of paper and paper product 210
publishing 221
Printing and service activities related to printing 222
Manufacture of refined petroleum products 232
Manufacture of basic chemicals 241
Manufacture of other chemical products 242
Manufacture of rubber products 251
Manufacture of plastic products 252
Manufacture of non-metallic mineral products n.e.c. 269
Manufacture of Basic Iron & Steel 271
Manufacture of structural metal products, tanks, reservoirs and steam generators 281
Manufacture of other fabricated metal products; metal working service activities 289
Manufacture of general purpose machinery 291
Manufacture of special purpose machinery 292
Manufacture of electric motors, generators and transformers 311
Manufacture of insulated wire and cable 313
Manufacture of electric lamps and lighting equipment 315
Manufacture of medical appliances and instruments and appliances for measuring,
checking, testing, navigating and other purposes except optical instruments
331
Manufacture of transport equipment n.e.c. 359
Manufacture of furniture 361

149
Appendix 3 : Global and National Energy Scenarios
Appendix 3 contains detailed analysis of global and national energy scenarios.
A.3.1 World Energy Production
A.3.1.1 Fossil fuels
The twentieth century saw a rapid twentyfold increase in the use of fossil fuels. Between 1980
and 2006, the worldwide annual growth rate was 2%. According to the US Energy Information
Administration's 2006 estimate, the estimated 471.8 EJ total consumption in 2004 was divided as
follows, with fossil fuels supplying 86% of the world's energy: Coal fueled the industrial
revolution in the 18th and 19th century. With the advent of the automobile, airplanes and the
spreading use of electricity, oil became the dominant fuel during the twentieth century. The
growth of oil as the largest fossil fuel was further enabled by steadily dropping prices from 1920
until 1973. After the oil shocks of 1973 and 1979, during which the price of oil increased from 5
to 45 US dollars per barrel, there was a shift away from oil. Coal, natural gas, and nuclear
became the fuels of choice for electricity generation and conservation measures increased energy
efficiency. From 1965 to 2008, the use of fossil fuels has continued to grow and their share of the
energy supply has increased. From 2003 to 2008, coal, which is one of the dirtiest sources of
energy, was the fastest growing fossil fuel.
A.3.1.1.1 Coal Reserves
Coal is the most abundant fossil fuel. This was the fuel that launched the industrial revolution
and has continued to grow in use; China, which already has many of the world's most polluted
cities, was in 2007 building about two coal fired power plants every week. Coal is the fastest
growing fossil fuel and its large reserves would make it a popular candidate to meet the energy
demand of the global community, short of global warming concerns and other pollutants.
According to the International Energy Agency the proven reserves of coal are around 909 billion
tonnes, which could sustain the current production rate for 155 years, although at a 5% growth
per annum this would be reduced to 45 years, or until 2051. In the United States, 49% of
electricity generation comes from burning coal.

150
Coal was the fastest growing fuel in the world for the fifth consecutive year. Global consumption
rose by 4.5%, above the 10-year average of 3.2%. Consumption growth was widespread, with
growth in every region except the Middle East exceeding the 10-year average. Chinese coal
consumption rose by 7.9%, the weakest growth since 2002 but still sufficient to account for more
than two-thirds of global growth. Indian consumption rose by 6.6% and OECD consumption rose
by 1.3%, both above-average figures. Coal use in the world increased 48% from 2000 to 2009.
A.3.1.1.2 Oil
Current oil consumption is at the rate of 0.18 ZJ per year (31.1 billion barrels) or 85-mbd. There
is growing concern that peak oil production may be reached in the near future, resulting in severe
oil price increases. World crude oil production (including lease condensates) according to US
EIA data decreased from a peak of 73.720 mbd in 2005 to 73.437 in 2006, 72.981 in 2007, and
73.697 in 2008.
Global oil consumption grew by 1.1% in 2007, or 1 million barrels per day (b/d), slightly below
the 10-year average. Consumption in the oil-exporting regions of the Middle East, South and
Central America and Africa accounted for two-thirds of the world‟s growth.
A.3.1.1.3 Natural Gas
World natural gas consumption grew by an above-average 3.1% in 2007. The US accounted for
nearly half of the world‟s gas consumption, driven by cold winter weather and strong demand for
gas in power generation. Natural gas accounted for nearly all the growth in energy consumption.
Chinese consumption grew by 19.9% accounted for the second-largest increment to global gas
consumption.
Gas consumption rose by 3.1% in 2007, slightly above the 10-year average. The US accounted
for the largest incremental growth in both production and consumption.
In the IEO 2011 Reference case, natural gas is the world‟s fastest-growing fossil fuel, with
consumption increasing at an average rate of 1.6 percent per year from 2008 to 2035.

151
A.3.1.2 Nuclear power
In 2005 nuclear power accounted for 6.3% of world's total primary energy supply. The nuclear
power production in 2006 accounted 2,658 TWh (23.3 EJ), which was 16% of world's total
electricity production. In November 2007, there were 439 operational nuclear reactors
worldwide, with total capacity of 372,002 MW. A further 33 reactors were under construction,
94 reactors were planned and 222 reactors were proposed. As of December 2009, the world had
436 reactors. Since commercial nuclear energy began in the mid-1950s, 2008 was the first year
that no new nuclear power plant was connected to the grid, although two were connected in
2009.
Annual generation of nuclear power has been on a slight downward trend since 2007, decreasing
1.8% in 2009 to 2558 TWh with nuclear power meeting 13–14% of the world's electricity
demand.
A.3.1.3 Nuclear fusion
Fusion power is the process driving the sun and other stars. It generates large quantities of heat
by fusing the nuclei of hydrogen or helium isotopes, which may be derived from seawater. The
heat can theoretically be harnessed to generate electricity. The temperatures and pressures
needed to sustain fusion make it a very difficult process to control. Fusion is theoretically able to
supply vast quantities of energy, with relatively little pollution. Although both the United States
and the European Union, along with other countries, are supporting fusion research .According
to one report, inadequate research has delayed progress in fusion research for the past 20 years.
A.3.1.4 Renewable energy
In 2008, renewable energy supplied around 19% of the world's energy consumption. The
renewables sector has been growing significantly since the last years of the 20th century, and in
2009 the total new investment was estimated to have been 150 billion US dollars. This resulted
in an additional 80 GW of capacity during the year. Renewable resources are available each year,
unlike non-renewable resources which are eventually depleted. A simple comparison is a coal
mine and a forest. While the forest could be depleted, if it is managed it represents a continuous
supply of energy, vs the coal mine which once has been exhausted is gone. Most of earth's

152
available energy resources are renewable resources. Renewable resources account for more than
93 percent of total U.S. energy reserves. Annual renewable resources were multiplied times
thirty years for comparison with non-renewable resources. In other words, if all non-renewable
resources were uniformly exhausted in 30 years, they would only account for 7 percent of
available resources each year, if all available renewable resources were developed . As of 2010,
about 16% of global final energy consumption comes from renewables, with 10% coming from
traditional biomass, which is mainly used for heating, and 3.4% from hydroelectricity. New
renewables (small hydro, modern biomass, wind, solar, geothermal, and biofuels) accounted for
another 2.8% and are growing very rapidly. The share of renewables in electricity generation is
around 19%, with 16% of global electricity coming from hydroelectricity and 3% from new
renewables.
A.3.1.4.1 Hydropower
Hydroelectric generation increased by 1.7%, slightly below the 10-year average. Increased
capacity in China and Brazil, along with improved hydro availability in Canada and Northern
Europe, was partially offset by drought-related declines in the US and southern Europe.
Worldwide hydroelectricity installed capacity reached 816 GW in 2005, consisting of 750 GW of
large plants, and 66 GW of small hydro installations. Large hydro capacity totaling 10.9 GW was
added by China, Brazil and India during the year, but there was a much faster growth (8%) in
small hydro, with 5 GW added, mostly in China where some 58% of the world's small hydro
plants are now located. China is the largest hydro power producer in the world, and continues to
add capacity. In the Western world, although Canada is the largest producer of hydroelectricity
in the world, the construction of large hydro plants has stagnated due to environmental concerns.
The trend in both Canada and the United States has been to micro hydro because it has negligible
environmental impacts and opens up many more locations for power generation. In British
Columbia alone the estimates are that micro hydro will be able to more than double electricity
production in the province.
In 2005, hydroelectric power supplied 16.4% of world electricity, down from 21.0% in 1973, but
only 2.2% of the world's energy.15 It is the most widely used form of renewable energy,
accounting for 16 percent of global electricity consumption, and 3,427 terawatt-hours of

153
electricity production in 2010, which continues the rapid rate of increase experienced between
2003 and 2009.
A.3.1.4.2 Biomass and biofuels
Until the end of the nineteenth century biomass was the predominant fuel, today it has only a
small share of the overall energy supply. Electricity produced from biomass sources was
estimated at 44 GW for 2005. Biomass electricity generation increased by over 100% in
Germany, Hungary, the Netherlands, Poland and Spain. A further 220 GW was used for heating
(in 2004), bringing the total energy consumed from biomass to around 264 GW. The use of
biomass fires for cooking is excluded.
World production of bioethanol increased by 8% in 2005 to reach 33 billion litres (8.72 billion
US gallons), with most of the increase in the United States, bringing it level to the levels of
consumption in Brazil. Biodiesel increased by 85% to 3.9 billion litres (1.03 billion US gallons),
making it the fastest growing renewable energy source in 2005. Over 50% is produced in
Germany.
A.3.1.4.3 Wind power
According to the World Wind Energy Association, the installed capacity of wind power
increased by 29% from the end of 2007 to the end of 2008 to total 121 GW, with over half the
increase in the United States, Spain and China. Doubling of capacity took about three years. The
total installed capacity is approximately three to eight times that of the actual average power
produced as the nominal capacity represents peak output; actual capacity is generally from 13-
40% of the nominal capacity.
The available wind energy estimates range from 300 TW to 870 TW. Using the lower estimate,
just 5% of the available wind energy would supply the current worldwide energy needs. Most of
this wind energy is available over the open ocean. Wind power is growing at the rate of 30%
annually, with a worldwide installed capacity of 238351 megawatts (MW) at the end of 201135
and is widely used in Europe, Asia, and the United States. Several countries have achieved
relatively high levels of wind power penetration, such as 21% of stationary electricity production
154
in Denmark, 18% in Portugal, 16% in Spain, 14% in Ireland and 9% in Germany in 2010. 36. As
of 2011, 83 countries around the world are using wind power on a commercial basis.
A.3.1.4.4 Solar power
The available solar energy resources are 3.8 YJ/yr (120,000 TW). Less than 0.02% of available
resources are sufficient to entirely replace fossil fuels and nuclear power as an energy source.
The International Energy Agency projected that solar power could provide "a third of the global
final energy demand after 2060, while CO2 emissions would be reduced to very low levels‟‟.In
2007 grid-connected photovoltaic electricity was the fastest growing energy source, with
installations of all photovoltaics increasing by 83% in 2009 to bring the total installed capacity to
15 GW. Nearly half of the increase was in Germany, which is now the world's largest consumer
of photovoltaic electricity (followed by Japan). Solar cell production increased by 50% in 2007,
to 3,800 megawatts, and has been doubling every two years.
A.3.1.4.5 Geothermal
Geothermal energy is used commercially in over 70 countries. In the year 2004, 200 PJ (57
TWh) of electricity was generated from geothermal resources, and an additional 270 PJ of
geothermal energy was used directly, mostly for space heating. In 2007, the world had a global
capacity for 10 GW of electricity generation and an additional 28 GW of direct heating,
including extraction by geothermal heat pumps.
A 2006 report by MIT that took into account the use of Enhanced Geothermal Systems (EGS)
concluded that it would be affordable to generate 100 GWe (gigawatts of electricity) or more by
2050, just in the United States, for a maximum investment of 1 billion US dollars in research and
development over 15 years. The MIT report calculated the world's total EGS resources to be over
13 YJ, of which over 200 ZJ would be extractable, with the potential to increase this to over 2 YJ
with technology improvements - sufficient to provide all the world's energy needs for several
millennia. The total heat content of the Earth is 13,000,000 YJ.
A.3.1.5 World Energy Consumption
World Energy Consumption refers to the total energy used by all of human civilization.
Typically measured per-year, it involves all energy harnessed from every energy source we use,

155
applied towards humanity's endeavors across every industrial and technological sector, across
every country. Being the power source metric of civilization, World Energy Consumption has
deep implications for humanity's social economic and political sphere.
According to International energy agency data from 1990 to 2008, the average energy use per
person increased 10% while world population increased 27% (Table 3.3.2.1). Regional energy
use also grew from 1990 to 2008: the Middle East increased by 170%, China by 146%, India by
91%, Africa by 70%, Latin America by 66%, the USA by 20%, the EU-27 block by 7%, and
world overall grew by 39%.
In 2008, total worldwide energy consumption was 474 exajoules (474×1018 J=132,000 TWh).
This is equivalent to an average power use of 15 terawatts (1.504×10¹³ W). The potential for
renewable energy is: solar energy 1600 EJ (444,000 TWh), wind power 600 EJ (167,000 TWh),
geothermal energy 500 EJ (139,000 TWh), biomass 250 EJ (70,000 TWh) hydropower, 50 EJ
(14,000 TWh) and ocean energy 1 EJ (280 TWh).
In 2009, world energy consumption decreased for the first time in 30 years (-1.1%) or 130
MTOE, as a result of the financial and economic crisis (GDP drop by 0.6% in 2009). This
evolution is the result of two contrasting trends. Energy consumption growth remained vigorous
in several developing countries, specifically in Asia (+4%). Conversely, in OECD, consumption
was severely cut by 4.7% in 2009 and was thus almost down to its 2000 levels. In North
America, Europe, consumptions shrank by 4.5%, 5% respectively due to the slowdown in
economic activity. China became the world's largest energy consumer (18% of the total) since its
consumption surged by 8% during 2009 (from 4% in 2008). Oil remained the largest energy
source (33%)despite its share has been lowering over time. Coal posted a growing role in the
world's energy consumption: in 2009, it accounted for 27% of the total.

156
Table A.3.1.5: Regional energy use (kWh/capita &TWh) and growth 1990–2008 (%)
Kwh/capita Population (million) Energy Use
(1,000 TWh)
1990 2008 Growth 1990 2008 Growth 1990 2008 Growth
USA 89,021 87,216 – 2% 250 305 22% 22.3 26.6 20%
EU-27 40,240 40,821 1% 473 499 5% 19 20.4 7%
Middle
East 19,422 34,774 79% 132 199 51% 2.6 6.9 170%
China 8,839 18,608 111% 1,141 1,333 17% 10.1 24.8 146%
Latin
America 11,281 14,421 28% 355 462 30% 4 6.7 66%
Africa 7,094 7,792 10% 634 984 55% 4.5 7.7 70%
India 4,419 6,280 42% 850 1,140 34% 3.8 7.2 91%
Others* 25,217 23,871 nd 1,430 1,766 23% 36.1 42.2 17%
The
World 19,422 21,283 10% 5,265 6,688 27% 102 142 39%
Source: IEA/OECD, Population OECD/World Bank
Energy use = kWh/capita* Mrd. capita (population) = 1000 TWh
A.3.1.5.1 Energy intensity of different economies
The Figure A.3.1.5.1 shows the ratio between energy usage and GDP for selected countries.
GDP is based on 2004 purchasing power parity and 2000 dollars adjusted for inflation. From the
figure it is clear that India had very low energy intensity among the different economies

157
Fig A.3.1.5.1 Ratio between energy usage and GDP for selected countries
Source: key world energy statistics 2010
A.3.1.5.2 Sectoral Energy Consumption of the World
Industrial users (agriculture, mining, manufacturing, and construction) consume about 37% of
the total 15 TW. Personal and commercial transportation consumes 20%; residential heating,
lighting, and appliances use 11%; and commercial uses (lighting, heating and cooling of
commercial buildings, and provision of water and sewer services) amount to 5% of the total.
The other 27% of the world's energy is lost in energy transmission and generation. In 2005,
global electricity consumption averaged 2 TW. The energy rate used to generate 2 TW of
electricity is approximately 5 TW, as the efficiency of a typical existing power plant is around
38%. The new generation of gas-fired plants reaches a substantially higher efficiency of 55%.
Coal is the most common fuel for the world's electricity plants.

158
From the table A.3.1.5.2.1, it is seen that in 2008, total world energy use per sector of industry is
28%, transport 27% and residential and service 36%. The residential and service sector had a
higher share in world energy use than that of other sectors.
Table: A.3.1.5.2.1 World Energy use per Sector
Sector 2000 2008 2000 2008
TWH TWH % %
Industry 21,733 27,273 26.5 27.8
Transport 22,563 26,742 27.5 27.3
Residential and service 30,555 35,319 37.3 36
Non-energy use 7,119 8,688 8.7 8.9
Total 81,970 98,022 100 100
Source: IEA 2010, Total is calculated from the given sectors.
Table A.3.1.5.2.2: Trends in world Primary energy consumption MTOE
Year Oil Natural Gas Coal Nuclear
Energy
Hydro
Electricity Total
1980 3024.1 1296.4 1966 172.9 433.6 6459.4
1981 2918.3 1312.1 1959.1 203.2 443.2 6392.7
1982 2820.3 1308.9 2002.2 222.7 460 6354.1
1983 2797.3 1325 2039.2 248 482 6409.5
1984 2843 1426.5 2114.5 297.7 498.7 6681.7
1985 2826.5 1474.7 2209.6 350.9 510.2 6861.7
1986 2905.2 1487.4 2262.6 377.4 519.9 7032.6
1987 2948.4 1557.8 2341.9 406.6 5340.3 7254.4
1988 3037.5 1662.1 2241.5 488.4 183.7 7429.5
1989 3087.5 1737.4 2272.2 502.3 183.3 7599.4
1990 3134.5 1770.5 2244.5 516.7 189.4 7666.2
1991 3133.6 1802.8 2189.7 541.4 194.6 7667.5
1992 3163.2 1805.3 2171.8 545.6 193.9 7685.9
1993 3134.6 1844.5 2162.4 564.4 204.4 7706
1994 3193.8 1853.4 2174.1 574.6 206.1 7795.9
1995 3234.7 1911.7 2206.7 599.9 216.2 7953
1996 3313.6 2004.7 2284.5 520.9 219.1 8123.7
1997 3386.3 1990.3 2265.8 616.5 223.4 8258.9
1998 3406.6 2015.4 2243.2 626.9 224.8 8292.1

159
1999 3469.7 2065.1 2159.9 651.5 226.6 8345.6
2000 3503.6 2164 2186 668.6 230.4 8522.2
2001 3517.1 2219.5 2243.1 601 584.7 8580.7
2002 3562.6 2285.8 2412.3 610.8 593 9464.5
2003 3641.2 2343.2 2613.5 5987.2 604.1 9800.8
2004 3798.6 2425.2 2798.9 625.1 643.2 10291
2005 3836.8 2474.7 2929.8 668.7 627.2 10537.1
2006 3910.9 2558.3 3041.7 634.9 697.2 10843
2007 3952.8 2637.7 3177.5 622 709.3 11099.3
2008 3959.9 2717.3 3286.4 620.2 731.4 11315.2
2009 3882.1 2653.1 3278.3 610.5 740.3 11164.3
Source: B.P Amoco Statistical review of world energy, June 2010
A.3.2 National Energy Scenario
Energy has been universally recognized as one of the most important inputs for economic growth
and human development. There is a strong two-way relationship between economic development
and energy consumption. On one hand, growth of an economy, with its global competitiveness,
hinges on the availability of cost-effective and environmentally benign energy sources, and on
the other hand, the level of economic development has been observed to be dependent on the
energy demand. Energy intensity is an indicator to shows how efficiently energy is used in the
economy. The energy intensity of India is over twice then that of the matured economies, which
are represented by the OECD (Organization of Economic Co-operation and Development)
member countries. India‟s energy intensity is also much higher than the emerging economies.
Energy is an essential input to the overall development of the economy. It provide light and fuel
to millions of households, electricity to industry, agriculture, commerce, all service sectors and
so on. Since energy is a critical component, development of conventional and non-conventional
forms of energy is necessary for meeting the growing demand of the society.
Availability and access to energy are considered as catalysts for economic growth. With high
economic growth rates and over 15 percent of the world‟s population, India is a significant
consumer of energy resources. In 2009, India was the fourth largest oil consumer in the world,
after the United States, China, and Japan. Despite the global financial crisis, India‟s energy
demand continues to rise.

160
According to the International Energy Agency (IEA), coal/peat account for nearly 40 percent of
India‟s total energy consumption, followed by nearly 27 percent for combustible renewable and
waste. Oil accounts for nearly 24 percent of total energy consumption, natural gas six percent,
hydroelectric power almost 2 percent, nuclear nearly 1 percent, and other renewable less than 0.5
percent. Although nuclear power comprises a very small percentage of total energy consumption
at this time, it is expected to increase in light of international civil nuclear energy cooperation
deals. According to the Indian government, nearly 30 percent of India‟s total energy needs are
met through imports.
India is both a major energy producer and a consumer. India currently ranks as the world‟s
seventh largest energy producer, accounting for about 2.49% of the world‟s total annual energy
production. It is also the world‟s fifth largest energy consumer, accounting for about 3.45% of
the world‟s total annual energy consumption in 2004. Since independence, the country has seen
significant expansion in the total energy use in the country with a shift from non-commercial to
commercial sources. The share of commercial energy in total primary energy consumption rose
from 59.7% in 1980–81 to 72.6% in 2006–07. It must be noted, however, that India‟s per capita
energy consumption is one of the lowest in the world. India consumed 455 kilogram of oil
equivalent (kgoe) per person of primary energy in 2004, which is around 26% of world average
of 1750 kgoe in that year.
A.3.2.1 Energy Sector of India
The average growth rate of India‟s gross domestic product (GDP) during the period 2008-09,
was about 8.6 per cent. The corresponding average growth rates of net national income and
personal disposable income were 14.5 per cent and 14.7 per cent, respectively. The average
growth in the index of industrial production (IIP) during this period was 7.2 per cent. IIP growth
was 10.2 per cent in 2009-10. A high growth economy has resulted in increasing demand for
energy. In terms of purchasing power parity (PPP), Indian economy is the fourth-largest in the
world. The country accounts for over 17 per cent of the total global population and about 7 per
cent of world‟s GDP.
However, according to the International Energy Agency (IEA), India‟s energy production
accounts for just 4 per cent of the global energy production. The country accounts for 5 per cent

161
of the total global energy consumption. According to the Central Electricity Authority (CEA),
the average per capita electricity consumption in India is about 704 kWh as compared to global
worldwide per capita consumption of 2,752 kWh. The Government of India is keen to increase
per capita consumption of energy to raise living standards in the country. An average Indian
consumes 0.53 tonnes of oil equivalent (TOE) of energy compared to the global average of 1.82
(TOE). Higher economic growth is driving income growth, which in turn is driving up industrial
investment and fuel consumption. In general, demand exceeds supply and there is a broad-based
energy shortage, which is either met by imports or remains unmet.
An invariable economic development growth chart has chronicled India as one of the fastest
growing economy in the world. It is the fourth largest economy in terms of purchasing power
parity, with a GDP growth rate of 6.7%, marked in fiscal year 2009. To complement the
country‟s growing economy, India‟s energy sector is presenting a steady growth from last few
years, it recently witnessed significant developments, aided by both interest of foreign investors
and a change in government policy. In 2008, energy sector contributed more than 7.2% of the
GDP. India‟s energy requirement are enormous and the demand is growing, constant demand of
approximately 1.1 billion people makes the fifth largest energy consumer in the world.
Table - A.3.2.1.1 Macro Economic Profile of India at Constant Prices 1999-2000
Indicators 2000-01 2001-02 2002-03 2003-04 2004-05 2005-06 2006-07 2007-08
GNP at factor
cost (Rs
billion)
1776861 1847842 1957384 2033781 2208196 2593160 28749838 3114846
Annual
growth rate of
GNP %
4.6 6.1 4.2 8.5 7.5 9.6 9.8 9.3
Population(mi
llion) 1014 1027 1036 1049 1065 1094 1129 1140
Per capita net
national
product
(Rupees)
16223 16910 17281 18517 19649 20858 22553 25494
Source: Central Statistical Organization, Ministry of Statistics and Programme
Implementation, New Delhi.
162
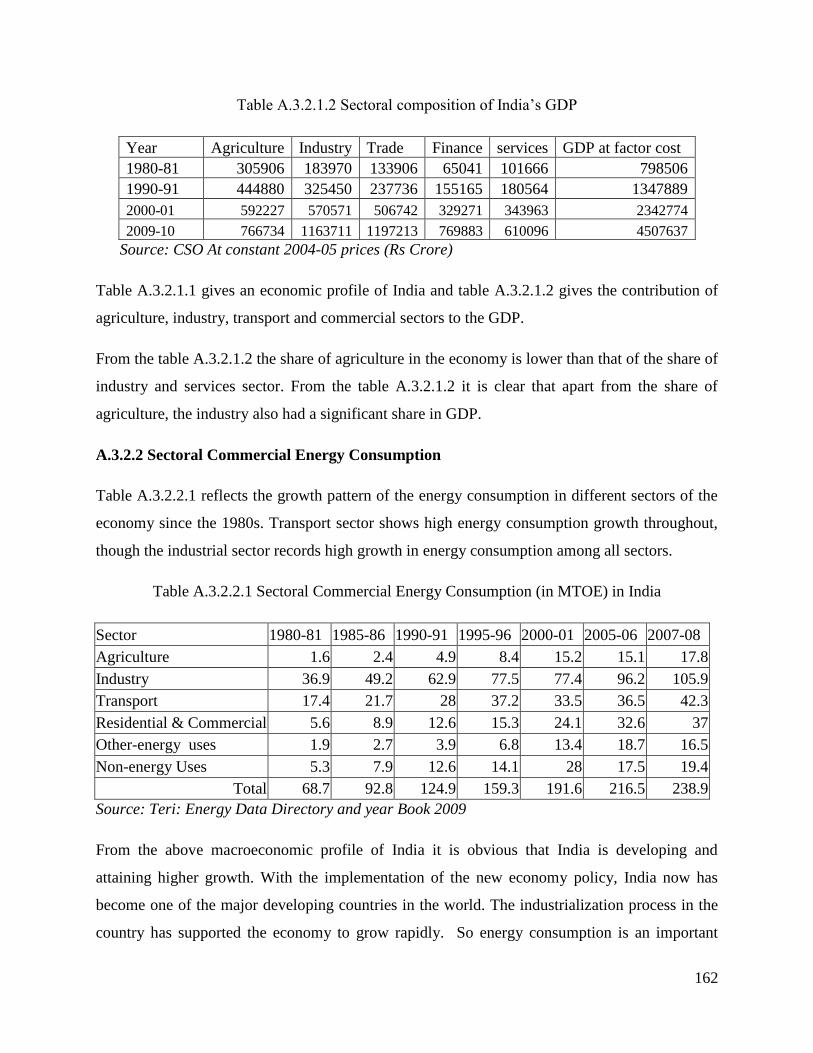
Table A.3.2.1.2 Sectoral composition of India‟s GDP
Year Agriculture Industry Trade Finance services GDP at factor cost
1980-81 305906 183970 133906 65041 101666 798506
1990-91 444880 325450 237736 155165 180564 1347889
2000-01 592227 570571 506742 329271 343963 2342774
2009-10 766734 1163711 1197213 769883 610096 4507637
Source: CSO At constant 2004-05 prices (Rs Crore)
Table A.3.2.1.1 gives an economic profile of India and table A.3.2.1.2 gives the contribution of
agriculture, industry, transport and commercial sectors to the GDP.
From the table A.3.2.1.2 the share of agriculture in the economy is lower than that of the share of
industry and services sector. From the table A.3.2.1.2 it is clear that apart from the share of
agriculture, the industry also had a significant share in GDP.
A.3.2.2 Sectoral Commercial Energy Consumption
Table A.3.2.2.1 reflects the growth pattern of the energy consumption in different sectors of the
economy since the 1980s. Transport sector shows high energy consumption growth throughout,
though the industrial sector records high growth in energy consumption among all sectors.
Table A.3.2.2.1 Sectoral Commercial Energy Consumption (in MTOE) in India
Sector 1980-81 1985-86 1990-91 1995-96 2000-01 2005-06 2007-08
Agriculture 1.6 2.4 4.9 8.4 15.2 15.1 17.8
Industry 36.9 49.2 62.9 77.5 77.4 96.2 105.9
Transport 17.4 21.7 28 37.2 33.5 36.5 42.3
Residential & Commercial 5.6 8.9 12.6 15.3 24.1 32.6 37
Other-energy uses 1.9 2.7 3.9 6.8 13.4 18.7 16.5
Non-energy Uses 5.3 7.9 12.6 14.1 28 17.5 19.4
Total 68.7 92.8 124.9 159.3 191.6 216.5 238.9
Source: Teri: Energy Data Directory and year Book 2009
From the above macroeconomic profile of India it is obvious that India is developing and
attaining higher growth. With the implementation of the new economy policy, India now has
become one of the major developing countries in the world. The industrialization process in the
country has supported the economy to grow rapidly. So energy consumption is an important

163
factor for the growth of any economy it is important to study the energy use pattern in India, to
investigate the nature and trend of the energy consumption. The next section deals with different
sources of the energy consumption and production.
A.3.2.3 Energy Overall Production and Consumption
India lacks sufficient domestic energy resources and imports much of its growing energy
requirements. In addition to pursuing domestic oil and gas exploration and production projects,
India is also stepping up its natural gas imports, particularly through imports of liquefied natural
gas.
India is both a major energy producer and consumer. India currently ranks as the world‟s
eleventh greatest energy producer, accounting for about 2.4% of the world‟s total annual energy
production, and as the world‟s sixth greatest energy consumer, accounting for about 3.3% of the
world‟s total annual energy consumption. Despite its large annual energy production, India is a
net energy importer, mostly due to the large imbalance between oil production and consumption.
India's Total Primary Energy Production (TEP) and Consumption (TPEC) is shown in Table
A.3.2.3.1
Table A.3.2.3.1: India‟s Total Primary Energy Production and Consumption (in Peta joules)
Year Production Consumption
1970-71 2,936 3,859
1975-76 3,888 5,074
1980-81 4,808 6,393
1985-86 6,777 9,470
1990-91 8,939 13,312
1995-96 10,508 18,188
2000-01 11,506 22,198
2005-06 13,874 28,298
2006-07 14,868 31,040
2007-08 15,547 34,428
2008-09 16,277 36,329
CAGR from 1970-71 to2008-09 4.43% 5.94%
Source: Energy statistics 2011

164
Table A.3.2.3.1 depicts the production and compound annual growth rate of production of
energy resources of the country from 1970 to 2008-09. From the table A.3.2.3.1 it is clear that
the production of the total primary energy resources has considerably increased from 1980 till
2009. However, over the time phase production of the energy resources has increased but the
growth rate was not more rapid. The consumption of total primary energy resources has been
increasing from 1970 at a faster rate. The Fig A.3.2.3.1 and Fig A.3.2.3.2shows the trends in
production and consumption of energy from 1970 onwards. While comparing the figures
A.3.2.3.1 and A.3.2.3.2 It is evident that consumption of energy in India exceeds production.
Figure A.3.2.3.1 Trends in Production of energy in India by Primary Sources from 1970-71 to
2010-11

165
Figure A.3.2.3.2 Consumption of Conventional energy in Petajoules from 1970-71 to 2010-11
A.3.2.4 Per capita Energy consumption
Per-capita Energy Consumption (PEC) during a year is computed as the ratio of total energy
consumption to the mid-year population of that year. From the per capita energy consumption it
is found that it was increasing gradually every year. The per capita consumption of energy
resources is increasing , but the compound annual rate of growth from 1970-71 to 2008-09 of
per capita consumption is 3.44% indicates a slow growth in per capita energy consumption.

166
Table- A.3.2.4: Per capita consumption of energy resources from1990-2008
Year
Per capita Energy
Consumption in Kwh
1970-71 1204.39
1875-76 1361.74
1980-81 1471.09
1985-86 1928.51
1990-91 2232.5
1995-96 2593.58
2000-01 3047.81
2005-06 3497.59
2006-07 3727.24
2007-08 3928.16
2008-09 4171.56
CAGR 3.44%
Source: Energy statistics 2010
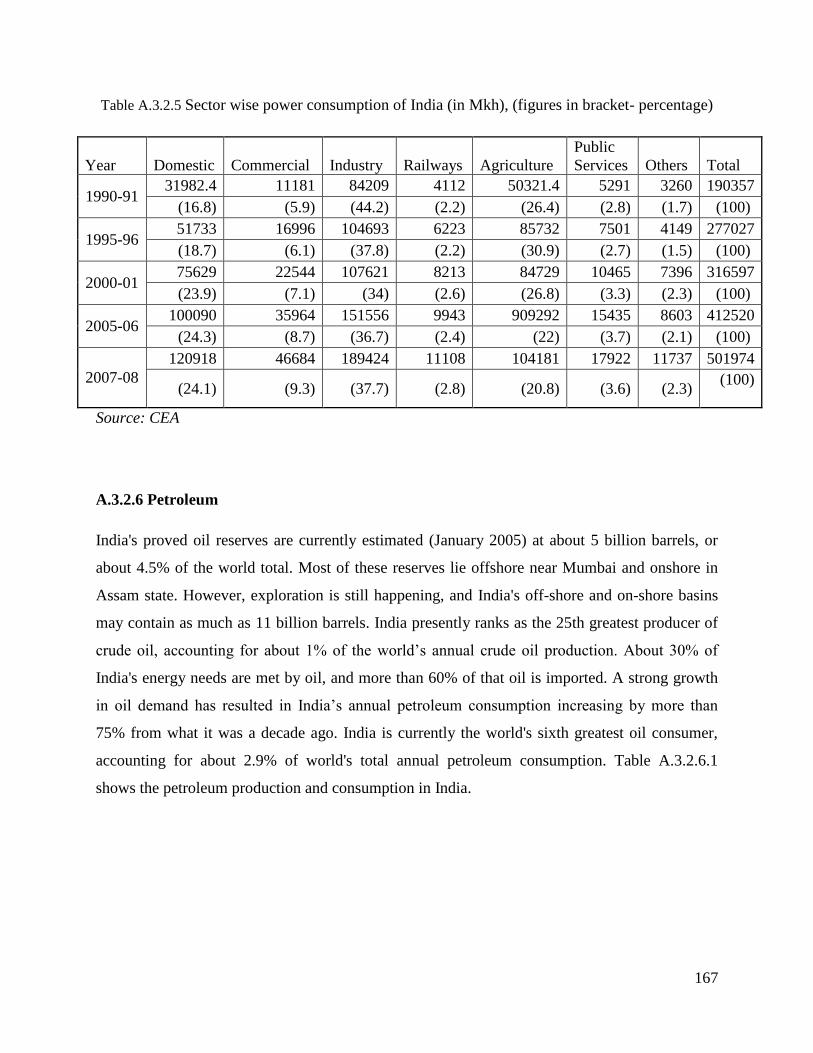
A.3.2.5 Sectoral composition of Power consumption
With enhanced economic activity, the demand for commercial energy has been increasing over a
period of time in India. Table A.3.2.5 depicts the sectoral power consumption in the country, for
the past two decades. The commercial energy consumption has increased times during the period
from 1990-2008.
The industrial sector continues to be the largest consumer of commercial energy. The increase in
power consumption in the agricultural sector is the result of the increase in the irrigation pump
sets energized and a sharp increase in the usage hours of pump sets and also due to the high level
of subsidy provided. From 2005 it is seen that there is declining trend in the consumption of
power in agriculture.
167
Table A.3.2.5 Sector wise power consumption of India (in Mkh), (figures in bracket- percentage)
Year Domestic Commercial Industry Railways Agriculture
Public
Services Others Total
1990-91 31982.4 11181 84209 4112 50321.4 5291 3260 190357
(16.8) (5.9) (44.2) (2.2) (26.4) (2.8) (1.7) (100)
1995-96 51733 16996 104693 6223 85732 7501 4149 277027
(18.7) (6.1) (37.8) (2.2) (30.9) (2.7) (1.5) (100)
2000-01 75629 22544 107621 8213 84729 10465 7396 316597
(23.9) (7.1) (34) (2.6) (26.8) (3.3) (2.3) (100)
2005-06 100090 35964 151556 9943 909292 15435 8603 412520
(24.3) (8.7) (36.7) (2.4) (22) (3.7) (2.1) (100)
2007-08
120918 46684 189424 11108 104181 17922 11737 501974
(24.1) (9.3) (37.7) (2.8) (20.8) (3.6) (2.3) (100)
Source: CEA
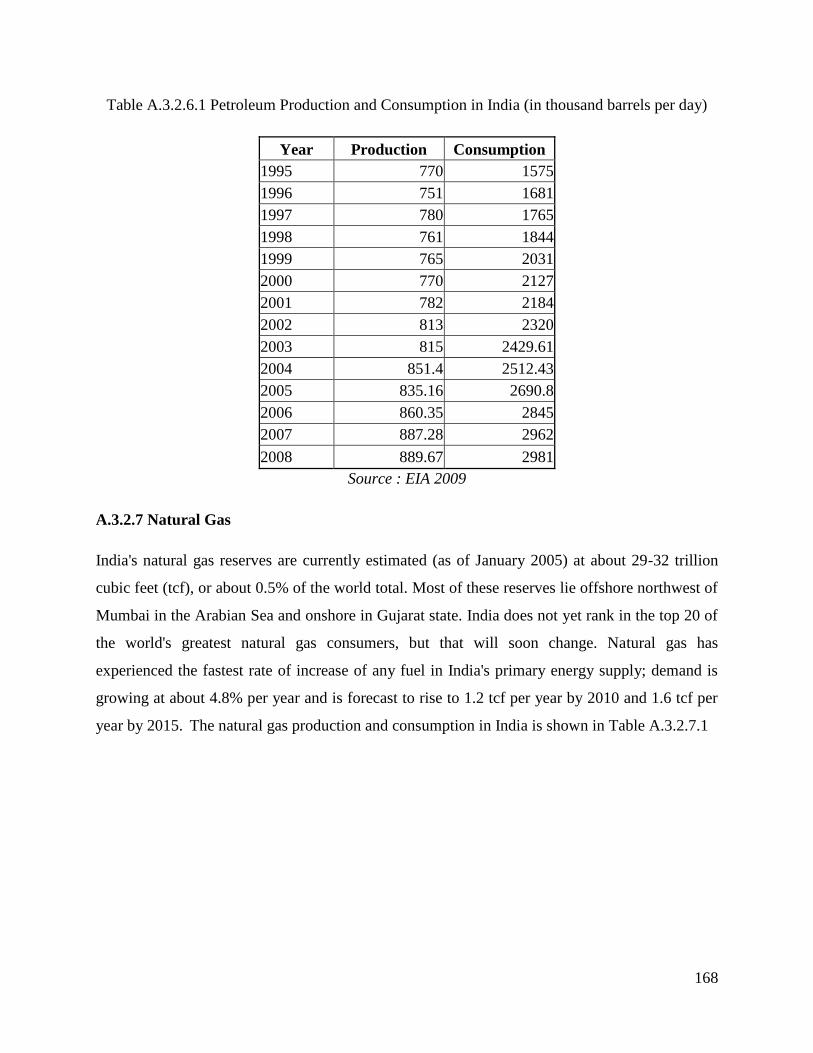
A.3.2.6 Petroleum
India's proved oil reserves are currently estimated (January 2005) at about 5 billion barrels, or
about 4.5% of the world total. Most of these reserves lie offshore near Mumbai and onshore in
Assam state. However, exploration is still happening, and India's off-shore and on-shore basins
may contain as much as 11 billion barrels. India presently ranks as the 25th greatest producer of
crude oil, accounting for about 1% of the world‟s annual crude oil production. About 30% of
India's energy needs are met by oil, and more than 60% of that oil is imported. A strong growth
in oil demand has resulted in India‟s annual petroleum consumption increasing by more than
75% from what it was a decade ago. India is currently the world's sixth greatest oil consumer,
accounting for about 2.9% of world's total annual petroleum consumption. Table A.3.2.6.1
shows the petroleum production and consumption in India.
168
Table A.3.2.6.1 Petroleum Production and Consumption in India (in thousand barrels per day)
Year Production Consumption
1995 770 1575
1996 751 1681
1997 780 1765
1998 761 1844
1999 765 2031
2000 770 2127
2001 782 2184
2002 813 2320
2003 815 2429.61
2004 851.4 2512.43
2005 835.16 2690.8
2006 860.35 2845
2007 887.28 2962
2008 889.67 2981
Source : EIA 2009
A.3.2.7 Natural Gas
India's natural gas reserves are currently estimated (as of January 2005) at about 29-32 trillion
cubic feet (tcf), or about 0.5% of the world total. Most of these reserves lie offshore northwest of
Mumbai in the Arabian Sea and onshore in Gujarat state. India does not yet rank in the top 20 of
the world's greatest natural gas consumers, but that will soon change. Natural gas has
experienced the fastest rate of increase of any fuel in India's primary energy supply; demand is
growing at about 4.8% per year and is forecast to rise to 1.2 tcf per year by 2010 and 1.6 tcf per
year by 2015. The natural gas production and consumption in India is shown in Table A.3.2.7.1

169
Table A.3.2.7.1 Dry Natural Gas Production and Consumption in India, 1995-2008 (in trillion
cubic feet)
Year Production Consumption
1995 0.63 0.63
1996 0.7 0.7
1997 0.72 0.72
1998 0.76 0.76
1999 0.75 0.75
2000 0.79 0.79
2001 0.85 0.85
2002 0.88 0.88
2003 0.96 0.96
2004 0.99 1.09
2005 1.06 1.27
2006 1.09 1.37
2007 1.11 1.46
2008 1.13 1.51
A.3.2.8 Coal
At the current level of production and consumption, India's coal reserves would last more than
two hundred years. India is currently the third-largest coal-producing country in the world
(behind China and the United States), and accounts for about 8.5% of the world's annual coal
production. India is also currently the third-largest coal consuming country (behind the China
and the United States), and accounts for nearly 9% of the world's total annual coal consumption.
More than half of India‟s energy needs are met by coal, and about 70% of India's electricity
generation is now fueled by coal. The annual demand for coal has been steadily increasing over
the past decade, and is now nearly 50% greater than it was a decade ago. Even though India is
able to satisfy most of its country's coal demand through domestic production, less than 5% of its
reserves is coking coal used by the steel industry. As a result, India's steel industry imports
coking coal, mainly from Australia and New Zealand, to meet about 25% of its annual needs.
Coal production and consumption in India is shown in Table A.3.2.8

170
Table - A.3.2.8 Coal Production and Consumption in India, 1990-2008 (in thousands of tons)
Year Production Consumption Imports Exports
1990-91 214057 214987 4900 100
1991-92 232818 232338 5920 110
1992-93 241995 45255 6250 130
1993-94 248687 256327 7100 100
1994-95 257770 269180 8270 120
1995-96 273415 284043 8870 89
1996-97 286080 298621 13177 480
1997-98 297169 306824 16469 541
1998-99 292270 310738 16536 787
1999-2000 300043 315047 19700 1156
2000-01 313696 325448 20930 1292
2001-02 327787 343124 20548 1903
2002-03 341272 361745 23260 1517
2003-04 361246 379405 21683 1627
2004-05 382615 404691 26128 1374
2005-06 407013 432271 36869 1329
2006-07 430832 462353 43081 1546
2007-08 457082 502818 49794 1627
2008-09 478093 541607 57571 1798
Source : Office of the Coal Controller, Ministry of Coal , Energy Statistics 2010
A.3.2.9 Electricity
In 2007, India had approximately 159 Giga Watts (GW) of installed electric capacity and
generated 761 billion kilowatt hours. Nearly all electric power in India is generated with coal,
oil, or gas. Conventional thermal sources produced over 80 percent of electricity in 2007.
Hydroelectricity, a seasonally dependent power source in India, accounted for nearly 16 percent
of power generated in 2007. Finally, nuclear energy produced roughly 2 percent of electricity
during the same year, while geothermal and other renewable sources accounted for
approximately 2 percent. In July of 2010, India and Bangladesh signed a 35 year power import
deal whereby India will import up to 500 megawatts beginning in late 2012. India also imports
some electricity from Bhutan and Nepal. However, these electricity imports are not likely to
prove sufficient to make up for India‟s lack of electric generation capacity.
171
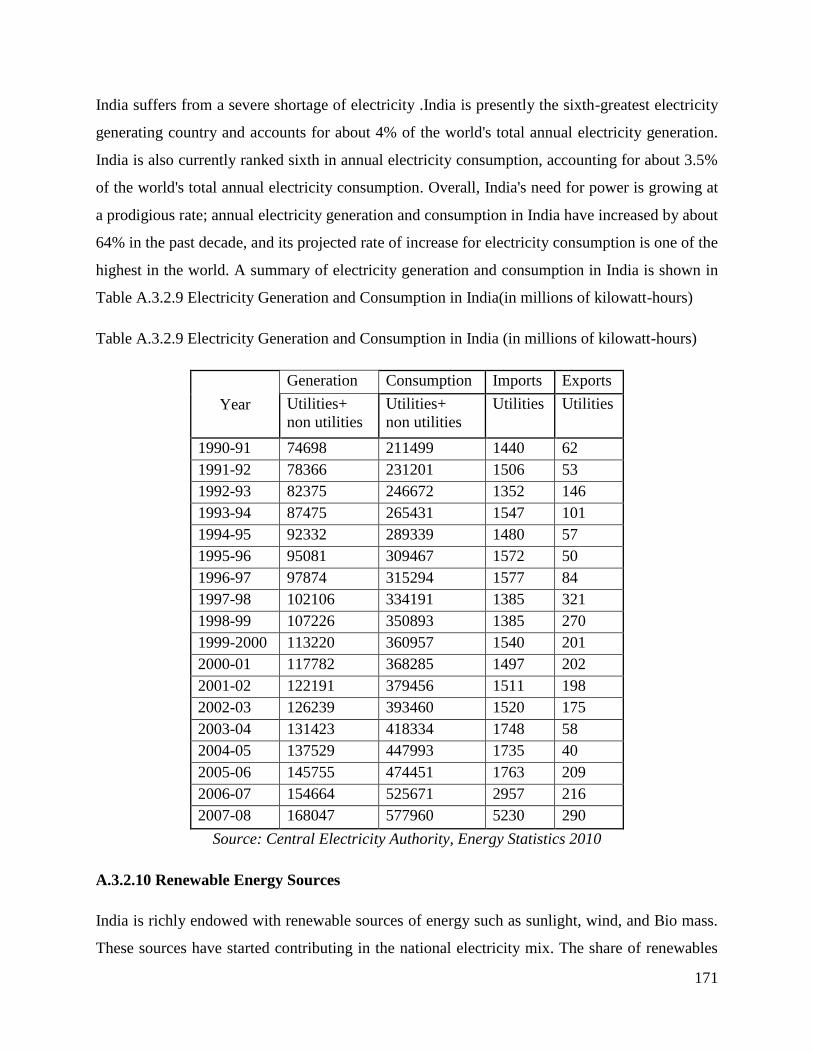
India suffers from a severe shortage of electricity .India is presently the sixth-greatest electricity
generating country and accounts for about 4% of the world's total annual electricity generation.
India is also currently ranked sixth in annual electricity consumption, accounting for about 3.5%
of the world's total annual electricity consumption. Overall, India's need for power is growing at
a prodigious rate; annual electricity generation and consumption in India have increased by about
64% in the past decade, and its projected rate of increase for electricity consumption is one of the
highest in the world. A summary of electricity generation and consumption in India is shown in
Table A.3.2.9 Electricity Generation and Consumption in India(in millions of kilowatt-hours)
Table A.3.2.9 Electricity Generation and Consumption in India (in millions of kilowatt-hours)
Year
Generation Consumption Imports Exports
Utilities+
non utilities
Utilities+
non utilities
Utilities Utilities
1990-91 74698 211499 1440 62
1991-92 78366 231201 1506 53
1992-93 82375 246672 1352 146
1993-94 87475 265431 1547 101
1994-95 92332 289339 1480 57
1995-96 95081 309467 1572 50
1996-97 97874 315294 1577 84
1997-98 102106 334191 1385 321
1998-99 107226 350893 1385 270
1999-2000 113220 360957 1540 201
2000-01 117782 368285 1497 202
2001-02 122191 379456 1511 198
2002-03 126239 393460 1520 175
2003-04 131423 418334 1748 58
2004-05 137529 447993 1735 40
2005-06 145755 474451 1763 209
2006-07 154664 525671 2957 216
2007-08 168047 577960 5230 290
Source: Central Electricity Authority, Energy Statistics 2010
A.3.2.10 Renewable Energy Sources
India is richly endowed with renewable sources of energy such as sunlight, wind, and Bio mass.
These sources have started contributing in the national electricity mix. The share of renewables

172
in total electricity generation in India increased from 0.15% in 2001-02 to 0.54% in 2006-07. The
present contribution of renewable energy is small, existing capabilities offer the flexibility to
respond to emerging environmental and sustainable development needs. Renewable energy
technologies (RETs) have a vast potential and have the advantage of being environmentally
sustainable. The county has been able to achieve significant capacity addition in recent years due
to renewable energy sources. Table A.3.2.10.1 gives a detailed estimated potential for RET in
India.
Table: A.3.2.10.1 Estimated Potential for RETs in India
Source /System Estimated Potential Cumulative Achievement
Power from renewable
Grid -Interactive renewable Power
Bio Power 16881MW 605.80MW
Wind Power 45195 MW 7844.52MW
Small hydro power(up to 25 MW) 15000 MW 2045.61 MW
Co generation-Bagasse 5000 MW 719.83 MW
Waste to energy (urban and industrial) 2700MW 55.25MW
Solar Power 2.12MW
Sub total (in MW)(A) 847676MW 11272.13MW
Captive /CHP/distributed renewable
power
Biomass 95.MW
Biomass gasifier 86.53MW
Energy recovery from waste 23.7MW
Subtotal(in MW)(B) 205.23MW
Total A+B 847676MW 11477.36MW
Source: MNRE 2008
A.3.2.10.1 Small Hydro Power
Hydro based power generation up to 25 MW capacities, classified as small hydropower, and
offers a number of advantages for electricity generation. It has been one of the earliest known 16
renewable energy sources, in existence in the country. Estimates place the small hydro potential
in India at 15,000 MW. Since a large potential of this technology exists in remote hilly areas,
development of small hydropower for decentralized power generation leads to rural
electrification and local area development. The gestation period of the technology is low and the
indigenous manufacturing base is strong.

173
A.3.2.10.2 Wind Power
India is positioned among the top five countries in wind power installation after Germany, the
USA, Denmark, and Spain. Wind power capacity reached nearly 7844 MW by December 2007.
Private projects constitute around 95.5 percent of the total capacity and the rest are
demonstration projects. Out of the total energy generated, about 80 percent of consumption is for
captive purpose while the rest is sold to the grid. Wind energy is one of the clean, renewable
energy sources that hold out the promise of meeting energy demand in the direct, grid-connected
modes as well as stand-alone and remote „niche‟ applications (for instance water pumping,
desalination, and telecommunications) in developing countries like India. Estimates place the
economical wind energy potential in India at 45,000 MW .
A.3.2.10.3 Biomass-based Power Generation/Cogeneration
Biomass, consisting of wood, crop residues and animal dung continues to dominate energy
supply in rural and traditional sectors, having about one-third share in the total primary energy
consumption in the country. Cogeneration technology, based on multiple and sequential use of a
fuel for generation of steam and power, aims at surplus power generation in process industries
such as sugar mills, paper mills, rice mills, etc. The aggregate biomass combustion based power
and sugar-cogeneration capacity by the end of December 2007 was 205 MW, with 186 MW of
cogeneration and the rest biomass power. In the area of small-scale biomass gasification, a total
capacity of 35 MW has so far been installed, mainly for stand-alone applications.
A.3.2.10.4 Solar Technologies
Solar Photovoltaic (SPV) contributes at present around two and a half percent of the power
generation based on renewable energy technology in India. Solar photovoltaic systems with an
aggregate capacity of 50 MW have been deployed for different applications that include solar
photovoltaic power projects for providing voltage support in rural areas and peak load shaving in
urban areas. Solar thermal technologies have a very high potential for applications in solar water
heating systems for industrial and domestic applications and for solar cooking in the domestic
sector. Solar Thermal Power Generation potential in India is about 35 MW per Sq. Km.

174
A.3.2.10.5 Nuclear power
Nuclear power generation in India dates back to October 1969 when India‟s first nuclear reactor
at Tarapur Atomic Power Station commenced commercial operations. At present there are six
nuclear power plants with a total capacity of 4120 MW. These stations together generated 16957
Million units of electricity in 2007-08. India has adopted a three – stage nuclear power
programme, which is based on closed nuclear fuel cycle. The first stage focuses on natural
uranium based pressurized heavy water reactors and enriched uranium based light water reactors.
Thirteen pressurized heavy water reactors and two boiling water reactors are already in
operation, five PHWRs and two Russian Vodo-Vodyaqnoi Energe7tichesky reactors are under
construction. In the second stage, India will focus on Plutonium – based FBRs .A 40 megawatt
thermal fast breeder test reactor has been operating since 1985. A 500 MW prototype fast
breeder reactor is under construction. The third stage is likely to be based on thorium based
breeder reactors. A 30 kilo watt thermal pilot reactor already operating. India‟s nuclear energy
programme is expected to get a boost with the signing of the agreement for cooperation between
the Government of India and the Government of USA to ensure peaceful uses of nuclear energy.

175
Appendix - 4 : Global and National Industrial Energy Consumption
Appendix 4 provides a detailed account of the global and national industrial energy consumption.
A.4.1 Global Industrial Energy Consumption
A first step in evaluating global industrial energy intensity is to take stock of how energy is
consumed. Industry uses fossil fuels in manufacturing processes and as a raw material (to
generate power). In the 134 economies analysed for the report of International energy Agency
2010, energy used to power manufacturing processes accounted on average for about 76 percent
of industrial energy consumption over 1990–2008 in both developed and developing economies;
feedstock accounted for the rest (Figure A.4.1.1).
Figure A.4.1.1 Split in Industrial Energy consumption between manufacturing Processes
and feed stock (1990-2008) Giga tonnes of oil equivalent
Source: IEA 2010
Total final energy consumption grew at an annual average of 0.1 percent in the early 1990s, 1.4
percent over the next decade, and an unprecedented 2.7 percent thereafter; resulting in a 1.7
percent average annual rise over the period (Figure A.4.1.2).1 Growth in energy consumption per
capita was slower. Energy consumption per capita stagnated at around 1.2 tonnes of oil

176
equivalent (toe) until 2002 and then increased gradually to 1.3 toe in 2008, an annual growth rate
of 0.4 percent.
Figure A.4.1.2 Growth in energy consumption and energy consumption percapita, by economic
sector, (1990-2008) Source: IEA 2010
Developing economies are driving the global increase in final energy demand, with annual
average growth of 0.7 percent in the early 1990s, 1.2 percent over 1994–2001, and a rapidly
accelerating 4.5 percent since 2002 (see Figure 3.2). In 2008, industry accounted for the largest
share of final energy consumption (36 percent), followed by residential (28percent) and transport
(18 percent). The three top consuming industrial sectors are metals, chemicals and chemical
products, and non-metallic minerals. Average annual energy consumption per capita fell 0.5
percent over 1990–2001 and then increased rapidly, as did industrial production relative to total
output. In 2008, average annual energy consumption per capita stood at 0.9 tonnes of oil
equivalent– an annual increase of 3.2 percent since 2001.
Industry, by far the largest energy consumer among the seven economic sectors studied, accounts
for about 31 percent of global final energy consumption in 2008. Transport and residential uses

177
follow, at about 24 percent each. Within industry, the metals sector uses the most energy,
followed by chemicals and non-metallic minerals (Figure A.4.1.3).
Figure A.4.1.3 Industrial energy consumption by sector(1990-2008)
Developed economies, with just 15 percent of the world‟s population, are the largest energy
consumers per capita, accounting for 42 percent of final energy consumption in 2008. Total
energy consumption from the early 1990s to 2004 grew 1.3 percent. But demand has since
stabilized–at 3.4 gigatonnes of oil equivalent Gtoe) and 3.5 toe per capita. Transport consumes
the most energy (32 percent), followed by industry (24 percent) and residential uses (19 percent).
The three highest consuming industrial sectors are metals; chemicals and chemical products; and
paper, pulp and printing.
A striking trend is the annual 2.3 percent growth in developing economies‟ total energy
consumption over 1990–2008, more than 2.5 times the 0.9 percent annual growth in developed
economies. And with emerging market economies poised to grow faster than the more advanced
economies, energy demands in developing economies are poised to rise even more.

178
A key driver of these differences in growth of energy consumption is the disparity between
developing economies‟ 0.6 percent annual rise in industry‟s share of energy consumption and
developed economies‟0.7 percent annual decline. Driving the increase in developing economies
are population growth and a shift towards more energy-intensive activities–Such as paper and
plastics– and construction activities for infrastructure and housing. In addition, production
capacity in many sectors is shifting from developed to developing economies, which are
producing goods for export to developed economies. Over 1990–2008, the final energy
consumption of industry rose 11 percent (0.6 percent a year) in developing economies while
remaining fairly stable in developed economies. As economies grow, the allocation of energy
resources shifts– usually towards services and away from industry and energy .
A.4.1.1 Global energy intensity of industries
Global industrial energy consumption fell 0.3 percent a year over 1990–1995, recovered over
1995–2002, and has been rising since at 3.8 percent a year (Figure A.4.1.1.1). MVA had a
sustained increase over the period, averaging 3.1 percent annual growth.3 While average
industrial energy intensity fell 26 percent over 1990–2008 – an average decline of 1.7 percent
annually–two distinct phases are evident: a marked decline in 1990–2001, averaging 2.6 percent
a year, and a leveling off at a 0.2 percent annual decline since. Thus, MVA was decoupled from
industrial energy use during 1990–2001. That means that industry produced considerably more
value added from a relatively small increase in energy consumption. Since 2001, global
industrial energy intensity has stabilized at around 0.35 toe per $1,000 of MVA.

179
Figure A.4.1.1.1: Global trends in Manufacturing Value added, Industrial energy Consumption
and Industrial energy intensity (1990-2008).
Source : IEA 2010
Although average industrial energy intensity in developing economies is five times that in
developed economies, it fell 46 percent over 1990–2008 in developing economies (an average
annual decline of 3.4 percent), compared with 31 percent in developed economies (2.0 percent
annually). Among developing economies, lower and upper middle-income economies reduced
their energy intensity the most (58 percent and 46 percent). The biggest overall declines came
during the 1990s, except in high-income developing economies.
A.4.1.2 Energy intensity differs by industrial sector
Average values for industry as a whole give wide variations in energy intensity among industrial
sectors. Here energy intensity is measure in tons of oil equivalent per 1,000 manufacturing value
added in terms of 2000 prices. Of the 10 (or 11, if non-specified is included) sectors examined, 3

180
dominate global industrial energy consumption.4 Industrial sectors generally fall into one of
three groups.
Most energy intensive: Process sectors such as metals, non-metallic minerals, and chemicals and
chemical products are the most industrial energy intensive globally and in all income groups
considered. The global mean for 1995–2008 is 1.6 toe per $1,000 MVA for metals, 0.9 for non-
metallic minerals and 0.6 for chemicals and chemical products, each above the global industry
average of 0.35.
Least energy intensive:. Discrete product sectors such as machinery and transport equipment are
the least energy intensive, with global averages of 0.06 and 0.07 toe per $1,000 MVA. Energy
constitutes a small share of input costs in these sectors.
Intermediate energy intensity: Somewhere between the high and low ends are the intermediate
energy intensive sectors of petrochemicals (0.3 toe per $1,000 MVA), paper, pulp and printing
(0.3), wood and wood products (0.3), food and tobacco (0.2) and textile and leather (0.2; see
Figure A.4.1.2.2). Technologically and economically, they combine characteristics of process
sectors (carbonated drinks and beer or paper pulp) and discrete product sectors (clothing,
footwear and furniture). Some plants share continuous and discrete processes, some plants
produce goods in bulk, while others convert or “package” bulk inputs into individual products.

181
Figure A.4.1.2.2 Energy Intensity by Industrial sector and income group, 1995-2008

182
There is considerable regional variation, however. For example, industry uses on average 4.7
times more energy to produce a unit of MVA in developing Europe than in Latin America and
the Caribbean.7One reason is the vintage of industrial facilities. There have been continual
improvements in nearly every aspect of industrial activities, so countries with newer industries
tend to have newer, more efficient facilities. Many non–OECD European countries have
inherited inefficient, coal-based, energy-intensive industries that operate at a small fraction of
their output capacity. The most energy-intensive industrial region has been developing Europe
(averaging 2.2 toe per $1,000 MVA over 1990–2008), followed by sub-Saharan Africa (1.8) and
South and Central Asia (1.6). Industry in East Asia and the Pacific (0.9), the Middle East and
North Africa (0.8) and Latin America and the Caribbean (0.5) has been considerably less energy
intensive.
Industrial energy intensity fell substantially over 1990–2008 in developing Europe, East Asia
and the Pacific, and South and Central Asia. In East Asia and the Pacific, industrial energy
intensity dropped 46 percent, as a 160 percent rise in industrial energy consumption
accompanied a 381 percent jump in MVA. Industrial energy intensity fell slightly in Indonesia
and Malaysia (less than 5 percent), while rising 273 percent in Hong Kong SAR China. And
though South and Central Asia registered a 51 percent increase in industrial energy consumption,
MVA grew rapidly (173 percent), reducing industrial energy intensity 45 percent. India and
Kazakhstan contributed most to this success. Reductions in industrial energy intensity were far
lower (7–33 percent) in Latin America and the Caribbean, sub-Saharan Africa, and the Middle
East and North Africa.
Regional energy intensity trends have been affected by international shifts in the location of
industrial activity. For example, the United States has seen much of its labour-intensive
industrial sectors move to the Republic of Korea, Taiwan Province of China, Mexico and China.
Industrial energy consumption, still growing in developed countries, is soaring in developing
countries. Developed countries remain the largest per capita users of both total energy and
industrial energy, but developing countries are quickly catching up– satisfying domestic
demands for improved living standards and import demands from developed countries–and
becoming large energy consumers.

183
A.4.2 Energy Consumption in Indian Industries
Industry is a diverse sector encompassing about half a million manufacturing, mining,
agriculture, fishing, and forestry establishments and a like number of construction sites. These
many facilities, ranging from small die-casting shops, to family farms, to steel mills, to appliance
manufacturers, and to semiconductor producers, vary greatly in their activities, size, and
technological sophistication. Energy use in industry is likewise heterogeneous. Each facility uses
a different mix of fuels for a variety of purposes in converting raw materials into salable
products. Around a fifth of global income is generated directly by manufacturing industry, and
nearly half of household consumption relies on goods from industrial processes. People‟s needs
for food, transportation, communication, housing, health and entertainment are all met by
industry. Since the Industrial Revolution, waves of innovation have shaped how people work and
live. During the 19th and 20th centuries, developed countries relied on manufacturing to spur
economic growth. Today, developing countries are counting on industrialization to reduce
poverty and improve the quality of life of its growing populations. But improvements in the
standard of living made possible through industrialization have come at an environmental cost.
Before the late 1960s, energy consumption per capita had increased nine-fold over the previous
200 years. Since then, energy consumption per capita has increased by a further 25 percent.
Industries vary greatly in their overall level of energy use, because of differences in their output
and energy intensity (energy use per unit of output).
Energy consumption in India is comparatively lower than the world standards. In the year 2004-
05 the per capita consumption of energy in India was only 530 kilograms of oil equivalent (kgoe)
whereas the world average was 1,770 kgoe (GOI 2008-09). Much of the total commercial energy
available is consumed by the industrial sector (share of industry in total energy consumption in
2006/07 was 45% (TERI Energy Data Directory 2009)). Figure A.4.2.1 shows a comparison of
sectoral shares of industrial energy consumption in India and the world.

184
Fig A.4.2.1. Sub-sectoral share of industrial energy consumption (India vs. World)
Source: IEA 2009a; IEA 2009b
India has the fifth lowest energy efficiency in the world (IEA 2008). However, by using simple
measures such as better housekeeping, use of energy efficient devices, process modifications,
energy saving potential can be further exploited. Electricity, oil, coal, biomass and gas are the
main energy products consumed in India. The industry and the residential sectors are the largest
energy users but they differ in the type of fuel used. The residential sector is characterized by a
large share of biomass energy use, while the industry primarily thrives on electricity for meeting
its energy requirements. The industrial sector in India comprises of several energy-intensive
industries (e.g. iron and steel, chemicals, petroleum refining, cement, aluminium, pulp and
paper) and light industries (e.g. food processing, textiles, wood products, printing and publishing,
and metal processing). The energy intensive industries represented 63% of the total energy
consumed in the sector in 2005. While the absolute energy use in the steel, cement, fertilizer,
aluminium and pulp and paper industries in India grew between 1990 and 2005, the specific
energy consumption was reduced significantly.
India ranks sixth in the world in total energy consumption and needs to accelerate developments
in energy sector to meet its growing needs. The country is rich in coal and other renewable

185
energy resources (like solar, wind, hydro and bio-energy) but has very small hydrocarbon
reserves (0.4 percentage of the world‟s reserve) and hence is forced to import over 25 percent of
its primary energy needs as crude oil and natural gas . Industrial sector consumes nearly 50% of
the total commercial energy. Hence, it is essential to improve the efficiency levels; for this, one
has to understand past trends in energy use and assess the factors that contribute to changes in
energy consumption and measure the performance of energy-related policies. The three main
factors that determine the level of energy consumption in an economy are: overall activity or
production levels, structure of the economy, and the output or activity per unit of energy use.
This last component is referred to as energy intensity, and reduction in it occurs when the level
of service/activity/output are enhanced for a given amount of energy inputs. Since it is relatively
easy to understand the relationship between the amounts of energy needed to produce one
physical unit of some good, changes in physical indicators are likely to provide reliable estimates
of changes in energy efficiency. Energy intensity is inversely related to efficiency; less the
energy required to produce a unit of output or service, the greater is the efficiency. A logical
conclusion, then, is that declining energy intensities over time may be indicators of
improvements in energy efficiencies. A more useful indicator of energy intensity may be the
ratio of sectoral/sub-sectoral energy use to the output or activity of the sector/sub-sector.
A.4.3 Changes in Energy Consumption of Indian Industries
The attempt here is to understand the pattern of energy consumption at the industries level and
specifically to look at the changes in energy consumption and energy intensity. This will help us
to link with the changes in the energy intensity as we are considering changes in production for
these industries as well. Table- A.4.3.1 summarizes the Annual Growth Rate changes in the
energy consumption of India from 1998-99 to-2008-09.

186
Table- A.4.3.1 Annual Growth Rate of Energy Consumption of industrial sectors from
1998-99 to 2008-09
Industry
codes
1999-
2000
2000-
01
2001-
02
2002-
03
2003-
04
2004-
05
2005-
06
2006-
07
2007-
08
2008-
09
151 -2.2 -4.0 0.9 15.4 5.2 9.8 16.6 26.8 8.4 -3.9
153 40.8 -1.2 7.6 10.1 3.7 14.9 14.5 9.8 10.6 -4.8
154 8.2 12.9 1.2 7.7 6.6 16.0 18.0 15.8 5.5 -2.6
155 21.0 30.5 0.0 5.8 17.3 8.3 11.8 21.0 21.2 -8.7
160 18.6 35.3 -19.5 28.6 7.6 -1.4 24.8 2.1 3.1 -1.5
171 27.5 9.5 -10.1 10.7 3.3 9.9 11.1 18.0 5.4 -2.6
173 75.4 15.2 -19.7 64.5 19.6 25.9 17.4 25.1 -59.6 73.9
192 31.3 20.4 44.2 -16.0 2.7 24.7 8.4 9.1 7.2 -3.3
201 -2.9 14.3 34.2 -2.6 13.5 37.9 -14.1 12.9 3.3 -1.6
202 81.5 5.3 29.5 -11.6 30.8 8.7 11.6 29.3 -3.2 1.7
210 25.9 4.9 -3.5 14.1 -3.0 6.7 4.9 5.6 24.8 -9.9
221 21.9 22.1 14.0 -2.5 15.7 12.7 14.2 9.8 37.1 -13.5
222 -2.0 12.6 16.0 9.6 -9.2 24.2 30.1 19.2 4.2 -2.0
232 2.6 -16.3 -29.7 -44.7 312.2 41.6 39.8 18.7 2.5 -1.2
241 40.0 24.2 1.3 3.5 0.6 8.1 10.5 9.5 5.7 -2.7
242 34.3 -14.3 2.3 10.8 6.9 8.5 22.1 10.5 6.6 -3.1
251 23.3 -6.9 0.4 11.7 9.4 8.9 12.3 17.8 6.3 -3.0
252 15.4 12.8 14.8 2.2 17.4 23.7 -3.6 16.4 22.9 -9.3
269 34.4 -9.7 10.3 3.6 15.0 18.3 9.4 20.4 22.5 -9.2
271 10.6 5.6 5.9 29.6 17.8 20.8 16.5 29.8 11.1 -5.0
281 6.1 20.3 -8.9 6.5 1.2 20.6 18.7 50.6 54.2 -17.6
289 16.3 25.2 -1.4 14.6 1.2 10.8 27.6 48.1 3.3 -1.6
291 2.7 11.8 3.9 6.1 7.2 14.6 5.9 22.0 25.6 -10.2
292 18.2 4.3 -8.4 3.8 16.1 22.1 11.3 20.8 8.9 -4.1
311 -4.2 7.0 4.7 12.3 3.2 11.5 12.7 1189.3 -1.0 0.5
313 16.7 -13.6 15.9 2.8 -16.7 5.5 23.7 15.5 37.1 -13.5
315 38.9 -16.6 -20.8 44.8 -1.5 3.3 28.8 22.3 31.8 -12.1
331 29.6 19.6 3.2 11.1 18.2 11.8 21.4 9.4 18.1 -7.7
359 42.0 10.2 1.9 7.9 10.1 15.7 27.9 38.2 -28.6 20.0
361 28.0 58.1 6.7 8.4 14.5 18.9 30.1 16.6 5.8 5.1
Source: computed from ASI

187
Figure- A.4.3.1 Annual Growth Rate of Energy Consumption of industrial sectors from
1998-99 to 2008-09
A.4.4 Sectoral Share of Output of industries
The changing pattern of the sectoral share of the each industry is given in the Table A.4.4.1
given below. The sectoral share of output of industries is in between 2% and 18%.The industries
232 and 242 contributes major share than all other industries.
This gives an idea of the changing pattern of the output share of the sub industries to the total
manufacturing industries. Here it is noticed that, the sectoral share of the output of the industries
changes over the period of time. This means output of an industry is an important determinant of
the energy intensity of the industry.
-80.00
-60.00
-40.00
-20.00
0.00
20.00
40.00
60.00
80.00
100.00
151 154 160 173 201 210 222 241 251 269 281 291 311 315 359
1999-2000
2000-01
2001-02
2002-03
2003-04
2004-05
2005-06
2006-07
2007-08
2008-09

188
Table- A.4.4.1 Sectoral Share of Output of the industrial sectors in India 1998-99 to 2008-09
(in percentage)
Year 98-99 1999-
2000
2000-
01
2001-
02
2002-
03
2003-
04
2004-
05
2005-
06
2006-
07
2007-
08
2008-
09
151 5.17 3.88 3.44 3.66 4.84 4.04 3.41 3.05 3.19 3.64 2.88
153 3.97 4.32 3.64 3.95 3.64 3.25 3.05 2.77 2.64 2.88 2.33
154 5.09 5.12 5.66 5.19 4.44 3.70 3.24 3.62 3.60 3.02 2.76
155 0.99 1.26 1.07 1.07 0.97 1.08 0.93 0.94 1.03 1.14 0.92
160 1.06 1.21 1.32 1.11 1.16 1.00 0.77 0.71 0.63 0.54 0.49
171 8.29 7.52 8.24 7.22 6.23 5.94 5.27 5.12 4.84 4.59 3.94
173 0.47 0.66 0.78 0.58 0.67 0.65 0.66 0.66 0.67 0.48 0.48
192 0.54 0.61 0.64 0.65 0.50 0.47 0.45 0.45 0.42 0.46 0.37
201 0.04 0.03 0.04 0.04 0.03 0.04 0.06 0.03 0.04 0.03 0.03
202 0.17 0.20 0.20 0.26 0.20 0.21 0.18 0.19 0.18 0.20 0.16
210 1.54 1.70 2.20 1.92 1.89 1.69 1.50 1.42 1.27 1.39 1.12
221 0.57 0.38 0.35 0.29 0.24 0.24 0.21 0.19 0.21 0.27 0.20
222 0.35 0.27 0.30 0.27 0.32 0.25 0.24 0.33 0.29 0.26 0.23
232 5.37 6.65 9.00 11.60 14.09 15.04 15.63 16.62 17.30 16.98 14.37
241 8.00 8.67 10.26 8.71 7.79 7.36 7.06 6.11 6.01 5.56 4.84
242 7.79 7.55 6.89 7.14 6.77 6.54 5.78 1.13 5.73 5.28 4.60
251 1.34 1.59 1.28 1.39 1.25 1.28 1.18 1.77 1.13 1.05 0.91
252 2.17 1.93 1.88 2.10 2.06 2.01 2.14 2.79 1.81 1.92 1.57
269 2.80 3.49 3.33 3.37 2.97 2.99 2.99 10.31 3.06 3.40 2.72
271 7.97 7.95 7.43 7.59 8.61 9.59 11.86 1.13 11.55 12.20 9.99
281 0.95 0.80 0.76 0.75 0.67 0.75 0.84 1.50 1.33 1.19 1.05
289 1.50 1.30 1.48 1.42 1.37 1.44 1.29 2.44 1.54 1.67 1.35
291 2.54 1.97 2.07 2.14 2.01 1.89 1.88 2.12 2.22 2.43 1.96
292 2.31 2.23 2.04 2.00 1.72 1.83 2.06 1.58 2.13 2.35 1.89
311 1.08 1.07 0.88 0.99 1.02 1.06 1.00 0.75 2.07 1.52 1.49
313 1.17 1.02 0.89 0.93 0.74 0.62 0.54 0.16 0.95 0.79 0.72
315 0.20 0.23 0.19 0.16 0.20 0.17 0.14 0.22 0.14 0.13 0.11
331 0.34 0.44 0.37 0.52 0.45 0.47 0.45 2.42 0.45 0.49 0.40
359 1.55 2.00 2.08 2.32 2.29 2.32 2.55 0.22 2.48 1.72 1.73
361 0.15 0.21 0.23 0.29 0.17 0.22 0.22 0.09 0.17 0.17 0.14
Source: Computed

189
Fig A.4.4.1 Sectoral Share of Output of the industrial sectors in India 1998-99 to2008-09
(in percentage)
A.4.5 Energy Intensity
Energy intensity is defined as the ratio of the total industrial energy consumption to industrial
output. Energy intensity and energy efficiency are inversely related. Energy intensities of all
industries taken for study shows the value less than one. The industry 269 had high energy
intensities than that of all other industries(Table A.4.5.1). For the better performance of
industries the energy intensity should be reduced.
0.00
2.00
4.00
6.00
8.00
10.00
12.00
14.00
16.00
18.00
20.00
151 154 160 173 201 210 222 241 251 269 281 291 311 315 359
98-99
1999-2000
2000-01
2001-02
2002-03
2003-04
2004-05
2005-06
2006-07
2007-08
2008-09

190
Table A.4.5.1 Energy intensities of industrial sectors of India from 1998-99 to 2008-09
Industry
Code
98-99 1999-
2000
2000-
01
2001-
02
2002-
03
2003-
04
2004-
05
2005-
06
2006-
07
2007-
08
2008-
09
151 0.028 0.036 0.038 0.035 0.026 0.029 0.029 0.033 0.032 0.026 0.028
153 0.024 0.030 0.034 0.033 0.033 0.034 0.033 0.035 0.033 0.028 0.030
154 0.031 0.032 0.032 0.035 0.037 0.042 0.043 0.039 0.037 0.039 0.038
155 0.044 0.041 0.062 0.060 0.059 0.055 0.054 0.051 0.046 0.042 0.044
160 0.010 0.011 0.013 0.012 0.012 0.014 0.014 0.016 0.015 0.015 0.015
171 0.090 0.123 0.121 0.119 0.130 0.124 0.121 0.118 0.120 0.112 0.116
173 0.022 0.027 0.026 0.027 0.033 0.035 0.034 0.034 0.049 0.047 0.048
192 0.024 0.027 0.031 0.042 0.039 0.037 0.038 0.035 0.034 0.028 0.030
201 0.024 0.033 0.024 0.029 0.032 0.028 0.019 0.026 0.019 0.021 0.020
202 0.041 0.065 0.065 0.062 0.060 0.068 0.067 0.059 0.066 0.049 0.057
210 0.160 0.179 0.142 0.151 0.148 0.142 0.134 0.127 0.121 0.117 0.119
221 0.016 0.029 0.038 0.049 0.050 0.050 0.051 0.054 0.045 0.040 0.042
222 0.034 0.044 0.043 0.054 0.042 0.042 0.043 0.035 0.038 0.037 0.037
232 0.034 0.027 0.017 0.009 0.003 0.011 0.012 0.014 0.013 0.011 0.012
241 0.088 0.111 0.114 0.132 0.129 0.121 0.108 0.117 0.106 0.102 0.104
242 0.038 0.052 0.047 0.045 0.045 0.044 0.042 0.224 0.040 0.039 0.039
251 0.065 0.066 0.074 0.066 0.070 0.066 0.061 0.039 0.059 0.057 0.057
252 0.045 0.057 0.065 0.064 0.056 0.060 0.055 0.035 0.050 0.049 0.050
269 0.249 0.262 0.243 0.255 0.254 0.256 0.238 0.064 0.212 0.198 0.204
271 0.122 0.132 0.146 0.146 0.142 0.132 0.102 1.054 0.109 0.097 0.103
281 0.026 0.032 0.039 0.035 0.035 0.028 0.024 0.013 0.019 0.019 0.019
289 0.054 0.071 0.077 0.076 0.076 0.065 0.063 0.036 0.069 0.056 0.061
291 0.025 0.032 0.033 0.032 0.031 0.031 0.028 0.022 0.021 0.021 0.021
292 0.022 0.027 0.030 0.027 0.027 0.027 0.023 0.028 0.020 0.017 0.018
311 0.018 0.017 0.021 0.019 0.018 0.016 0.014 0.018 0.070 0.008 0.041
313 0.021 0.027 0.026 0.028 0.031 0.027 0.026 0.093 0.014 0.020 0.017
315 0.062 0.073 0.072 0.065 0.064 0.065 0.063 0.024 0.070 0.085 0.078
331 0.020 0.019 0.027 0.019 0.021 0.020 0.019 0.004 0.017 0.016 0.016
359 0.026 0.028 0.029 0.026 0.024 0.023 0.019 0.241 0.024 0.021 0.022
361 0.028 0.024 0.035 0.028 0.043 0.034 0.032 0.041 0.022 0.039 0.031
Source: Computed

191
Figure A.4.5.1 Energy intensities of industrial sectors of India from 1998-99 to 2008-09
0.000
0.050
0.100
0.150
0.200
0.250
0.300
151 154 160 173 201 210 222 241 251 269 281 291 311 315 359
98-99
1999-2000
2000-01
2001-02
2002-03
2003-04
2004-05
2005-06
2006-07
2007-08
2008-09
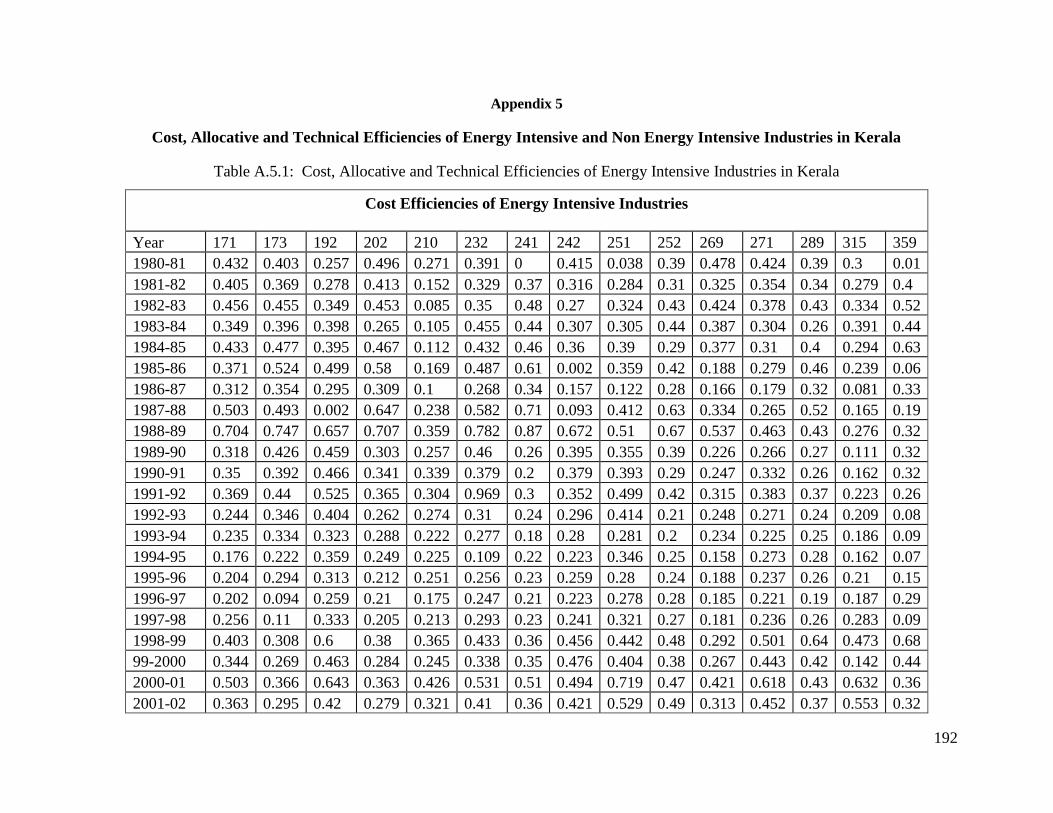
192
Appendix 5
Cost, Allocative and Technical Efficiencies of Energy Intensive and Non Energy Intensive Industries in Kerala
Table A.5.1: Cost, Allocative and Technical Efficiencies of Energy Intensive Industries in Kerala
Cost Efficiencies of Energy Intensive Industries
Year 171 173 192 202 210 232 241 242 251 252 269 271 289 315 359
1980-81 0.432 0.403 0.257 0.496 0.271 0.391 0 0.415 0.038 0.39 0.478 0.424 0.39 0.3 0.01
1981-82 0.405 0.369 0.278 0.413 0.152 0.329 0.37 0.316 0.284 0.31 0.325 0.354 0.34 0.279 0.4
1982-83 0.456 0.455 0.349 0.453 0.085 0.35 0.48 0.27 0.324 0.43 0.424 0.378 0.43 0.334 0.52
1983-84 0.349 0.396 0.398 0.265 0.105 0.455 0.44 0.307 0.305 0.44 0.387 0.304 0.26 0.391 0.44
1984-85 0.433 0.477 0.395 0.467 0.112 0.432 0.46 0.36 0.39 0.29 0.377 0.31 0.4 0.294 0.63
1985-86 0.371 0.524 0.499 0.58 0.169 0.487 0.61 0.002 0.359 0.42 0.188 0.279 0.46 0.239 0.06
1986-87 0.312 0.354 0.295 0.309 0.1 0.268 0.34 0.157 0.122 0.28 0.166 0.179 0.32 0.081 0.33
1987-88 0.503 0.493 0.002 0.647 0.238 0.582 0.71 0.093 0.412 0.63 0.334 0.265 0.52 0.165 0.19
1988-89 0.704 0.747 0.657 0.707 0.359 0.782 0.87 0.672 0.51 0.67 0.537 0.463 0.43 0.276 0.32
1989-90 0.318 0.426 0.459 0.303 0.257 0.46 0.26 0.395 0.355 0.39 0.226 0.266 0.27 0.111 0.32
1990-91 0.35 0.392 0.466 0.341 0.339 0.379 0.2 0.379 0.393 0.29 0.247 0.332 0.26 0.162 0.32
1991-92 0.369 0.44 0.525 0.365 0.304 0.969 0.3 0.352 0.499 0.42 0.315 0.383 0.37 0.223 0.26
1992-93 0.244 0.346 0.404 0.262 0.274 0.31 0.24 0.296 0.414 0.21 0.248 0.271 0.24 0.209 0.08
1993-94 0.235 0.334 0.323 0.288 0.222 0.277 0.18 0.28 0.281 0.2 0.234 0.225 0.25 0.186 0.09
1994-95 0.176 0.222 0.359 0.249 0.225 0.109 0.22 0.223 0.346 0.25 0.158 0.273 0.28 0.162 0.07
1995-96 0.204 0.294 0.313 0.212 0.251 0.256 0.23 0.259 0.28 0.24 0.188 0.237 0.26 0.21 0.15
1996-97 0.202 0.094 0.259 0.21 0.175 0.247 0.21 0.223 0.278 0.28 0.185 0.221 0.19 0.187 0.29
1997-98 0.256 0.11 0.333 0.205 0.213 0.293 0.23 0.241 0.321 0.27 0.181 0.236 0.26 0.283 0.09
1998-99 0.403 0.308 0.6 0.38 0.365 0.433 0.36 0.456 0.442 0.48 0.292 0.501 0.64 0.473 0.68
99-2000 0.344 0.269 0.463 0.284 0.245 0.338 0.35 0.476 0.404 0.38 0.267 0.443 0.42 0.142 0.44
2000-01 0.503 0.366 0.643 0.363 0.426 0.531 0.51 0.494 0.719 0.47 0.421 0.618 0.43 0.632 0.36
2001-02 0.363 0.295 0.42 0.279 0.321 0.41 0.36 0.421 0.529 0.49 0.313 0.452 0.37 0.553 0.32

193
2002-03 0.424 0.287 0.427 0.281 0.536 0.325 0.37 0.436 0.353 0.21 0.411 0.449 0.3 0.482 0.25
2003-04 0.251 0.188 0.271 0.154 0.218 0.289 0.25 0.253 0.335 0.29 0.207 0.268 0.29 0.257 0.21
2004-05 0.167 0.137 0.177 0.106 0.149 0.187 0.17 0.157 0.212 0.18 0.143 0.193 0.17 0.144 0.15
2005-06 0.263 0.206 0.278 0.156 0.238 0.265 0.25 0.283 0.298 0.29 0.24 0.293 0.24 0.267 0.24
2006-07 0.349 0.61 0.412 0.295 0.308 0.431 0.38 0.349 0.505 0.5 0.309 0.6 0.32 0.351 0.31
2007-08 0.518 0.863 0.833 0.571 0.609 0.692 0.47 0.474 0.748 0.47 0.448 0.649 0.49 0.651 0.24
2008-09 0.037 0.12 0.2 0.188 0.11 0.316 0.24 0.108 0.344 0.16 0.088 0.21 0.14 0.159 0.05
Mean 0.342 0.362 0.389 0.334 0.254 0.399 0.4 0.315 0.372 0.36 0.387 0.347 0.34 0.282 0.27
CV 38.75 49.01 42.19 44.48 48.83 44.95 45 44.66 39.33 36.5 39.01 37.38 33.5 52.99 62.8
Allocative Efficiencies of Energy Intensive Industries
Year 171 173 192 202 210 232 241 242 251 252 269 271 289 315 359
1980-81 0.45 0.494 0.257 0.544 0.271 0.42 0 0.464 0.312 0.4 0.478 0.441 0.44 0.329 0.02
1981-82 0.45 0.457 0.278 0.489 0.195 0.382 0.41 0.399 0.284 0.39 0.325 0.366 0.41 0.318 0.45
1982-83 0.519 0.578 0.349 0.563 0.128 0.441 0.48 0.316 0.324 0.45 0.424 0.419 0.46 0.383 0.52
1983-84 0.41 0.425 0.398 0.299 0.147 0.473 0.48 0.386 0.305 0.49 0.387 0.359 0.38 0.391 0.44
1984-85 0.506 0.577 0.395 0.661 0.112 0.491 0.52 0.377 0.39 0.41 0.377 0.406 0.47 0.294 0.63
1985-86 0.667 0.818 0.499 0.797 0.169 0.611 0.79 0.032 0.404 0.59 0.26 0.401 0.62 0.287 0.27
1986-87 0.337 0.38 0.295 0.38 0.1 0.29 0.34 0.186 0.128 0.29 0.166 0.219 0.34 0.102 0.33
1987-88 0.704 0.738 0.445 0.802 0.331 0.675 0.71 0.093 0.412 0.7 0.448 0.458 0.69 0.317 0.27
1988-89 0.9 0.961 0.657 0.972 0.359 0.849 0.87 0.672 0.51 0.71 0.685 0.624 0.57 0.514 0.32
1989-90 0.362 0.479 0.462 0.409 0.257 0.46 0.28 0.395 0.376 0.42 0.245 0.352 0.35 0.171 0.38
1990-91 0.405 0.563 0.472 0.494 0.339 0.379 0.2 0.452 0.456 0.4 0.247 0.392 0.39 0.236 0.41
1991-92 0.765 0.717 0.539 0.786 0.841 0.969 0.77 0.726 0.668 0.63 0.845 0.634 0.77 0.898 0.85
1992-93 0.333 0.465 0.404 0.356 0.274 0.31 0.24 0.349 0.414 0.28 0.248 0.409 0.37 0.275 0.11
1993-94 0.325 0.391 0.392 0.407 0.222 0.277 0.19 0.317 0.366 0.28 0.234 0.344 0.34 0.257 0.14
1994-95 0.292 0.222 0.359 0.327 0.225 0.112 0.22 0.258 0.348 0.28 0.158 0.313 0.31 0.234 0.07
1995-96 0.25 0.342 0.313 0.281 0.251 0.256 0.25 0.273 0.285 0.26 0.188 0.29 0.3 0.28 0.16
1996-97 0.289 0.121 0.273 0.341 0.175 0.247 0.21 0.263 0.287 0.33 0.185 0.28 0.29 0.284 0.36

194
1997-98 0.355 0.169 0.362 0.397 0.225 0.293 0.23 0.245 0.34 0.36 0.253 0.309 0.36 0.406 0.09
1998-99 0.654 0.499 0.607 0.69 0.43 0.433 0.53 0.601 0.63 0.65 0.292 0.58 0.64 0.796 0.68
99-2000 0.41 0.662 0.463 0.508 0.348 0.338 0.41 0.476 0.452 0.87 0.267 0.443 0.43 0.313 0.7
2000-01 0.678 0.585 0.643 0.626 0.426 0.531 0.51 0.515 0.719 0.67 0.578 0.618 0.76 0.632 0.47
2001-02 0.564 0.483 0.42 0.485 0.336 0.41 0.36 0.457 0.539 0.58 0.32 0.462 0.6 0.553 0.46
2002-03 0.582 0.489 0.693 0.317 0.536 0.361 0.42 0.489 0.575 0.29 0.46 0.449 0.34 0.53 0.25
2003-04 0.344 0.403 0.271 0.308 0.224 0.289 0.25 0.282 0.335 0.4 0.348 0.305 0.4 0.257 0.28
2004-05 0.225 0.34 0.291 0.319 0.254 0.187 0.21 0.277 0.212 0.26 0.322 0.199 0.27 0.164 0.21
2005-06 0.373 0.416 0.278 0.249 0.253 0.265 0.25 0.283 0.329 0.36 0.31 0.307 0.36 0.267 0.27
2006-07 0.464 0.646 0.48 0.466 0.308 0.431 0.38 0.365 0.505 0.53 0.309 0.6 0.47 0.351 0.41
2007-08 0.79 0.919 0.833 0.818 0.753 0.692 0.49 0.656 0.748 0.79 0.448 0.649 0.49 0.651 0.3
2008-09 0.072 0.207 0.264 0.28 0.161 0.316 0.26 0.124 0.344 0.24 0.1 0.234 0.19 0.159 0.05
Mean 0.464 0.501 0.427 0.495 0.298 0.42 0.42 0.37 0.413 0.46 0.341 0.409 0.44 0.367 0.34
CV 41.08 40.97 34.49 39.83 57.39 45.42 45.4 45.37 35.77 39 47.2 31.57 33.5 51.67 60.2
Technical Efficiencies of Energy Intensive Industries
Year 171 173 192 202 210 232 241 242 251 252 269 271 289 315 359
1980-81 0.959 0.815 1 0.91 1 0.931 0.75 0.894 0.122 0.98 1 0.962 0.9 0.914 0.5
1981-82 0.902 0.808 1 0.844 0.78 0.862 0.9 0.79 1 0.79 1 0.967 0.83 0.879 0.9
1982-83 0.878 0.787 1 0.805 0.66 0.793 1 0.856 1 0.96 1 0.9 0.93 0.872 1
1983-84 0.852 0.93 1 0.886 0.71 0.961 0.92 0.797 1 0.91 1 0.846 0.66 1 1
1984-85 0.855 0.826 1 0.707 1 0.88 0.88 0.953 1 0.72 1 0.764 0.85 1 1
1985-86 0.556 0.641 1 0.727 1 0.797 0.77 0.069 0.889 0.71 0.722 0.696 0.74 0.834 0.23
1986-87 0.925 0.933 1 0.814 1 0.923 0.98 0.844 0.954 0.98 1 0.817 0.95 0.794 1
1987-88 0.714 0.669 0.004 0.806 0.718 0.862 1 1 1 0.9 0.746 0.577 0.76 0.519 0.72
1988-89 0.783 0.778 1 0.727 1 0.921 1 1 1 0.94 0.784 0.742 0.76 0.537 1
1989-90 0.878 0.89 0.995 0.742 1 1 0.92 1 0.944 0.93 0.922 0.758 0.79 0.648 0.84
1990-91 0.863 0.695 0.988 0.691 1 1 1 0.838 0.862 0.74 1 0.847 0.67 0.685 0.78
1991-92 0.482 0.613 0.973 0.465 0.361 1 0.38 0.484 0.747 0.66 0.373 0.604 0.48 0.248 0.31

195
1992-93 0.733 0.744 1 0.735 1 1 1 0.847 1 0.76 1 0.663 0.66 0.761 0.73
1993-94 0.723 0.855 0.825 0.707 1 1 0.95 0.883 0.766 0.73 1 0.656 0.74 0.727 0.67
1994-95 0.605 1 1 0.759 1 0.972 1 0.864 0.993 0.89 1 0.873 0.92 0.694 1
1995-96 0.817 0.86 1 0.756 1 1 0.92 0.948 0.981 0.92 1 0.817 0.89 0.752 0.96
1996-97 0.699 0.776 0.948 0.616 1 1 1 0.848 0.969 0.86 1 0.789 0.67 0.658 0.81
1997-98 0.721 0.654 0.92 0.517 0.946 1 1 0.984 0.944 0.73 0.716 0.764 0.74 0.696 0.98
1998-99 0.617 0.618 0.989 0.551 0.85 1 0.69 0.759 0.702 0.74 1 0.864 1 0.594 1
99-2000 0.84 0.407 1 0.559 0.704 1 0.87 1 0.894 0.44 1 1 0.98 0.453 0.63
2000-01 0.741 0.626 1 0.581 1 1 1 0.959 1 0.71 0.729 1 0.56 1 0.77
2001-02 0.642 0.611 1 0.574 0.956 1 1 0.921 0.981 0.84 0.979 0.979 0.62 1 0.68
2002-03 0.728 0.587 0.616 0.885 1 0.902 0.87 0.891 0.614 0.74 0.893 1 0.89 0.909 1
2003-04 0.728 0.466 1 0.501 0.973 1 1 0.895 1 0.73 0.595 0.878 0.71 1 0.73
2004-05 0.743 0.403 0.608 0.333 0.587 1 0.83 0.568 1 0.71 0.443 0.967 0.62 0.877 0.72
2005-06 0.707 0.495 1 0.63 0.941 1 1 1 0.906 0.82 0.774 0.955 0.65 1 0.91
2006-07 0.752 0.944 0.858 0.633 1 1 1 0.954 1 0.93 1 1 0.69 1 0.76
2007-08 0.656 0.938 1 0.697 0.809 1 0.96 0.722 1 0.59 1 1 1 1 0.8
2008-09 0.509 0.579 0.758 0.671 0.685 1 0.92 0.865 1 0.66 0.877 0.898 0.72 1 0.98
Mean 0.745 0.722 0.913 0.683 0.885 0.958 0.96 0.842 0.905 0.79 0.881 0.847 0.77 0.794 0.81
CV 16.29 23.09 21.21 20.02 18.86 6.71 6.71 22.86 20.14 16.2 20.16 15.09 17.8 25.04 25.4

196
Table A.5.2: Cost, Allocative and Technical Efficiencies of Non Energy Intensive Industries in Kerala
Cost efficiencies of non-energy intensive Industries
Year 151 153 154 155 160 201 221 222 281 291 292 311 313 331 361
1980-81 0.564 0.51 0.49 0.356 1 0.318 0.094 0.224 0.207 0.468 0.064 0.332 0.429 0.151 0.395
1981-82 0.493 0.45 0.41 0.314 1 0.36 0.363 0.297 0.298 0.347 0.258 0.306 0.382 0.401 0.328
1982-83 0.546 0.47 0.43 0.362 1 0.313 0.388 0.495 0.297 0.201 0.298 0.249 0.361 0.403 0.408
1983-84 0.541 0.47 0.48 0.219 1 0.462 0.365 0.406 0.356 0.639 0.236 0.229 0.18 0.329 0.291
1984-85 0.584 0.43 0.49 0.403 1 0.259 0.414 0.397 0.247 0.35 0.263 0.27 0.207 0.272 0.316
1985-86 0.901 0.42 0.58 0.568 1 0.448 0.495 0.315 0.282 0.446 0.34 0.297 0.328 0.33 0.39
1986-87 0.38 0.38 0.38 0.309 1 0.196 0.309 0.334 0.299 0.233 0.191 0.238 0.253 0.172 0.174
1987-88 0.703 0.55 0.61 0.57 1 0.35 0.551 0.883 0.412 0.594 0.362 0.509 0.724 0.407 0.385
1988-89 0.938 0.82 0.78 0.775 1 0.542 0.738 1 0.664 0.925 0.46 0.675 0.617 0.597 0.496
1989-90 0.457 0.37 0.43 0.308 1 0.379 0.384 0.467 0.269 0.39 0.348 0.373 0.351 0.288 0.282
1990-91 0.441 0.4 0.48 0.361 1 0.422 0.343 0.451 0.344 0.555 0.355 0.416 0.493 0.307 0.265
1991-92 0.495 0.42 0.55 0.434 1 0.435 0.381 0.512 0.375 0.51 0.438 0.582 0.269 0.358 0.261
1992-93 0.301 0.32 0.37 0.345 1 0.342 0.298 0.31 0.271 0.348 0.254 0.346 0.207 0.276 0.152
1993-94 0.304 0.29 0.34 0.421 1 0.285 0.33 0.295 0.173 0.31 0.28 0.318 0.16 0.271 0.248
1994-95 0.251 0.23 0.26 0.267 1 0.342 0.323 0.23 0.313 0.319 0.302 0.32 0.394 0.257 0.233
1995-96 0.256 0.3 0.25 0.277 1 0.306 0.277 0.239 0.261 0.246 0.311 0.289 0.153 0.234 0.251
1996-97 0.24 0.28 0.25 0.192 1 0.291 0.349 0.305 0.348 0.276 0.377 0.283 0.12 0.274 0.195
1997-98 0.337 0.29 0.35 0.305 1 0.302 0.32 0.377 0.271 0.361 0.458 0.24 0.15 0.32 0.232
1998-99 0.479 0.58 0.51 0.414 1 0.547 0.598 0.462 0.472 0.525 0.526 0.587 0.633 0.441 0.598
99-2000 0.385 0.41 0.42 0.518 1 0.401 0.532 0.733 0.389 0.446 0.336 0.299 0.4 0.373 0.333
2000-01 0.656 0.71 0.63 0.519 1 0.571 0.644 0.723 0.576 0.456 0.471 0.489 0.601 0.551 0.397
2001-02 0.389 0.52 0.5 0.385 1 0.409 0.586 0.637 0.455 0.302 0.429 0.574 0.316 0.391 0.264
2002-03 0.431 0.41 0.45 0.31 1 0.352 0.772 0.4 0.382 0.359 0.462 0.292 0.254 0.421 0.261
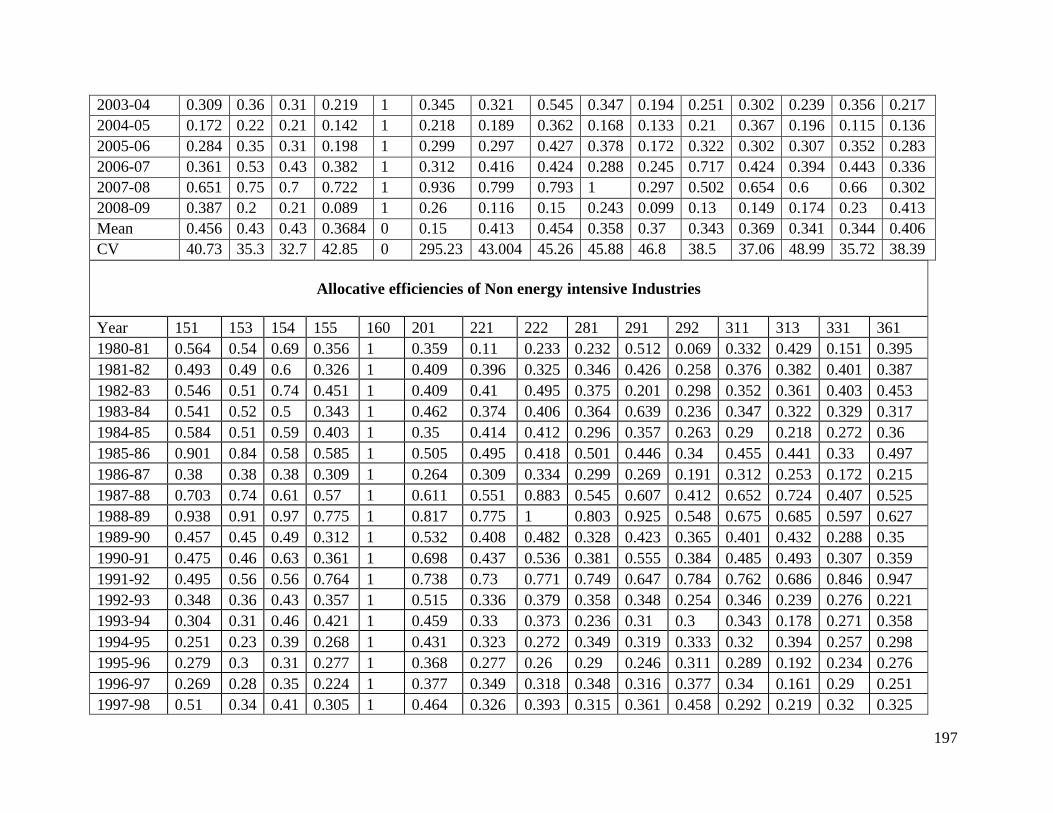
197
2003-04 0.309 0.36 0.31 0.219 1 0.345 0.321 0.545 0.347 0.194 0.251 0.302 0.239 0.356 0.217
2004-05 0.172 0.22 0.21 0.142 1 0.218 0.189 0.362 0.168 0.133 0.21 0.367 0.196 0.115 0.136
2005-06 0.284 0.35 0.31 0.198 1 0.299 0.297 0.427 0.378 0.172 0.322 0.302 0.307 0.352 0.283
2006-07 0.361 0.53 0.43 0.382 1 0.312 0.416 0.424 0.288 0.245 0.717 0.424 0.394 0.443 0.336
2007-08 0.651 0.75 0.7 0.722 1 0.936 0.799 0.793 1 0.297 0.502 0.654 0.6 0.66 0.302
2008-09 0.387 0.2 0.21 0.089 1 0.26 0.116 0.15 0.243 0.099 0.13 0.149 0.174 0.23 0.413
Mean 0.456 0.43 0.43 0.3684 0 0.15 0.413 0.454 0.358 0.37 0.343 0.369 0.341 0.344 0.406
CV 40.73 35.3 32.7 42.85 0 295.23 43.004 45.26 45.88 46.8 38.5 37.06 48.99 35.72 38.39
Allocative efficiencies of Non energy intensive Industries
Year 151 153 154 155 160 201 221 222 281 291 292 311 313 331 361
1980-81 0.564 0.54 0.69 0.356 1 0.359 0.11 0.233 0.232 0.512 0.069 0.332 0.429 0.151 0.395
1981-82 0.493 0.49 0.6 0.326 1 0.409 0.396 0.325 0.346 0.426 0.258 0.376 0.382 0.401 0.387
1982-83 0.546 0.51 0.74 0.451 1 0.409 0.41 0.495 0.375 0.201 0.298 0.352 0.361 0.403 0.453
1983-84 0.541 0.52 0.5 0.343 1 0.462 0.374 0.406 0.364 0.639 0.236 0.347 0.322 0.329 0.317
1984-85 0.584 0.51 0.59 0.403 1 0.35 0.414 0.412 0.296 0.357 0.263 0.29 0.218 0.272 0.36
1985-86 0.901 0.84 0.58 0.585 1 0.505 0.495 0.418 0.501 0.446 0.34 0.455 0.441 0.33 0.497
1986-87 0.38 0.38 0.38 0.309 1 0.264 0.309 0.334 0.299 0.269 0.191 0.312 0.253 0.172 0.215
1987-88 0.703 0.74 0.61 0.57 1 0.611 0.551 0.883 0.545 0.607 0.412 0.652 0.724 0.407 0.525
1988-89 0.938 0.91 0.97 0.775 1 0.817 0.775 1 0.803 0.925 0.548 0.675 0.685 0.597 0.627
1989-90 0.457 0.45 0.49 0.312 1 0.532 0.408 0.482 0.328 0.423 0.365 0.401 0.432 0.288 0.35
1990-91 0.475 0.46 0.63 0.361 1 0.698 0.437 0.536 0.381 0.555 0.384 0.485 0.493 0.307 0.359
1991-92 0.495 0.56 0.56 0.764 1 0.738 0.73 0.771 0.749 0.647 0.784 0.762 0.686 0.846 0.947
1992-93 0.348 0.36 0.43 0.357 1 0.515 0.336 0.379 0.358 0.348 0.254 0.346 0.239 0.276 0.221
1993-94 0.304 0.31 0.46 0.421 1 0.459 0.33 0.373 0.236 0.31 0.3 0.343 0.178 0.271 0.358
1994-95 0.251 0.23 0.39 0.268 1 0.431 0.323 0.272 0.349 0.319 0.333 0.32 0.394 0.257 0.298
1995-96 0.279 0.3 0.31 0.277 1 0.368 0.277 0.26 0.29 0.246 0.311 0.289 0.192 0.234 0.276
1996-97 0.269 0.28 0.35 0.224 1 0.377 0.349 0.318 0.348 0.316 0.377 0.34 0.161 0.29 0.251
1997-98 0.51 0.34 0.41 0.305 1 0.464 0.326 0.393 0.315 0.361 0.458 0.292 0.219 0.32 0.325
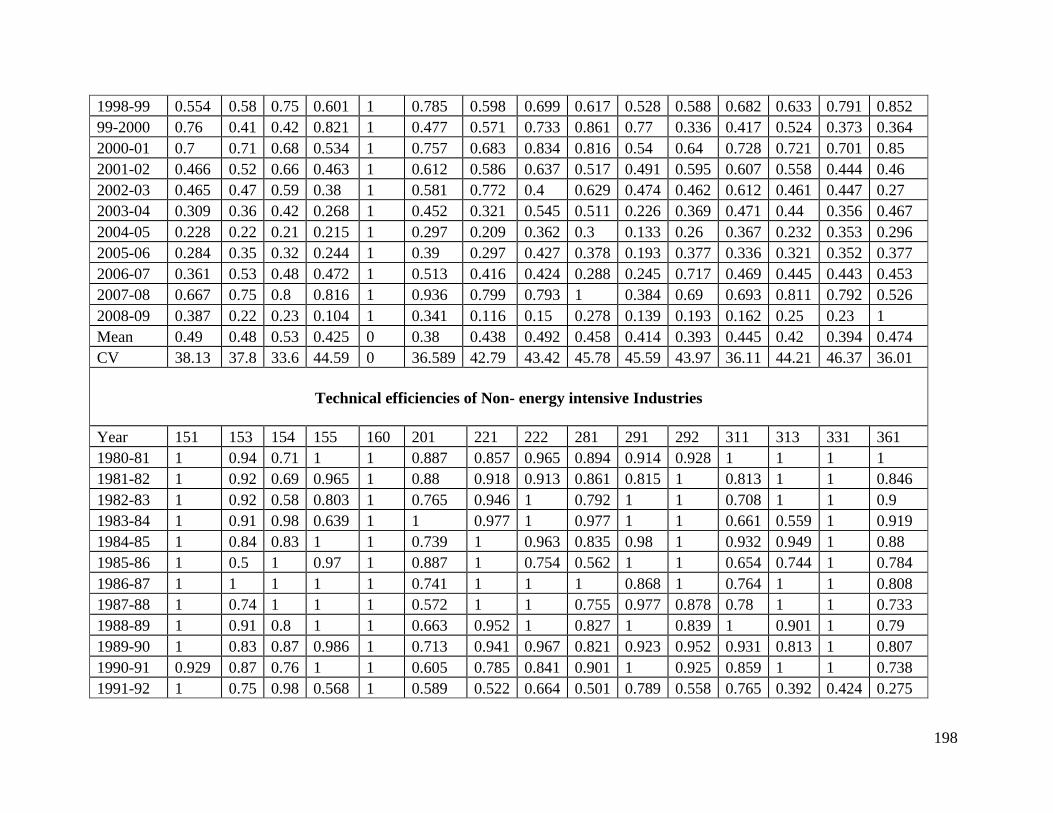
198
1998-99 0.554 0.58 0.75 0.601 1 0.785 0.598 0.699 0.617 0.528 0.588 0.682 0.633 0.791 0.852
99-2000 0.76 0.41 0.42 0.821 1 0.477 0.571 0.733 0.861 0.77 0.336 0.417 0.524 0.373 0.364
2000-01 0.7 0.71 0.68 0.534 1 0.757 0.683 0.834 0.816 0.54 0.64 0.728 0.721 0.701 0.85
2001-02 0.466 0.52 0.66 0.463 1 0.612 0.586 0.637 0.517 0.491 0.595 0.607 0.558 0.444 0.46
2002-03 0.465 0.47 0.59 0.38 1 0.581 0.772 0.4 0.629 0.474 0.462 0.612 0.461 0.447 0.27
2003-04 0.309 0.36 0.42 0.268 1 0.452 0.321 0.545 0.511 0.226 0.369 0.471 0.44 0.356 0.467
2004-05 0.228 0.22 0.21 0.215 1 0.297 0.209 0.362 0.3 0.133 0.26 0.367 0.232 0.353 0.296
2005-06 0.284 0.35 0.32 0.244 1 0.39 0.297 0.427 0.378 0.193 0.377 0.336 0.321 0.352 0.377
2006-07 0.361 0.53 0.48 0.472 1 0.513 0.416 0.424 0.288 0.245 0.717 0.469 0.445 0.443 0.453
2007-08 0.667 0.75 0.8 0.816 1 0.936 0.799 0.793 1 0.384 0.69 0.693 0.811 0.792 0.526
2008-09 0.387 0.22 0.23 0.104 1 0.341 0.116 0.15 0.278 0.139 0.193 0.162 0.25 0.23 1
Mean 0.49 0.48 0.53 0.425 0 0.38 0.438 0.492 0.458 0.414 0.393 0.445 0.42 0.394 0.474
CV 38.13 37.8 33.6 44.59 0 36.589 42.79 43.42 45.78 45.59 43.97 36.11 44.21 46.37 36.01
Technical efficiencies of Non- energy intensive Industries
Year 151 153 154 155 160 201 221 222 281 291 292 311 313 331 361
1980-81 1 0.94 0.71 1 1 0.887 0.857 0.965 0.894 0.914 0.928 1 1 1 1
1981-82 1 0.92 0.69 0.965 1 0.88 0.918 0.913 0.861 0.815 1 0.813 1 1 0.846
1982-83 1 0.92 0.58 0.803 1 0.765 0.946 1 0.792 1 1 0.708 1 1 0.9
1983-84 1 0.91 0.98 0.639 1 1 0.977 1 0.977 1 1 0.661 0.559 1 0.919
1984-85 1 0.84 0.83 1 1 0.739 1 0.963 0.835 0.98 1 0.932 0.949 1 0.88
1985-86 1 0.5 1 0.97 1 0.887 1 0.754 0.562 1 1 0.654 0.744 1 0.784
1986-87 1 1 1 1 1 0.741 1 1 1 0.868 1 0.764 1 1 0.808
1987-88 1 0.74 1 1 1 0.572 1 1 0.755 0.977 0.878 0.78 1 1 0.733
1988-89 1 0.91 0.8 1 1 0.663 0.952 1 0.827 1 0.839 1 0.901 1 0.79
1989-90 1 0.83 0.87 0.986 1 0.713 0.941 0.967 0.821 0.923 0.952 0.931 0.813 1 0.807
1990-91 0.929 0.87 0.76 1 1 0.605 0.785 0.841 0.901 1 0.925 0.859 1 1 0.738
1991-92 1 0.75 0.98 0.568 1 0.589 0.522 0.664 0.501 0.789 0.558 0.765 0.392 0.424 0.275

199
1992-93 0.864 0.88 0.86 0.967 1 0.663 0.889 0.818 0.758 0.999 1 1 0.867 1 0.685
1993-94 1 0.93 0.74 1 1 0.622 1 0.792 0.733 1 0.934 0.927 0.901 1 0.693
1994-95 1 1 0.67 0.997 1 0.794 0.999 0.845 0.895 1 0.906 1 1 1 0.781
1995-96 0.919 1 0.82 1 1 0.832 1 0.919 0.9 1 1 1 0.795 1 0.912
1996-97 0.893 1 0.7 0.855 1 0.77 1 0.958 1 0.873 1 0.834 0.745 0.947 0.774
1997-98 0.661 0.86 0.84 1 1 0.651 0.984 0.958 0.862 1 1 0.822 0.686 1 0.714
1998-99 0.864 1 0.68 0.689 1 0.697 1 0.66 0.765 0.994 0.895 0.86 1 0.558 0.702
99-2000 0.507 1 1 0.631 1 0.84 0.931 1 0.452 0.579 1 0.716 0.764 1 0.913
2000-01 0.937 1 0.92 0.973 1 0.754 0.943 0.867 0.707 0.844 0.735 0.672 0.834 0.785 0.467
2001-02 0.836 1 0.75 0.833 1 0.668 1 1 0.88 0.615 0.721 0.947 0.566 0.88 0.575
2002-03 0.927 0.88 0.76 0.816 1 0.605 1 1 0.608 0.757 1 0.477 0.551 0.942 0.964
2003-04 1 1 0.74 0.82 1 0.765 1 1 0.679 0.859 0.68 0.641 0.544 1 0.465
2004-05 0.754 1 1 0.661 1 0.732 0.901 1 0.56 1 0.806 1 0.847 0.327 0.46
2005-06 1 1 0.97 0.812 1 0.767 1 1 1 0.887 0.854 0.898 0.956 1 0.752
2006-07 1 1 0.9 0.809 1 0.608 1 1 1 1 1 0.903 0.885 1 0.741
2007-08 0.977 1 0.87 0.885 1 1 1 1 1 0.775 0.728 0.944 0.74 0.833 0.574
2008-09 1 0.93 0.92 0.848 1 0.763 1 1 0.874 0.715 0.67 0.917 0.697 1 1
Mean 0.933 0.92 0.84 0.88 1 0.528 0.949 0.927 0.806 0.902 0.896 0.842 0.818 0.92 0.858
CV 12.59 12.1 14.8 15.41 0 32.45 10.3 11.21 19.37 13.61 14.24 16.31 21.08 19.38 8.44

200
Appendix 6
Table A.6.1 TE, AE and CE in Ascending Order in the Decades of 1980‟s 90‟s and 2000
Year te Year ae
Year ce
1985-86 0.774 1986-87 0.298 1986-87 0.282
1987-88 0.815 1980-81 0.376 1980-81 0.343
1988-89 0.889 1989-90 0.404 1981-82 0.364
1980-81 0.891 1981-82 0.407 1989-90 0.364
1989-90 0.894 1983-84 0.415 1983-84 0.381
1981-82 0.896 1984-85 0.431 1984-85 0.391
1982-83 0.896 1982-83 0.445 1982-83 0.399
1983-84 0.903 1985-86 0.518 1985-86 0.413
1984-85 0.913 1987-88 0.578 1987-88 0.480
1986-87 0.936 1988-89 0.740 1988-89 0.658
Mean 0.881 0.461 0.408
Year te Year ae Year
1991-92 0.599 1995-96 0.296 1996-97 0.268
99-2000 0.803 1994-95 0.305 1995-96 0.275
1998-99 0.811 1996-97 0.306 1994-95 0.279
1997-98 0.845 1993-94 0.338 1993-94 0.288
1993-94 0.850 1997-98 0.348 1997-98 0.294
1990-91 0.862 1992-93 0.353 1992-93 0.306
1992-93 0.863 1990-91 0.447 1990-91 0.383
1996-97 0.866 99-2000 0.531 99-2000 0.408
1994-95 0.915 1998-99 0.632 1991-92 0.437
1995-96 0.924 1991-92 0.748 1998-99 0.506
Mean 0.834 0.430 0.344
Year te Year ae
Year ce
2004-05 0.749 2004-05 0.281 2004-05 0.209
2003-04 0.813 2005-06 0.341 2003-04 0.301
2002-03 0.827 2003-04 0.374 2005-06 0.303
2001-02 0.835 2006-07 0.466 2002-03 0.403
2000-01 0.837 2002-03 0.493 2006-07 0.424
2007-08 0.883 2001-02 0.521 2001-02 0.435
2005-06 0.890 2000-01 0.662 2000-01 0.550
2006-07 0.912 2007-08 0.715 2007-08 0.635
Mean 0.843 0.482 0.408