appendices to klamath river nutrient loading and …
TRANSCRIPT

APPENDICES TO
KLAMATH RIVER NUTRIENT LOADING AND RETENTION DYNAMICS IN FREE-FLOWING REACHES, 2005-2008
PREPARED FOR THE
YUROK TRIBE ENVIRONMENTAL PROGRAM
BY
ELI ASARIAN KIER ASSOCIATES EUREKA, CALIFORNIA
JACOB KANN, PH.D. AQUATIC ECOSYSTEM SCIENCES LLC
ASHLAND, OREGON
WILLIAM W. WALKER, PH.D. ENVIRONMENTAL ENGINEER
CONCORD, MASSACHUSETTS
Citation: Asarian, E. J. Kann, and W. Walker. 2010. Klamath River Nutrient Loading and Retention Dynamics in Free-
Flowing Reaches, 2005-2008. Final Technical Report to the Yurok Tribe Environmental Program, Klamath, CA. 59pp + appendices.

__________________________________________________________________________________ Appendices - Klamath Nutrient Loading & Retention Dynamics in Free-Flowing Reaches 2005-2008, Prepared by Kier Associates, Aquatic Ecosystem Sciences, & W. Walker for the Yurok Tribe, June 2010 A-1
APPENDICES
A1. Coefficients from multiple regression model A2. Comparison of results of five methods for calculating nutrient loads A3. Table with complete seasonal summaries of budget components for all parameters and reaches A4. Scatterplots showing the relationship between reach inflow nutrient concentration and retention for June-October periods A5. Charts showing daily time series and summaries of outputs from multiple regression model used to predict concentrations for each station

__________________________________________________________________________________ Appendices - Klamath Nutrient Loading & Retention Dynamics in Free-Flowing Reaches 2005-2008, Prepared by Kier Associates, Aquatic Ecosystem Sciences, & W. Walker for the Yurok Tribe, June 2010 A-2
APPENDIX A1
Coefficients from multiple regression model used to calculate daily loads
Table A1. Standard error, coefficient of determination (R2) and regression coefficients for each station for total phosphorus. See methods section for predictive equation and explanation of regression coefficients.
Site
Var
iabl
e
Reg
ress
ion
Sta
ndar
d E
rror
Reg
ress
ion
R
2 B10 B9 B8 B7 B6 B5 B4 B3 B2 B1 B0
KR_bel_Keno TP 27.5% 0.63 1.0594 -0.0838 336.3990 -0.0427 0.3685 -0.2240 -0.0398 0.0820 -0.1132 -0.2256 -337704.255 KR_bel_Keno SRP 75.4% 0.40 2.5289 -0.2665 1070.1161 0.0139 0.3540 -0.4070 -0.3137 0.5270 -2.1707 2.3964 -1074114.528 KR_bel_Keno PP 32.8% 0.54 0.4176 -0.0089 35.8372 0.0624 0.4622 0.1308 0.1028 -0.0541 0.3999 -0.8366 -36088.345 KR_bel_Keno TN 19.7% 0.85 -0.0929 -0.0037 14.9055 0.1430 0.3829 0.3161 -0.2454 -0.1014 0.3501 -0.5270 -14971.305 KR_bel_Keno INORGN 69.2% 0.68 1.0952 -0.1497 601.0229 -0.0787 0.5823 0.7252 -0.5221 0.1181 -0.0640 -0.7423 -603111.862 KR_bel_Keno NH4N 90.5% 0.70 2.1412 -0.2091 839.2612 0.1062 0.5713 0.5875 -1.2499 0.1390 0.1106 -1.0930 -842302.299 KR_bel_Keno NO23N 87.0% 0.52 0.5260 0.0503 -202.1815 -0.0345 -0.2166 1.4168 0.6781 0.4652 -2.3741 3.1137 203060.317 KR_bel_Keno ORGN 21.5% 0.75 -0.2878 -0.0089 35.7004 0.0860 0.3294 0.0653 -0.1558 -0.1842 0.6745 -0.8329 -35889.163
KR_abv_Copco TP 19.4% 0.74 -0.2875 -0.0291 116.9768 -0.1162 0.2481 -0.1999 -0.0247 0.1343 -0.4069 0.1845 -117449.241 KR_abv_Copco TN 15.3% 0.81 -0.2070 0.0274 -109.9051 0.0354 0.2446 0.2763 -0.2481 0.0191 -0.1140 0.2719 110254.271
KR_bel_IGD TP 13.3% 0.80 0.0970 -0.0274 109.8648 -0.1238 0.0240 -0.1724 -0.3957 0.1905 -0.9059 1.4729 -110314.319 KR_bel_IGD SRP 23.3% 0.81 -0.8591 -0.0148 59.3575 0.0716 -0.2651 -0.4134 -0.9546 0.2079 -0.9077 1.3586 -59637.976 KR_bel_IGD PP 40.5% 0.42 -0.9597 -0.0235 94.5423 -0.2532 0.2013 0.0207 0.1269 -0.3111 2.1819 -4.3158 -94929.836 KR_bel_IGD TN 16.1% 0.79 0.4895 0.0233 -93.3879 0.0283 0.0772 0.4278 -0.1554 -0.0544 0.2559 -0.3310 93712.047 KR_bel_IGD INORGN 39.3% 0.71 0.6846 0.1425 -572.1435 0.1006 -0.0286 0.9336 -0.0455 -0.0803 0.5692 -1.3788 574143.054 KR_bel_IGD NH4N 58.6% 0.62 1.0366 0.0719 -288.4226 0.3600 -0.1751 1.0316 -0.1757 -0.0670 0.1695 0.4106 289425.757 KR_bel_IGD NO23N 41.0% 0.69 0.8153 0.1663 -667.4563 0.0572 -0.0160 0.9156 -0.0034 -0.0191 0.2910 -1.1410 669796.661 KR_bel_IGD ORGN 16.6% 0.57 0.2745 -0.0130 52.1531 -0.0351 0.1403 0.1779 -0.1367 -0.0032 -0.0872 0.4169 -52337.270
KR_Walker TP 8.6% 0.94 1.7693 0.0180 0.0000 -2.9638 1.0299 -9.9759 13.7273 -0.3381 -0.0555 2.0185 -72484.603 KR_Walker SRP 7.5% 0.95 0.6059 0.0235 0.0000 -3.5395 0.5866 -14.1386 16.1855 5.7434 -23.8813 32.2761 -94928.537 KR_Walker PP 38.9% 0.81 8.3602 0.0563 0.0000 -9.3462 2.2577 -34.0003 41.5044 0.0095 -5.7933 15.8604 -227101.708 KR_Walker TN 10.4% 0.92 0.7356 -0.0010 0.0000 -0.2700 0.0418 0.9942 0.0205 -3.1823 11.7319 -14.1623 3975.924 KR_Walker INORGN 15.5% 0.96 1.7517 -0.0038 0.0000 1.0779 0.6513 6.1075 -1.0625 -1.9311 9.4261 -15.7682 15525.828 KR_Walker NH4N 54.5% 0.55 2.9632 0.0755 0.0000 -11.0771 8.1905 -25.8283 73.1882 -30.2437 122.6958 -168.4336 -304327.622 KR_Walker NO23N 17.3% 0.95 1.6768 -0.0076 0.0000 1.6465 0.2577 7.5091 -4.7471 0.1437 0.9475 -4.2044 30846.900

__________________________________________________________________________________ Appendices - Klamath Nutrient Loading & Retention Dynamics in Free-Flowing Reaches 2005-2008, Prepared by Kier Associates, Aquatic Ecosystem Sciences, & W. Walker for the Yurok Tribe, June 2010 A-3
Site
Var
iabl
e
Reg
ress
ion
Sta
ndar
d E
rror
Reg
ress
ion
R
2
B10 B9 B8 B7 B6 B5 B4 B3 B2 B1 B0
KR_Walker ORGN 15.5% 0.69 0.2889 0.0049 0.0000 -1.4955 0.1611 -3.2792 4.4194 -2.8775 9.4904 -9.7903 -19789.403 KR_Seiad TP 17.5% 0.80 -1.0031 -0.0500 200.8036 -0.2294 -0.5754 -1.2777 -1.3288 0.1064 -0.2951 -0.0849 -201611.793 KR_Seiad SRP 18.3% 0.84 -0.1840 -0.0135 54.2341 -0.2404 -0.5651 -1.3093 -1.3799 0.0799 -0.4865 0.7725 -54475.914 KR_Seiad PP 37.4% 0.41 -2.3261 -0.0676 271.6217 -0.1009 -0.3825 -0.7548 -0.9375 -0.1690 1.8183 -4.5997 -272717.069 KR_Seiad TN 21.9% 0.71 0.8039 0.0861 -345.6952 0.1723 -0.7051 -0.3740 -1.0363 -0.1297 1.3944 -4.0128 346960.869 KR_Seiad INORGN 82.9% 0.40 1.1262 0.2863 -1148.9724 0.9064 -0.1814 2.3062 0.1434 0.2444 -1.0867 1.3621 1152866.959 KR_Seiad NH4N 52.1% 0.18 2.4951 -0.0113 45.5959 -0.4542 -1.1128 -2.0507 -0.8991 0.1817 -0.3258 -1.2624 -45844.835 KR_Seiad NO23N 97.7% 0.38 1.0496 0.3499 -1404.5468 1.1426 -0.0019 2.9522 0.3599 0.3045 -1.5019 2.3379 1409321.479 KR_Seiad ORGN 22.9% 0.68 0.6221 0.0485 -194.6666 0.0103 -0.7556 -1.0251 -1.2974 -0.0920 1.1728 -3.5685 195415.933
KR_Orleans TP 16.4% 0.89 -0.3037 -0.1105 443.5690 -0.4311 -0.7104 -1.9113 -1.9430 0.2616 -1.7099 3.6512 -445213.161 KR_Orleans SRP 18.2% 0.92 -1.1905 -0.0847 340.2479 -0.5126 -0.8863 -2.1646 -2.0291 0.2920 -2.1974 5.0712 -341523.111 KR_Orleans PP 26.0% 0.75 0.8588 -0.1581 634.7017 -0.2380 -0.1937 -1.1266 -1.6040 -0.0904 1.1933 -3.2551 -637012.515 KR_Orleans TN 25.2% 0.75 0.2228 0.0386 -155.0949 0.0204 -0.5049 -0.5681 -1.2435 -0.1200 1.0992 -3.1148 155727.710 KR_Orleans INORGN 78.6% 0.52 -3.7921 0.2036 -817.5279 0.4296 -0.3197 2.3652 0.4500 0.2244 -1.5614 3.3034 820515.797 KR_Orleans NH4N 46.9% 0.17 -1.9232 -0.1427 572.7813 -0.3352 0.6206 0.4607 0.6267 -0.0070 -0.2442 1.6580 -574947.819 KR_Orleans NO23N 100.7% 0.52 -4.0241 0.3162 -1269.4498 0.5584 -0.6195 2.6957 0.3947 0.4892 -3.5160 7.7668 1274126.514 KR_Orleans ORGN 22.8% 0.79 1.0795 -0.0090 35.9491 -0.1320 -0.6026 -1.3142 -1.6727 -0.1523 1.3127 -3.4639 -36030.889 KR_abv_Trin TP 16.7% 0.90 -1.7939 -0.0888 356.4292 -0.5502 -0.8076 -1.8895 -1.5203 0.4109 -2.8800 6.1719 -357806.471 KR_abv_Trin SRP 18.6% 0.92 -2.4208 -0.0871 349.7257 -0.6529 -0.9897 -2.3700 -1.9969 0.4300 -3.2195 7.4438 -351103.623 KR_abv_Trin PP 33.8% 0.54 0.0217 -0.1047 420.2148 -0.3101 -0.8129 -1.6337 -1.1655 0.1061 -0.1693 -1.3727 -421747.658 KR_abv_Trin TN 26.4% 0.69 -0.3039 0.0719 -288.7146 0.0523 -0.2511 0.0474 -0.5088 0.1438 -0.8698 1.3547 289805.442 KR_abv_Trin INORGN 57.4% 0.68 -5.4571 0.1995 -800.8575 0.8682 0.0650 3.6821 1.2902 -0.0619 0.7681 -2.6104 803742.836 KR_abv_Trin NH4N 25.8% 0.44 -1.2783 -0.0295 118.3859 -0.3879 -0.9687 -2.5877 -2.1144 0.4805 -3.4393 8.3270 -118916.328 KR_abv_Trin NO23N 75.7% 0.67 -6.4041 0.2787 -1118.8078 1.0249 0.3977 5.2588 2.3937 -0.1708 1.5298 -4.3953 1122883.060 KR_abv_Trin ORGN 25.9% 0.72 0.2402 0.0385 -154.4267 -0.1888 -0.3012 -0.6154 -0.7234 0.2603 -1.8285 3.8232 155007.760
KR_bel_Trin TP 16.5% 0.89 -1.0673 -0.1085 435.5750 -0.2690 -0.7288 -1.3578 -1.2686 0.1344 -0.7030 0.4401 -437198.391 KR_bel_Trin SRP 21.2% 0.91 -2.0084 -0.0831 333.8045 -0.4538 -1.2775 -2.3817 -1.9643 0.1589 -1.0396 1.3699 -335067.752 KR_bel_Trin PP 29.8% 0.63 -0.3147 -0.1477 592.7931 -0.1922 -0.5000 -1.2648 -1.0659 0.0110 0.5054 -2.9367 -594963.588 KR_bel_Trin TN 24.8% 0.70 3.0102 0.0853 -342.6011 0.2853 -0.2494 0.3877 -0.2061 -0.1348 1.5799 -5.9259 343990.764 KR_bel_Trin INORGN 48.3% 0.71 -1.9624 0.3033 -1217.7019 1.0354 0.8510 5.2030 3.2560 0.2191 -1.5777 2.6326 1222239.009 KR_bel_Trin NH4N 30.3% 0.46 -0.7687 0.0939 -377.0905 -0.4294 -0.1462 -1.0195 -0.2880 0.5685 -4.8863 13.4543 378435.321 KR_bel_Trin NO23N 60.8% 0.72 -1.3736 0.3500 -1405.4628 1.3717 0.8725 6.4757 4.0380 0.0509 0.0110 -2.4279 1410752.280

__________________________________________________________________________________ Appendices - Klamath Nutrient Loading & Retention Dynamics in Free-Flowing Reaches 2005-2008, Prepared by Kier Associates, Aquatic Ecosystem Sciences, & W. Walker for the Yurok Tribe, June 2010 A-4
Site
Var
iabl
e
Reg
ress
ion
Sta
ndar
d E
rror
Reg
ress
ion
R
2
B10 B9 B8 B7 B6 B5 B4 B3 B2 B1 B0
KR_bel_Trin ORGN 24.0% 0.72 3.9679 0.0556 -223.1946 0.1511 -0.3967 -0.3316 -0.6590 -0.1670 1.8346 -6.4968 224157.040 KR_Turwar TP 20.0% 0.83 -1.2914 -0.1493 599.3980 -0.5145 -1.1654 -2.5823 -2.0038 0.1925 -1.2115 1.9209 -601590.928 KR_Turwar SRP 26.5% 0.80 -0.6231 -0.1048 420.6210 -0.6531 -1.3370 -2.6621 -1.9129 0.0995 -0.5949 0.5005 -422177.095 KR_Turwar PP 35.6% 0.60 -1.8452 -0.2014 808.4342 -0.3489 -0.9585 -2.4015 -1.9455 0.1441 -0.5714 -0.3210 -811360.682 KR_Turwar TN 27.7% 0.55 1.3825 0.0194 -77.9148 -0.0911 -0.2659 -0.2920 -0.5091 -0.0606 0.7164 -2.6094 78292.617 KR_Turwar INORGN 43.5% 0.42 -0.7942 0.0076 -30.6574 0.6762 1.1124 3.6739 2.6139 0.2890 -2.5621 6.9620 30836.229 KR_Turwar NH4N 33.6% 0.47 -0.9426 -0.0794 318.7810 -0.5853 -1.1621 -3.1460 -2.3092 0.3124 -2.3962 6.1536 -319993.589 KR_Turwar NO23N 55.7% 0.43 0.0206 0.0385 -154.6089 0.9995 1.9482 5.7489 4.1697 0.3305 -3.1726 9.2982 155263.960 KR_Turwar ORGN 35.5% 0.53 0.3524 0.0290 -116.3309 -0.2980 -0.4351 -0.9720 -0.9564 -0.0146 0.2896 -1.2979 116849.653 Shasta_R TP 9.3% 0.62 0.3924 0.0321 -128.9949 0.1159 -0.0248 -0.0377 -0.1298 0.0035 0.0225 -0.0278 129485.494 Shasta_R SRP 13.5% 0.61 0.3450 0.0798 -320.4722 0.2753 0.1625 0.4489 0.0516 -0.0055 -0.0521 -0.1723 321644.500 Shasta_R PP 87.4% 0.25 0.9368 -0.2369 950.9166 -1.1251 -0.3306 -2.2363 -0.0945 -0.0077 0.1016 0.2405 -954293.714 Shasta_R TN 21.9% 0.59 0.6000 0.0488 -195.7927 -0.6907 -0.5508 -2.1485 -0.7336 -0.0583 -0.1872 -0.0458 196534.910 Shasta_R INORGN 33.9% 0.86 0.6638 -0.0298 119.6484 1.3910 0.2846 4.0620 0.6843 0.1969 1.2501 2.2924 -119941.654 Shasta_R NH4N 20.4% 0.63 0.6538 -0.0461 184.9353 0.1279 0.1319 0.4478 0.2256 0.1319 0.8338 1.4182 -185505.074 Shasta_R NO23N 48.4% 0.83 0.5387 0.0166 -66.6109 1.6478 0.0851 4.5253 0.4854 0.2340 1.4559 2.7078 67002.406 Shasta_R ORGN 23.8% 0.69 0.6361 0.0548 -220.1813 -0.9373 -0.7032 -2.9623 -0.9714 -0.0677 -0.2506 -0.1842 221011.939 Scott_R TP 39.9% 0.70 -0.0840 -0.1187 476.3653 -0.8709 -0.1131 -1.9155 -0.4828 0.0491 0.1578 0.2689 -477971.785 Scott_R SRP 59.5% 0.61 2.3682 0.1768 -709.7511 -0.6457 0.1668 -0.9929 0.1499 -0.0112 0.0833 0.4545 712504.379 Scott_R PP 52.0% 0.62 -0.8192 -0.1962 787.4765 -0.8849 -0.0821 -1.9371 -0.5329 0.0578 0.1719 0.2886 -790251.210 Scott_R TN 36.7% 0.58 -1.5625 -0.0444 178.1114 0.0132 0.1916 0.4756 0.2847 -0.0134 -0.1219 0.1029 -178750.063 Scott_R INORGN 86.7% 0.64 -2.0776 0.0988 -396.8516 0.1991 -0.7531 -0.3441 -0.3419 -0.0154 -0.2280 0.0358 398319.473 Scott_R NH4N 30.0% 0.60 -2.2387 -0.0980 393.5767 0.4384 0.1634 0.7865 0.0789 0.0470 0.2605 0.1912 -395048.516 Scott_R NO23N 103.4% 0.67 -2.1885 0.2026 -813.2447 -0.0144 -1.2006 -1.0833 -0.7293 -0.0190 -0.3271 -0.0302 816254.494 Scott_R ORGN 42.7% 0.20 -0.7597 -0.0450 180.6163 -0.0789 0.7130 1.0536 1.0608 0.0018 -0.0336 -0.0319 -181142.509
Salmon_R TP 37.7% 0.48 -0.3391 -0.1378 553.4777 -0.3121 -0.0161 -0.7190 -0.9457 0.0885 -0.0119 0.1506 -555593.838 Salmon_R SRP 56.6% 0.36 -0.7985 0.0931 -373.6720 -0.7852 -0.1945 -0.7499 -1.8353 0.0312 -0.4576 1.5360 374815.552 Salmon_R PP 55.4% 0.52 -0.2284 -0.2655 1065.7859 0.0648 0.6832 0.6349 0.3391 0.0549 0.2796 -0.3671 -1069693.775 Salmon_R TN 67.1% 0.55 1.4855 0.0605 -242.7646 -3.0300 -2.7662 -8.4206 -4.1185 0.2880 -0.7365 0.0127 243531.325 Salmon_R INORGN 30.1% 0.27 -0.6575 0.0469 -188.3216 0.5330 1.2180 2.9035 1.7105 -0.0146 0.0464 0.1043 189025.329 Salmon_R NH4N 21.5% 0.40 -0.6476 -0.0153 61.5185 -0.0764 -0.3607 -0.8847 -0.8249 0.1251 -0.1078 -0.1106 -61770.074 Salmon_R NO23N 41.8% 0.29 -0.3818 0.1027 -412.1997 0.9411 2.4492 5.7428 3.7385 -0.1546 0.1869 0.2996 413745.563

__________________________________________________________________________________ Appendices - Klamath Nutrient Loading & Retention Dynamics in Free-Flowing Reaches 2005-2008, Prepared by Kier Associates, Aquatic Ecosystem Sciences, & W. Walker for the Yurok Tribe, June 2010 A-5
Site
Var
iabl
e
Reg
ress
ion
Sta
ndar
d E
rror
Reg
ress
ion
R
2
B10 B9 B8 B7 B6 B5 B4 B3 B2 B1 B0
Salmon_R ORGN 80.4% 0.56 2.1167 0.0642 -257.7959 -3.7592 -3.5283 -10.5978 -5.0214 0.3491 -0.8927 -0.0953 258603.766 Trinity_R TP 19.4% 0.94 -3.5041 -0.1261 506.3599 -0.0949 -0.1264 -0.3159 -0.2629 0.3160 -1.3017 1.7167 -508221.402 Trinity_R SRP 58.5% 0.62 -0.6123 -0.3066 1230.6233 -0.4145 -0.8917 -1.8412 -0.8871 0.0255 -0.0691 0.1924 -1234862.701 Trinity_R PP 27.6% 0.90 -4.2037 -0.0673 270.1707 0.1387 0.1250 0.3907 0.0468 0.3316 -1.2480 1.3853 -271232.864 Trinity_R TN 39.2% 0.72 4.5950 0.1098 -440.8763 -0.3407 0.4387 1.2152 2.7061 0.3493 -1.7992 1.5308 442371.749 Trinity_R INORGN 29.0% 0.76 0.7291 0.0997 -400.3373 -0.0261 0.5437 1.0615 1.2934 0.2075 -1.0542 1.5406 401875.585 Trinity_R NH4N 24.8% 0.77 2.3632 -0.0653 262.0305 -0.1020 -0.8976 -1.8416 -1.5334 0.2146 -0.9024 1.0950 -263001.482 Trinity_R NO23N 43.0% 0.64 0.0267 0.1892 -759.7389 0.0139 1.3405 2.6794 2.8866 0.1475 -0.8638 1.3782 762643.070 Trinity_R ORGN 54.6% 0.68 1.4893 0.1232 -494.4620 -1.0318 0.6027 0.8875 3.5150 0.7532 -4.2352 5.4677 495990.060

__________________________________________________________________________________ Appendices - Klamath Nutrient Loading & Retention Dynamics in Free-Flowing Reaches 2005-2008, Prepared by Kier Associates, Aquatic Ecosystem Sciences, & W. Walker for the Yurok Tribe, June 2010 A-6
APPENDIX A2
Comparison of results of five methods for calculating nutrient loads Table A2. Comparison of mean daily loads at mainstem and major tributary stations calculated using five algorithms as described below. Mean daily loads were calculated only from sites/years/parameters when sampling frequency was adequate (i.e. monthly or better, see section 3.5.2.1 Seasonal Summaries for Primary Reaches in report for more details); thus, the number of years included in the mean daily load values vary by site and parameter (range is between one and four years). Standard error and regression R2 are for method 5 only).
Mean Daily Load (MT/day)
Site Para- meter
Relative Std
Error Regression
R2 Method
1 Method
2 Method
3 Method
4 Method
5
M3 Load as % of
M5 Load
KR_bel_Keno TP 7.6% 0.6340 0.4475 0.4513 0.4969 0.5209 0.5004 99.3% KR_abv_Copco TP 2.4% 0.7355 0.4717 0.4814 0.5210 0.4986 0.4969 104.8% KR_bel_IGD TP 2.1% 0.8044 0.4227 0.4392 0.4656 0.4647 0.4656 100.0% KR_Walker TP 1.5% 0.9386 0.5131 0.5351 0.5311 0.5372 0.5361 99.1% KR_Seiad TP 2.1% 0.7993 0.4546 0.4989 0.4905 0.4818 0.4827 101.6% KR_Orleans TP 2.8% 0.8887 0.4678 0.5018 0.4954 0.5016 0.4973 99.6% KR_abv_Trin TP 2.6% 0.9033 0.3776 0.4330 0.4351 0.4231 0.4302 101.1% KR_bel_Trin TP 2.1% 0.8947 0.4454 0.4644 0.4711 0.4623 0.4616 102.1% KR_Turwar TP 2.8% 0.8336 0.4312 0.4427 0.4560 0.4385 0.4515 101.0% Shasta_R TP 1.4% 0.6225 0.0312 0.0313 0.0315 0.0317 0.0316 99.8% Scott_R TP 4.1% 0.7016 0.0146 0.0124 0.0092 0.0081 0.0075 123.0% Salmon_R TP 18.1% 0.4778 0.0105 0.0108 0.0105 0.0122 0.0115 91.2% Trinity_R TP 3.0% 0.9423 0.0551 0.0370 0.0390 0.0364 0.0366 106.3% KR_bel_Keno TN 2.5% 0.8549 3.8323 4.2694 4.8199 4.8448 4.7893 100.6% KR_abv_Copco TN 1.8% 0.8093 4.7357 4.8690 4.4496 4.3721 4.3260 102.9% KR_bel_IGD TN 1.4% 0.7923 3.2693 3.3356 2.8999 2.9139 2.8961 100.1% KR_Walker TN 2.4% 0.9166 2.9650 3.0403 3.0890 3.0670 3.0585 101.0% KR_Seiad TN 2.5% 0.7101 2.6942 2.9729 2.8540 2.7857 2.8295 100.9% KR_Orleans TN 3.6% 0.7509 2.4052 2.6056 2.5633 2.5992 2.5723 99.7% KR_abv_Trin TN 3.9% 0.6869 2.1048 2.2819 2.3388 2.2290 2.3104 101.2% KR_bel_Trin TN 4.1% 0.7027 2.4566 2.5135 2.5667 2.4359 2.4804 103.5% KR_Turwar TN 4.9% 0.5504 2.6533 2.7568 2.7448 2.6937 2.7513 99.8% Shasta_R TN 5.1% 0.5900 0.0917 0.0829 0.0834 0.0874 0.0848 98.4% Scott_R TN 6.5% 0.5820 0.1269 0.1273 0.1301 0.1450 0.1308 99.4% Salmon_R TN 10.1% 0.5481 0.1000 0.0926 0.0987 0.1008 0.0925 108.2% Trinity_R TN 6.1% 0.7221 0.5404 0.3651 0.3694 0.2170 0.2173 104.8% KR_abv_Trin SRP 2.8% 0.9207 0.2849 0.3564 0.3148 0.3110 0.3014 104.4% KR_bel_IGD SRP 3.6% 0.8088 0.3015 0.3281 0.3549 0.3607 0.3548 100.0% KR_bel_Keno SRP 6.5% 0.3966 0.1814 0.2251 0.2347 0.2497 0.2276 103.1% KR_bel_Trin SRP 2.9% 0.9066 0.3004 0.3659 0.3205 0.3155 0.3036 105.6% KR_Orleans SRP 2.8% 0.9151 0.2868 0.3395 0.3343 0.3330 0.3290 101.6% KR_Seiad SRP 2.3% 0.8369 0.3267 0.3628 0.3611 0.3634 0.3607 100.1% KR_Turwar SRP 3.5% 0.7963 0.2530 0.2824 0.2581 0.2538 0.2466 104.7% KR_Walker SRP 1.5% 0.9450 0.3903 0.3883 0.2785 0.4511 0.4574 60.9% Salmon_R SRP 9.3% 0.3558 0.0047 0.0047 0.0049 0.0055 0.0052 94.4% Scott_R SRP 10.1% 0.6085 0.0025 0.0020 0.0016 0.0016 0.0014 113.6% Shasta_R SRP 2.3% 0.6066 0.0264 0.0271 0.0270 0.0271 0.0269 100.4% Trinity_R SRP 12.8% 0.6156 0.0204 0.0157 0.0153 0.0192 0.0145 105.7%

__________________________________________________________________________________ Appendices - Klamath Nutrient Loading & Retention Dynamics in Free-Flowing Reaches 2005-2008, Prepared by Kier Associates, Aquatic Ecosystem Sciences, & W. Walker for the Yurok Tribe, June 2010 A-7
Mean Daily Load (MT/day)
Site Para- meter
Relative Std
Error Regression
R2 Method
1 Method
2 Method
3 Method
4 Method
5
M3 Load as % of
M5 Load
KR_abv_Trin PP 5.9% 0.5393 0.1629 0.1495 0.1542 0.1377 0.1386 111.3% KR_bel_IGD PP 9.7% 0.4182 0.1209 0.1109 0.1106 0.1067 0.1069 103.5% KR_bel_Keno PP 4.9% 0.5440 0.2220 0.2260 0.2276 0.2407 0.2219 102.6% KR_bel_Trin PP 4.4% 0.6287 0.2952 0.2302 0.2492 0.2209 0.2249 110.8% KR_Orleans PP 4.4% 0.7490 0.1805 0.1634 0.1630 0.1667 0.1665 97.9% KR_Seiad PP 4.9% 0.4086 0.1361 0.1362 0.1328 0.1255 0.1250 106.2% KR_Turwar PP 4.6% 0.6047 0.3350 0.2686 0.2897 0.2621 0.2565 112.9% KR_Walker PP 7.3% 0.8102 0.1254 0.1253 0.0381 0.1550 0.1286 29.6% Salmon_R PP 25.9% 0.5213 0.0108 0.0088 0.0083 0.0079 0.0077 108.5% Scott_R PP 10.6% 0.6186 0.0122 0.0104 0.0076 0.0068 0.0060 126.2% Shasta_R PP 9.8% 0.2533 0.0050 0.0044 0.0046 0.0045 0.0045 103.7% Trinity_R PP 6.0% 0.9039 0.1944 0.1116 0.1142 0.0604 0.0652 175.0% KR_abv_Trin ORGN 3.9% 0.7177 2.7435 2.8868 2.9774 2.2304 2.4460 121.7% KR_bel_IGD ORGN 1.7% 0.5660 2.0978 2.1168 2.0772 2.0574 2.0762 100.1% KR_bel_Keno ORGN 2.6% 0.7493 2.6718 3.0827 3.2356 3.4121 3.2155 100.6% KR_bel_Trin ORGN 3.4% 0.7203 3.1818 3.1953 3.1312 3.0541 3.0692 102.0% KR_Orleans ORGN 3.2% 0.7936 2.5578 2.7157 2.7467 2.3849 2.4828 110.6% KR_Seiad ORGN 2.8% 0.6778 2.1258 2.3771 2.2838 2.2212 2.2425 101.8% KR_Turwar ORGN 7.0% 0.5265 3.2858 3.3318 3.1863 3.0033 3.1145 102.3% KR_Walker ORGN 3.9% 0.6871 2.1586 2.1495 1.7491 2.2990 2.3784 73.5% Salmon_R ORGN 11.8% 0.5586 0.1270 0.1228 0.1506 0.0833 0.0853 176.6% Scott_R ORGN 7.9% 0.1952 0.0769 0.0754 0.0742 0.0636 0.0718 103.3% Shasta_R ORGN 5.5% 0.6920 0.0844 0.0786 0.0813 0.0833 0.0826 98.4% Trinity_R ORGN 6.6% 0.6790 0.4103 0.2982 0.2931 0.1383 0.1456 201.3% KR_abv_Trin NO23N 20.9% 0.6712 0.2611 0.2155 0.2122 0.2033 0.2056 103.2% KR_bel_IGD NO23N 3.6% 0.6928 0.9564 1.0055 0.7001 0.7099 0.6842 102.3% KR_bel_Keno NO23N 28.9% 0.5245 0.2624 0.1940 0.1180 0.1061 0.1090 108.3% KR_bel_Trin NO23N 18.9% 0.7214 0.3435 0.2742 0.2653 0.2277 0.2194 120.9% KR_Orleans NO23N 13.5% 0.5200 0.2744 0.2464 0.2327 0.2461 0.2327 100.0% KR_Seiad NO23N 9.9% 0.3829 0.5269 0.5547 0.5305 0.5373 0.5499 96.5% KR_Turwar NO23N 16.2% 0.4270 0.5121 0.3994 0.4297 0.3962 0.3570 120.4% KR_Walker NO23N 2.6% 0.9541 0.7953 0.7913 0.6140 0.8279 0.8085 75.9% Salmon_R NO23N 8.9% 0.2860 0.0102 0.0111 0.0103 0.0103 0.0098 104.4% Scott_R NO23N 22.8% 0.6722 0.0567 0.0584 0.0644 0.1175 0.0680 94.7% Shasta_R NO23N 11.4% 0.8331 0.0063 0.0057 0.0048 0.0041 0.0038 126.3% Trinity_R NO23N 10.0% 0.6424 0.0688 0.0462 0.0506 0.0425 0.0383 132.0% KR_abv_Trin NH4N 7.1% 0.4423 0.0602 0.0499 0.0551 0.0513 0.0506 108.8% KR_bel_IGD NH4N 9.3% 0.6215 0.2182 0.2169 0.1222 0.1202 0.1184 103.2% KR_bel_Keno NH4N 12.6% 0.7049 1.0117 1.3287 1.3241 1.4539 1.2371 107.0% KR_bel_Trin NH4N 7.8% 0.4636 0.1096 0.0910 0.0963 0.0740 0.0734 131.3% KR_Orleans NH4N 15.2% 0.1674 0.0610 0.0555 0.0565 0.0538 0.0534 105.7% KR_Seiad NH4N 7.4% 0.1785 0.0430 0.0426 0.0405 0.0385 0.0380 106.6% KR_Turwar NH4N 7.0% 0.4655 0.1291 0.0982 0.1067 0.0968 0.0933 114.3% KR_Walker NH4N 9.9% 0.5495 0.0434 0.0434 0.0244 0.0678 0.0606 40.2% Salmon_R NH4N 14.6% 0.3985 0.0101 0.0088 0.0088 0.0085 0.0085 102.5% Scott_R NH4N 11.0% 0.6014 0.0064 0.0058 0.0043 0.0036 0.0034 127.0%
Shasta_R NH4N 2.4% 0.6271 0.0012 0.0009 0.0010 0.0010 0.0009 104.6% Trinity_R NH4N 17.1% 0.7707 0.0741 0.0506 0.0519 0.0366 0.0379 137.1%

__________________________________________________________________________________ Appendices - Klamath Nutrient Loading & Retention Dynamics in Free-Flowing Reaches 2005-2008, Prepared by Kier Associates, Aquatic Ecosystem Sciences, & W. Walker for the Yurok Tribe, June 2010 A-8
Mean Daily Load (MT/day)
Site Para- meter
Relative Std
Error Regression
R2 Method
1 Method
2 Method
3 Method
4 Method
5
M3 Load as % of
M5 Load
KR_abv_Trin INORGN 15.6% 0.6825 0.3213 0.2654 0.2672 0.2533 0.2524 105.9% KR_bel_IGD INORGN 3.6% 0.7064 1.1746 1.2224 0.8223 0.8298 0.8046 102.2% KR_bel_Keno INORGN 10.7% 0.6811 1.2738 1.5222 1.4417 1.5292 1.3347 108.0% KR_bel_Trin INORGN 15.5% 0.7082 0.4531 0.3651 0.3617 0.2974 0.2859 126.5% KR_Orleans INORGN 11.7% 0.5170 0.3353 0.3019 0.2891 0.2892 0.2841 101.8% KR_Seiad INORGN 8.0% 0.3970 0.5698 0.5974 0.5710 0.5592 0.5835 97.9% KR_Turwar INORGN 12.6% 0.4212 0.6411 0.4976 0.5364 0.4847 0.4480 119.7% KR_Walker INORGN 2.6% 0.9606 0.8388 0.8346 0.6384 0.8575 0.8348 76.5% Salmon_R INORGN 6.7% 0.2665 0.0202 0.0199 0.0190 0.0188 0.0184 103.5% Scott_R INORGN 15.2% 0.6435 0.0631 0.0641 0.0687 0.1036 0.0715 96.1% Shasta_R INORGN 8.2% 0.8607 0.0074 0.0067 0.0058 0.0050 0.0049 120.2%
Trinity_R INORGN 5.9% 0.7612 0.1429 0.0968 0.1025 0.0778 0.0732 140.1%

__________________________________________________________________________________ Appendices - Klamath Nutrient Loading & Retention Dynamics in Free-Flowing Reaches 2005-2008, Prepared by Kier Associates, Aquatic Ecosystem Sciences, & W. Walker for the Yurok Tribe, June 2010 A-9
APPENDIX A3
Table with complete seasonal summaries of budget components for all parameters and reaches
Inflow Load Retention % of Total Inflow MT
Year Season Day
s
Reach Number Reach Name Miles P
aram
eter
Mai
nste
m
Gag
ed T
ribs
Ung
aged
T
ribs
Tot
al I
nflo
w
Loa
d
Out
flow
Loa
d (M
T)
MT kg/day
/mi % %/mi2007 June-Oct 142 1 Keno-Copco 26.92 TP 91.0 0.0 9.0 74.5 69.7 4.8 1.26 6.47 0.242008 June-Oct 137 1 Keno-Copco 26.92 TP 92.2 0.0 7.8 77.7 74.7 2.9 0.79 3.77 0.142005 June-Oct 142 4 IG-Seiad 61.15 TP 89.3 9.5 1.2 58.8 54.8 4.0 0.47 6.87 0.112006 June-Oct 142 4 IG-Seiad 61.15 TP 87.9 10.7 1.4 84.5 80.6 3.9 0.45 4.64 0.082007 June-Oct 142 4 IG-Seiad 61.15 TP 94.0 5.3 0.7 72.2 66.9 5.3 0.61 7.30 0.122008 June-Oct 137 4 IG-Seiad 61.15 TP 93.8 4.9 1.3 71.7 68.8 2.8 0.34 3.95 0.062005 June-Oct 142 4+5 IG-Orleans 130.61 TP 81.3 10.7 8.0 64.6 57.4 7.2 0.39 11.16 0.092006 June-Oct 142 4+5 IG-Orleans 130.61 TP 86.8 10.3 2.9 42.4 37.5 4.9 0.26 11.54 0.092007 June-Oct 142 4+5 IG-Orleans 130.61 TP 88.6 7.4 4.0 76.5 72.4 4.1 0.22 5.34 0.042008 June-Oct 137 4+5 IG-Orleans 130.61 TP 88.5 6.7 4.8 76.0 59.2 16.8 0.94 22.09 0.172005 June-Oct 142 4+5+6 IG-AbvTrin 146.23 TP 79.8 10.5 9.6 65.8 52.8 13.0 0.63 19.82 0.142007 June-Oct 142 4+5+6 IG-AbvTrin 146.23 TP 87.5 7.3 5.2 77.5 69.8 7.6 0.37 9.86 0.072008 June-Oct 137 4+5+6 IG-AbvTrin 146.23 TP 87.4 6.7 5.9 76.9 58.1 18.8 0.94 24.43 0.172005 June-Oct 142 4+5+6+7 IG-Turwar 183.94 TP 69.7 19.4 10.9 75.4 60.5 14.9 0.57 19.72 0.112007 June-Oct 142 4+5+6+7 IG-Turwar 183.94 TP 82.2 11.0 6.8 82.5 75.3 7.2 0.27 8.70 0.052008 June-Oct 137 4+5+6+7 IG-Turwar 183.94 TP 81.4 11.3 7.2 82.6 54.0 28.6 1.14 34.63 0.192008 June-Oct 137 4A IG-Walker 33.73 TP 95.2 4.0 0.8 70.7 73.4 -2.7 -0.59 -3.86 -0.112008 June-Oct 137 4B Walker-Seiad 27.42 TP 98.6 0.9 0.4 74.4 68.8 5.6 1.48 7.48 0.272005 June-Oct 142 5 Seiad-Orlean 69.46 TP 90.4 2.3 7.3 60.6 57.4 3.2 0.32 5.23 0.082006 June-Oct 142 5 Seiad-Orlean 69.46 TP 93.0 3.1 3.9 86.7 90.8 -4.1 -0.42 -4.78 -0.072007 June-Oct 142 5 Seiad-Orlean 69.46 TP 93.9 2.6 3.5 71.2 72.4 -1.2 -0.12 -1.67 -0.022008 June-Oct 137 5 Seiad-Orlean 69.46 TP 94.1 2.2 3.7 73.2 59.2 14.0 1.47 19.07 0.272005 June-Oct 142 6 Orleans-AbvTrin 15.62 TP 98.0 0.0 2.0 58.6 52.8 5.8 2.63 9.95 0.642007 June-Oct 142 6 Orleans-AbvTrin 15.62 TP 98.6 0.0 1.4 73.4 69.8 3.6 1.60 4.85 0.312008 June-Oct 137 6 Orleans-AbvTrin 15.62 TP 98.5 0.0 1.5 60.1 58.1 2.0 0.94 3.34 0.212005 June-Oct 142 6A Orl-AbvTrin 16.62 TP 86.6 11.6 1.8 66.3 60.1 6.2 2.63 9.37 0.562007 June-Oct 142 6A Orl-AbvTrin 16.62 TP 94.3 4.4 1.3 76.8 70.6 6.2 2.61 8.03 0.482008 June-Oct 137 6A Orl-AbvTrin 16.62 TP 92.0 6.6 1.4 64.4 62.9 1.5 0.64 2.27 0.142005 June-Oct 142 7 AbvTrin-Turwar 37.71 TP 84.6 12.4 3.0 62.3 60.5 1.8 0.34 2.91 0.082007 June-Oct 142 7 AbvTrin-Turwar 37.71 TP 93.4 4.6 2.1 74.8 75.3 -0.5 -0.09 -0.62 -0.022008 June-Oct 137 7 AbvTrin-Turwar 37.71 TP 91.1 6.7 2.3 63.8 54.0 9.8 1.90 15.38 0.412005 June-Oct 142 7A AbvTrin-Turwar 36.71 TP 97.0 0.0 3.0 62.0 60.5 1.4 0.28 2.32 0.062007 June-Oct 142 7A AbvTrin-Turwar 36.71 TP 97.8 0.0 2.2 72.2 75.3 -3.1 -0.59 -4.26 -0.122008 June-Oct 137 7A AbvTrin-Turwar 36.71 TP 97.8 0.0 2.2 64.4 54.0 10.4 2.06 16.10 0.442007 June-Oct 142 1 Keno-Copco 26.92 TN 96.5 0.0 3.5 673.6 605.4 68.2 17.84 10.12 0.382008 June-Oct 137 1 Keno-Copco 26.92 TN 97.0 0.0 3.0 707.2 638.4 68.8 18.66 9.73 0.362005 June-Oct 142 4 IG-Seiad 61.15 TN 89.9 9.0 1.1 418.8 433.6 -14.8 -1.70 -3.53 -0.062006 June-Oct 142 4 IG-Seiad 61.15 TN 88.0 10.4 1.6 492.1 443.6 48.5 5.58 9.86 0.162007 June-Oct 142 4 IG-Seiad 61.15 TN 95.8 3.4 0.8 434.4 345.9 88.6 10.20 20.39 0.332008 June-Oct 137 4 IG-Seiad 61.15 TN 93.2 5.4 1.4 434.2 368.2 66.0 7.88 15.21 0.252006 June-Oct 142 4+5 IG-Orleans 130.61 TN 86.5 9.7 3.7 213.7 153.6 60.1 3.24 28.12 0.22

__________________________________________________________________________________ Appendices - Klamath Nutrient Loading & Retention Dynamics in Free-Flowing Reaches 2005-2008, Prepared by Kier Associates, Aquatic Ecosystem Sciences, & W. Walker for the Yurok Tribe, June 2010 A-10
Inflow Load Retention % of Total Inflow MT
Year Season Day
s
Reach Number Reach Name Miles P
aram
eter
Mai
nste
m
Gag
ed T
ribs
Ung
aged
T
ribs
Tot
al I
nflo
w
Loa
d
Out
flow
Loa
d (M
T)
MT kg/day
/mi % %/mi2007 June-Oct 142 4+5 IG-Orleans 130.61 TN 90.5 5.2 4.3 459.6 342.0 117.6 6.34 25.58 0.202008 June-Oct 137 4+5 IG-Orleans 130.61 TN 86.8 8.2 5.0 466.4 305.5 160.9 8.99 34.50 0.262007 June-Oct 142 4+5+6 IG-AbvTrin 146.23 TN 89.3 5.1 5.6 466.1 337.9 128.2 6.17 27.51 0.192008 June-Oct 137 4+5+6 IG-AbvTrin 146.23 TN 85.7 8.1 6.2 472.3 304.2 168.2 8.40 35.61 0.242007 June-Oct 142 4+5+6+7 IG-Turwar 183.94 TN 81.7 11.1 7.2 509.0 417.9 91.1 3.49 17.91 0.102008 June-Oct 137 4+5+6+7 IG-Turwar 183.94 TN 79.0 13.4 7.6 512.6 347.5 165.1 6.55 32.20 0.182008 June-Oct 137 4A IG-Walker 33.73 TN 97.2 1.9 0.9 416.3 418.8 -2.5 -0.55 -0.61 -0.022008 June-Oct 137 4B Walker-Seiad 27.42 TN 95.9 3.6 0.5 436.7 368.2 68.6 18.25 15.70 0.572006 June-Oct 142 5 Seiad-Orlean 69.46 TN 92.3 3.2 4.6 480.8 434.5 46.3 4.69 9.62 0.142007 June-Oct 142 5 Seiad-Orlean 69.46 TN 93.2 2.4 4.4 371.0 342.0 29.0 2.94 7.81 0.112008 June-Oct 137 5 Seiad-Orlean 69.46 TN 92.0 3.6 4.4 400.3 305.5 94.9 9.97 23.69 0.342007 June-Oct 142 6 Orleans-AbvTrin 15.62 TN 98.1 0.0 1.9 348.5 337.9 10.6 4.80 3.05 0.202008 June-Oct 137 6 Orleans-AbvTrin 15.62 TN 98.1 0.0 1.9 311.5 304.2 7.3 3.42 2.35 0.152007 June-Oct 142 6A Orl-AbvTrin 16.62 TN 89.7 8.6 1.7 381.3 358.3 23.0 9.74 6.03 0.362008 June-Oct 137 6A Orl-AbvTrin 16.62 TN 89.2 9.0 1.7 342.3 328.9 13.4 5.87 3.91 0.232007 June-Oct 142 7 AbvTrin-Turwar 37.71 TN 88.7 8.6 2.7 380.8 417.9 -37.1 -6.92 -9.73 -0.262008 June-Oct 137 7 AbvTrin-Turwar 37.71 TN 88.3 8.9 2.7 344.4 347.5 -3.1 -0.60 -0.90 -0.022007 June-Oct 142 7A AbvTrin-Turwar 36.71 TN 97.2 0.0 2.8 368.5 417.9 -49.4 -9.48 -13.41 -0.372008 June-Oct 137 7A AbvTrin-Turwar 36.71 TN 97.2 0.0 2.8 338.3 347.5 -9.2 -1.82 -2.71 -0.072005 June-Oct 142 4 IG-Seiad 61.15 TIN 91.6 7.7 0.6 130.8 94.5 36.3 4.18 27.73 0.452006 June-Oct 142 4 IG-Seiad 61.15 TIN 84.4 14.4 1.2 125.5 80.7 44.8 5.16 35.71 0.582007 June-Oct 142 4 IG-Seiad 61.15 TIN 95.7 3.7 0.7 97.6 58.4 39.3 4.52 40.21 0.662008 June-Oct 137 4 IG-Seiad 61.15 TIN 91.9 7.3 0.8 145.5 94.3 51.2 6.11 35.20 0.582005 June-Oct 142 4+5 IG-Orleans 130.61 TIN 86.0 9.6 4.4 139.4 46.2 93.2 5.03 66.87 0.512006 June-Oct 142 4+5 IG-Orleans 130.61 TIN 93.3 3.9 2.8 53.6 10.5 43.0 2.32 80.35 0.622007 June-Oct 142 4+5 IG-Orleans 130.61 TIN 91.3 5.1 3.6 102.3 29.4 72.9 3.93 71.29 0.552008 June-Oct 137 4+5 IG-Orleans 130.61 TIN 88.5 8.6 2.9 151.1 38.6 112.5 6.29 74.44 0.572005 June-Oct 142 4+5+6 IG-AbvTrin 146.23 TIN 85.1 9.5 5.4 140.8 46.4 94.4 4.55 67.06 0.462007 June-Oct 142 4+5+6 IG-AbvTrin 146.23 TIN 90.2 5.0 4.7 103.5 23.8 79.7 3.84 77.03 0.532008 June-Oct 137 4+5+6 IG-AbvTrin 146.23 TIN 87.8 8.6 3.6 152.2 37.6 114.7 5.72 75.33 0.522005 June-Oct 142 4+5+6+7 IG-Turwar 183.94 TIN 76.3 17.4 6.3 157.0 73.6 83.4 3.19 53.14 0.292007 June-Oct 142 4+5+6+7 IG-Turwar 183.94 TIN 84.9 8.9 6.2 110.0 50.2 59.8 2.29 54.36 0.302008 June-Oct 137 4+5+6+7 IG-Turwar 183.94 TIN 83.0 12.5 4.5 161.0 53.9 107.1 4.25 66.53 0.362008 June-Oct 137 4A IG-Walker 33.73 TIN 99.2 0.3 0.5 134.8 111.5 23.3 5.04 17.27 0.512008 June-Oct 137 4B Walker-Seiad 27.42 TIN 91.3 8.4 0.3 122.2 94.3 27.9 7.43 22.85 0.832005 June-Oct 142 5 Seiad-Orlean 69.46 TIN 91.7 3.1 5.2 103.1 46.2 56.9 5.77 55.22 0.792006 June-Oct 142 5 Seiad-Orlean 69.46 TIN 91.9 3.4 4.6 87.8 45.2 42.6 4.32 48.51 0.702007 June-Oct 142 5 Seiad-Orlean 69.46 TIN 92.6 2.6 4.8 63.1 29.4 33.7 3.41 53.41 0.772008 June-Oct 137 5 Seiad-Orlean 69.46 TIN 94.3 2.4 3.3 99.9 38.6 61.3 6.44 61.34 0.882005 June-Oct 142 6 Orleans-AbvTrin 15.62 TIN 97.0 0.0 3.0 47.6 46.4 1.2 0.55 2.58 0.172007 June-Oct 142 6 Orleans-AbvTrin 15.62 TIN 96.1 0.0 3.9 30.6 23.8 6.8 3.06 22.23 1.422008 June-Oct 137 6 Orleans-AbvTrin 15.62 TIN 97.2 0.0 2.8 39.7 37.6 2.2 1.02 5.50 0.352005 June-Oct 142 6A Orl-AbvTrin 16.62 TIN 75.0 22.7 2.3 61.6 64.9 -3.3 -1.42 -5.43 -0.332007 June-Oct 142 6A Orl-AbvTrin 16.62 TIN 83.5 13.1 3.4 35.2 23.3 11.8 5.02 33.68 2.032008 June-Oct 137 6A Orl-AbvTrin 16.62 TIN 82.6 15.1 2.4 46.8 35.2 11.6 5.08 24.71 1.492005 June-Oct 142 7 AbvTrin-Turwar 37.71 TIN 74.1 22.3 3.6 62.6 73.6 -11.0 -2.05 -17.56 -0.472007 June-Oct 142 7 AbvTrin-Turwar 37.71 TIN 78.6 15.2 6.2 30.3 50.2 -19.9 -3.72 -65.89 -1.75

__________________________________________________________________________________ Appendices - Klamath Nutrient Loading & Retention Dynamics in Free-Flowing Reaches 2005-2008, Prepared by Kier Associates, Aquatic Ecosystem Sciences, & W. Walker for the Yurok Tribe, June 2010 A-11
Inflow Load Retention % of Total Inflow MT
Year Season Day
s
Reach Number Reach Name Miles P
aram
eter
Mai
nste
m
Gag
ed T
ribs
Ung
aged
T
ribs
Tot
al I
nflo
w
Loa
d
Out
flow
Loa
d (M
T)
MT kg/day
/mi % %/mi2008 June-Oct 137 7 AbvTrin-Turwar 37.71 TIN 81.0 15.2 3.8 46.4 53.9 -7.5 -1.46 -16.28 -0.432005 June-Oct 142 7A AbvTrin-Turwar 36.71 TIN 96.6 0.0 3.4 67.2 73.6 -6.4 -1.23 -9.56 -0.262007 June-Oct 142 7A AbvTrin-Turwar 36.71 TIN 92.5 0.0 7.5 25.2 50.2 -25.0 -4.79 -99.11 -2.702008 June-Oct 137 7A AbvTrin-Turwar 36.71 TIN 95.3 0.0 4.7 37.0 53.9 -16.9 -3.36 -45.76 -1.252005 June-Oct 142 4 IG-Seiad 61.15 SRP 89.3 9.7 1.0 45.9 45.1 0.7 0.08 1.60 0.032006 June-Oct 142 4 IG-Seiad 61.15 SRP 89.5 9.3 1.2 62.8 56.5 6.3 0.72 10.00 0.162007 June-Oct 142 4 IG-Seiad 61.15 SRP 93.7 5.7 0.6 54.4 50.3 4.2 0.48 7.68 0.132008 June-Oct 137 4 IG-Seiad 61.15 SRP 94.2 4.7 1.1 54.5 51.0 3.5 0.42 6.48 0.112005 June-Oct 142 4+5 IG-Orleans 130.61 SRP 82.9 10.4 6.6 49.4 41.0 8.3 0.45 16.87 0.132006 June-Oct 142 4+5 IG-Orleans 130.61 SRP 88.5 9.2 2.2 34.6 27.7 7.0 0.38 20.13 0.152007 June-Oct 142 4+5 IG-Orleans 130.61 SRP 90.1 6.4 3.4 56.6 46.8 9.8 0.53 17.24 0.132008 June-Oct 137 4+5 IG-Orleans 130.61 SRP 90.0 6.0 4.0 57.1 42.8 14.3 0.80 25.13 0.192005 June-Oct 142 4+5+6 IG-AbvTrin 146.23 SRP 81.7 10.3 8.0 50.1 36.3 13.8 0.67 27.59 0.192007 June-Oct 142 4+5+6 IG-AbvTrin 146.23 SRP 89.1 6.4 4.5 57.2 47.4 9.8 0.47 17.16 0.122008 June-Oct 137 4+5+6 IG-AbvTrin 146.23 SRP 89.1 5.9 5.0 57.7 42.0 15.7 0.78 27.14 0.192005 June-Oct 142 4+5+6+7 IG-Turwar 183.94 SRP 76.4 13.9 9.7 53.6 31.5 22.1 0.85 41.28 0.222007 June-Oct 142 4+5+6+7 IG-Turwar 183.94 SRP 85.9 8.1 6.0 59.4 36.6 22.8 0.87 38.42 0.212008 June-Oct 137 4+5+6+7 IG-Turwar 183.94 SRP 86.0 7.7 6.4 59.8 30.7 29.1 1.15 48.59 0.262008 June-Oct 137 4A IG-Walker 33.73 SRP 94.8 4.5 0.7 54.2 55.9 -1.7 -0.37 -3.12 -0.092008 June-Oct 137 4B Walker-Seiad 27.42 SRP 99.4 0.2 0.4 56.2 51.0 5.2 1.39 9.30 0.342005 June-Oct 142 5 Seiad-Orlean 69.46 SRP 92.8 1.4 5.8 48.6 41.0 7.6 0.77 15.62 0.222006 June-Oct 142 5 Seiad-Orlean 69.46 SRP 95.0 1.3 3.6 59.4 54.5 4.9 0.50 8.31 0.122007 June-Oct 142 5 Seiad-Orlean 69.46 SRP 95.9 1.1 3.1 52.4 46.8 5.6 0.57 10.64 0.152008 June-Oct 137 5 Seiad-Orlean 69.46 SRP 95.2 1.6 3.2 53.6 42.8 10.8 1.14 20.19 0.292005 June-Oct 142 6 Orleans-AbvTrin 15.62 SRP 98.2 0.0 1.8 41.8 36.3 5.5 2.48 13.15 0.842007 June-Oct 142 6 Orleans-AbvTrin 15.62 SRP 98.7 0.0 1.3 47.5 47.4 0.1 0.03 0.14 0.012008 June-Oct 137 6 Orleans-AbvTrin 15.62 SRP 98.6 0.0 1.4 43.3 42.0 1.3 0.61 3.02 0.192005 June-Oct 142 6A Orl-AbvTrin 16.62 SRP 93.1 5.2 1.7 44.1 36.8 7.3 3.08 16.47 0.992007 June-Oct 142 6A Orl-AbvTrin 16.62 SRP 96.3 2.4 1.3 48.6 45.9 2.8 1.18 5.70 0.342008 June-Oct 137 6A Orl-AbvTrin 16.62 SRP 96.1 2.6 1.3 44.5 41.0 3.6 1.56 7.99 0.482005 June-Oct 142 7 AbvTrin-Turwar 37.71 SRP 91.2 5.8 3.0 39.8 31.5 8.3 1.55 20.87 0.552007 June-Oct 142 7 AbvTrin-Turwar 37.71 SRP 95.6 2.4 2.0 49.6 36.6 13.0 2.43 26.22 0.702008 June-Oct 137 7 AbvTrin-Turwar 37.71 SRP 95.3 2.7 2.1 44.1 30.7 13.4 2.59 30.35 0.802005 June-Oct 142 7A AbvTrin-Turwar 36.71 SRP 96.9 0.0 3.1 38.0 31.5 6.5 1.25 17.20 0.472007 June-Oct 142 7A AbvTrin-Turwar 36.71 SRP 97.9 0.0 2.1 46.9 36.6 10.3 1.97 21.95 0.602008 June-Oct 137 7A AbvTrin-Turwar 36.71 SRP 97.8 0.0 2.2 41.9 30.7 11.1 2.22 26.61 0.732005 June-Oct 142 4 IG-Seiad 61.15 PP 89.3 8.6 2.1 12.7 12.2 0.5 0.06 4.14 0.072006 June-Oct 142 4 IG-Seiad 61.15 PP 83.1 14.8 2.1 21.3 23.8 -2.5 -0.29 -11.87 -0.192007 June-Oct 142 4 IG-Seiad 61.15 PP 94.8 4.0 1.2 17.2 16.2 1.0 0.11 5.77 0.092008 June-Oct 137 4 IG-Seiad 61.15 PP 92.2 5.6 2.1 16.1 17.8 -1.7 -0.20 -10.53 -0.172005 June-Oct 142 4+5 IG-Orleans 130.61 PP 75.4 11.8 12.8 15.0 16.6 -1.5 -0.08 -10.22 -0.082006 June-Oct 142 4+5 IG-Orleans 130.61 PP 79.6 14.5 5.9 7.7 9.7 -2.0 -0.11 -25.31 -0.192007 June-Oct 142 4+5 IG-Orleans 130.61 PP 85.1 8.9 6.0 19.2 23.4 -4.2 -0.23 -21.99 -0.172008 June-Oct 137 4+5 IG-Orleans 130.61 PP 83.0 9.4 7.6 17.9 16.5 1.3 0.07 7.32 0.062005 June-Oct 142 4+5+6 IG-AbvTrin 146.23 PP 73.2 11.5 15.3 15.5 16.5 -1.1 -0.05 -6.88 -0.052007 June-Oct 142 4+5+6 IG-AbvTrin 146.23 PP 83.5 8.7 7.8 19.6 22.3 -2.7 -0.13 -13.90 -0.102008 June-Oct 137 4+5+6 IG-AbvTrin 146.23 PP 81.4 9.2 9.3 18.2 15.9 2.3 0.12 12.68 0.09

__________________________________________________________________________________ Appendices - Klamath Nutrient Loading & Retention Dynamics in Free-Flowing Reaches 2005-2008, Prepared by Kier Associates, Aquatic Ecosystem Sciences, & W. Walker for the Yurok Tribe, June 2010 A-12
Inflow Load Retention % of Total Inflow MT
Year Season Day
s
Reach Number Reach Name Miles P
aram
eter
Mai
nste
m
Gag
ed T
ribs
Ung
aged
T
ribs
Tot
al I
nflo
w
Loa
d
Out
flow
Loa
d (M
T)
MT kg/day
/mi % %/mi2005 June-Oct 142 4+5+6+7 IG-Turwar 183.94 PP 52.3 33.5 14.2 21.7 28.9 -7.3 -0.28 -33.53 -0.182007 June-Oct 142 4+5+6+7 IG-Turwar 183.94 PP 72.9 17.7 9.4 22.4 37.7 -15.3 -0.58 -68.04 -0.372008 June-Oct 137 4+5+6+7 IG-Turwar 183.94 PP 68.0 21.7 10.3 21.8 22.7 -0.9 -0.04 -4.11 -0.022008 June-Oct 137 4A IG-Walker 33.73 PP 96.6 2.0 1.4 15.3 19.4 -4.0 -0.87 -26.14 -0.782008 June-Oct 137 4B Walker-Seiad 27.42 PP 96.4 3.0 0.6 20.1 17.8 2.3 0.62 11.55 0.422005 June-Oct 142 5 Seiad-Orlean 69.46 PP 83.8 4.7 11.5 14.5 16.6 -2.1 -0.21 -14.21 -0.202006 June-Oct 142 5 Seiad-Orlean 69.46 PP 88.5 6.8 4.7 26.9 36.9 -10.0 -1.02 -37.19 -0.542007 June-Oct 142 5 Seiad-Orlean 69.46 PP 89.2 5.6 5.2 18.2 23.4 -5.2 -0.53 -28.66 -0.412008 June-Oct 137 5 Seiad-Orlean 69.46 PP 90.9 3.9 5.2 19.5 16.5 3.0 0.32 15.34 0.222005 June-Oct 142 6 Orleans-AbvTrin 15.62 PP 97.4 0.0 2.6 17.0 16.5 0.5 0.21 2.77 0.182007 June-Oct 142 6 Orleans-AbvTrin 15.62 PP 98.4 0.0 1.6 23.8 22.3 1.5 0.68 6.31 0.402008 June-Oct 137 6 Orleans-AbvTrin 15.62 PP 98.0 0.0 2.0 16.9 15.9 1.0 0.47 5.93 0.382005 June-Oct 142 6A Orl-AbvTrin 16.62 PP 73.6 24.4 2.0 22.5 23.2 -0.7 -0.29 -3.02 -0.182007 June-Oct 142 6A Orl-AbvTrin 16.62 PP 89.9 8.7 1.4 26.1 24.3 1.8 0.75 6.75 0.412008 June-Oct 137 6A Orl-AbvTrin 16.62 PP 82.9 15.3 1.7 20.0 21.8 -1.9 -0.82 -9.34 -0.562005 June-Oct 142 7 AbvTrin-Turwar 37.71 PP 72.8 24.2 3.1 22.7 28.9 -6.2 -1.16 -27.27 -0.722007 June-Oct 142 7 AbvTrin-Turwar 37.71 PP 88.7 9.0 2.3 25.1 37.7 -12.5 -2.34 -49.86 -1.322008 June-Oct 137 7 AbvTrin-Turwar 37.71 PP 81.5 15.7 2.8 19.5 22.7 -3.2 -0.62 -16.43 -0.442005 June-Oct 142 7A AbvTrin-Turwar 36.71 PP 97.1 0.0 2.9 23.9 28.9 -5.1 -0.97 -21.14 -0.582007 June-Oct 142 7A AbvTrin-Turwar 36.71 PP 97.6 0.0 2.4 24.9 37.7 -12.8 -2.45 -51.42 -1.402008 June-Oct 137 7A AbvTrin-Turwar 36.71 PP 97.6 0.0 2.4 22.4 22.7 -0.3 -0.07 -1.52 -0.042005 June-Oct 142 4 IG-Seiad 61.15 ON 88.3 10.4 1.3 289.8 349.5 -59.7 -6.88 -20.61 -0.342006 June-Oct 142 4 IG-Seiad 61.15 ON 89.2 9.0 1.8 361.2 352.6 8.6 0.99 2.38 0.042007 June-Oct 142 4 IG-Seiad 61.15 ON 95.8 3.3 0.8 334.6 283.7 50.8 5.85 15.20 0.252008 June-Oct 137 4 IG-Seiad 61.15 ON 93.9 4.4 1.7 287.3 275.0 12.3 1.47 4.29 0.072006 June-Oct 142 4+5 IG-Orleans 130.61 ON 84.5 11.4 4.1 158.1 140.6 17.5 0.94 11.07 0.082007 June-Oct 142 4+5 IG-Orleans 130.61 ON 90.3 5.1 4.6 354.9 315.3 39.6 2.13 11.15 0.092008 June-Oct 137 4+5 IG-Orleans 130.61 ON 86.1 7.8 6.1 313.6 267.1 46.6 2.60 14.85 0.112007 June-Oct 142 4+5+6 IG-AbvTrin 146.23 ON 89.0 5.0 6.0 360.1 310.7 49.4 2.38 13.73 0.092008 June-Oct 137 4+5+6 IG-AbvTrin 146.23 ON 84.7 7.7 7.5 318.5 267.3 51.2 2.56 16.07 0.112007 June-Oct 142 4+5+6+7 IG-Turwar 183.94 ON 81.3 11.2 7.5 394.3 360.2 34.1 1.31 8.65 0.052008 June-Oct 137 4+5+6+7 IG-Turwar 183.94 ON 77.2 13.7 9.1 349.7 289.5 60.2 2.39 17.21 0.092008 June-Oct 137 4A IG-Walker 33.73 ON 96.3 2.6 1.1 280.4 303.2 -22.8 -4.94 -8.14 -0.242008 June-Oct 137 4B Walker-Seiad 27.42 ON 97.8 1.7 0.6 310.2 275.0 35.2 9.36 11.33 0.412006 June-Oct 142 5 Seiad-Orlean 69.46 ON 92.2 3.1 4.7 382.6 384.0 -1.4 -0.15 -0.37 -0.012007 June-Oct 142 5 Seiad-Orlean 69.46 ON 93.3 2.3 4.4 304.0 315.3 -11.3 -1.14 -3.71 -0.052008 June-Oct 137 5 Seiad-Orlean 69.46 ON 91.3 4.0 4.8 301.3 267.1 34.3 3.60 11.37 0.162007 June-Oct 142 6 Orleans-AbvTrin 15.62 ON 98.4 0.0 1.6 320.5 310.7 9.9 4.45 3.08 0.202008 June-Oct 137 6 Orleans-AbvTrin 15.62 ON 98.2 0.0 1.8 271.9 267.3 4.6 2.15 1.69 0.112007 June-Oct 142 6A Orl-AbvTrin 16.62 ON 91.0 7.5 1.5 346.4 333.6 12.8 5.43 3.70 0.222008 June-Oct 137 6A Orl-AbvTrin 16.62 ON 90.4 8.0 1.6 295.4 292.8 2.6 1.15 0.89 0.052007 June-Oct 142 7 AbvTrin-Turwar 37.71 ON 90.1 7.5 2.4 344.8 360.2 -15.3 -2.86 -4.45 -0.122008 June-Oct 137 7 AbvTrin-Turwar 37.71 ON 89.6 7.9 2.6 298.5 289.5 9.0 1.74 3.02 0.082007 June-Oct 142 7A AbvTrin-Turwar 36.71 ON 97.6 0.0 2.4 341.9 360.2 -18.3 -3.51 -5.35 -0.152008 June-Oct 137 7A AbvTrin-Turwar 36.71 ON 97.4 0.0 2.6 300.5 289.5 11.0 2.18 3.66 0.102007 July-Sept 92 1 Keno-Copco 26.92 TP 92.0 0.0 8.0 52.8 49.5 3.3 1.33 6.26 0.232008 July-Sept 92 1 Keno-Copco 26.92 TP 92.4 0.0 7.6 51.7 49.3 2.4 0.98 4.68 0.17

__________________________________________________________________________________ Appendices - Klamath Nutrient Loading & Retention Dynamics in Free-Flowing Reaches 2005-2008, Prepared by Kier Associates, Aquatic Ecosystem Sciences, & W. Walker for the Yurok Tribe, June 2010 A-13
Inflow Load Retention % of Total Inflow MT
Year Season Day
s
Reach Number Reach Name Miles P
aram
eter
Mai
nste
m
Gag
ed T
ribs
Ung
aged
T
ribs
Tot
al I
nflo
w
Loa
d
Out
flow
Loa
d (M
T)
MT kg/day
/mi % %/mi2005 July-Sept 92 4 IG-Seiad 61.15 TP 93.4 6.1 0.6 36.4 33.7 2.7 0.48 7.43 0.122006 July-Sept 92 4 IG-Seiad 61.15 TP 89.6 9.3 1.1 41.3 35.7 5.6 1.00 13.67 0.222007 July-Sept 92 4 IG-Seiad 61.15 TP 95.8 3.7 0.4 45.0 40.0 5.0 0.89 11.14 0.182008 July-Sept 92 4 IG-Seiad 61.15 TP 96.0 3.2 0.8 41.5 37.8 3.7 0.66 9.00 0.152005 July-Sept 92 4+5 IG-Orleans 130.61 TP 86.6 7.2 6.3 39.2 34.2 5.0 0.42 12.79 0.102006 July-Sept 92 4+5 IG-Orleans 130.61 TP 86.6 10.0 3.4 28.5 26.9 1.7 0.14 5.91 0.052007 July-Sept 92 4+5 IG-Orleans 130.61 TP 92.2 4.6 3.2 46.7 37.0 9.7 0.81 20.74 0.162008 July-Sept 92 4+5 IG-Orleans 130.61 TP 92.0 4.6 3.4 43.4 32.8 10.6 0.88 24.36 0.192005 July-Sept 92 4+5+6 IG-AbvTrin 146.23 TP 85.7 7.1 7.3 39.6 30.3 9.3 0.69 23.48 0.162007 July-Sept 92 4+5+6 IG-AbvTrin 146.23 TP 91.5 4.5 4.0 47.1 37.8 9.3 0.69 19.79 0.142008 July-Sept 92 4+5+6 IG-AbvTrin 146.23 TP 91.1 4.5 4.3 43.8 32.5 11.3 0.84 25.80 0.182005 July-Sept 92 4+5+6+7 IG-Turwar 183.94 TP 79.4 12.2 8.3 42.7 27.9 14.9 0.88 34.75 0.192007 July-Sept 92 4+5+6+7 IG-Turwar 183.94 TP 87.7 7.3 5.0 49.1 39.4 9.7 0.57 19.79 0.112008 July-Sept 92 4+5+6+7 IG-Turwar 183.94 TP 86.2 8.3 5.5 46.3 28.3 17.9 1.06 38.75 0.212008 July-Sept 92 4A IG-Walker 33.73 TP 96.6 2.9 0.5 41.3 43.2 -1.9 -0.62 -4.69 -0.142008 July-Sept 92 4B Walker-Seiad 27.42 TP 99.4 0.3 0.3 43.5 37.8 5.7 2.25 13.06 0.482005 July-Sept 92 5 Seiad-Orlean 69.46 TP 92.2 1.6 6.1 36.5 34.2 2.3 0.36 6.34 0.092006 July-Sept 92 5 Seiad-Orlean 69.46 TP 94.0 2.1 3.8 37.9 40.3 -2.3 -0.36 -6.12 -0.092007 July-Sept 92 5 Seiad-Orlean 69.46 TP 95.7 1.1 3.2 41.7 37.0 4.7 0.73 11.23 0.162008 July-Sept 92 5 Seiad-Orlean 69.46 TP 95.4 1.7 2.9 39.6 32.8 6.8 1.07 17.22 0.252005 July-Sept 92 6 Orleans-AbvTrin 15.62 TP 98.8 0.0 1.2 34.6 30.3 4.3 2.99 12.40 0.792007 July-Sept 92 6 Orleans-AbvTrin 15.62 TP 99.0 0.0 1.0 37.4 37.8 -0.4 -0.26 -1.00 -0.062008 July-Sept 92 6 Orleans-AbvTrin 15.62 TP 98.8 0.0 1.2 33.2 32.5 0.7 0.51 2.20 0.142005 July-Sept 92 6A Orl-AbvTrin 16.62 TP 92.3 6.5 1.2 37.0 29.2 7.9 5.16 21.29 1.282007 July-Sept 92 6A Orl-AbvTrin 16.62 TP 95.3 3.7 1.0 38.9 38.5 0.4 0.26 1.02 0.062008 July-Sept 92 6A Orl-AbvTrin 16.62 TP 93.5 5.3 1.2 35.1 33.7 1.3 0.88 3.82 0.232005 July-Sept 92 7 AbvTrin-Turwar 37.71 TP 90.7 7.3 2.0 33.4 27.9 5.5 1.60 16.59 0.442007 July-Sept 92 7 AbvTrin-Turwar 37.71 TP 94.9 3.6 1.5 39.8 39.4 0.4 0.12 1.02 0.032008 July-Sept 92 7 AbvTrin-Turwar 37.71 TP 92.8 5.3 1.8 35.0 28.3 6.6 1.91 18.98 0.502005 July-Sept 92 7A AbvTrin-Turwar 36.71 TP 97.7 0.0 2.3 29.8 27.9 2.0 0.58 6.55 0.182007 July-Sept 92 7A AbvTrin-Turwar 36.71 TP 98.5 0.0 1.5 39.1 39.4 -0.4 -0.11 -0.93 -0.032008 July-Sept 92 7A AbvTrin-Turwar 36.71 TP 98.1 0.0 1.9 34.4 28.3 6.0 1.78 17.54 0.482007 July-Sept 92 1 Keno-Copco 26.92 TN 96.9 0.0 3.1 477.8 418.2 59.6 24.06 12.47 0.462008 July-Sept 92 1 Keno-Copco 26.92 TN 97.2 0.0 2.8 487.4 425.0 62.3 25.17 12.79 0.482005 July-Sept 92 4 IG-Seiad 61.15 TN 94.9 4.5 0.6 238.5 270.3 -31.7 -5.64 -13.29 -0.222006 July-Sept 92 4 IG-Seiad 61.15 TN 91.0 7.7 1.3 224.9 172.4 52.5 9.33 23.35 0.382007 July-Sept 92 4 IG-Seiad 61.15 TN 97.6 1.9 0.5 262.6 194.7 67.9 12.07 25.87 0.422008 July-Sept 92 4 IG-Seiad 61.15 TN 96.3 2.8 0.9 253.5 199.4 54.1 9.61 21.33 0.352006 July-Sept 92 4+5 IG-Orleans 130.61 TN 85.2 10.2 4.6 138.6 106.9 31.8 2.64 22.91 0.182007 July-Sept 92 4+5 IG-Orleans 130.61 TN 93.6 2.8 3.6 273.8 183.6 90.2 7.51 32.95 0.252008 July-Sept 92 4+5 IG-Orleans 130.61 TN 91.2 5.2 3.6 267.7 155.2 112.5 9.37 42.03 0.322007 July-Sept 92 4+5+6 IG-AbvTrin 146.23 TN 92.8 2.8 4.5 276.3 178.3 97.9 7.28 35.44 0.242008 July-Sept 92 4+5+6 IG-AbvTrin 146.23 TN 90.3 5.1 4.6 270.4 152.5 117.8 8.76 43.58 0.302007 July-Sept 92 4+5+6+7 IG-Turwar 183.94 TN 86.6 7.9 5.5 296.0 205.9 90.1 5.32 30.44 0.172008 July-Sept 92 4+5+6+7 IG-Turwar 183.94 TN 84.5 9.8 5.7 288.8 176.6 112.1 6.63 38.83 0.212008 July-Sept 92 4A IG-Walker 33.73 TN 98.1 1.4 0.6 248.9 231.6 17.3 5.57 6.94 0.212008 July-Sept 92 4B Walker-Seiad 27.42 TN 98.0 1.6 0.3 236.2 199.4 36.8 14.59 15.58 0.57

__________________________________________________________________________________ Appendices - Klamath Nutrient Loading & Retention Dynamics in Free-Flowing Reaches 2005-2008, Prepared by Kier Associates, Aquatic Ecosystem Sciences, & W. Walker for the Yurok Tribe, June 2010 A-14
Inflow Load Retention % of Total Inflow MT
Year Season Day
s
Reach Number Reach Name Miles P
aram
eter
Mai
nste
m
Gag
ed T
ribs
Ung
aged
T
ribs
Tot
al I
nflo
w
Loa
d
Out
flow
Loa
d (M
T)
MT kg/day
/mi % %/mi2006 July-Sept 92 5 Seiad-Orlean 69.46 TN 91.5 3.5 5.0 188.5 174.0 14.5 2.27 7.71 0.112007 July-Sept 92 5 Seiad-Orlean 69.46 TN 94.5 1.3 4.2 205.9 183.6 22.3 3.49 10.83 0.162008 July-Sept 92 5 Seiad-Orlean 69.46 TN 93.4 3.1 3.5 213.6 155.2 58.4 9.15 27.36 0.392007 July-Sept 92 6 Orleans-AbvTrin 15.62 TN 98.7 0.0 1.3 186.0 178.3 7.7 5.34 4.13 0.262008 July-Sept 92 6 Orleans-AbvTrin 15.62 TN 98.3 0.0 1.7 157.8 152.5 5.3 3.68 3.35 0.212007 July-Sept 92 6A Orl-AbvTrin 16.62 TN 90.9 7.9 1.2 201.9 190.4 11.5 7.50 5.68 0.342008 July-Sept 92 6A Orl-AbvTrin 16.62 TN 90.2 8.3 1.5 172.1 160.6 11.5 7.54 6.70 0.402007 July-Sept 92 7 AbvTrin-Turwar 37.71 TN 90.0 8.0 1.9 198.1 205.9 -7.8 -2.26 -3.95 -0.102008 July-Sept 92 7 AbvTrin-Turwar 37.71 TN 89.2 8.4 2.4 171.0 176.6 -5.7 -1.64 -3.32 -0.092007 July-Sept 92 7A AbvTrin-Turwar 36.71 TN 98.0 0.0 2.0 194.3 205.9 -11.6 -3.44 -5.98 -0.162008 July-Sept 92 7A AbvTrin-Turwar 36.71 TN 97.5 0.0 2.5 164.7 176.6 -11.9 -3.53 -7.23 -0.202005 July-Sept 92 4 IG-Seiad 61.15 TIN 96.4 3.3 0.4 68.9 34.4 34.6 6.14 50.15 0.822006 July-Sept 92 4 IG-Seiad 61.15 TIN 91.0 8.1 1.0 56.4 24.4 31.9 5.67 56.64 0.932007 July-Sept 92 4 IG-Seiad 61.15 TIN 98.9 0.6 0.4 51.6 21.6 30.0 5.33 58.10 0.952008 July-Sept 92 4 IG-Seiad 61.15 TIN 96.9 2.6 0.5 84.1 43.9 40.1 7.14 47.74 0.782005 July-Sept 92 4+5 IG-Orleans 130.61 TIN 90.9 5.0 4.0 73.1 15.3 57.8 4.81 79.06 0.612006 July-Sept 92 4+5 IG-Orleans 130.61 TIN 91.0 4.3 4.8 24.6 3.5 21.2 1.76 85.96 0.662007 July-Sept 92 4+5 IG-Orleans 130.61 TIN 95.1 1.5 3.4 53.7 6.4 47.4 3.94 88.16 0.672008 July-Sept 92 4+5 IG-Orleans 130.61 TIN 94.4 3.5 2.1 86.3 10.4 75.9 6.32 87.94 0.672005 July-Sept 92 4+5+6 IG-AbvTrin 146.23 TIN 90.3 5.0 4.7 73.6 13.3 60.2 4.48 81.87 0.562007 July-Sept 92 4+5+6 IG-AbvTrin 146.23 TIN 94.3 1.5 4.2 54.2 5.7 48.5 3.60 89.44 0.612008 July-Sept 92 4+5+6 IG-AbvTrin 146.23 TIN 93.9 3.5 2.6 86.8 6.9 79.9 5.94 92.09 0.632005 July-Sept 92 4+5+6+7 IG-Turwar 183.94 TIN 82.3 12.4 5.3 80.7 28.4 52.3 3.09 64.83 0.352007 July-Sept 92 4+5+6+7 IG-Turwar 183.94 TIN 89.1 5.7 5.2 57.3 22.2 35.1 2.07 61.22 0.332008 July-Sept 92 4+5+6+7 IG-Turwar 183.94 TIN 90.3 6.3 3.4 90.2 20.2 70.0 4.14 77.62 0.422008 July-Sept 92 4A IG-Walker 33.73 TIN 99.6 0.1 0.3 81.8 66.2 15.6 5.03 19.09 0.572008 July-Sept 92 4B Walker-Seiad 27.42 TIN 96.7 3.1 0.2 68.5 43.9 24.5 9.72 35.82 1.312005 July-Sept 92 5 Seiad-Orlean 69.46 TIN 89.3 3.7 7.0 38.5 15.3 23.2 3.63 60.25 0.872006 July-Sept 92 5 Seiad-Orlean 69.46 TIN 89.9 3.7 6.4 27.2 13.5 13.7 2.14 50.39 0.732007 July-Sept 92 5 Seiad-Orlean 69.46 TIN 91.1 2.1 6.7 23.7 6.4 17.4 2.72 73.19 1.052008 July-Sept 92 5 Seiad-Orlean 69.46 TIN 95.2 1.8 3.0 46.2 10.4 35.8 5.59 77.44 1.112005 July-Sept 92 6 Orleans-AbvTrin 15.62 TIN 96.7 0.0 3.3 15.8 13.3 2.5 1.72 15.66 1.002007 July-Sept 92 6 Orleans-AbvTrin 15.62 TIN 93.4 0.0 6.6 6.8 5.7 1.1 0.76 16.02 1.032008 July-Sept 92 6 Orleans-AbvTrin 15.62 TIN 95.5 0.0 4.5 10.9 6.9 4.0 2.81 36.98 2.372005 July-Sept 92 6A Orl-AbvTrin 16.62 TIN 69.1 28.5 2.3 22.1 24.2 -2.0 -1.33 -9.20 -0.552007 July-Sept 92 6A Orl-AbvTrin 16.62 TIN 68.9 26.2 4.9 9.2 7.9 1.3 0.85 14.13 0.852008 July-Sept 92 6A Orl-AbvTrin 16.62 TIN 76.6 19.8 3.6 13.6 9.9 3.7 2.42 27.19 1.642005 July-Sept 92 7 AbvTrin-Turwar 37.71 TIN 65.2 30.8 4.0 20.5 28.4 -7.9 -2.28 -38.62 -1.022007 July-Sept 92 7 AbvTrin-Turwar 37.71 TIN 64.6 27.4 8.0 8.9 22.2 -13.4 -3.85 -150.87 -4.002008 July-Sept 92 7 AbvTrin-Turwar 37.71 TIN 66.5 26.0 7.4 10.3 20.2 -9.9 -2.85 -95.67 -2.542005 July-Sept 92 7A AbvTrin-Turwar 36.71 TIN 96.7 0.0 3.3 25.0 28.4 -3.4 -1.01 -13.59 -0.372007 July-Sept 92 7A AbvTrin-Turwar 36.71 TIN 91.8 0.0 8.2 8.6 22.2 -13.6 -4.02 -157.08 -4.282008 July-Sept 92 7A AbvTrin-Turwar 36.71 TIN 92.8 0.0 7.2 10.7 20.2 -9.5 -2.82 -89.47 -2.442005 July-Sept 92 4 IG-Seiad 61.15 SRP 92.7 6.8 0.5 28.1 26.1 2.0 0.35 7.01 0.112006 July-Sept 92 4 IG-Seiad 61.15 SRP 90.5 8.7 0.9 33.1 26.8 6.3 1.11 18.92 0.312007 July-Sept 92 4 IG-Seiad 61.15 SRP 95.2 4.4 0.4 31.8 28.9 2.9 0.51 9.03 0.152008 July-Sept 92 4 IG-Seiad 61.15 SRP 95.9 3.4 0.7 31.0 28.9 2.1 0.38 6.82 0.11

__________________________________________________________________________________ Appendices - Klamath Nutrient Loading & Retention Dynamics in Free-Flowing Reaches 2005-2008, Prepared by Kier Associates, Aquatic Ecosystem Sciences, & W. Walker for the Yurok Tribe, June 2010 A-15
Inflow Load Retention % of Total Inflow MT
Year Season Day
s
Reach Number Reach Name Miles P
aram
eter
Mai
nste
m
Gag
ed T
ribs
Ung
aged
T
ribs
Tot
al I
nflo
w
Loa
d
Out
flow
Loa
d (M
T)
MT kg/day
/mi % %/mi2005 July-Sept 92 4+5 IG-Orleans 130.61 SRP 87.6 7.2 5.3 29.7 25.2 4.5 0.38 15.25 0.122006 July-Sept 92 4+5 IG-Orleans 130.61 SRP 88.8 8.5 2.7 23.0 19.6 3.4 0.29 14.91 0.112007 July-Sept 92 4+5 IG-Orleans 130.61 SRP 92.5 4.5 3.0 32.7 25.5 7.1 0.59 21.82 0.172008 July-Sept 92 4+5 IG-Orleans 130.61 SRP 92.8 4.2 3.0 32.0 24.0 8.0 0.67 25.00 0.192005 July-Sept 92 4+5+6 IG-AbvTrin 146.23 SRP 86.8 7.1 6.1 30.0 21.8 8.2 0.61 27.29 0.192007 July-Sept 92 4+5+6 IG-AbvTrin 146.23 SRP 91.9 4.5 3.7 32.9 26.4 6.5 0.48 19.75 0.142008 July-Sept 92 4+5+6 IG-AbvTrin 146.23 SRP 92.1 4.2 3.7 32.3 23.5 8.8 0.65 27.20 0.192005 July-Sept 92 4+5+6+7 IG-Turwar 183.94 SRP 83.8 8.9 7.3 31.1 15.4 15.7 0.93 50.35 0.272007 July-Sept 92 4+5+6+7 IG-Turwar 183.94 SRP 89.8 5.5 4.7 33.7 18.7 14.9 0.88 44.35 0.242008 July-Sept 92 4+5+6+7 IG-Turwar 183.94 SRP 89.8 5.4 4.9 33.1 14.9 18.2 1.08 55.05 0.302008 July-Sept 92 4A IG-Walker 33.73 SRP 96.2 3.4 0.4 30.9 32.4 -1.5 -0.49 -4.92 -0.152008 July-Sept 92 4B Walker-Seiad 27.42 SRP 99.7 0.0 0.2 32.5 28.9 3.6 1.44 11.18 0.412005 July-Sept 92 5 Seiad-Orlean 69.46 SRP 94.0 0.8 5.1 27.8 25.2 2.6 0.40 9.24 0.132006 July-Sept 92 5 Seiad-Orlean 69.46 SRP 95.6 1.1 3.3 28.0 28.4 -0.4 -0.06 -1.37 -0.022007 July-Sept 92 5 Seiad-Orlean 69.46 SRP 96.9 0.2 2.8 29.8 25.5 4.3 0.67 14.30 0.212008 July-Sept 92 5 Seiad-Orlean 69.46 SRP 96.6 1.0 2.5 29.9 24.0 5.9 0.92 19.70 0.282005 July-Sept 92 6 Orleans-AbvTrin 15.62 SRP 98.9 0.0 1.1 25.5 21.8 3.7 2.54 14.35 0.922007 July-Sept 92 6 Orleans-AbvTrin 15.62 SRP 99.1 0.0 0.9 25.8 26.4 -0.6 -0.44 -2.44 -0.162008 July-Sept 92 6 Orleans-AbvTrin 15.62 SRP 98.9 0.0 1.1 24.3 23.5 0.8 0.54 3.20 0.202005 July-Sept 92 6A Orl-AbvTrin 16.62 SRP 96.5 2.5 1.1 26.1 19.7 6.5 4.22 24.70 1.492007 July-Sept 92 6A Orl-AbvTrin 16.62 SRP 97.6 1.5 0.9 26.2 26.0 0.2 0.11 0.66 0.042008 July-Sept 92 6A Orl-AbvTrin 16.62 SRP 97.2 1.8 1.0 24.7 22.7 2.0 1.30 8.05 0.482005 July-Sept 92 7 AbvTrin-Turwar 37.71 SRP 95.3 2.8 1.9 22.9 15.4 7.5 2.15 32.59 0.862007 July-Sept 92 7 AbvTrin-Turwar 37.71 SRP 97.2 1.4 1.4 27.2 18.7 8.4 2.43 31.04 0.822008 July-Sept 92 7 AbvTrin-Turwar 37.71 SRP 96.5 1.8 1.7 24.3 14.9 9.4 2.72 38.83 1.032005 July-Sept 92 7A AbvTrin-Turwar 36.71 SRP 97.8 0.0 2.2 20.1 15.4 4.7 1.38 23.21 0.632007 July-Sept 92 7A AbvTrin-Turwar 36.71 SRP 98.6 0.0 1.4 26.4 18.7 7.6 2.26 28.95 0.792008 July-Sept 92 7A AbvTrin-Turwar 36.71 SRP 98.2 0.0 1.8 23.1 14.9 8.2 2.44 35.63 0.972005 July-Sept 92 4 IG-Seiad 61.15 PP 95.3 3.8 1.0 8.1 7.6 0.5 0.08 5.82 0.102006 July-Sept 92 4 IG-Seiad 61.15 PP 86.8 11.2 2.0 8.5 8.7 -0.2 -0.03 -2.17 -0.042007 July-Sept 92 4 IG-Seiad 61.15 PP 97.4 2.1 0.5 12.9 10.9 2.1 0.37 15.97 0.262008 July-Sept 92 4 IG-Seiad 61.15 PP 96.1 2.6 1.3 10.1 8.9 1.2 0.22 11.99 0.202005 July-Sept 92 4+5 IG-Orleans 130.61 PP 82.8 7.3 9.9 9.3 8.9 0.4 0.03 4.27 0.032006 July-Sept 92 4+5 IG-Orleans 130.61 PP 78.0 15.5 6.5 5.7 7.2 -1.5 -0.13 -26.85 -0.212007 July-Sept 92 4+5 IG-Orleans 130.61 PP 91.2 4.7 4.1 13.8 11.4 2.4 0.20 17.23 0.132008 July-Sept 92 4+5 IG-Orleans 130.61 PP 89.1 5.8 5.1 10.9 8.7 2.2 0.18 20.22 0.152005 July-Sept 92 4+5+6 IG-AbvTrin 146.23 PP 81.4 7.2 11.4 9.5 8.4 1.1 0.08 11.72 0.082007 July-Sept 92 4+5+6 IG-AbvTrin 146.23 PP 90.3 4.7 5.1 14.0 11.4 2.6 0.19 18.29 0.132008 July-Sept 92 4+5+6 IG-AbvTrin 146.23 PP 87.9 5.7 6.4 11.0 8.8 2.3 0.17 20.51 0.142005 July-Sept 92 4+5+6+7 IG-Turwar 183.94 PP 67.1 21.2 11.6 11.5 12.1 -0.6 -0.03 -5.07 -0.032007 July-Sept 92 4+5+6+7 IG-Turwar 183.94 PP 82.7 11.2 6.1 15.2 20.4 -5.1 -0.30 -33.58 -0.182008 July-Sept 92 4+5+6+7 IG-Turwar 183.94 PP 76.5 16.0 7.5 12.7 13.1 -0.4 -0.03 -3.44 -0.022008 July-Sept 92 4A IG-Walker 33.73 PP 97.7 1.5 0.8 9.9 11.7 -1.8 -0.57 -17.95 -0.532008 July-Sept 92 4B Walker-Seiad 27.42 PP 98.6 1.0 0.4 11.9 8.9 3.0 1.19 25.20 0.922005 July-Sept 92 5 Seiad-Orlean 69.46 PP 86.3 4.2 9.5 8.8 8.9 -0.1 -0.01 -0.84 -0.012006 July-Sept 92 5 Seiad-Orlean 69.46 PP 89.3 5.2 5.6 9.8 11.6 -1.9 -0.29 -18.96 -0.272007 July-Sept 92 5 Seiad-Orlean 69.46 PP 92.5 3.3 4.2 11.8 11.4 0.3 0.05 2.68 0.04

__________________________________________________________________________________ Appendices - Klamath Nutrient Loading & Retention Dynamics in Free-Flowing Reaches 2005-2008, Prepared by Kier Associates, Aquatic Ecosystem Sciences, & W. Walker for the Yurok Tribe, June 2010 A-16
Inflow Load Retention % of Total Inflow MT
Year Season Day
s
Reach Number Reach Name Miles P
aram
eter
Mai
nste
m
Gag
ed T
ribs
Ung
aged
T
ribs
Tot
al I
nflo
w
Loa
d
Out
flow
Loa
d (M
T)
MT kg/day
/mi % %/mi2008 July-Sept 92 5 Seiad-Orlean 69.46 PP 91.8 3.8 4.5 9.7 8.7 1.0 0.16 10.24 0.152005 July-Sept 92 6 Orleans-AbvTrin 15.62 PP 98.2 0.0 1.8 9.1 8.4 0.7 0.50 7.86 0.502007 July-Sept 92 6 Orleans-AbvTrin 15.62 PP 98.8 0.0 1.2 11.6 11.4 0.2 0.12 1.50 0.102008 July-Sept 92 6 Orleans-AbvTrin 15.62 PP 98.3 0.0 1.7 8.8 8.8 0.1 0.04 0.71 0.052005 July-Sept 92 6A Orl-AbvTrin 16.62 PP 82.2 16.3 1.5 10.8 9.4 1.5 0.96 13.56 0.822007 July-Sept 92 6A Orl-AbvTrin 16.62 PP 90.6 8.3 1.1 12.6 12.3 0.3 0.20 2.36 0.142008 July-Sept 92 6A Orl-AbvTrin 16.62 PP 84.9 13.7 1.5 10.2 11.0 -0.8 -0.52 -7.78 -0.472005 July-Sept 92 7 AbvTrin-Turwar 37.71 PP 80.6 17.0 2.5 10.4 12.1 -1.7 -0.49 -16.31 -0.432007 July-Sept 92 7 AbvTrin-Turwar 37.71 PP 90.0 8.3 1.7 12.7 20.4 -7.7 -2.21 -60.49 -1.602008 July-Sept 92 7 AbvTrin-Turwar 37.71 PP 84.3 13.4 2.3 10.4 13.1 -2.7 -0.78 -25.94 -0.692005 July-Sept 92 7A AbvTrin-Turwar 36.71 PP 97.3 0.0 2.7 9.6 12.1 -2.4 -0.72 -25.45 -0.692007 July-Sept 92 7A AbvTrin-Turwar 36.71 PP 98.2 0.0 1.8 12.6 20.4 -7.8 -2.31 -62.09 -1.692008 July-Sept 92 7A AbvTrin-Turwar 36.71 PP 97.9 0.0 2.1 11.3 13.1 -1.8 -0.55 -16.34 -0.452005 July-Sept 92 4 IG-Seiad 61.15 ON 93.7 5.7 0.7 170.5 234.3 -63.8 -11.34 -37.44 -0.612006 July-Sept 92 4 IG-Seiad 61.15 ON 91.2 7.4 1.4 166.0 142.2 23.8 4.23 14.35 0.232007 July-Sept 92 4 IG-Seiad 61.15 ON 97.3 2.2 0.5 209.4 169.7 39.7 7.06 18.96 0.312008 July-Sept 92 4 IG-Seiad 61.15 ON 96.0 2.9 1.1 169.1 155.1 14.0 2.49 8.28 0.142006 July-Sept 92 4+5 IG-Orleans 130.61 ON 84.1 11.3 4.6 112.8 103.0 9.8 0.81 8.68 0.072007 July-Sept 92 4+5 IG-Orleans 130.61 ON 93.2 3.1 3.7 218.5 177.4 41.2 3.43 18.85 0.142008 July-Sept 92 4+5 IG-Orleans 130.61 ON 89.7 5.9 4.4 180.9 144.3 36.6 3.05 20.24 0.152007 July-Sept 92 4+5+6 IG-AbvTrin 146.23 ON 92.4 3.1 4.5 220.5 171.3 49.2 3.66 22.30 0.152008 July-Sept 92 4+5+6 IG-AbvTrin 146.23 ON 88.7 5.8 5.5 183.1 145.9 37.2 2.77 20.32 0.142007 July-Sept 92 4+5+6+7 IG-Turwar 183.94 ON 86.4 8.0 5.6 235.8 184.0 51.8 3.06 21.98 0.122008 July-Sept 92 4+5+6+7 IG-Turwar 183.94 ON 81.7 11.5 6.8 198.7 157.1 41.6 2.46 20.92 0.112008 July-Sept 92 4A IG-Walker 33.73 ON 97.3 2.0 0.7 166.8 164.7 2.1 0.66 1.24 0.042008 July-Sept 92 4B Walker-Seiad 27.42 ON 98.6 1.0 0.4 167.0 155.1 11.9 4.73 7.15 0.262006 July-Sept 92 5 Seiad-Orlean 69.46 ON 91.4 3.7 4.9 155.6 158.9 -3.3 -0.52 -2.15 -0.032007 July-Sept 92 5 Seiad-Orlean 69.46 ON 94.9 1.2 3.9 178.8 177.4 1.5 0.23 0.83 0.012008 July-Sept 92 5 Seiad-Orlean 69.46 ON 92.9 3.4 3.7 166.9 144.3 22.6 3.54 13.55 0.202007 July-Sept 92 6 Orleans-AbvTrin 15.62 ON 98.9 0.0 1.1 179.3 171.3 8.0 5.57 4.46 0.292008 July-Sept 92 6 Orleans-AbvTrin 15.62 ON 98.5 0.0 1.5 146.5 145.9 0.6 0.41 0.40 0.032007 July-Sept 92 6A Orl-AbvTrin 16.62 ON 92.6 6.3 1.0 191.5 182.2 9.3 6.09 4.86 0.292008 July-Sept 92 6A Orl-AbvTrin 16.62 ON 90.9 7.7 1.4 158.7 150.0 8.7 5.69 5.49 0.332007 July-Sept 92 7 AbvTrin-Turwar 37.71 ON 91.8 6.5 1.7 186.6 184.0 2.6 0.76 1.41 0.042008 July-Sept 92 7 AbvTrin-Turwar 37.71 ON 90.3 7.6 2.1 161.5 157.1 4.4 1.26 2.70 0.072007 July-Sept 92 7A AbvTrin-Turwar 36.71 ON 98.3 0.0 1.7 185.3 184.0 1.3 0.39 0.71 0.022008 July-Sept 92 7A AbvTrin-Turwar 36.71 ON 97.8 0.0 2.2 153.4 157.1 -3.8 -1.11 -2.45 -0.07

__________________________________________________________________________________ Appendices - Klamath Nutrient Loading & Retention Dynamics in Free-Flowing Reaches 2005-2008, Prepared by Kier Associates, Aquatic Ecosystem Sciences, & W. Walker for the Yurok Tribe, June 2010 A-17
APPENDIX A4
Scatterplots showing the relationship between reach inflow nutrient concentration and retention for June-October periods
0.00 0.05 0.10 0.15 0.20TP Inflow FW Conc. (mg/L)
-1
0
1
2
3
TP R
eten
tion
(Kg/
day/
mi)
7 Abv Trin-Turwar6 Orleans-Abv Trin5 Seiad-Orleans4 IG-Seiad1 Keno-Copco
Reach
0.00 0.05 0.10 0.15 0.20TP Inflow FW Conc. (mg/L)
-0.5
0.0
0.5
1.0
TP R
eten
tion
(%/m
i)
0.01 0.02 0.03 0.04 0.05 0.06 0.07 0.08 0.09 0.10 0.11SRP Inflow FW Conc. (mg/L)
0
1
2
3
SRP
Ret
entio
n (K
g/da
y/m
i)
7 Abv Trin-Turwar6 Orleans-Abv Trin5 Seiad-Orleans4 IG-Seiad
Reach
0.01 0.02 0.03 0.04 0.05 0.06 0.07 0.08 0.09 0.10 0.11SRP Inflow FW Conc. (mg/L)
0.0
0.1
0.2
0.3
0.4
0.5
0.6
0.7
0.8
0.9
SRP
Ret
entio
n (%
/mi)
0.01 0.02 0.03 0.04PP Inflow FW Conc. (mg/L)
-3
-2
-1
0
1
PP R
eten
tion
(Kg/
day/
mi)
7 Abv Trin-Turwar6 Orleans-Abv Trin5 Seiad-Orleans4 IG-Seiad
Reach
0.01 0.02 0.03 0.04PP Inflow FW Conc. (mg/L)
-2
-1
0
1
PP R
eten
tion
(%/m
i)
Figure A4-1. Relationship of retention to flow-weighted average inflow concentrations for phosphorus parameters in river reaches for the June-October period. Each data point is a summary of one season/site, providing a comparison between years and sites. DWLS smoother is displayed as a visual aid. See report for similar figure of July-September.

__________________________________________________________________________________ Appendices - Klamath Nutrient Loading & Retention Dynamics in Free-Flowing Reaches 2005-2008, Prepared by Kier Associates, Aquatic Ecosystem Sciences, & W. Walker for the Yurok Tribe, June 2010 A-18
0.0 0.5 1.0 1.5 2.0TN Inflow FW Conc. (mg/L)
-10
0
10
20
TN R
eten
tion
(Kg/
day/
mi)
7 Abv Trin-Turwar6 Orleans-Abv Trin5 Seiad-Orleans4 IG-Seiad1 Keno-Copco
Reach
0.0 0.5 1.0 1.5 2.0TN Inflow FW Conc. (mg/L)
-0.3
-0.2
-0.1
0.0
0.1
0.2
0.3
0.4
TN R
eten
tion
(%/m
i)
0.0 0.1 0.2 0.3TIN Inflow FW Conc. (mg/L)
-5
0
5
10
TIN
Ret
entio
n (K
g/da
y/m
i)
7 Abv Trin-Turwar6 Orleans-Abv Trin5 Seiad-Orleans4 IG-Seiad
Reach
0.0 0.1 0.2 0.3TIN Inflow FW Conc. (mg/L)
-2
-1
0
1
2
TIN
Ret
entio
n (%
/mi)
0.1 0.2 0.3 0.4 0.5 0.6 0.7ON Inflow FW Conc. (mg/L)
-3
-2
-1
0
1
2
3
4
5
6
ON
Ret
entio
n (K
g/da
y/m
i)
7 Abv Trin-Turwar6 Orleans-Abv Trin5 Seiad-Orleans4 IG-Seiad
Reach
0.1 0.2 0.3 0.4 0.5 0.6 0.7ON Inflow FW Conc. (mg/L)
-0.2
-0.1
0.0
0.1
0.2
0.3
ON
Ret
entio
n (%
/mi)
Figure A4-2. Relationship of retention to flow-weighted average inflow concentrations for nitrogen parameters in river reaches for the June-October period. Each data point is a summary of one season/site, providing a comparison between years and sites. DWLS smoother is displayed as a visual aid on all plots except TN relative retention (uses LOWESS smoother). TN and ON data for Reach 4 in 2005 are excluded because that data point appeared to be an outlier (see footnote 5 in report for details). See report for similar figure of July-September.

__________________________________________________________________________________ Appendices - Klamath Nutrient Loading & Retention Dynamics in Free-Flowing Reaches 2005-2008, Prepared by Kier Associates, Aquatic Ecosystem Sciences, & W. Walker for the Yurok Tribe, June 2010 A-19
APPENDIX A5 Charts showing daily time series and summaries of outputs from multiple regression
model used to predict concentrations for each station This appendix is composed of 74 pages of multi-panel graphs, with one page one for each site and parameter used in the calculation of nutrient budgets. Ungaged tributaries are not included because their concentrations were represented by a single long-term average. The top two time series graph on each page show the measured nutrient concentrations, daily nutrient concentrations predicted by the regression model, and daily flows. Note that the predicted concentrations shown in the top time series graph are not the final daily concentrations used in the nutrient budget, because the graphed values do not include the interpolation of the residuals (which locally stretch predicted concentrations to fit measured concentrations). The bottom time series chart shows the final loads used in the nutrient budget (including the interpolation of residuals). The predicted concentrations were constrained to 50% of minimum observed and 200% of maximum observed to avoid wild extrapolation in winter months with no samples; this does not affect mass balances for the season (June – October and July – September) periods that were actually used in the report. The bar graphs on the middle/upper-right of the page show annual calendar year summaries of flow. The bar graph on the lower-right corner of the page compares the results of five algorithms for the prediction of mean daily load for the combined June 1 – October 20 period of 2005-2008. Note that the results shown in the lower-right bar graph include data from every year 2005-2008, but in the report we did not use the results from parameters/sites/years with insufficient data; thus for some parameters/sites/years (i.e. Trinity River TP), the magnitude shown in the chart for the difference between the five loading algorithms is much larger than it would be if years with insufficient data were excluded (i.e. the choice of loading algorithm has much less effect on report’s final results than is indicated in these bar graphs for some parameters). The bottom-left corner of the page shows summary information for the entire June 2005 – October 2008 period including the number of samples, relative standard error, and coefficient of determination (R2).

Site: KR_abv_Copco KR_abv_Copco TN Dates: 05/01/2005 ‐ 10/15/2008Note: the yearly results are inaccurate due to lack of samples in winter high‐flow periods.
Daily concentrations predicted for winter months are inaccurate but do not impact the formulation of June‐Oct nutrient balances.
Daily Time Series: Yearly Time Series:
Site: KR_abv_Copco KR_abv_Copco Variable: TN
Output Period 05/01/05 10/15/08 Mean Daily Flow 4.347 10^6 m3/day
Calibration Period 05/01/05 10/15/08 Mean Daily Load 6.32 mt/day
Sample Dates 05/17/05 10/15/08 Flow‐Wtd Conc 1.454 ppm
Samples 65 Relative Std Error 1.8%
Method: 5 ‐ Regression + Interpolation Regression R2 81%
Regression SE 0.15
Appendices - Klamath Nutrient Loading & Retention Dynamics in Free-Flowing Reaches 2005-2008, Prepared by Kier Associates, Aquatic Ecosystem Sci., & W. Walker for the Yurok Tribe A-20

Site: KR_abv_Copco KR_abv_Copco TP Dates: 05/01/2005 ‐ 10/15/2008Note: the yearly results are inaccurate due to lack of samples in winter high‐flow periods.
Daily concentrations predicted for winter months are inaccurate but do not impact the formulation of June‐Oct nutrient balances.
Daily Time Series: Yearly Time Series:
Site: KR_abv_Copco KR_abv_Copco Variable: TP
Output Period 05/01/05 10/15/08 Mean Daily Flow 4.347 10^6 m3/day
Calibration Period 05/01/05 10/15/08 Mean Daily Load 0.63 mt/day
Sample Dates 05/17/05 10/15/08 Flow‐Wtd Conc 0.145 ppm
Samples 65 Relative Std Error 2.4%
Method: 5 ‐ Regression + Interpolation Regression R2 74%
Regression SE 0.19
Appendices - Klamath Nutrient Loading & Retention Dynamics in Free-Flowing Reaches 2005-2008, Prepared by Kier Associates, Aquatic Ecosystem Sci., & W. Walker for the Yurok Tribe A-21

Site: KR_abv_Trin KR_abv_Trin INORGN Dates: 05/01/2005 ‐ 10/15/2008Note: the yearly results are inaccurate due to lack of samples in winter high‐flow periods.
Daily concentrations predicted for winter months are inaccurate but do not impact the formulation of June‐Oct nutrient balances.
Daily Time Series: Yearly Time Series:
Site: KR_abv_Trin KR_abv_Trin Variable: INORGN
Output Period 05/01/05 10/15/08 Mean Daily Flow 23.970 10^6 m3/day
Calibration Period 05/01/05 10/15/08 Mean Daily Load 8.60 mt/day
Sample Dates 06/01/05 10/15/08 Flow‐Wtd Conc 0.359 ppm
Samples 36 Relative Std Error 15.6%
Method: 5 ‐ Regression + Interpolation Regression R2 68%
Regression SE 0.57
Appendices - Klamath Nutrient Loading & Retention Dynamics in Free-Flowing Reaches 2005-2008, Prepared by Kier Associates, Aquatic Ecosystem Sci., & W. Walker for the Yurok Tribe A-22

Site: KR_abv_Trin KR_abv_Trin ORGN Dates: 05/01/2005 ‐ 10/15/2008Note: the yearly results are inaccurate due to lack of samples in winter high‐flow periods.
Daily concentrations predicted for winter months are inaccurate but do not impact the formulation of June‐Oct nutrient balances.
Daily Time Series: Yearly Time Series:
Site: KR_abv_Trin KR_abv_Trin Variable: ORGN
Output Period 05/01/05 10/15/08 Mean Daily Flow 23.970 10^6 m3/day
Calibration Period 05/01/05 10/15/08 Mean Daily Load 3.38 mt/day
Sample Dates 08/24/05 10/15/08 Flow‐Wtd Conc 0.141 ppm
Samples 33 Relative Std Error 3.9%
Method: 5 ‐ Regression + Interpolation Regression R2 72%
Regression SE 0.26
Appendices - Klamath Nutrient Loading & Retention Dynamics in Free-Flowing Reaches 2005-2008, Prepared by Kier Associates, Aquatic Ecosystem Sci., & W. Walker for the Yurok Tribe A-23

Site: KR_abv_Trin KR_abv_Trin PP Dates: 05/01/2005 ‐ 10/15/2008Note: the yearly results are inaccurate due to lack of samples in winter high‐flow periods.
Daily concentrations predicted for winter months are inaccurate but do not impact the formulation of June‐Oct nutrient balances.
Daily Time Series: Yearly Time Series:
Site: KR_abv_Trin KR_abv_Trin Variable: PP
Output Period 05/01/05 10/15/08 Mean Daily Flow 23.970 10^6 m3/day
Calibration Period 05/01/05 10/15/08 Mean Daily Load 0.21 mt/day
Sample Dates 06/01/05 10/15/08 Flow‐Wtd Conc 0.009 ppm
Samples 36 Relative Std Error 5.9%
Method: 5 ‐ Regression + Interpolation Regression R2 54%
Regression SE 0.34
Appendices - Klamath Nutrient Loading & Retention Dynamics in Free-Flowing Reaches 2005-2008, Prepared by Kier Associates, Aquatic Ecosystem Sci., & W. Walker for the Yurok Tribe A-24

Site: KR_abv_Trin KR_abv_Trin SRP Dates: 05/01/2005 ‐ 10/15/2008Note: the yearly results are inaccurate due to lack of samples in winter high‐flow periods.
Daily concentrations predicted for winter months are inaccurate but do not impact the formulation of June‐Oct nutrient balances.
Daily Time Series: Yearly Time Series:
Site: KR_abv_Trin KR_abv_Trin Variable: SRP
Output Period 05/01/05 10/15/08 Mean Daily Flow 23.970 10^6 m3/day
Calibration Period 05/01/05 10/15/08 Mean Daily Load 0.28 mt/day
Sample Dates 06/01/05 10/15/08 Flow‐Wtd Conc 0.012 ppm
Samples 36 Relative Std Error 2.8%
Method: 5 ‐ Regression + Interpolation Regression R2 92%
Regression SE 0.19
Appendices - Klamath Nutrient Loading & Retention Dynamics in Free-Flowing Reaches 2005-2008, Prepared by Kier Associates, Aquatic Ecosystem Sci., & W. Walker for the Yurok Tribe A-25

Site: KR_abv_Trin KR_abv_Trin TN Dates: 05/01/2005 ‐ 10/15/2008Note: the yearly results are inaccurate due to lack of samples in winter high‐flow periods.
Daily concentrations predicted for winter months are inaccurate but do not impact the formulation of June‐Oct nutrient balances.
Daily Time Series: Yearly Time Series:
Site: KR_abv_Trin KR_abv_Trin Variable: TN
Output Period 05/01/05 10/15/08 Mean Daily Flow 23.970 10^6 m3/day
Calibration Period 05/01/05 10/15/08 Mean Daily Load 6.41 mt/day
Sample Dates 08/24/05 10/15/08 Flow‐Wtd Conc 0.268 ppm
Samples 33 Relative Std Error 3.9%
Method: 5 ‐ Regression + Interpolation Regression R2 69%
Regression SE 0.26
Appendices - Klamath Nutrient Loading & Retention Dynamics in Free-Flowing Reaches 2005-2008, Prepared by Kier Associates, Aquatic Ecosystem Sci., & W. Walker for the Yurok Tribe A-26

Site: KR_abv_Trin KR_abv_Trin TP Dates: 05/01/2005 ‐ 10/15/2008Note: the yearly results are inaccurate due to lack of samples in winter high‐flow periods.
Daily concentrations predicted for winter months are inaccurate but do not impact the formulation of June‐Oct nutrient balances.
Daily Time Series: Yearly Time Series:
Site: KR_abv_Trin KR_abv_Trin Variable: TP
Output Period 05/01/05 10/15/08 Mean Daily Flow 23.970 10^6 m3/day
Calibration Period 05/01/05 10/15/08 Mean Daily Load 0.55 mt/day
Sample Dates 06/01/05 10/15/08 Flow‐Wtd Conc 0.023 ppm
Samples 36 Relative Std Error 2.6%
Method: 5 ‐ Regression + Interpolation Regression R2 90%
Regression SE 0.17
Appendices - Klamath Nutrient Loading & Retention Dynamics in Free-Flowing Reaches 2005-2008, Prepared by Kier Associates, Aquatic Ecosystem Sci., & W. Walker for the Yurok Tribe A-27

Site: KR_bel_IGD KR_bel_IGD INORGN Dates: 05/01/2005 ‐ 10/15/2008Note: the yearly results are inaccurate due to lack of samples in winter high‐flow periods.
Daily concentrations predicted for winter months are inaccurate but do not impact the formulation of June‐Oct nutrient balances.
Daily Time Series: Yearly Time Series:
Site: KR_bel_IGD KR_bel_IGD Variable: INORGN
Output Period 05/01/05 10/15/08 Mean Daily Flow 4.968 10^6 m3/day
Calibration Period 05/01/05 10/15/08 Mean Daily Load 2.06 mt/day
Sample Dates 05/17/05 10/14/08 Flow‐Wtd Conc 0.415 ppm
Samples 83 Relative Std Error 3.6%
Method: 5 ‐ Regression + Interpolation Regression R2 71%
Regression SE 0.39
Appendices - Klamath Nutrient Loading & Retention Dynamics in Free-Flowing Reaches 2005-2008, Prepared by Kier Associates, Aquatic Ecosystem Sci., & W. Walker for the Yurok Tribe A-28

Site: KR_bel_IGD KR_bel_IGD ORGN Dates: 05/01/2005 ‐ 10/15/2008Note: the yearly results are inaccurate due to lack of samples in winter high‐flow periods.
Daily concentrations predicted for winter months are inaccurate but do not impact the formulation of June‐Oct nutrient balances.
Daily Time Series: Yearly Time Series:
Site: KR_bel_IGD KR_bel_IGD Variable: ORGN
Output Period 05/01/05 10/15/08 Mean Daily Flow 4.968 10^6 m3/day
Calibration Period 05/01/05 10/15/08 Mean Daily Load 3.45 mt/day
Sample Dates 05/17/05 10/14/08 Flow‐Wtd Conc 0.695 ppm
Samples 83 Relative Std Error 1.7%
Method: 5 ‐ Regression + Interpolation Regression R2 57%
Regression SE 0.17
Appendices - Klamath Nutrient Loading & Retention Dynamics in Free-Flowing Reaches 2005-2008, Prepared by Kier Associates, Aquatic Ecosystem Sci., & W. Walker for the Yurok Tribe A-29

Site: KR_bel_IGD KR_bel_IGD PP Dates: 05/01/2005 ‐ 10/15/2008Note: the yearly results are inaccurate due to lack of samples in winter high‐flow periods.
Daily concentrations predicted for winter months are inaccurate but do not impact the formulation of June‐Oct nutrient balances.
Daily Time Series: Yearly Time Series:
Site: KR_bel_IGD KR_bel_IGD Variable: PP
Output Period 05/01/05 10/15/08 Mean Daily Flow 4.968 10^6 m3/day
Calibration Period 05/01/05 10/15/08 Mean Daily Load 0.23 mt/day
Sample Dates 05/17/05 10/14/08 Flow‐Wtd Conc 0.045 ppm
Samples 83 Relative Std Error 9.7%
Method: 5 ‐ Regression + Interpolation Regression R2 42%
Regression SE 0.41
Appendices - Klamath Nutrient Loading & Retention Dynamics in Free-Flowing Reaches 2005-2008, Prepared by Kier Associates, Aquatic Ecosystem Sci., & W. Walker for the Yurok Tribe A-30
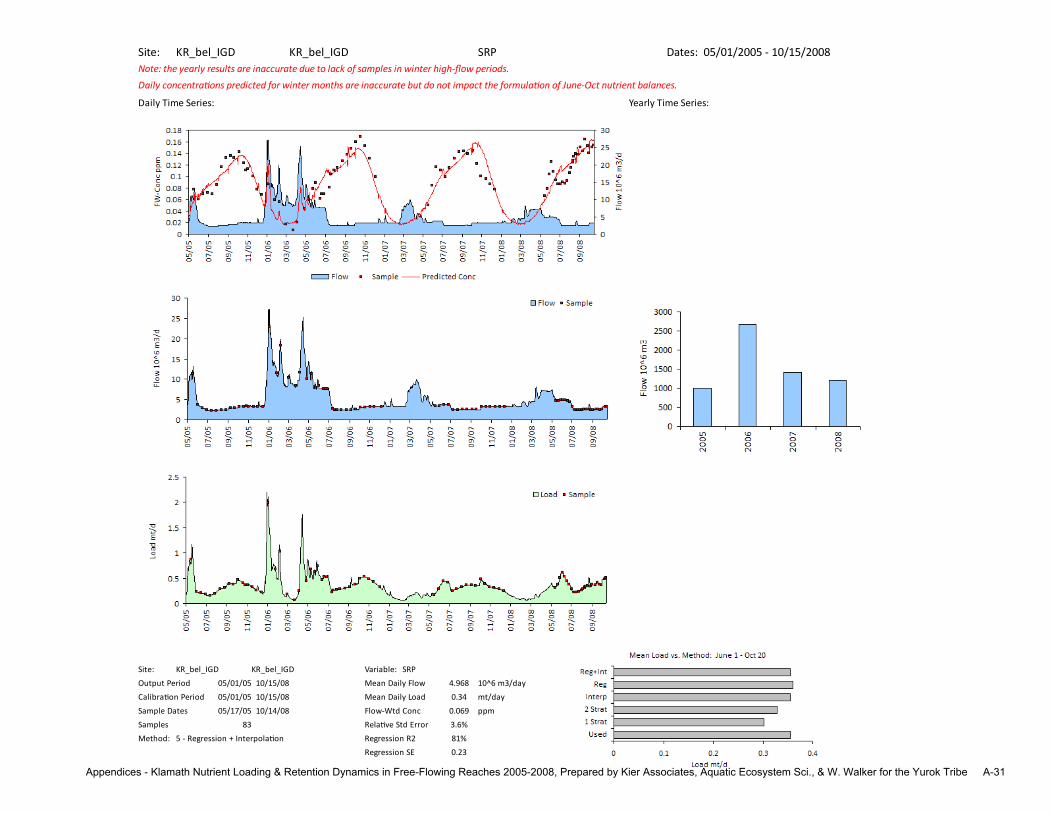
Site: KR_bel_IGD KR_bel_IGD SRP Dates: 05/01/2005 ‐ 10/15/2008Note: the yearly results are inaccurate due to lack of samples in winter high‐flow periods.
Daily concentrations predicted for winter months are inaccurate but do not impact the formulation of June‐Oct nutrient balances.
Daily Time Series: Yearly Time Series:
Site: KR_bel_IGD KR_bel_IGD Variable: SRP
Output Period 05/01/05 10/15/08 Mean Daily Flow 4.968 10^6 m3/day
Calibration Period 05/01/05 10/15/08 Mean Daily Load 0.34 mt/day
Sample Dates 05/17/05 10/14/08 Flow‐Wtd Conc 0.069 ppm
Samples 83 Relative Std Error 3.6%
Method: 5 ‐ Regression + Interpolation Regression R2 81%
Regression SE 0.23
Appendices - Klamath Nutrient Loading & Retention Dynamics in Free-Flowing Reaches 2005-2008, Prepared by Kier Associates, Aquatic Ecosystem Sci., & W. Walker for the Yurok Tribe A-31

Site: KR_bel_IGD KR_bel_IGD TN Dates: 05/01/2005 ‐ 10/15/2008Note: the yearly results are inaccurate due to lack of samples in winter high‐flow periods.
Daily concentrations predicted for winter months are inaccurate but do not impact the formulation of June‐Oct nutrient balances.
Daily Time Series: Yearly Time Series:
Site: KR_bel_IGD KR_bel_IGD Variable: TN
Output Period 05/01/05 10/15/08 Mean Daily Flow 4.968 10^6 m3/day
Calibration Period 05/01/05 10/15/08 Mean Daily Load 5.52 mt/day
Sample Dates 05/17/05 10/14/08 Flow‐Wtd Conc 1.111 ppm
Samples 83 Relative Std Error 1.4%
Method: 5 ‐ Regression + Interpolation Regression R2 79%
Regression SE 0.16
Appendices - Klamath Nutrient Loading & Retention Dynamics in Free-Flowing Reaches 2005-2008, Prepared by Kier Associates, Aquatic Ecosystem Sci., & W. Walker for the Yurok Tribe A-32
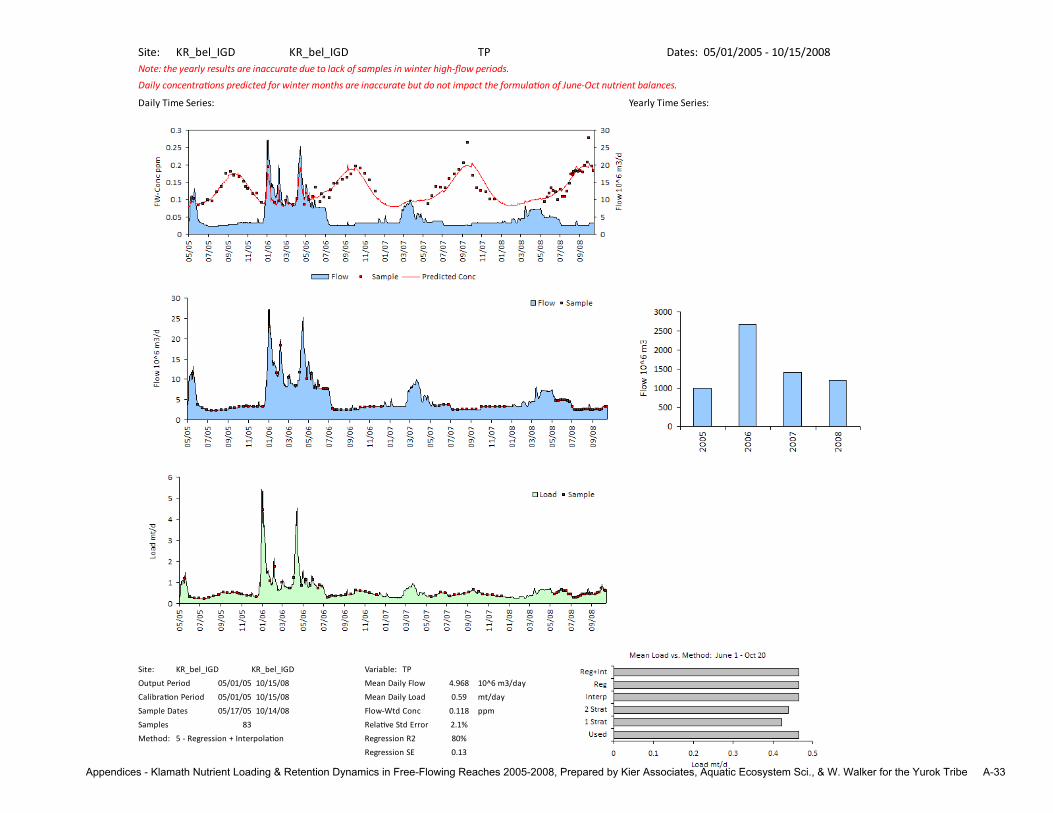
Site: KR_bel_IGD KR_bel_IGD TP Dates: 05/01/2005 ‐ 10/15/2008Note: the yearly results are inaccurate due to lack of samples in winter high‐flow periods.
Daily concentrations predicted for winter months are inaccurate but do not impact the formulation of June‐Oct nutrient balances.
Daily Time Series: Yearly Time Series:
Site: KR_bel_IGD KR_bel_IGD Variable: TP
Output Period 05/01/05 10/15/08 Mean Daily Flow 4.968 10^6 m3/day
Calibration Period 05/01/05 10/15/08 Mean Daily Load 0.59 mt/day
Sample Dates 05/17/05 10/14/08 Flow‐Wtd Conc 0.118 ppm
Samples 83 Relative Std Error 2.1%
Method: 5 ‐ Regression + Interpolation Regression R2 80%
Regression SE 0.13
Appendices - Klamath Nutrient Loading & Retention Dynamics in Free-Flowing Reaches 2005-2008, Prepared by Kier Associates, Aquatic Ecosystem Sci., & W. Walker for the Yurok Tribe A-33

Site: KR_bel_Keno KR_bel_Keno INORGN Dates: 05/01/2005 ‐ 10/15/2008Note: the yearly results are inaccurate due to lack of samples in winter high‐flow periods.
Daily concentrations predicted for winter months are inaccurate but do not impact the formulation of June‐Oct nutrient balances.
Daily Time Series: Yearly Time Series:
Site: KR_bel_Keno KR_bel_Keno Variable: INORGN
Output Period 05/01/05 10/15/08 Mean Daily Flow 3.529 10^6 m3/day
Calibration Period 05/01/05 10/15/08 Mean Daily Load 2.15 mt/day
Sample Dates 05/17/05 10/09/08 Flow‐Wtd Conc 0.609 ppm
Samples 93 Relative Std Error 10.7%
Method: 5 ‐ Regression + Interpolation Regression R2 68%
Regression SE 0.69
Appendices - Klamath Nutrient Loading & Retention Dynamics in Free-Flowing Reaches 2005-2008, Prepared by Kier Associates, Aquatic Ecosystem Sci., & W. Walker for the Yurok Tribe A-34

Site: KR_bel_Keno KR_bel_Keno ORGN Dates: 05/01/2005 ‐ 10/15/2008Note: the yearly results are inaccurate due to lack of samples in winter high‐flow periods.
Daily concentrations predicted for winter months are inaccurate but do not impact the formulation of June‐Oct nutrient balances.
Daily Time Series: Yearly Time Series:
Site: KR_bel_Keno KR_bel_Keno Variable: ORGN
Output Period 05/01/05 10/15/08 Mean Daily Flow 3.529 10^6 m3/day
Calibration Period 05/01/05 10/15/08 Mean Daily Load 4.13 mt/day
Sample Dates 05/17/05 10/09/08 Flow‐Wtd Conc 1.169 ppm
Samples 79 Relative Std Error 2.6%
Method: 5 ‐ Regression + Interpolation Regression R2 75%
Regression SE 0.22
Appendices - Klamath Nutrient Loading & Retention Dynamics in Free-Flowing Reaches 2005-2008, Prepared by Kier Associates, Aquatic Ecosystem Sci., & W. Walker for the Yurok Tribe A-35

Site: KR_bel_Keno KR_bel_Keno PP Dates: 05/01/2005 ‐ 10/15/2008Note: the yearly results are inaccurate due to lack of samples in winter high‐flow periods.
Daily concentrations predicted for winter months are inaccurate but do not impact the formulation of June‐Oct nutrient balances.
Daily Time Series: Yearly Time Series:
Site: KR_bel_Keno KR_bel_Keno Variable: PP
Output Period 05/01/05 10/15/08 Mean Daily Flow 3.529 10^6 m3/day
Calibration Period 05/01/05 10/15/08 Mean Daily Load 0.37 mt/day
Sample Dates 05/17/05 10/09/08 Flow‐Wtd Conc 0.105 ppm
Samples 83 Relative Std Error 4.9%
Method: 5 ‐ Regression + Interpolation Regression R2 54%
Regression SE 0.33
Appendices - Klamath Nutrient Loading & Retention Dynamics in Free-Flowing Reaches 2005-2008, Prepared by Kier Associates, Aquatic Ecosystem Sci., & W. Walker for the Yurok Tribe A-36

Site: KR_bel_Keno KR_bel_Keno SRP Dates: 05/01/2005 ‐ 10/15/2008Note: the yearly results are inaccurate due to lack of samples in winter high‐flow periods.
Daily concentrations predicted for winter months are inaccurate but do not impact the formulation of June‐Oct nutrient balances.
Daily Time Series: Yearly Time Series:
Site: KR_bel_Keno KR_bel_Keno Variable: SRP
Output Period 05/01/05 10/15/08 Mean Daily Flow 3.529 10^6 m3/day
Calibration Period 05/01/05 10/15/08 Mean Daily Load 0.23 mt/day
Sample Dates 05/17/05 10/09/08 Flow‐Wtd Conc 0.064 ppm
Samples 90 Relative Std Error 6.5%
Method: 5 ‐ Regression + Interpolation Regression R2 40%
Regression SE 0.75
Appendices - Klamath Nutrient Loading & Retention Dynamics in Free-Flowing Reaches 2005-2008, Prepared by Kier Associates, Aquatic Ecosystem Sci., & W. Walker for the Yurok Tribe A-37

Site: KR_bel_Keno KR_bel_Keno TN Dates: 05/01/2005 ‐ 10/15/2008Note: the yearly results are inaccurate due to lack of samples in winter high‐flow periods.
Daily concentrations predicted for winter months are inaccurate but do not impact the formulation of June‐Oct nutrient balances.
Daily Time Series: Yearly Time Series:
Site: KR_bel_Keno KR_bel_Keno Variable: TN
Output Period 05/01/05 10/15/08 Mean Daily Flow 3.529 10^6 m3/day
Calibration Period 05/01/05 10/15/08 Mean Daily Load 6.41 mt/day
Sample Dates 05/17/05 10/09/08 Flow‐Wtd Conc 1.815 ppm
Samples 79 Relative Std Error 2.5%
Method: 5 ‐ Regression + Interpolation Regression R2 85%
Regression SE 0.20
Appendices - Klamath Nutrient Loading & Retention Dynamics in Free-Flowing Reaches 2005-2008, Prepared by Kier Associates, Aquatic Ecosystem Sci., & W. Walker for the Yurok Tribe A-38

Site: KR_bel_Keno KR_bel_Keno TP Dates: 05/01/2005 ‐ 10/15/2008Note: the yearly results are inaccurate due to lack of samples in winter high‐flow periods.
Daily concentrations predicted for winter months are inaccurate but do not impact the formulation of June‐Oct nutrient balances.
Daily Time Series: Yearly Time Series:
Site: KR_bel_Keno KR_bel_Keno Variable: TP
Output Period 05/01/05 10/15/08 Mean Daily Flow 3.529 10^6 m3/day
Calibration Period 05/01/05 10/15/08 Mean Daily Load 0.64 mt/day
Sample Dates 05/17/05 10/09/08 Flow‐Wtd Conc 0.180 ppm
Samples 87 Relative Std Error 7.6%
Method: 5 ‐ Regression + Interpolation Regression R2 63%
Regression SE 0.28
Appendices - Klamath Nutrient Loading & Retention Dynamics in Free-Flowing Reaches 2005-2008, Prepared by Kier Associates, Aquatic Ecosystem Sci., & W. Walker for the Yurok Tribe A-39

Site: KR_bel_Trin KR_bel_Trin INORGN Dates: 05/01/2005 ‐ 10/15/2008Note: the yearly results are inaccurate due to lack of samples in winter high‐flow periods.
Daily concentrations predicted for winter months are inaccurate but do not impact the formulation of June‐Oct nutrient balances.
Daily Time Series: Yearly Time Series:
Site: KR_bel_Trin KR_bel_Trin Variable: INORGN
Output Period 05/01/05 10/15/08 Mean Daily Flow 38.563 10^6 m3/day
Calibration Period 05/01/05 10/15/08 Mean Daily Load 11.26 mt/day
Sample Dates 06/01/05 10/15/08 Flow‐Wtd Conc 0.292 ppm
Samples 35 Relative Std Error 15.5%
Method: 5 ‐ Regression + Interpolation Regression R2 71%
Regression SE 0.48
Appendices - Klamath Nutrient Loading & Retention Dynamics in Free-Flowing Reaches 2005-2008, Prepared by Kier Associates, Aquatic Ecosystem Sci., & W. Walker for the Yurok Tribe A-40

Site: KR_bel_Trin KR_bel_Trin ORGN Dates: 05/01/2005 ‐ 10/15/2008Note: the yearly results are inaccurate due to lack of samples in winter high‐flow periods.
Daily concentrations predicted for winter months are inaccurate but do not impact the formulation of June‐Oct nutrient balances.
Daily Time Series: Yearly Time Series:
Site: KR_bel_Trin KR_bel_Trin Variable: ORGN
Output Period 05/01/05 10/15/08 Mean Daily Flow 38.563 10^6 m3/day
Calibration Period 05/01/05 10/15/08 Mean Daily Load 5.00 mt/day
Sample Dates 06/28/05 10/15/08 Flow‐Wtd Conc 0.130 ppm
Samples 33 Relative Std Error 3.4%
Method: 5 ‐ Regression + Interpolation Regression R2 72%
Regression SE 0.24
Appendices - Klamath Nutrient Loading & Retention Dynamics in Free-Flowing Reaches 2005-2008, Prepared by Kier Associates, Aquatic Ecosystem Sci., & W. Walker for the Yurok Tribe A-41

Site: KR_bel_Trin KR_bel_Trin PP Dates: 05/01/2005 ‐ 10/15/2008Note: the yearly results are inaccurate due to lack of samples in winter high‐flow periods.
Daily concentrations predicted for winter months are inaccurate but do not impact the formulation of June‐Oct nutrient balances.
Daily Time Series: Yearly Time Series:
Site: KR_bel_Trin KR_bel_Trin Variable: PP
Output Period 05/01/05 10/15/08 Mean Daily Flow 38.563 10^6 m3/day
Calibration Period 05/01/05 10/15/08 Mean Daily Load 0.42 mt/day
Sample Dates 06/01/05 10/15/08 Flow‐Wtd Conc 0.011 ppm
Samples 34 Relative Std Error 4.4%
Method: 5 ‐ Regression + Interpolation Regression R2 63%
Regression SE 0.30
Appendices - Klamath Nutrient Loading & Retention Dynamics in Free-Flowing Reaches 2005-2008, Prepared by Kier Associates, Aquatic Ecosystem Sci., & W. Walker for the Yurok Tribe A-42

Site: KR_bel_Trin KR_bel_Trin SRP Dates: 05/01/2005 ‐ 10/15/2008Note: the yearly results are inaccurate due to lack of samples in winter high‐flow periods.
Daily concentrations predicted for winter months are inaccurate but do not impact the formulation of June‐Oct nutrient balances.
Daily Time Series: Yearly Time Series:
Site: KR_bel_Trin KR_bel_Trin Variable: SRP
Output Period 05/01/05 10/15/08 Mean Daily Flow 38.563 10^6 m3/day
Calibration Period 05/01/05 10/15/08 Mean Daily Load 0.31 mt/day
Sample Dates 06/01/05 10/15/08 Flow‐Wtd Conc 0.008 ppm
Samples 35 Relative Std Error 2.9%
Method: 5 ‐ Regression + Interpolation Regression R2 91%
Regression SE 0.21
Appendices - Klamath Nutrient Loading & Retention Dynamics in Free-Flowing Reaches 2005-2008, Prepared by Kier Associates, Aquatic Ecosystem Sci., & W. Walker for the Yurok Tribe A-43

Site: KR_bel_Trin KR_bel_Trin TN Dates: 05/01/2005 ‐ 10/15/2008Note: the yearly results are inaccurate due to lack of samples in winter high‐flow periods.
Daily concentrations predicted for winter months are inaccurate but do not impact the formulation of June‐Oct nutrient balances.
Daily Time Series: Yearly Time Series:
Site: KR_bel_Trin KR_bel_Trin Variable: TN
Output Period 05/01/05 10/15/08 Mean Daily Flow 38.563 10^6 m3/day
Calibration Period 05/01/05 10/15/08 Mean Daily Load 11.56 mt/day
Sample Dates 06/28/05 10/15/08 Flow‐Wtd Conc 0.300 ppm
Samples 33 Relative Std Error 4.1%
Method: 5 ‐ Regression + Interpolation Regression R2 70%
Regression SE 0.25
Appendices - Klamath Nutrient Loading & Retention Dynamics in Free-Flowing Reaches 2005-2008, Prepared by Kier Associates, Aquatic Ecosystem Sci., & W. Walker for the Yurok Tribe A-44

Site: KR_bel_Trin KR_bel_Trin TP Dates: 05/01/2005 ‐ 10/15/2008Note: the yearly results are inaccurate due to lack of samples in winter high‐flow periods.
Daily concentrations predicted for winter months are inaccurate but do not impact the formulation of June‐Oct nutrient balances.
Daily Time Series: Yearly Time Series:
Site: KR_bel_Trin KR_bel_Trin Variable: TP
Output Period 05/01/05 10/15/08 Mean Daily Flow 38.563 10^6 m3/day
Calibration Period 05/01/05 10/15/08 Mean Daily Load 0.80 mt/day
Sample Dates 06/01/05 10/15/08 Flow‐Wtd Conc 0.021 ppm
Samples 34 Relative Std Error 2.1%
Method: 5 ‐ Regression + Interpolation Regression R2 89%
Regression SE 0.17
Appendices - Klamath Nutrient Loading & Retention Dynamics in Free-Flowing Reaches 2005-2008, Prepared by Kier Associates, Aquatic Ecosystem Sci., & W. Walker for the Yurok Tribe A-45
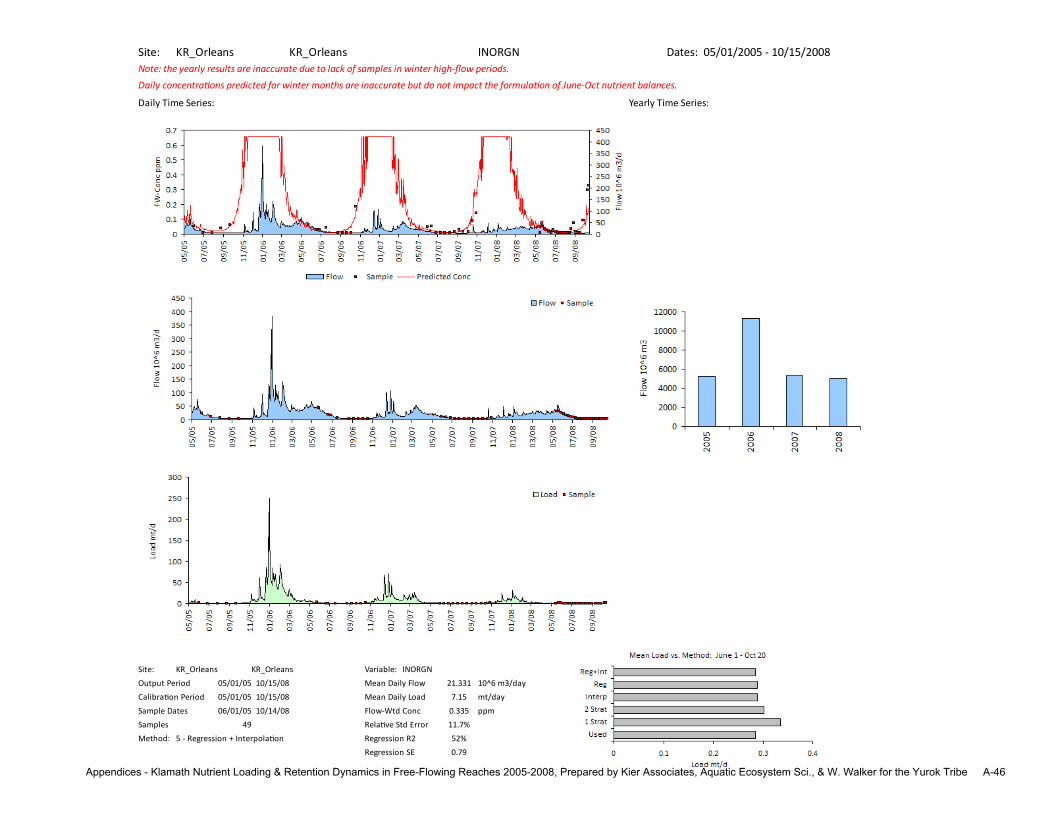
Site: KR_Orleans KR_Orleans INORGN Dates: 05/01/2005 ‐ 10/15/2008Note: the yearly results are inaccurate due to lack of samples in winter high‐flow periods.
Daily concentrations predicted for winter months are inaccurate but do not impact the formulation of June‐Oct nutrient balances.
Daily Time Series: Yearly Time Series:
Site: KR_Orleans KR_Orleans Variable: INORGN
Output Period 05/01/05 10/15/08 Mean Daily Flow 21.331 10^6 m3/day
Calibration Period 05/01/05 10/15/08 Mean Daily Load 7.15 mt/day
Sample Dates 06/01/05 10/14/08 Flow‐Wtd Conc 0.335 ppm
Samples 49 Relative Std Error 11.7%
Method: 5 ‐ Regression + Interpolation Regression R2 52%
Regression SE 0.79
Appendices - Klamath Nutrient Loading & Retention Dynamics in Free-Flowing Reaches 2005-2008, Prepared by Kier Associates, Aquatic Ecosystem Sci., & W. Walker for the Yurok Tribe A-46

Site: KR_Orleans KR_Orleans ORGN Dates: 05/01/2005 ‐ 10/15/2008Note: the yearly results are inaccurate due to lack of samples in winter high‐flow periods.
Daily concentrations predicted for winter months are inaccurate but do not impact the formulation of June‐Oct nutrient balances.
Daily Time Series: Yearly Time Series:
Site: KR_Orleans KR_Orleans Variable: ORGN
Output Period 05/01/05 10/15/08 Mean Daily Flow 21.331 10^6 m3/day
Calibration Period 05/01/05 10/15/08 Mean Daily Load 2.67 mt/day
Sample Dates 08/24/05 10/14/08 Flow‐Wtd Conc 0.125 ppm
Samples 45 Relative Std Error 3.2%
Method: 5 ‐ Regression + Interpolation Regression R2 79%
Regression SE 0.23
Appendices - Klamath Nutrient Loading & Retention Dynamics in Free-Flowing Reaches 2005-2008, Prepared by Kier Associates, Aquatic Ecosystem Sci., & W. Walker for the Yurok Tribe A-47

Site: KR_Orleans KR_Orleans PP Dates: 05/01/2005 ‐ 10/15/2008Note: the yearly results are inaccurate due to lack of samples in winter high‐flow periods.
Daily concentrations predicted for winter months are inaccurate but do not impact the formulation of June‐Oct nutrient balances.
Daily Time Series: Yearly Time Series:
Site: KR_Orleans KR_Orleans Variable: PP
Output Period 05/01/05 10/15/08 Mean Daily Flow 21.331 10^6 m3/day
Calibration Period 05/01/05 10/15/08 Mean Daily Load 0.31 mt/day
Sample Dates 06/01/05 10/14/08 Flow‐Wtd Conc 0.015 ppm
Samples 48 Relative Std Error 4.4%
Method: 5 ‐ Regression + Interpolation Regression R2 75%
Regression SE 0.26
Appendices - Klamath Nutrient Loading & Retention Dynamics in Free-Flowing Reaches 2005-2008, Prepared by Kier Associates, Aquatic Ecosystem Sci., & W. Walker for the Yurok Tribe A-48

Site: KR_Orleans KR_Orleans SRP Dates: 05/01/2005 ‐ 10/15/2008Note: the yearly results are inaccurate due to lack of samples in winter high‐flow periods.
Daily concentrations predicted for winter months are inaccurate but do not impact the formulation of June‐Oct nutrient balances.
Daily Time Series: Yearly Time Series:
Site: KR_Orleans KR_Orleans Variable: SRP
Output Period 05/01/05 10/15/08 Mean Daily Flow 21.331 10^6 m3/day
Calibration Period 05/01/05 10/15/08 Mean Daily Load 0.29 mt/day
Sample Dates 06/01/05 10/14/08 Flow‐Wtd Conc 0.014 ppm
Samples 49 Relative Std Error 2.8%
Method: 5 ‐ Regression + Interpolation Regression R2 92%
Regression SE 0.18
Appendices - Klamath Nutrient Loading & Retention Dynamics in Free-Flowing Reaches 2005-2008, Prepared by Kier Associates, Aquatic Ecosystem Sci., & W. Walker for the Yurok Tribe A-49

Site: KR_Orleans KR_Orleans TN Dates: 05/01/2005 ‐ 10/15/2008Note: the yearly results are inaccurate due to lack of samples in winter high‐flow periods.
Daily concentrations predicted for winter months are inaccurate but do not impact the formulation of June‐Oct nutrient balances.
Daily Time Series: Yearly Time Series:
Site: KR_Orleans KR_Orleans Variable: TN
Output Period 05/01/05 10/15/08 Mean Daily Flow 21.331 10^6 m3/day
Calibration Period 05/01/05 10/15/08 Mean Daily Load 3.68 mt/day
Sample Dates 08/24/05 10/14/08 Flow‐Wtd Conc 0.173 ppm
Samples 45 Relative Std Error 3.6%
Method: 5 ‐ Regression + Interpolation Regression R2 75%
Regression SE 0.25
Appendices - Klamath Nutrient Loading & Retention Dynamics in Free-Flowing Reaches 2005-2008, Prepared by Kier Associates, Aquatic Ecosystem Sci., & W. Walker for the Yurok Tribe A-50

Site: KR_Orleans KR_Orleans TP Dates: 05/01/2005 ‐ 10/15/2008Note: the yearly results are inaccurate due to lack of samples in winter high‐flow periods.
Daily concentrations predicted for winter months are inaccurate but do not impact the formulation of June‐Oct nutrient balances.
Daily Time Series: Yearly Time Series:
Site: KR_Orleans KR_Orleans Variable: TP
Output Period 05/01/05 10/15/08 Mean Daily Flow 21.331 10^6 m3/day
Calibration Period 05/01/05 10/15/08 Mean Daily Load 0.59 mt/day
Sample Dates 06/01/05 10/14/08 Flow‐Wtd Conc 0.028 ppm
Samples 48 Relative Std Error 2.8%
Method: 5 ‐ Regression + Interpolation Regression R2 89%
Regression SE 0.16
Appendices - Klamath Nutrient Loading & Retention Dynamics in Free-Flowing Reaches 2005-2008, Prepared by Kier Associates, Aquatic Ecosystem Sci., & W. Walker for the Yurok Tribe A-51

Site: KR_Seiad KR_Seiad INORGN Dates: 05/01/2005 ‐ 10/15/2008Note: the yearly results are inaccurate due to lack of samples in winter high‐flow periods.
Daily concentrations predicted for winter months are inaccurate but do not impact the formulation of June‐Oct nutrient balances.
Daily Time Series: Yearly Time Series:
Site: KR_Seiad KR_Seiad Variable: INORGN
Output Period 05/01/05 10/15/08 Mean Daily Flow 9.115 10^6 m3/day
Calibration Period 05/01/05 10/15/08 Mean Daily Load 5.04 mt/day
Sample Dates 06/01/05 10/14/08 Flow‐Wtd Conc 0.553 ppm
Samples 51 Relative Std Error 8.0%
Method: 5 ‐ Regression + Interpolation Regression R2 40%
Regression SE 0.83
Appendices - Klamath Nutrient Loading & Retention Dynamics in Free-Flowing Reaches 2005-2008, Prepared by Kier Associates, Aquatic Ecosystem Sci., & W. Walker for the Yurok Tribe A-52

Site: KR_Seiad KR_Seiad ORGN Dates: 05/01/2005 ‐ 10/15/2008Note: the yearly results are inaccurate due to lack of samples in winter high‐flow periods.
Daily concentrations predicted for winter months are inaccurate but do not impact the formulation of June‐Oct nutrient balances.
Daily Time Series: Yearly Time Series:
Site: KR_Seiad KR_Seiad Variable: ORGN
Output Period 05/01/05 10/15/08 Mean Daily Flow 9.115 10^6 m3/day
Calibration Period 05/01/05 10/15/08 Mean Daily Load 2.26 mt/day
Sample Dates 06/01/05 10/14/08 Flow‐Wtd Conc 0.248 ppm
Samples 51 Relative Std Error 2.8%
Method: 5 ‐ Regression + Interpolation Regression R2 68%
Regression SE 0.23
Appendices - Klamath Nutrient Loading & Retention Dynamics in Free-Flowing Reaches 2005-2008, Prepared by Kier Associates, Aquatic Ecosystem Sci., & W. Walker for the Yurok Tribe A-53

Site: KR_Seiad KR_Seiad PP Dates: 05/01/2005 ‐ 10/15/2008Note: the yearly results are inaccurate due to lack of samples in winter high‐flow periods.
Daily concentrations predicted for winter months are inaccurate but do not impact the formulation of June‐Oct nutrient balances.
Daily Time Series: Yearly Time Series:
Site: KR_Seiad KR_Seiad Variable: PP
Output Period 05/01/05 10/15/08 Mean Daily Flow 9.115 10^6 m3/day
Calibration Period 05/01/05 10/15/08 Mean Daily Load 0.18 mt/day
Sample Dates 06/01/05 10/14/08 Flow‐Wtd Conc 0.019 ppm
Samples 51 Relative Std Error 4.9%
Method: 5 ‐ Regression + Interpolation Regression R2 41%
Regression SE 0.37
Appendices - Klamath Nutrient Loading & Retention Dynamics in Free-Flowing Reaches 2005-2008, Prepared by Kier Associates, Aquatic Ecosystem Sci., & W. Walker for the Yurok Tribe A-54

Site: KR_Seiad KR_Seiad SRP Dates: 05/01/2005 ‐ 10/15/2008Note: the yearly results are inaccurate due to lack of samples in winter high‐flow periods.
Daily concentrations predicted for winter months are inaccurate but do not impact the formulation of June‐Oct nutrient balances.
Daily Time Series: Yearly Time Series:
Site: KR_Seiad KR_Seiad Variable: SRP
Output Period 05/01/05 10/15/08 Mean Daily Flow 9.115 10^6 m3/day
Calibration Period 05/01/05 10/15/08 Mean Daily Load 0.31 mt/day
Sample Dates 06/01/05 10/14/08 Flow‐Wtd Conc 0.034 ppm
Samples 51 Relative Std Error 2.3%
Method: 5 ‐ Regression + Interpolation Regression R2 84%
Regression SE 0.18
Appendices - Klamath Nutrient Loading & Retention Dynamics in Free-Flowing Reaches 2005-2008, Prepared by Kier Associates, Aquatic Ecosystem Sci., & W. Walker for the Yurok Tribe A-55

Site: KR_Seiad KR_Seiad TN Dates: 05/01/2005 ‐ 10/15/2008Note: the yearly results are inaccurate due to lack of samples in winter high‐flow periods.
Daily concentrations predicted for winter months are inaccurate but do not impact the formulation of June‐Oct nutrient balances.
Daily Time Series: Yearly Time Series:
Site: KR_Seiad KR_Seiad Variable: TN
Output Period 05/01/05 10/15/08 Mean Daily Flow 9.115 10^6 m3/day
Calibration Period 05/01/05 10/15/08 Mean Daily Load 3.50 mt/day
Sample Dates 06/01/05 10/14/08 Flow‐Wtd Conc 0.384 ppm
Samples 51 Relative Std Error 2.5%
Method: 5 ‐ Regression + Interpolation Regression R2 71%
Regression SE 0.22
Appendices - Klamath Nutrient Loading & Retention Dynamics in Free-Flowing Reaches 2005-2008, Prepared by Kier Associates, Aquatic Ecosystem Sci., & W. Walker for the Yurok Tribe A-56

Site: KR_Seiad KR_Seiad TP Dates: 05/01/2005 ‐ 10/15/2008Note: the yearly results are inaccurate due to lack of samples in winter high‐flow periods.
Daily concentrations predicted for winter months are inaccurate but do not impact the formulation of June‐Oct nutrient balances.
Daily Time Series: Yearly Time Series:
Site: KR_Seiad KR_Seiad Variable: TP
Output Period 05/01/05 10/15/08 Mean Daily Flow 9.115 10^6 m3/day
Calibration Period 05/01/05 10/15/08 Mean Daily Load 0.46 mt/day
Sample Dates 06/01/05 10/14/08 Flow‐Wtd Conc 0.051 ppm
Samples 51 Relative Std Error 2.1%
Method: 5 ‐ Regression + Interpolation Regression R2 80%
Regression SE 0.17
Appendices - Klamath Nutrient Loading & Retention Dynamics in Free-Flowing Reaches 2005-2008, Prepared by Kier Associates, Aquatic Ecosystem Sci., & W. Walker for the Yurok Tribe A-57

Site: KR_Turwar KR_Turwar INORGN Dates: 05/01/2005 ‐ 10/15/2008Note: the yearly results are inaccurate due to lack of samples in winter high‐flow periods.
Daily concentrations predicted for winter months are inaccurate but do not impact the formulation of June‐Oct nutrient balances.
Daily Time Series: Yearly Time Series:
Site: KR_Turwar KR_Turwar Variable: INORGN
Output Period 05/01/05 10/15/08 Mean Daily Flow 42.722 10^6 m3/day
Calibration Period 05/01/05 10/15/08 Mean Daily Load 7.89 mt/day
Sample Dates 06/01/05 10/15/08 Flow‐Wtd Conc 0.185 ppm
Samples 36 Relative Std Error 12.6%
Method: 5 ‐ Regression + Interpolation Regression R2 42%
Regression SE 0.44
Appendices - Klamath Nutrient Loading & Retention Dynamics in Free-Flowing Reaches 2005-2008, Prepared by Kier Associates, Aquatic Ecosystem Sci., & W. Walker for the Yurok Tribe A-58

Site: KR_Turwar KR_Turwar ORGN Dates: 05/01/2005 ‐ 10/15/2008Note: the yearly results are inaccurate due to lack of samples in winter high‐flow periods.
Daily concentrations predicted for winter months are inaccurate but do not impact the formulation of June‐Oct nutrient balances.
Daily Time Series: Yearly Time Series:
Site: KR_Turwar KR_Turwar Variable: ORGN
Output Period 05/01/05 10/15/08 Mean Daily Flow 42.722 10^6 m3/day
Calibration Period 05/01/05 10/15/08 Mean Daily Load 4.35 mt/day
Sample Dates 06/28/05 10/15/08 Flow‐Wtd Conc 0.102 ppm
Samples 33 Relative Std Error 7.0%
Method: 5 ‐ Regression + Interpolation Regression R2 53%
Regression SE 0.36
Appendices - Klamath Nutrient Loading & Retention Dynamics in Free-Flowing Reaches 2005-2008, Prepared by Kier Associates, Aquatic Ecosystem Sci., & W. Walker for the Yurok Tribe A-59

Site: KR_Turwar KR_Turwar PP Dates: 05/01/2005 ‐ 10/15/2008Note: the yearly results are inaccurate due to lack of samples in winter high‐flow periods.
Daily concentrations predicted for winter months are inaccurate but do not impact the formulation of June‐Oct nutrient balances.
Daily Time Series: Yearly Time Series:
Site: KR_Turwar KR_Turwar Variable: PP
Output Period 05/01/05 10/15/08 Mean Daily Flow 42.722 10^6 m3/day
Calibration Period 05/01/05 10/15/08 Mean Daily Load 0.41 mt/day
Sample Dates 06/01/05 10/15/08 Flow‐Wtd Conc 0.010 ppm
Samples 36 Relative Std Error 4.6%
Method: 5 ‐ Regression + Interpolation Regression R2 60%
Regression SE 0.36
Appendices - Klamath Nutrient Loading & Retention Dynamics in Free-Flowing Reaches 2005-2008, Prepared by Kier Associates, Aquatic Ecosystem Sci., & W. Walker for the Yurok Tribe A-60

Site: KR_Turwar KR_Turwar SRP Dates: 05/01/2005 ‐ 10/15/2008Note: the yearly results are inaccurate due to lack of samples in winter high‐flow periods.
Daily concentrations predicted for winter months are inaccurate but do not impact the formulation of June‐Oct nutrient balances.
Daily Time Series: Yearly Time Series:
Site: KR_Turwar KR_Turwar Variable: SRP
Output Period 05/01/05 10/15/08 Mean Daily Flow 42.722 10^6 m3/day
Calibration Period 05/01/05 10/15/08 Mean Daily Load 0.29 mt/day
Sample Dates 06/01/05 10/15/08 Flow‐Wtd Conc 0.007 ppm
Samples 36 Relative Std Error 3.5%
Method: 5 ‐ Regression + Interpolation Regression R2 80%
Regression SE 0.26
Appendices - Klamath Nutrient Loading & Retention Dynamics in Free-Flowing Reaches 2005-2008, Prepared by Kier Associates, Aquatic Ecosystem Sci., & W. Walker for the Yurok Tribe A-61

Site: KR_Turwar KR_Turwar TN Dates: 05/01/2005 ‐ 10/15/2008Note: the yearly results are inaccurate due to lack of samples in winter high‐flow periods.
Daily concentrations predicted for winter months are inaccurate but do not impact the formulation of June‐Oct nutrient balances.
Daily Time Series: Yearly Time Series:
Site: KR_Turwar KR_Turwar Variable: TN
Output Period 05/01/05 10/15/08 Mean Daily Flow 42.722 10^6 m3/day
Calibration Period 05/01/05 10/15/08 Mean Daily Load 7.62 mt/day
Sample Dates 06/28/05 10/15/08 Flow‐Wtd Conc 0.178 ppm
Samples 33 Relative Std Error 4.9%
Method: 5 ‐ Regression + Interpolation Regression R2 55%
Regression SE 0.28
Appendices - Klamath Nutrient Loading & Retention Dynamics in Free-Flowing Reaches 2005-2008, Prepared by Kier Associates, Aquatic Ecosystem Sci., & W. Walker for the Yurok Tribe A-62

Site: KR_Turwar KR_Turwar TP Dates: 05/01/2005 ‐ 10/15/2008Note: the yearly results are inaccurate due to lack of samples in winter high‐flow periods.
Daily concentrations predicted for winter months are inaccurate but do not impact the formulation of June‐Oct nutrient balances.
Daily Time Series: Yearly Time Series:
Site: KR_Turwar KR_Turwar Variable: TP
Output Period 05/01/05 10/15/08 Mean Daily Flow 42.722 10^6 m3/day
Calibration Period 05/01/05 10/15/08 Mean Daily Load 0.75 mt/day
Sample Dates 06/01/05 10/15/08 Flow‐Wtd Conc 0.018 ppm
Samples 36 Relative Std Error 2.8%
Method: 5 ‐ Regression + Interpolation Regression R2 83%
Regression SE 0.20
Appendices - Klamath Nutrient Loading & Retention Dynamics in Free-Flowing Reaches 2005-2008, Prepared by Kier Associates, Aquatic Ecosystem Sci., & W. Walker for the Yurok Tribe A-63

Site: KR_Walker KR_Walker INORGN Dates: 05/01/2005 ‐ 10/15/2008Note: the yearly results are inaccurate due to lack of samples in winter high‐flow periods.
Daily concentrations predicted for winter months are inaccurate but do not impact the formulation of June‐Oct nutrient balances.
Daily Time Series: Yearly Time Series:
Site: KR_Walker KR_Walker Variable: INORGN
Output Period 05/01/05 10/15/08 Mean Daily Flow 6.542 10^6 m3/day
Calibration Period 05/01/05 10/15/08 Mean Daily Load 5.83 mt/day
Sample Dates 05/22/08 10/14/08 Flow‐Wtd Conc 0.892 ppm
Samples 24 Relative Std Error 2.6%
Method: 5 ‐ Regression + Interpolation Regression R2 96%
Regression SE 0.16
Appendices - Klamath Nutrient Loading & Retention Dynamics in Free-Flowing Reaches 2005-2008, Prepared by Kier Associates, Aquatic Ecosystem Sci., & W. Walker for the Yurok Tribe A-64

Site: KR_Walker KR_Walker ORGN Dates: 05/01/2005 ‐ 10/15/2008Note: the yearly results are inaccurate due to lack of samples in winter high‐flow periods.
Daily concentrations predicted for winter months are inaccurate but do not impact the formulation of June‐Oct nutrient balances.
Daily Time Series: Yearly Time Series:
Site: KR_Walker KR_Walker Variable: ORGN
Output Period 05/01/05 10/15/08 Mean Daily Flow 6.542 10^6 m3/day
Calibration Period 05/01/05 10/15/08 Mean Daily Load 3.45 mt/day
Sample Dates 05/22/08 10/14/08 Flow‐Wtd Conc 0.527 ppm
Samples 24 Relative Std Error 3.9%
Method: 5 ‐ Regression + Interpolation Regression R2 69%
Regression SE 0.15
Appendices - Klamath Nutrient Loading & Retention Dynamics in Free-Flowing Reaches 2005-2008, Prepared by Kier Associates, Aquatic Ecosystem Sci., & W. Walker for the Yurok Tribe A-65

Site: KR_Walker KR_Walker PP Dates: 05/01/2005 ‐ 10/15/2008Note: the yearly results are inaccurate due to lack of samples in winter high‐flow periods.
Daily concentrations predicted for winter months are inaccurate but do not impact the formulation of June‐Oct nutrient balances.
Daily Time Series: Yearly Time Series:
Site: KR_Walker KR_Walker Variable: PP
Output Period 05/01/05 10/15/08 Mean Daily Flow 6.542 10^6 m3/day
Calibration Period 05/01/05 10/15/08 Mean Daily Load 0.18 mt/day
Sample Dates 05/22/08 10/14/08 Flow‐Wtd Conc 0.027 ppm
Samples 23 Relative Std Error 7.3%
Method: 5 ‐ Regression + Interpolation Regression R2 81%
Regression SE 0.39
Appendices - Klamath Nutrient Loading & Retention Dynamics in Free-Flowing Reaches 2005-2008, Prepared by Kier Associates, Aquatic Ecosystem Sci., & W. Walker for the Yurok Tribe A-66

Site: KR_Walker KR_Walker SRP Dates: 05/01/2005 ‐ 10/15/2008Note: the yearly results are inaccurate due to lack of samples in winter high‐flow periods.
Daily concentrations predicted for winter months are inaccurate but do not impact the formulation of June‐Oct nutrient balances.
Daily Time Series: Yearly Time Series:
Site: KR_Walker KR_Walker Variable: SRP
Output Period 05/01/05 10/15/08 Mean Daily Flow 6.542 10^6 m3/day
Calibration Period 05/01/05 10/15/08 Mean Daily Load 0.62 mt/day
Sample Dates 05/22/08 10/14/08 Flow‐Wtd Conc 0.094 ppm
Samples 24 Relative Std Error 1.5%
Method: 5 ‐ Regression + Interpolation Regression R2 95%
Regression SE 0.07
Appendices - Klamath Nutrient Loading & Retention Dynamics in Free-Flowing Reaches 2005-2008, Prepared by Kier Associates, Aquatic Ecosystem Sci., & W. Walker for the Yurok Tribe A-67

Site: KR_Walker KR_Walker TN Dates: 05/01/2005 ‐ 10/15/2008Note: the yearly results are inaccurate due to lack of samples in winter high‐flow periods.
Daily concentrations predicted for winter months are inaccurate but do not impact the formulation of June‐Oct nutrient balances.
Daily Time Series: Yearly Time Series:
Site: KR_Walker KR_Walker Variable: TN
Output Period 05/01/05 10/15/08 Mean Daily Flow 6.542 10^6 m3/day
Calibration Period 05/01/05 10/15/08 Mean Daily Load 11.49 mt/day
Sample Dates 05/22/08 10/14/08 Flow‐Wtd Conc 1.756 ppm
Samples 24 Relative Std Error 2.4%
Method: 5 ‐ Regression + Interpolation Regression R2 92%
Regression SE 0.10
Appendices - Klamath Nutrient Loading & Retention Dynamics in Free-Flowing Reaches 2005-2008, Prepared by Kier Associates, Aquatic Ecosystem Sci., & W. Walker for the Yurok Tribe A-68

Site: KR_Walker KR_Walker TP Dates: 05/01/2005 ‐ 10/15/2008Note: the yearly results are inaccurate due to lack of samples in winter high‐flow periods.
Daily concentrations predicted for winter months are inaccurate but do not impact the formulation of June‐Oct nutrient balances.
Daily Time Series: Yearly Time Series:
Site: KR_Walker KR_Walker Variable: TP
Output Period 05/01/05 10/15/08 Mean Daily Flow 6.542 10^6 m3/day
Calibration Period 05/01/05 10/15/08 Mean Daily Load 0.75 mt/day
Sample Dates 05/22/08 10/14/08 Flow‐Wtd Conc 0.115 ppm
Samples 23 Relative Std Error 1.5%
Method: 5 ‐ Regression + Interpolation Regression R2 94%
Regression SE 0.09
Appendices - Klamath Nutrient Loading & Retention Dynamics in Free-Flowing Reaches 2005-2008, Prepared by Kier Associates, Aquatic Ecosystem Sci., & W. Walker for the Yurok Tribe A-69

Site: Salmon_R Salmon_R INORGN Dates: 05/01/2005 ‐ 10/15/2008Note: the yearly results are inaccurate due to lack of samples in winter high‐flow periods.
Daily concentrations predicted for winter months are inaccurate but do not impact the formulation of June‐Oct nutrient balances.
Daily Time Series: Yearly Time Series:
Site: Salmon_R Salmon_R Variable: INORGN
Output Period 05/01/05 10/15/08 Mean Daily Flow 5.131 10^6 m3/day
Calibration Period 05/01/05 10/15/08 Mean Daily Load 0.22 mt/day
Sample Dates 06/01/05 10/14/08 Flow‐Wtd Conc 0.043 ppm
Samples 30 Relative Std Error 6.7%
Method: 5 ‐ Regression + Interpolation Regression R2 27%
Regression SE 0.30
Appendices - Klamath Nutrient Loading & Retention Dynamics in Free-Flowing Reaches 2005-2008, Prepared by Kier Associates, Aquatic Ecosystem Sci., & W. Walker for the Yurok Tribe A-70

Site: Salmon_R Salmon_R ORGN Dates: 05/01/2005 ‐ 10/15/2008Note: the yearly results are inaccurate due to lack of samples in winter high‐flow periods.
Daily concentrations predicted for winter months are inaccurate but do not impact the formulation of June‐Oct nutrient balances.
Daily Time Series: Yearly Time Series:
Site: Salmon_R Salmon_R Variable: ORGN
Output Period 05/01/05 10/15/08 Mean Daily Flow 5.131 10^6 m3/day
Calibration Period 05/01/05 10/15/08 Mean Daily Load 0.11 mt/day
Sample Dates 08/24/05 10/14/08 Flow‐Wtd Conc 0.022 ppm
Samples 27 Relative Std Error 11.8%
Method: 5 ‐ Regression + Interpolation Regression R2 56%
Regression SE 0.80
Appendices - Klamath Nutrient Loading & Retention Dynamics in Free-Flowing Reaches 2005-2008, Prepared by Kier Associates, Aquatic Ecosystem Sci., & W. Walker for the Yurok Tribe A-71

Site: Salmon_R Salmon_R PP Dates: 05/01/2005 ‐ 10/15/2008Note: the yearly results are inaccurate due to lack of samples in winter high‐flow periods.
Daily concentrations predicted for winter months are inaccurate but do not impact the formulation of June‐Oct nutrient balances.
Daily Time Series: Yearly Time Series:
Site: Salmon_R Salmon_R Variable: PP
Output Period 05/01/05 10/15/08 Mean Daily Flow 5.131 10^6 m3/day
Calibration Period 05/01/05 10/15/08 Mean Daily Load 0.13 mt/day
Sample Dates 06/01/05 10/14/08 Flow‐Wtd Conc 0.025 ppm
Samples 30 Relative Std Error 25.9%
Method: 5 ‐ Regression + Interpolation Regression R2 52%
Regression SE 0.55
Appendices - Klamath Nutrient Loading & Retention Dynamics in Free-Flowing Reaches 2005-2008, Prepared by Kier Associates, Aquatic Ecosystem Sci., & W. Walker for the Yurok Tribe A-72

Site: Salmon_R Salmon_R SRP Dates: 05/01/2005 ‐ 10/15/2008Note: the yearly results are inaccurate due to lack of samples in winter high‐flow periods.
Daily concentrations predicted for winter months are inaccurate but do not impact the formulation of June‐Oct nutrient balances.
Daily Time Series: Yearly Time Series:
Site: Salmon_R Salmon_R Variable: SRP
Output Period 05/01/05 10/15/08 Mean Daily Flow 5.131 10^6 m3/day
Calibration Period 05/01/05 10/15/08 Mean Daily Load 0.01 mt/day
Sample Dates 06/01/05 10/14/08 Flow‐Wtd Conc 0.002 ppm
Samples 30 Relative Std Error 9.3%
Method: 5 ‐ Regression + Interpolation Regression R2 36%
Regression SE 0.57
Appendices - Klamath Nutrient Loading & Retention Dynamics in Free-Flowing Reaches 2005-2008, Prepared by Kier Associates, Aquatic Ecosystem Sci., & W. Walker for the Yurok Tribe A-73

Site: Salmon_R Salmon_R TN Dates: 05/01/2005 ‐ 10/15/2008Note: the yearly results are inaccurate due to lack of samples in winter high‐flow periods.
Daily concentrations predicted for winter months are inaccurate but do not impact the formulation of June‐Oct nutrient balances.
Daily Time Series: Yearly Time Series:
Site: Salmon_R Salmon_R Variable: TN
Output Period 05/01/05 10/15/08 Mean Daily Flow 5.131 10^6 m3/day
Calibration Period 05/01/05 10/15/08 Mean Daily Load 0.15 mt/day
Sample Dates 08/24/05 10/14/08 Flow‐Wtd Conc 0.030 ppm
Samples 27 Relative Std Error 10.1%
Method: 5 ‐ Regression + Interpolation Regression R2 55%
Regression SE 0.67
Appendices - Klamath Nutrient Loading & Retention Dynamics in Free-Flowing Reaches 2005-2008, Prepared by Kier Associates, Aquatic Ecosystem Sci., & W. Walker for the Yurok Tribe A-74

Site: Salmon_R Salmon_R TP Dates: 05/01/2005 ‐ 10/15/2008Note: the yearly results are inaccurate due to lack of samples in winter high‐flow periods.
Daily concentrations predicted for winter months are inaccurate but do not impact the formulation of June‐Oct nutrient balances.
Daily Time Series: Yearly Time Series:
Site: Salmon_R Salmon_R Variable: TP
Output Period 05/01/05 10/15/08 Mean Daily Flow 5.131 10^6 m3/day
Calibration Period 05/01/05 10/15/08 Mean Daily Load 0.04 mt/day
Sample Dates 06/01/05 10/14/08 Flow‐Wtd Conc 0.007 ppm
Samples 30 Relative Std Error 18.1%
Method: 5 ‐ Regression + Interpolation Regression R2 48%
Regression SE 0.38
Appendices - Klamath Nutrient Loading & Retention Dynamics in Free-Flowing Reaches 2005-2008, Prepared by Kier Associates, Aquatic Ecosystem Sci., & W. Walker for the Yurok Tribe A-75

Site: Scott_R Scott_R INORGN Dates: 05/01/2005 ‐ 10/15/2008Note: the yearly results are inaccurate due to lack of samples in winter high‐flow periods.
Daily concentrations predicted for winter months are inaccurate but do not impact the formulation of June‐Oct nutrient balances.
Daily Time Series: Yearly Time Series:
Site: Scott_R Scott_R Variable: INORGN
Output Period 05/01/05 10/15/08 Mean Daily Flow 1.964 10^6 m3/day
Calibration Period 05/01/05 10/15/08 Mean Daily Load 0.11 mt/day
Sample Dates 06/01/05 10/14/08 Flow‐Wtd Conc 0.058 ppm
Samples 34 Relative Std Error 15.2%
Method: 5 ‐ Regression + Interpolation Regression R2 64%
Regression SE 0.87
Appendices - Klamath Nutrient Loading & Retention Dynamics in Free-Flowing Reaches 2005-2008, Prepared by Kier Associates, Aquatic Ecosystem Sci., & W. Walker for the Yurok Tribe A-76

Site: Scott_R Scott_R ORGN Dates: 05/01/2005 ‐ 10/15/2008Note: the yearly results are inaccurate due to lack of samples in winter high‐flow periods.
Daily concentrations predicted for winter months are inaccurate but do not impact the formulation of June‐Oct nutrient balances.
Daily Time Series: Yearly Time Series:
Site: Scott_R Scott_R Variable: ORGN
Output Period 05/01/05 10/15/08 Mean Daily Flow 1.964 10^6 m3/day
Calibration Period 05/01/05 10/15/08 Mean Daily Load 0.83 mt/day
Sample Dates 06/28/05 10/14/08 Flow‐Wtd Conc 0.423 ppm
Samples 31 Relative Std Error 7.9%
Method: 5 ‐ Regression + Interpolation Regression R2 20%
Regression SE 0.43
Appendices - Klamath Nutrient Loading & Retention Dynamics in Free-Flowing Reaches 2005-2008, Prepared by Kier Associates, Aquatic Ecosystem Sci., & W. Walker for the Yurok Tribe A-77

Site: Scott_R Scott_R PP Dates: 05/01/2005 ‐ 10/15/2008Note: the yearly results are inaccurate due to lack of samples in winter high‐flow periods.
Daily concentrations predicted for winter months are inaccurate but do not impact the formulation of June‐Oct nutrient balances.
Daily Time Series: Yearly Time Series:
Site: Scott_R Scott_R Variable: PP
Output Period 05/01/05 10/15/08 Mean Daily Flow 1.964 10^6 m3/day
Calibration Period 05/01/05 10/15/08 Mean Daily Load 0.02 mt/day
Sample Dates 06/01/05 10/14/08 Flow‐Wtd Conc 0.010 ppm
Samples 34 Relative Std Error 10.6%
Method: 5 ‐ Regression + Interpolation Regression R2 62%
Regression SE 0.52
Appendices - Klamath Nutrient Loading & Retention Dynamics in Free-Flowing Reaches 2005-2008, Prepared by Kier Associates, Aquatic Ecosystem Sci., & W. Walker for the Yurok Tribe A-78

Site: Scott_R Scott_R SRP Dates: 05/01/2005 ‐ 10/15/2008Note: the yearly results are inaccurate due to lack of samples in winter high‐flow periods.
Daily concentrations predicted for winter months are inaccurate but do not impact the formulation of June‐Oct nutrient balances.
Daily Time Series: Yearly Time Series:
Site: Scott_R Scott_R Variable: SRP
Output Period 05/01/05 10/15/08 Mean Daily Flow 1.964 10^6 m3/day
Calibration Period 05/01/05 10/15/08 Mean Daily Load 0.01 mt/day
Sample Dates 06/01/05 10/14/08 Flow‐Wtd Conc 0.003 ppm
Samples 34 Relative Std Error 10.1%
Method: 5 ‐ Regression + Interpolation Regression R2 61%
Regression SE 0.60
Appendices - Klamath Nutrient Loading & Retention Dynamics in Free-Flowing Reaches 2005-2008, Prepared by Kier Associates, Aquatic Ecosystem Sci., & W. Walker for the Yurok Tribe A-79

Site: Scott_R Scott_R TN Dates: 05/01/2005 ‐ 10/15/2008Note: the yearly results are inaccurate due to lack of samples in winter high‐flow periods.
Daily concentrations predicted for winter months are inaccurate but do not impact the formulation of June‐Oct nutrient balances.
Daily Time Series: Yearly Time Series:
Site: Scott_R Scott_R Variable: TN
Output Period 05/01/05 10/15/08 Mean Daily Flow 1.964 10^6 m3/day
Calibration Period 05/01/05 10/15/08 Mean Daily Load 0.81 mt/day
Sample Dates 06/28/05 10/14/08 Flow‐Wtd Conc 0.413 ppm
Samples 31 Relative Std Error 6.5%
Method: 5 ‐ Regression + Interpolation Regression R2 58%
Regression SE 0.37
Appendices - Klamath Nutrient Loading & Retention Dynamics in Free-Flowing Reaches 2005-2008, Prepared by Kier Associates, Aquatic Ecosystem Sci., & W. Walker for the Yurok Tribe A-80

Site: Scott_R Scott_R TP Dates: 05/01/2005 ‐ 10/15/2008Note: the yearly results are inaccurate due to lack of samples in winter high‐flow periods.
Daily concentrations predicted for winter months are inaccurate but do not impact the formulation of June‐Oct nutrient balances.
Daily Time Series: Yearly Time Series:
Site: Scott_R Scott_R Variable: TP
Output Period 05/01/05 10/15/08 Mean Daily Flow 1.964 10^6 m3/day
Calibration Period 05/01/05 10/15/08 Mean Daily Load 0.02 mt/day
Sample Dates 06/01/05 10/14/08 Flow‐Wtd Conc 0.012 ppm
Samples 34 Relative Std Error 4.1%
Method: 5 ‐ Regression + Interpolation Regression R2 70%
Regression SE 0.40
Appendices - Klamath Nutrient Loading & Retention Dynamics in Free-Flowing Reaches 2005-2008, Prepared by Kier Associates, Aquatic Ecosystem Sci., & W. Walker for the Yurok Tribe A-81
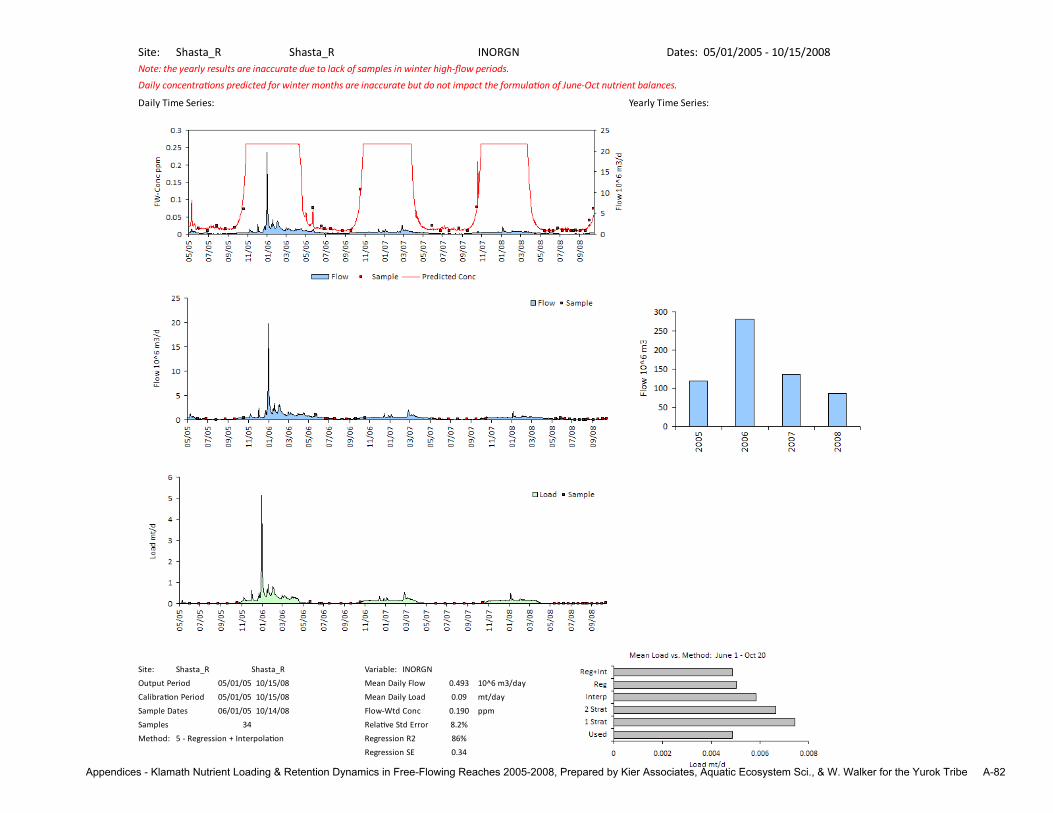
Site: Shasta_R Shasta_R INORGN Dates: 05/01/2005 ‐ 10/15/2008Note: the yearly results are inaccurate due to lack of samples in winter high‐flow periods.
Daily concentrations predicted for winter months are inaccurate but do not impact the formulation of June‐Oct nutrient balances.
Daily Time Series: Yearly Time Series:
Site: Shasta_R Shasta_R Variable: INORGN
Output Period 05/01/05 10/15/08 Mean Daily Flow 0.493 10^6 m3/day
Calibration Period 05/01/05 10/15/08 Mean Daily Load 0.09 mt/day
Sample Dates 06/01/05 10/14/08 Flow‐Wtd Conc 0.190 ppm
Samples 34 Relative Std Error 8.2%
Method: 5 ‐ Regression + Interpolation Regression R2 86%
Regression SE 0.34
Appendices - Klamath Nutrient Loading & Retention Dynamics in Free-Flowing Reaches 2005-2008, Prepared by Kier Associates, Aquatic Ecosystem Sci., & W. Walker for the Yurok Tribe A-82

Site: Shasta_R Shasta_R ORGN Dates: 05/01/2005 ‐ 10/15/2008Note: the yearly results are inaccurate due to lack of samples in winter high‐flow periods.
Daily concentrations predicted for winter months are inaccurate but do not impact the formulation of June‐Oct nutrient balances.
Daily Time Series: Yearly Time Series:
Site: Shasta_R Shasta_R Variable: ORGN
Output Period 05/01/05 10/15/08 Mean Daily Flow 0.493 10^6 m3/day
Calibration Period 05/01/05 10/15/08 Mean Daily Load 0.09 mt/day
Sample Dates 06/01/05 10/14/08 Flow‐Wtd Conc 0.190 ppm
Samples 34 Relative Std Error 5.5%
Method: 5 ‐ Regression + Interpolation Regression R2 69%
Regression SE 0.24
Appendices - Klamath Nutrient Loading & Retention Dynamics in Free-Flowing Reaches 2005-2008, Prepared by Kier Associates, Aquatic Ecosystem Sci., & W. Walker for the Yurok Tribe A-83

Site: Shasta_R Shasta_R PP Dates: 05/01/2005 ‐ 10/15/2008Note: the yearly results are inaccurate due to lack of samples in winter high‐flow periods.
Daily concentrations predicted for winter months are inaccurate but do not impact the formulation of June‐Oct nutrient balances.
Daily Time Series: Yearly Time Series:
Site: Shasta_R Shasta_R Variable: PP
Output Period 05/01/05 10/15/08 Mean Daily Flow 0.493 10^6 m3/day
Calibration Period 05/01/05 10/15/08 Mean Daily Load 0.01 mt/day
Sample Dates 06/01/05 10/14/08 Flow‐Wtd Conc 0.012 ppm
Samples 34 Relative Std Error 9.8%
Method: 5 ‐ Regression + Interpolation Regression R2 25%
Regression SE 0.87
Appendices - Klamath Nutrient Loading & Retention Dynamics in Free-Flowing Reaches 2005-2008, Prepared by Kier Associates, Aquatic Ecosystem Sci., & W. Walker for the Yurok Tribe A-84

Site: Shasta_R Shasta_R SRP Dates: 05/01/2005 ‐ 10/15/2008Note: the yearly results are inaccurate due to lack of samples in winter high‐flow periods.
Daily concentrations predicted for winter months are inaccurate but do not impact the formulation of June‐Oct nutrient balances.
Daily Time Series: Yearly Time Series:
Site: Shasta_R Shasta_R Variable: SRP
Output Period 05/01/05 10/15/08 Mean Daily Flow 0.493 10^6 m3/day
Calibration Period 05/01/05 10/15/08 Mean Daily Load 0.12 mt/day
Sample Dates 06/01/05 10/14/08 Flow‐Wtd Conc 0.238 ppm
Samples 34 Relative Std Error 2.3%
Method: 5 ‐ Regression + Interpolation Regression R2 61%
Regression SE 0.14
Appendices - Klamath Nutrient Loading & Retention Dynamics in Free-Flowing Reaches 2005-2008, Prepared by Kier Associates, Aquatic Ecosystem Sci., & W. Walker for the Yurok Tribe A-85

Site: Shasta_R Shasta_R TN Dates: 05/01/2005 ‐ 10/15/2008Note: the yearly results are inaccurate due to lack of samples in winter high‐flow periods.
Daily concentrations predicted for winter months are inaccurate but do not impact the formulation of June‐Oct nutrient balances.
Daily Time Series: Yearly Time Series:
Site: Shasta_R Shasta_R Variable: TN
Output Period 05/01/05 10/15/08 Mean Daily Flow 0.493 10^6 m3/day
Calibration Period 05/01/05 10/15/08 Mean Daily Load 0.11 mt/day
Sample Dates 06/01/05 10/14/08 Flow‐Wtd Conc 0.232 ppm
Samples 34 Relative Std Error 5.1%
Method: 5 ‐ Regression + Interpolation Regression R2 59%
Regression SE 0.22
Appendices - Klamath Nutrient Loading & Retention Dynamics in Free-Flowing Reaches 2005-2008, Prepared by Kier Associates, Aquatic Ecosystem Sci., & W. Walker for the Yurok Tribe A-86

Site: Shasta_R Shasta_R TP Dates: 05/01/2005 ‐ 10/15/2008Note: the yearly results are inaccurate due to lack of samples in winter high‐flow periods.
Daily concentrations predicted for winter months are inaccurate but do not impact the formulation of June‐Oct nutrient balances.
Daily Time Series: Yearly Time Series:
Site: Shasta_R Shasta_R Variable: TP
Output Period 05/01/05 10/15/08 Mean Daily Flow 0.493 10^6 m3/day
Calibration Period 05/01/05 10/15/08 Mean Daily Load 0.08 mt/day
Sample Dates 06/01/05 10/14/08 Flow‐Wtd Conc 0.155 ppm
Samples 34 Relative Std Error 1.4%
Method: 5 ‐ Regression + Interpolation Regression R2 62%
Regression SE 0.09
Appendices - Klamath Nutrient Loading & Retention Dynamics in Free-Flowing Reaches 2005-2008, Prepared by Kier Associates, Aquatic Ecosystem Sci., & W. Walker for the Yurok Tribe A-87

Site: Trinity_R Trinity_R INORGN Dates: 05/01/2005 ‐ 10/15/2008Note: the yearly results are inaccurate due to lack of samples in winter high‐flow periods.
Daily concentrations predicted for winter months are inaccurate but do not impact the formulation of June‐Oct nutrient balances.
Daily Time Series: Yearly Time Series:
Site: Trinity_R Trinity_R Variable: INORGN
Output Period 05/01/05 10/15/08 Mean Daily Flow 14.593 10^6 m3/day
Calibration Period 05/01/05 10/15/08 Mean Daily Load 1.19 mt/day
Sample Dates 06/01/05 10/15/08 Flow‐Wtd Conc 0.082 ppm
Samples 29 Relative Std Error 5.9%
Method: 5 ‐ Regression + Interpolation Regression R2 76%
Regression SE 0.29
Appendices - Klamath Nutrient Loading & Retention Dynamics in Free-Flowing Reaches 2005-2008, Prepared by Kier Associates, Aquatic Ecosystem Sci., & W. Walker for the Yurok Tribe A-88

Site: Trinity_R Trinity_R ORGN Dates: 05/01/2005 ‐ 10/15/2008Note: the yearly results are inaccurate due to lack of samples in winter high‐flow periods.
Daily concentrations predicted for winter months are inaccurate but do not impact the formulation of June‐Oct nutrient balances.
Daily Time Series: Yearly Time Series:
Site: Trinity_R Trinity_R Variable: ORGN
Output Period 05/01/05 10/15/08 Mean Daily Flow 14.593 10^6 m3/day
Calibration Period 05/01/05 10/15/08 Mean Daily Load 2.44 mt/day
Sample Dates 09/21/05 10/15/08 Flow‐Wtd Conc 0.167 ppm
Samples 25 Relative Std Error 6.6%
Method: 5 ‐ Regression + Interpolation Regression R2 68%
Regression SE 0.55
Appendices - Klamath Nutrient Loading & Retention Dynamics in Free-Flowing Reaches 2005-2008, Prepared by Kier Associates, Aquatic Ecosystem Sci., & W. Walker for the Yurok Tribe A-89

Site: Trinity_R Trinity_R PP Dates: 05/01/2005 ‐ 10/15/2008Note: the yearly results are inaccurate due to lack of samples in winter high‐flow periods.
Daily concentrations predicted for winter months are inaccurate but do not impact the formulation of June‐Oct nutrient balances.
Daily Time Series: Yearly Time Series:
Site: Trinity_R Trinity_R Variable: PP
Output Period 05/01/05 10/15/08 Mean Daily Flow 14.593 10^6 m3/day
Calibration Period 05/01/05 10/15/08 Mean Daily Load 1.61 mt/day
Sample Dates 06/01/05 10/15/08 Flow‐Wtd Conc 0.111 ppm
Samples 29 Relative Std Error 6.0%
Method: 5 ‐ Regression + Interpolation Regression R2 90%
Regression SE 0.28
Appendices - Klamath Nutrient Loading & Retention Dynamics in Free-Flowing Reaches 2005-2008, Prepared by Kier Associates, Aquatic Ecosystem Sci., & W. Walker for the Yurok Tribe A-90

Site: Trinity_R Trinity_R SRP Dates: 05/01/2005 ‐ 10/15/2008Note: the yearly results are inaccurate due to lack of samples in winter high‐flow periods.
Daily concentrations predicted for winter months are inaccurate but do not impact the formulation of June‐Oct nutrient balances.
Daily Time Series: Yearly Time Series:
Site: Trinity_R Trinity_R Variable: SRP
Output Period 05/01/05 10/15/08 Mean Daily Flow 14.593 10^6 m3/day
Calibration Period 05/01/05 10/15/08 Mean Daily Load 0.02 mt/day
Sample Dates 06/01/05 10/15/08 Flow‐Wtd Conc 0.002 ppm
Samples 29 Relative Std Error 12.8%
Method: 5 ‐ Regression + Interpolation Regression R2 62%
Regression SE 0.59
Appendices - Klamath Nutrient Loading & Retention Dynamics in Free-Flowing Reaches 2005-2008, Prepared by Kier Associates, Aquatic Ecosystem Sci., & W. Walker for the Yurok Tribe A-91

Site: Trinity_R Trinity_R TN Dates: 05/01/2005 ‐ 10/15/2008Note: the yearly results are inaccurate due to lack of samples in winter high‐flow periods.
Daily concentrations predicted for winter months are inaccurate but do not impact the formulation of June‐Oct nutrient balances.
Daily Time Series: Yearly Time Series:
Site: Trinity_R Trinity_R Variable: TN
Output Period 05/01/05 10/15/08 Mean Daily Flow 14.593 10^6 m3/day
Calibration Period 05/01/05 10/15/08 Mean Daily Load 3.48 mt/day
Sample Dates 09/21/05 10/15/08 Flow‐Wtd Conc 0.238 ppm
Samples 25 Relative Std Error 6.1%
Method: 5 ‐ Regression + Interpolation Regression R2 72%
Regression SE 0.39
Appendices - Klamath Nutrient Loading & Retention Dynamics in Free-Flowing Reaches 2005-2008, Prepared by Kier Associates, Aquatic Ecosystem Sci., & W. Walker for the Yurok Tribe A-92

Site: Trinity_R Trinity_R TP Dates: 05/01/2005 ‐ 10/15/2008Note: the yearly results are inaccurate due to lack of samples in winter high‐flow periods.
Daily concentrations predicted for winter months are inaccurate but do not impact the formulation of June‐Oct nutrient balances.
Daily Time Series: Yearly Time Series:
Site: Trinity_R Trinity_R Variable: TP
Output Period 05/01/05 10/15/08 Mean Daily Flow 14.593 10^6 m3/day
Calibration Period 05/01/05 10/15/08 Mean Daily Load 0.80 mt/day
Sample Dates 06/01/05 10/15/08 Flow‐Wtd Conc 0.055 ppm
Samples 29 Relative Std Error 3.0%
Method: 5 ‐ Regression + Interpolation Regression R2 94%
Regression SE 0.19
Appendices - Klamath Nutrient Loading & Retention Dynamics in Free-Flowing Reaches 2005-2008, Prepared by Kier Associates, Aquatic Ecosystem Sci., & W. Walker for the Yurok Tribe A-93