appendix 11: samples of guides to test interpretation · appendix 11: samples of guides to test...
TRANSCRIPT
Spring 2013 Alaska Science Standards Based Assessment (SBA) Technical Report
Data Recognition Corporation Appendix 11, Page 1
APPENDIX 11: SAMPLES OF GUIDES TO TEST INTERPRETATION

Comprehensive System of Student Assessment
(CSSA)
Guide to Test Interpretation
for theGrade 8
Science Standards Based Assessment
For Teachers and Staff
Spring 2013

Guide to Test Interpretation for the Grade 8 Science SBA for Teachers and Staff Page ii
Copyright © 2013 by the Alaska Department of Education & Early Development
Introduction
This Guide to Test Interpretation provides an overview of reporting for the Alaska Grade 8 Science Standards Based Assessment (SBA). It is intended to help educators interpret test report data in order to better meet the needs of individual students and the district as a whole. The following information is included in this guide:
Table of Contents
Explanation of Examinations and Scoring................................................................................................1
The Purpose of Testing ..........................................................................................................................1How Results are Measured ....................................................................................................................1The Purpose and Usefulness of Raw Scores and Scale Scores ..............................................................1
Raw Score ........................................................................................................................................1Scale Score .......................................................................................................................................1Scale Score Interpretations and Limitations ....................................................................................2
Components of the Science SBA ................................................................................................................2
Frequently Asked Questions .......................................................................................................................3
Using Results ...............................................................................................................................................5
Science SBA Report Information ...........................................................................................................5
Sample Reports ............................................................................................................................................6
Student Report .......................................................................................................................................6School Student Roster ............................................................................................................................8School Summary Report ......................................................................................................................10School Subpopulation Summary Report ..............................................................................................12District School Roster ..........................................................................................................................13District Subpopulation Summary Report .............................................................................................15
Science SBA Grade 8 Proficiency Level Descriptors ...............................................................................16
Glossary .....................................................................................................................................................18

Guide to Test Interpretation for the Grade 8 Science SBA for Teachers and Staff Page 1
Copyright © 2013 by the Alaska Department of Education & Early Development
Explanation of Examinations and Scoring
The Purpose of Testing
The purpose of the Standards Based Assessment (SBA) is to (a) determine on a statewide basis the extent to which students are meeting statewide performance standards; (b) produce statewide information that enables sound decision making by policy makers, parents, educators, and the public; and (c) provide a focus in order to improve instruction [4 AAC 06.700].
The Alaska Standards Based Assessment (SBA) is the result of intense effort and collaboration among teachers, administrators, and the Alaska State Board of Education. The proficient score on the examination was designed to reflect what students should know as a result of their public school experience.
How Results are Measured
Students are tested on the Alaska Performance Standards/Grade Level Expectations (PSGLEs) in science. The PSGLEs are aligned to the Alaska Content Standards and are statements that define what all students should know and be able to do at the end of a given grade level. Each Performance Standard/Grade Level Expectation is meant to further define a content standard. Alaska teachers developed the PSGLEs for Alaska students. For detailed information on the standards, please access the Department of Education & Early Development (EED) publication, Alaska Standards: Content and Performance Standards for Alaska Students available on the EED website at: http://education.alaska.gov/standards/.
The Purpose and Usefulness of Raw Scores and Scale Scores
Raw Score
The primary indicator of performance on the science SBA is the raw score. A raw score is reported for each examinee in science. The raw score is the number of multiple-choice items answered correctly plus the number of points earned on short- and extended-response items on the science SBA. By itself, the raw score has limited utility; it can only be interpreted in reference to the total number of items on the science SBA. Raw scores cannot be compared across tests or administrations.
Scale Score
Since a given raw score may not represent the same skill level on every test form, all statewide assessment score reports include scale scores. Scale scores are statistical conversions of raw scores that adjust for slight shifts in item difficulties and permit valid comparison across all test administrations within a particular subject. The scale score range for the science SBA is from a minimum of 100 to a maximum of 600.
Guide to Test Interpretation for the Grade 8 Science SBA for Teachers and Staff Page 2
Copyright © 2013 by the Alaska Department of Education & Early Development
When new test forms are developed, the new items will require slightly different levels of subject-area skill to answer correctly. This depends on the difficulty of the specific questions used on each form. To be fair to students, to permit valid comparison of test scores across administrations, and to maintain a consistent passing score, the skills represented by each score point must remain consistent from year to year.
As noted previously, scale scores adjust for slight shifts in underlying difficulty levels at each score point and provide valid points of comparison across all test administrations within a particular grade and subject. With scale scores, schools can compare the demonstrated knowledge and ability of different cohorts across years. Comparing scale scores on the assessments can help schools determine the impact of instruction and curriculum.
Scale Score Interpretations and Limitations
The scale scores associated with the science SBA are not equated with other grade 8 SBA examinations, even though they share a common scale score range. Therefore, interpretation of individual score differences between the assessments is inappropriate.
Components of the Science SBA
The science SBA was developed from a variety of written sources, and assesses the students’ skills in the areas of: inquiry, technology, nature of science, physical science, life science, and earth science. The science SBA contains multiple-choice questions with four possible answer choices. These answers are machine-scored. Short- and extended-response questions allow students the opportunity to create a response to meaningful situations to demonstrate their knowledge and skill. Responses are scored by professional staff experienced in providing reliable and consistent hand scoring. Questions requiring a written response allow for full or partial credit.

Guide to Test Interpretation for the Grade 8 Science SBA for Teachers and Staff Page 3
Copyright © 2013 by the Alaska Department of Education & Early Development
Frequently Asked Questions
Subject/StandardPoints
Possible*Points
Earned*Scale Score
Earned*
Science 62 62 600
A, E–GInquiry and Nature of Science
20 20 600
BConcepts of Physical Science
14 14 600
CConcepts of Life Science
16 16 535
DConcepts of Earth Science
12 12 534
* This illustration is not based on the current administration.
Question:
In 8th grade science, the maximum overall scale score is 600. However, the four maximum subject/standard scale scores are 600, 600, 535, and 534. How can these four numbers combine into a higher number (600) than two of the four numbers?
Answer:
It is necessary to understand the relationship between raw scores and scale scores to appreciate the seeming anomaly.
Range:
Two things, the number of items and the difficulty of the items that make up a standard, determine the range of possible scale scores.
– The longer the test, the wider the range of scale scores. – The easier the test, the lower the maximum scale score.
z For any given person, the raw score for the total test is the sum of the raw scores for the standards, BUT the total scale score is not the sum, nor the average of the standard scale scores.
z There is no mathematical relationship between the average of the scale scores for the standards and the average overall scale score.

Guide to Test Interpretation for the Grade 8 Science SBA for Teachers and Staff Page 4
Copyright © 2013 by the Alaska Department of Education & Early Development
Impact of hard and easy items:
The relationship between raw scores and scale scores is designed to eliminate the effect of taking a hard test or an easy test, or the fact that the items from one standard may be easier than the items from another standard.
– Students would need fewer correct responses on a “harder” standard to achieve the same scale score they would get by having more correct responses on an “easier” standard.OR
– Answering 70% of the items correctly on a “harder” standard represents a higher level of ability than answering 70% of the items correctly on an “easier” standard.
z The raw score to scale score conversion levels the playing field, removing the impact of harder items or easier items in a given standard.
z The total test scale score is not a simple average of the standard scale scores.
– The relationship is much too complex to be described by an average that ignores the number of items in each test and the average difficulty of the items making up that standard.
Question:
Is it possible for a student to answer all of the items correctly in a standard and not get the highest possible scale score (600)?
Answer:
Yes.
z A perfect score in a standard with easier items will translate into a lower scale score than a perfect score in a standard with harder items.
– Both maximum scores may be less than the maximum score for the overall test. { This is due to the distribution of item difficulties and the number of items. { It is easier to answer 11 of 11 items correctly in a single standard than it is to answer 64 of
64 items correctly on the entire test. – The scale score for answering all of the items correctly on a standard will necessarily
represent less ability than answering all of the items correctly on the overall test. – Although the scale score span goes from 100 to 600, it does not mean it is possible to
get the highest or lowest scale score on every standard or even the overall test.

Guide to Test Interpretation for the Grade 8 Science SBA for Teachers and Staff Page 5
Copyright © 2013 by the Alaska Department of Education & Early Development
Using Results
The science SBA results and reports provide useful information for determining the performance of students in your school and classroom. This guide will also help you prepare for questions from parents, students, and other members of the education community regarding the science SBA results.
Each report is designed to clearly present the information most useful to you and to parents and students. The audience and student populations for each of the science SBA reports are listed below.
Science SBA Report Information
Report
For Schools—Teachers and Administrators
Guide to Test Interpretation for Teachers and Staff
Guide to Test Interpretation for Parents and Students
Student Reports
School Student Roster
School Summary Report
School Subpopulation Summary Report
For Districts
Guide to Test Interpretation for Teachers and Staff
Guide to Test Interpretation for Parents and Students
Student Reports
School Student Rosters
School Summary Reports
School Subpopulation Summary Report
District School Roster
District Subpopulation Summary Report
File Layout for Student Data File
Student Data File
File Layout for Abbreviated Student Data File
Abbreviated Student Data File

Guide to Test Interpretation for the Grade 8 Science SBA for Teachers and Staff Page 6
Copyright © 2013 by the Alaska Department of Education & Early Development
Sample Reports
Student Report
* SA
MPL
E R
EPO
RT:
Thi
s sam
ple
repo
rt is
not
bas
ed o
n th
e cu
rren
t adm
inis
tratio
n.
A
B
C D I
EF
G
HJ
KSA
MPL
E RE
PORT
*

Guide to Test Interpretation for the Grade 8 Science SBA for Teachers and Staff Page 7
Copyright © 2013 by the Alaska Department of Education & Early Development
Student Report (continued)
A Presents student demographics.
B Indicates the student’s scale score and proficiency level in science. In order to be considered proficient, the student must score at or above the Alaska Proficient Scale Score.
C Describes the proficiency levels reported in section B. Scores on the science SBA are grouped into four proficiency levels.
D Describes the scale scores reported in section B. The scale score earned by the student determines the student’s performance level of advanced, proficient, below proficient, or far below proficient on the science SBA. The points earned are converted into a scale score that takes into consideration the fact that some items that make up a standard on the test are more difficult than others. Therefore, a student can earn the same raw score on two standards and end up with two different scale scores. For this reason, you cannot divide the points earned by the points possible for a standard to derive the scale score.
E Lists the Performance Standard categories.
F Lists the total points possible for the Performance Standard categories.
G Lists the points earned by the student for the Performance Standards on the science SBA. Points earned are not valid for comparisons across grades, and/or standards. The same raw score on two standards usually results in two different scale scores depending on the number of questions and the difficulty of the questions. For this reason, you cannot divide the points earned by the points possible to determine meaningful percentages.
H Lists the scale score equivalent for points earned.
I Explains the information found in the probable scale score range chart (J).
J Graphically illustrates the student’s scale score (♦), the student’s 80% confidence interval for Performance Standards and total test, and the proficiency cut score for the total test.
K Describes the skills necessary for a student to be proficient, along with the range of scale scores associated with each level.

Guide to Test Interpretation for the Grade 8 Science SBA for Teachers and Staff Page 8
Copyright © 2013 by the Alaska Department of Education & Early Development
School Student Roster
* SA
MPL
E R
EPO
RT:
Thi
s sam
ple
repo
rt is
not
bas
ed o
n th
e cu
rren
t adm
inis
tratio
n.
AB
CD
EFSA
MPL
E RE
PORT
*

Guide to Test Interpretation for the Grade 8 Science SBA for Teachers and Staff Page 9
Copyright © 2013 by the Alaska Department of Education & Early Development
School Student Roster (continued)
This report includes summary information for each student within a school. The report lists students alphabetically by ascending grade.
A Indicates the proficient scale scores for the science SBA.
B Indicates the average scale score on the science SBA, as well as the average scale score by Performance Standard category for the state, district, and school. It also lists the proficiency level and scale scores in science for each student reported to the school.
C Indicates the state average scale scores for the science SBA and Performance Standards.
D Indicates the district average scale scores for the science SBA and Performance Standards.
E Indicates the school average scale scores for the science SBA and Performance Standards.
F Indicates the proficiency level and scale score by test and Performance Standard for each student reported to the school. This section may also indicate why a student did not receive a score.
z ABS = absent
z INV = invalid
z MOD = modified examination*
z NOA = test not attempted
z PRF = parent refusal
z SRF = student refusal
z SUS = suspension
*Students with disabilities cannot be denied the modification(s) their IEP teams have documented, but students can refuse the modification(s). NOTE: Modified tests are invalid and will not be scored.

Guide to Test Interpretation for the Grade 8 Science SBA for Teachers and Staff Page 10
Copyright © 2013 by the Alaska Department of Education & Early Development
School Summary Report
AB
CD E F G
* SA
MPL
E R
EPO
RT:
Thi
s sam
ple
repo
rt is
not
bas
ed o
n th
e cu
rren
t adm
inis
tratio
n.
SAM
PLE
REPO
RT*

Guide to Test Interpretation for the Grade 8 Science SBA for Teachers and Staff Page 11
Copyright © 2013 by the Alaska Department of Education & Early Development
School Summary Report (continued)
This report provides an analysis of group standards mastery using the average scale score obtained for each reportable standard and details for the percent of students in each proficiency level.
A Explains the comparison of proficiency levels.
B Lists the total points possible for the science SBA and the Performance Standard categories, as well as the average points earned for the school. It also lists the state, district, and school average scale scores for the science SBA and the Performance Standard categories.
C Lists the points possible for the science SBA and Performance Standard categories.
D Lists the average points earned and average scale score at the school level for the science SBA and Performance Standard categories.
E Lists the average scale score at the district level for the science SBA and Performance Standard categories.
F Lists the average scale score at the state level for the science SBA and Performance Standard categories.
G Lists the total number and percent of students tested, as well as the number and percent of students who were advanced, proficient, below proficient, and far below proficient in science at the school, district, and state levels.
Note: Students who were coded absent, invalid, modified, parent refusal, student refusal, or suspension, as well as students who did not attempt the test, are not included in the summarization of results for this report.

Guide to Test Interpretation for the Grade 8 Science SBA for Teachers and Staff Page 12
Copyright © 2013 by the Alaska Department of Education & Early Development
School Subpopulation Summary Report
A
* SAMPLE REPORT: This sample report is not based on the current administration.
SAMPLE R
EPORT*
This report provides details for the percent of students in each proficiency level in grade 8.
A Lists the total number and percent of students tested, as well as the number and percent of students who were advanced, proficient, below proficient, and far below proficient in science in a variety of demographic reporting categories at the school level.
Guide to Test Interpretation for the Grade 8 Science SBA for Teachers and Staff Page 13
Copyright © 2013 by the Alaska Department of Education & Early Development
District School Roster
AB
CD
E
* SA
MPL
E R
EPO
RT:
Thi
s sam
ple
repo
rt is
not
bas
ed o
n th
e cu
rren
t adm
inis
tratio
n.
SAM
PLE
REPO
RT*

Guide to Test Interpretation for the Grade 8 Science SBA for Teachers and Staff Page 14
Copyright © 2013 by the Alaska Department of Education & Early Development
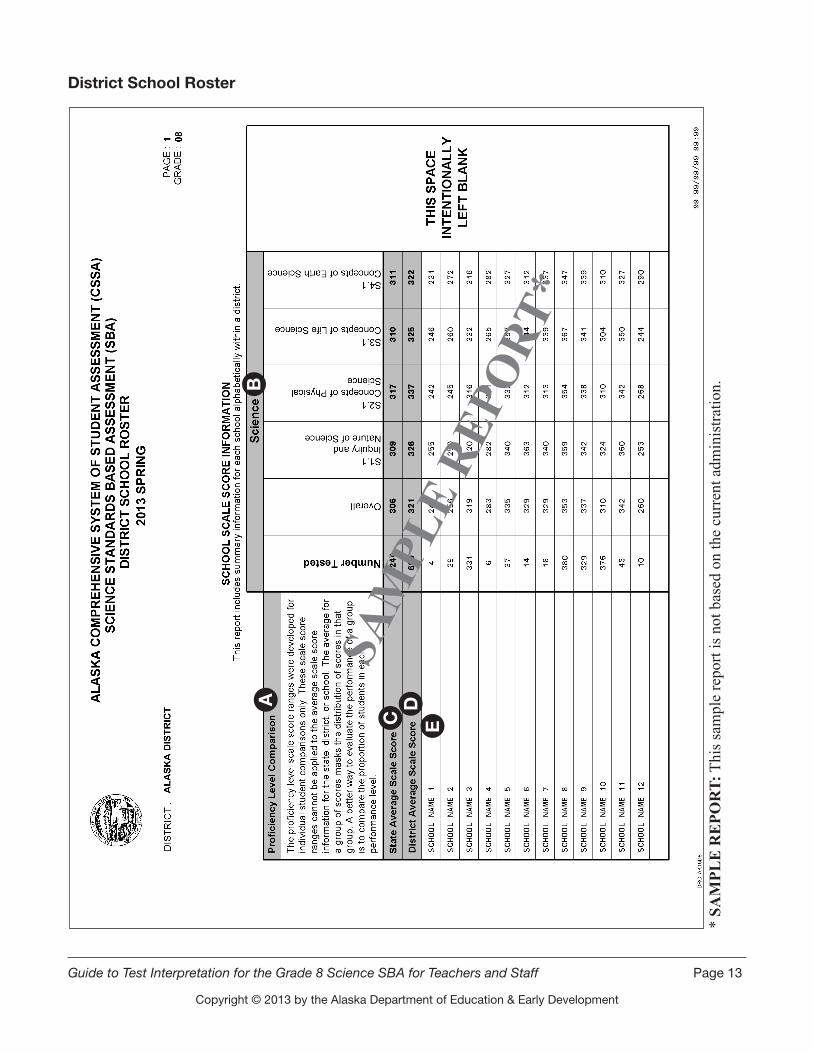
District School Roster (continued)
This report includes summary information for each school alphabetically within a district.
A Explains the comparison of proficiency levels.
B Indicates the average scale score for the science SBA, as well as the average scale score by Performance Standard category for the state, district, and all schools in the district.
C Indicates the number of students tested in the state, as well as the state average scale scores for the science SBA and Performance Standards.
D Indicates the number of students tested in the district, as well as the district average scale scores for the science SBA and Performance Standards.
E Indicates the number of students tested in each school, as well as the school average scale scores for the science SBA and Performance Standards.
Note: Students who were coded absent, invalid, modified, parent refusal, student refusal, or suspension, as well as students who did not attempt the test, are not included in the summarization of results for this report.

Guide to Test Interpretation for the Grade 8 Science SBA for Teachers and Staff Page 15
Copyright © 2013 by the Alaska Department of Education & Early Development
District Subpopulation Summary Report
A
* SAMPLE REPORT: This sample report is not based on the current administration.
SAMPLE R
EPORT*
This report provides details for the percent of students in each proficiency level in grade 8.
A Lists the total number and percent of students tested, as well as the number and percent of students who were advanced, proficient, below proficient, and far below proficient in science in a variety of demographic reporting categories at the district level.

Guide to Test Interpretation for the Grade 8 Science SBA for Teachers and Staff Page 16
Copyright © 2013 by the Alaska Department of Education & Early Development
Science SBA Grade 8 Proficiency Level Descriptors
Advanced Level
The student
z displays a highly developed conceptual understanding by applying experimental design processes to investigations
z examines scientific inquiry
z explains nature of science concepts
z analyzes and evaluates differing scientific explanations and models
z explains and compares the structure and properties of matter
z describes transformations, transfers and conservation of energy
z draws conclusions about the interactions between forces, motion, energy, and matter
z explains the structure, function, behavior, development, life cycles, and diversity of living organisms, their changes over time, and their relationships within environments
z describes features of Earth
z interprets and compares the geochemical cycles, changes, and interactions between Earth and the solar system
Proficient Level
The student
z demonstrates a basic conceptual understanding by incorporating methods of experimental design into investigations
z applies scientific inquiry
z demonstrates nature of science concepts
z analyzes differing scientific explanations and models
z differentiates among the structure and properties of matter
z identifies transformations, transfers and conservation of energy and describes the interactions between forces, motion, energy, and matter
z recognizes the structure, function, behavior, development, life cycles, and diversity of living organisms, their change over time, and changes within environments
z identifies features of Earth
z explains geochemical cycles, changes, and interactions between Earth and the solar system
Guide to Test Interpretation for the Grade 8 Science SBA for Teachers and Staff Page 17
Copyright © 2013 by the Alaska Department of Education & Early Development
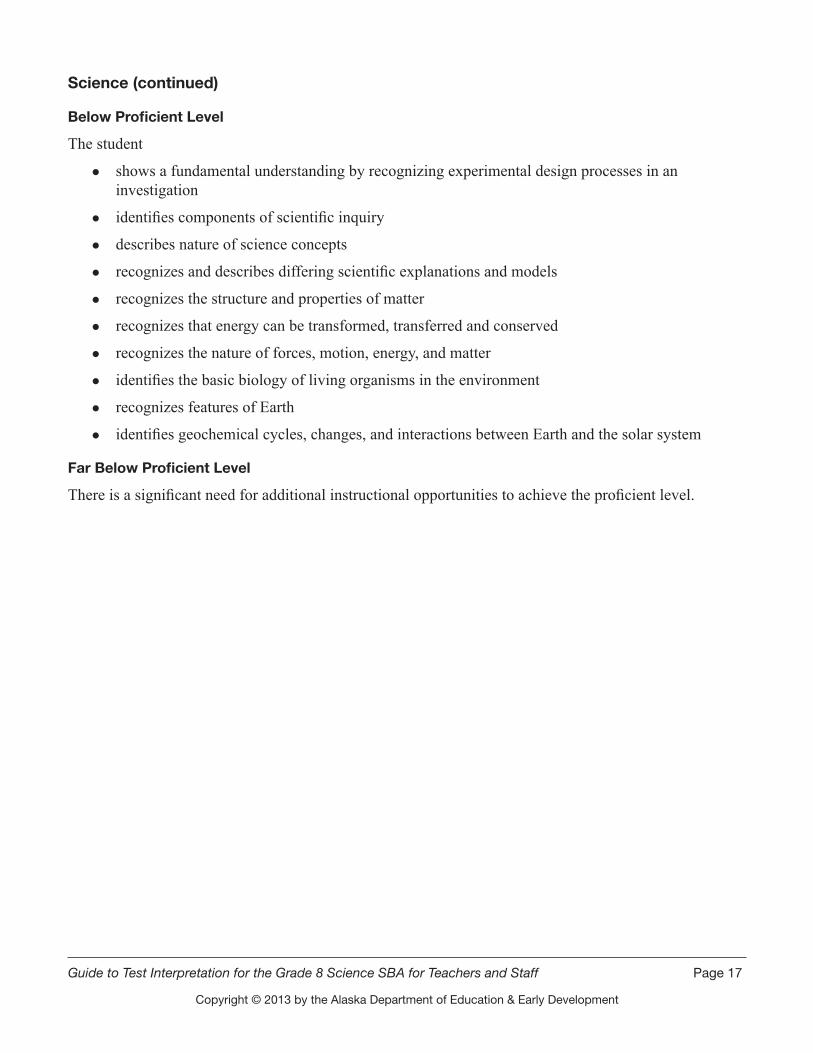
Science (continued)
Below Proficient Level
The student
z shows a fundamental understanding by recognizing experimental design processes in an investigation
z identifies components of scientific inquiry
z describes nature of science concepts
z recognizes and describes differing scientific explanations and models
z recognizes the structure and properties of matter
z recognizes that energy can be transformed, transferred and conserved
z recognizes the nature of forces, motion, energy, and matter
z identifies the basic biology of living organisms in the environment
z recognizes features of Earth
z identifies geochemical cycles, changes, and interactions between Earth and the solar system
Far Below Proficient Level
There is a significant need for additional instructional opportunities to achieve the proficient level.

Guide to Test Interpretation for the Grade 8 Science SBA for Teachers and Staff Page 18
Copyright © 2013 by the Alaska Department of Education & Early Development
Glossary
Constructed-Response Question
An assessment unit with directions, a question, or a problem that elicits a written, pictorial, or graphic response from a student. Sometimes called an “open-ended” item.
Content Standard
Broad statements of what students should know and be able to do as a result of their public school experience.
Forms
Different versions of a test that measure the same subject area.
Item
One of the assessment units, usually a problem or a question, in a test.
Mean
An average, calculated by adding the values of a set of scores and dividing by the number of scores in the set.
Multiple-Choice Question
A question or incomplete statement that is followed by answer choices, one of which is the correct or best answer.
Performance Standard
A statement that defines what all students should know and be able to do at the end of a given grade level.
Proficiency Level
Category that reflects a range of test scores that represents a student’s current acquired knowledge and skills in the subject area.
Scale Score
Three-digit number that provides a common metric for expressing student performance from different forms.
Standard Error of Measurement
A mathematical calculation that estimates a range within which a student’s “true score” would fall, had that student taken the test numerous times. It is important to understand that all tests have an inherent measurement error because they are a sample of student performance at one particular time.
Standardized Test
A test administered in accordance with explicit directions for uniform administration.
Copyright © 2013 by the Alaska Department of Education & Early Development. Only the State of Alaska educators and citizens may copy, download and/or print the document, located online at http://education.alaska.gov. Any other use or reproduction of this document, in whole or in part, requires written permission of Alaska Department of Education & Early Development and the publisher.
Comprehensive System of Student Assessment (CSSA)
Guide to Test Interpretation for the Grade 8
Science Standards Based AssessmentFor Parents and Students
Spring 2013
Explanation of Examinations and Scoring
The Purpose of Testing
The purpose of the Standards Based Assessment (SBA) is to (a) determine on a statewide basis the extent to which students are meeting statewide performance standards; (b) produce statewide information that enables sound decision making by policy makers, parents, educators, and the public; and (c) provide a focus in order to improve instruction [4 AAC 06.700].
What the Science SBA Measures
The science component of the Standards Based Assessment (SBA) measures what students know and are able to do at their grade level in science as compared to the Alaska Performance Standards/Grade Level Expectations. For detailed information on the standards, please access the Department of Education & Early Development (EED) publication, Alaska Standards: Content and Performance Standards for Alaska Students available on the EED website at: http://education.alaska.gov/standards/.
Components of the Science SBA
The science SBA was developed from a variety of written sources, and assesses the students’ skills in the areas of: inquiry, technology, nature of science, physical science, life science, and earth science. The science SBA contains multiple-choice questions with four possible answer choices. These answers are machine-scored. Short- and extended-response questions allow students the opportunity to create a response to meaningful situations to demonstrate their knowledge and skill. Responses are scored by professional staff experienced in providing reliable and consistent hand scoring. Questions requiring a written response allow for full or partial credit.

Guide to Test Interpretation for the Grade 8 Science SBA for Parents and Students Page 2
Student Report
* SAMPLE REPORT: This sample report is not based on the current administration.
A
B
C
D
I
E F
G
HJ
SAMPLE REPORT*K
Reading the Student Report
A Presents student demographics.
B Indicatesthestudent’sscalescoreandproficiencylevelinscience. Inordertobeconsideredproficient,thestudentmustscoreatorabovetheAlaskaProficientScaleScore.
C DescribestheproficiencylevelsreportedinsectionB.ScoresonthescienceSBAaregroupedintofourproficiencylevels.
D Describes the scale scores reported in section B. The scale score earned by the student determines the student’s performancelevelofadvanced,proficient,belowproficient,orfarbelowproficientonthescienceSBA.Thepointsearned are converted into a scale score that takes into consideration the fact that some items that make up a standard onthetestaremoredifficultthanothers.Therefore,astudentcanearnthesamerawscoreontwostandardsandendup with two different scale scores. For this reason, you cannot divide the points earned by the points possible for a standard to derive the scale score.

Guide to Test Interpretation for the Grade 8 Science SBA for Parents and Students Page 3
E Lists the Performance Standard categories.
F Lists the total points possible for the Performance Standard categories.
G Lists the points earned by the student for the Performance Standards on the science SBA. Points earned are not valid for comparisons across grades, and/or standards. The same raw score on two standards usually results in two differentscalescoresdependingonthenumberofquestionsandthedifficultyofthequestions.Forthisreason,youcannot divide the points earned by the points possible to determine meaningful percentages.
H Lists the scale score equivalent for points earned.
I Explains the information found in the probable scale score range chart (J).
J Graphicallyillustratesthestudent’sscalescore(♦),thestudent’s80%confidenceintervalforPerformanceStandardsandtotaltest,andtheproficiencycutscoreforthetotaltest.
K Describestheskillsnecessaryforastudenttobeproficient,alongwiththerangeofscalescoresassociatedwitheachlevel.
Frequently Asked Questions
Subject/StandardPoints
Possible*Points
Earned*Scale Score
Earned*
Science 62 62 600
A, E–GInquiry and Nature of Science
20 20 600
BConcepts of Physical Science
14 14 600
CConcepts of Life Science
16 16 535
DConcepts of Earth Science
12 12 534
* This illustration is not based on the current administration.
Question:
In8th grade science, the maximum overall scale score is 600. However, the four maximum subject/standard scale scores are 600, 600, 535, and 534. How can these four numbers combine into a higher number (600) than two of the four numbers?
Answer:
It is necessary to understand the relationship between raw scores and scale scores to appreciate the seeming anomaly.
Range:
Twothings,thenumberofitemsandthedifficultyoftheitemsthatmakeupastandard,determinetherange of possible scale scores.
– The longer the test, the wider the range of scale scores. – The easier the test, the lower the maximum scale score.

Guide to Test Interpretation for the Grade 8 Science SBA for Parents and Students Page 4
z For any given person, the raw score for the total test is the sum of the raw scores for the standards, BUT the total scale score is not the sum, nor the average of the standard scale scores.
z There is no mathematical relationship between the average of the scale scores for the standards and the average overall scale score.
Impact of hard and easy items:
The relationship between raw scores and scale scores is designed to eliminate the effect of taking a hard test or an easy test, or the fact that the items from one standard may be easier than the items from another standard.
– Students would need fewer correct responses on a “harder” standard to achieve the same scale score they would get by having more correct responses on an “easier” standard.
OR – Answering70%oftheitemscorrectlyona“harder”standardrepresentsahigherlevelofabilitythananswering
70%oftheitemscorrectlyonan“easier”standard. z Therawscoretoscalescoreconversionlevelstheplayingfield,removingtheimpactofharderitemsoreasieritems
in a given standard.
z The total test scale score is not a simple average of the standard scale scores.
– The relationship is much too complex to be described by an average that ignores the number of items in each test andtheaveragedifficultyoftheitemsmakingupthatstandard.
Question:
Is it possible for a student to answer all of the items correctly in a standard and not get the highest possible scale score (600)?
Answer:
Yes.
z A perfect score in a standard with easier items will translate into a lower scale score than a perfect score in a standard with harder items.
– Both maximum scores may be less than the maximum score for the overall test. { Thisisduetothedistributionofitemdifficultiesandthenumberofitems. { It is easier to answer 11 of 11 items correctly in a single standard than it is to answer 64 of 64 items correctly
on the entire test. – The scale score for answering all of the items correctly on a standard will necessarily represent less
ability than answering all of the items correctly on the overall test. – Although the scale score span goes from 100 to 600, it does not mean it is possible to get the highest or
lowest scale score on every standard or even the overall test.
Copyright © 2013 by the Alaska Department of Education & Early Development. Only the State of Alaska educators and citizens may copy, download and/or print the document, located online at http://education.alaska.gov. Any other use or reproduction of this document, in whole or in part, requires written permission of Alaska Department of Education & Early Development and the publisher.