appendix 13.1: maritime risk assessment and oil spill
TRANSCRIPT

URS-EIA-REP-203876
Appendix 13.1: Maritime Risk Assessment and Oil Spill Modelling


URS-EIA-REP-203876 1
Table of Contents 1.1 Maritime Risk Assessment .................................................................................... 2
1.2 Estimation of the Probability of an Oil Spill Occurring .............................................. 2
1.3 Ranking of the Probability of an Oil Spill Occurring .................................................. 4
1.4 Estimating the Severity of the Consequences of an Oil Spill ..................................... 5 1.4.1 Area Affected by Spilled Oil ...................................................................... 5 1.4.2 Sensitivity of the Affected Environment ...................................................... 6 1.4.3 Recovery Period....................................................................................... 7
1.5 Combining Consequence Severity Rankings to Produce Overall Rankings .................. 8
1.6 Preparation of a Risk Matrix .................................................................................. 9
1.7 Screening Results and Outcomes ......................................................................... 10
1.8 Oil Spill Modelling ............................................................................................... 11

Appendix 13.1 Maritime Risk Assessment and Oil Spill Modelling
2 URS-EIA-REP-203876
1.1 Maritime Risk Assessment
The Project vessels involved in the Construction and Pre-Commissioning Phase of the Project include deep-water pipe-laying vessels, pipe-carrying vessels and support vessels. Where practicable, Project vessels deployed in the Project Area will use MDO.
Accidental spillages of oil could be a consequence of:
• An unplanned incident during a planned operational event, such as a leak of fuel oil while bunkering at sea; or
• An unplanned event or accident involving a Project vessel at sea;
Unplanned events that could occur involving Project vessels at sea include:
• Sinking;
• Collision; and
• Fire and explosions.
An oil spill is not an inevitable consequence of an unplanned event involving Project vessels at sea. The damage to an affected vessel would have to be severe for an oil spill to occur. In many circumstances, salvage actions would be undertaken on the damaged vessel and this would include removing the fuel oil to prevent oil being spilled during salvage operations.
The approach of the maritime risk assessment as detailed below has been to:
• Estimate the probability of an oil spill occurring, based on available historical information, and rank these probabilities into categories;
• Estimate the severity of the potential consequences of any oil spill that could occur and rank these severities into categories;
• Construct a risk matrix of probability and consequence severity; and
• Assess various oil spill scenarios and determine their overall risk rating.
Conclusions have then been drawn from the oil spill risk screening discussed below, with some scenarios being selected for oil spill hydrodynamic modelling.
1.2 Estimation of the Probability of an Oil Spill Occurring
Specific information about the historical occurrence of oil spills resulting from unplanned events during the construction of sub-sea natural gas pipelines is not available. Most information about oil spills relates to the oil and gas exploration and production activities or to the operations of oil tankers.
Water transport accident statistics are available from the OGP (International Association of Oil & Gas Producers) Risk Assessment Data Directory Report No. 434-10, dated 10 March 2010 (Ref 1) and the EMSA (European Maritime Safety Agency) Marine Accident Review 2010 (Ref 2).

URS-EIA-REP-203876 3
The unplanned events resulting in the total loss and serious casualty to all types of merchant ships with gross tonnages above 1001 tons taken from this reference are given in Table 1.
Table 1 Statistical Frequency of Unplanned Events Occurring to Ships
Unplanned Event
Global Probability
(All Merchant Ships > 100 GT)
Total Loss Serious Casualty
Sinking 1.4 x 10⁻³ -
In collision 3.6 x 10⁻⁴ 2.1 x 10⁻³
Fire or explosions 4.2 x 10⁻⁴ 2.5 x 10⁻³
Other 2.4 x 10⁻⁴ 1.4 x 10⁻³
TOTALS 3.0 x 10⁻³ 9.3 x 10⁻³
It should be noted that the statistical frequencies in Table 1 are derived from all types of merchant shipping on a global basis. Information about ship collisions with offshore oil and gas installations is available the OGP Risk Assessment Data Directory Report No. 434-16, dated 16 March 2010 (Ref. 1). This reference was consulted because the supply of pipe sections by vessels to the pipe-laying vessels at sea during the construction of the sub-sea pipeline has similarities to supply ship operations during oil production.
One significant omission from the above data sources, and others such as the European Marine Safety Agency (EMSA) (Ref. 2) was the frequency of oil spills resulting from vessel casualties. As noted earlier, an oil spill is far from an inevitable consequence of a ship casualty. A vessel running aground would have to suffer very severe damage for an oil spill to occur and in some circumstances, such as running aground on a soft sediment seabed an oil spill is inherently unlikely. However, the risk of an oil spill would be higher if the same vessel ran aground on jagged rocks.
The statistical frequencies of different unplanned events as described in Table 2 were used as the ‘raw’ risk inputs and the circumstances of the Project vessels were used to adjust the numerical estimated probability of:
a) An unplanned event occurring to a Project vessel; and b) An oil spill resulting from the unplanned event.
1 The Project vessels gross tonnage weight ranges from 50 tonnes to 172,000 tonnes.

Appendix 13.1 Maritime Risk Assessment and Oil Spill Modelling
4 URS-EIA-REP-203876
Likelihood of an Unplanned Event Occurring to a Project Vessel
The risk profile of Project vessels involved in the construction of the sub-sea pipeline is somewhat different to that of merchant vessels operating at sea anywhere in the world and changes depending on which phase of the construction is occurring.
The pipe-laying vessel will need to be replenished with pipeline sections at sea as the pipeline is laid. This will require the pipe supply vessels to manoeuvre close to the pipe-laying vessels to deliver the pipeline sections. Manoeuvring close together at sea increases the risk of collision, even though the vessels’ crew are competent at such activities.
An Oil Spill Resulting From an Unplanned Event
The offshore pipe-laying vessel will be a very large vessel. For instance, the Saipem 7000 carries a maximum fuel load of 8,000 m3. The class of vessel that will be used as pipe supply vessels - typically has a maximum fuel load of 1,000 to 1,500 m3. The potential for an oil spill therefore clearly exists should these Project vessels suffer serious damage.
From the limited data available, oil spills are a rare consequence of most unplanned events at sea. As noted earlier, the probability of an oil spill resulting from an unplanned event to a vessel depends on the circumstances of the event.
The numerical, statistical risk of a collision is most likely to be between a Project vessel and another Project vessel. This is because the Project vessels will be acting in concert in close proximity with each other. A collision between a pipe supply vessel and the very large offshore pipe-laying vessel would most probably result in minimal damage to the pipe-laying vessel, but the pipe supply vessel could suffer some damage. In most cases, any collision would be a low relative velocity and damage would be light.
Collision of Project vessels with third-party vessels has been considered during this evaluation. A scenario involving a fully laden oil tanker that is unrelated to the Project colliding with an offshore pipe-laying vessel could conceivably result in a large spill of crude oil. This would require a set of circumstances where the exclusion zone to be imposed around the pipeline route was violated. The likelihood of such an unplanned event occurring is considered to be too remote to require detailed consideration.
1.3 Ranking of the Probability of an Oil Spill Occurring
In order that information can be used to construct a risk matrix, the statistical probability of events have been categorised into seven categories as shown in Table 2 A ranking of 0 represents an “extremely remote” rating with a statistical frequency of less than 1 x 10⁻⁶ per year, whilst a ranking of 7 represents a “very likely” event with a statistical frequency of between 1 per year and 1 x 10⁻¹ per year.

URS-EIA-REP-203876 5
Table 2 Ranking of Statistical Frequency of Events
No. Rating Description Statistical Probability
1 Extremely remote A similar event has not occurred during any previous pipeline project, and is considered extremely remote
<1 x 10⁻⁶ per year
2 Remote A similar event has not occurred during any previous pipeline project, but is considered a possibility
1 x 10⁻⁵ - 1 x 10⁻⁶ per year
3 Very unlikely A similar event has occurred during a previous pipeline project, i.e. within the industry
1 x 10⁻⁴ - 1x10⁻⁵ per year
4 Unlikely A similar event has occurred during a previous pipeline project within the organisation
1 x 10⁻³ - 1x10⁻⁴ per year
5 Possible Potential that the event may occur during the lifetime of the project
1 x 10⁻² - 1x 10⁻³ per year
6 Probable Event likely to occur during the lifetime of the project
1 x 10⁻¹ - 1 x10⁻² per year
7 Very likely Event likely to occur several times during the lifetime of the project
1 - 1 x 10⁻¹ per year
1.4 Estimating the Severity of the Consequences of an Oil Spill
The severity of the consequences caused by an oil spill depends on many factors and cannot be related to a single parameter such as the spilled oil volume. The amount and severity of potential damage caused by the spilled oil depends on several factors, including:
• Area affected by an spilled oil;
• Sensitivity of the affected environment; and
• Time that it will take the affected area or resources to recover (e.g. recovery period).
1.4.1 Area Affected by Spilled Oil
The area affected by spilled oil is related to the oil spill volume because most spilled oils rapidly spread out to cover a large area of sea surface. A commonly-used generalisation is that oil slicks have an average oil thickness of 0.1 mm and 1 m3 of oil would rapidly spread to cover 10,000 m2 of sea if it was 0.1 mm thick. However, spilled oils do not spread uniformly and form oil layers ranging from sheens of less than 0.1 micron (0.0001 mm) thick to layers many

Appendix 13.1 Maritime Risk Assessment and Oil Spill Modelling
6 URS-EIA-REP-203876
millimetres thick, if the oil emulsifies. A 1 m3 oil spillage spreading to sheen that is only 0.1 micron thick could be spread over an area of 10 km2 of the sea surface.
For the purposes of estimating the severity of the consequences of an oil spill, the extent of area affected by an oil spill has been ranked as 4 levels of severity from 1 - “immediate area” (the least severe consequence), up to 4 - “widespread” (Table 3).
Table 3 Severity Ranking by Extent of Area Affected by Oil
Severity Rating Extent of Area Affected by Oil
4 Widespread
3 Extensive
2 Localised
1 Immediate area
The area affected by an oil spill can be expressed as that relative to the surface area of sea or the length of coastline being considered. A spill of a relatively small volume of oil in a small, semi-enclosed body of water will affect a higher proportion of the sea surface or coastline than the same amount of oil spilled in a much larger body of water, far from the shore. For example, a relatively small volume oil spill in a small, semi-enclosed body of water could be considered "widespread" if a large proportion of the water surface, whereas a very large volume oil spill in the open Black Sea may only be "extensive".
Oil is disperse in the water by the action of the wind and waves as small droplets and associates with sediment particles with which it settles out to the seabed. Some of it is biologically degraded or degraded by UV. These processes are collectively called weathering. Oil which reaches the shore will weather more slowly and will cover the substrata, becoming mixed with sediment by the action of waves. Heavier oils can form oil in water emulsions under the action of waves but diesel will not emulsify.
1.4.2 Sensitivity of the Affected Environment
The sensitivity of the affected environment or socio-economic resources therein will influence the severity of the consequences of an oil spill. Oil spills have the potential to negatively impact several ecological habitats and organisms. The effects of spilled oil include:
• Physical smothering of fauna and flora for example contamination of seabird plumage and clogging of filter feeding and respiratory organs of fauna;
• Toxic effects due to ingestion of oil with food e.g. for sediment feeding benthic fauna and by birds during preening;
• Naturally dispersed oil and some partially water-soluble fractions will disperse into the water column and could affect pelagic species such as fish and plankton although the levels of soluble residues associated with oil spills is usually low; and

URS-EIA-REP-203876 7
• Shoreline and coastal habitats and associated fauna and flora are often the most severely impacted ecological resources during oil spills.
For the purposes of estimating the severity of the consequences of an oil spill, the sensitivity of the area that could be affected has been ranked as three categories; from 1 - “Insensitive” to 3 - “Very sensitive” (Table 4).
Table 4 Severity Ranking by Sensitivity of Affected Environment
Severity rating Sensitivity of Affected Environment
3 Very sensitive
2 Sensitive
1 Insensitive
An area may be classified as "Very sensitive" by virtue of specific ecological resource or by being very shallow, enclosed waters where dispersed oil would become sedimented and cause negative effects to benthos. Shoreline sensitivity depends on shoreline type; rocky shores are high-energy environments rapidly cleaned by wave action. Mudflats are low-energy and therefore more sensitive.
1.4.3 Recovery Period
One of the indicators of the severity of consequences of an oil spill is the time that it will take the affected area or the affected organisms to recover. This depends on several different factors.
One aspect concerns the physical persistence of the oil. The effects of oil spill on organisms in the water column, if any, tend to be very short-lived. Dispersed oil, or water-soluble oil components, will be rapidly reduce to very low levels in the surrounding water column in most cases. Oil that strands on shorelines is most often much more persistent. One characteristic determining the persistence will be the shoreline type. Exposed, rocky shores will be cleaned of oil by wave action fairly rapidly, but oil will remain in low-energy shoreline environments, such as mud-flats, for a long time.Another factor is the life history and ecology of organisms affected. Species with low fecundity and specific habitat requirements, that increase vulnerability to oil, will be worse affected than more fecund species with less specific requirements.
For the purposes of estimating the severity of the consequences of an oil spill, the recovery or restoration period has been ranked as five categories, from 1 - “Days or weeks” up to 5 - “More than 5 years” (Table 5).

Appendix 13.1 Maritime Risk Assessment and Oil Spill Modelling
8 URS-EIA-REP-203876
Table 5 Severity Ranking by Recovery Period
Severity Rating Recovery or Restoration Period
5 More than 5 years
4 1 to 5 years
3 About 1 year
2 Months
1 Days or weeks
1.5 Combining Consequence Severity Rankings to Produce Overall Rankings
The severity ranking scopes for (i) extent of area affected by oil, (ii) affected area sensitivity, and (iii) affected area recovery period can be combined to produce five levels of overall event severity (Table 6).
Table 6 Overall Severity of Consequence Ranking
Overall
Severity Rating
Extent of Area Affected by Oil
Sensitivity of Affected Environment
Recovery or Restoration Period
Score
5 - Very severe Widespread (4) Very sensitive (3) More than 5 years (5) 12
Extensive (3) Very sensitive (3) More than 5 years (5) 11
Widespread (4) Sensitive (2) 1 to 5 years (4) 10
4 - Major Extensive (3) Sensitive (2) 1 to 5 years (4) 9
Localised (2) Very sensitive (3) 1 to 5 years (4) 9
Widespread (4) Insensitive (1) About 1 year (3) 8
Immediate area (1)
Very sensitive (3) 1 to 5 years (4) 8
3 - Serious Extensive (3) Insensitive (1) About 1 year (3) 7
Localised (2) Sensitive (2) About 1 year (3) 7
Continued…

URS-EIA-REP-203876 9
Overall
Severity Rating
Extent of Area Affected by Oil
Sensitivity of Affected Environment
Recovery or Restoration Period
Score
2 - Moderate Localised (2) Insensitive (1) Months (2) 5
Immediate area (1)
Sensitive (2) Months (2) 5
1 - Minor Immediate area (1)
Insensitive (1) Days or weeks (1) 3
Complete.
The combination of consequences leads to a combined severity score of:
• 10 or greater classified as “Very severe” and given an overall severity rating of 5;
• 8 or 9 were classified as “Major” and given an overall severity rating of 4;
• 6 or 7 were classified as “Serious” and given an overall severity rating of 3;
• 4 or 5 were classified as “Moderate” and given an overall severity rating of 2; and
• 1 to 3 were classified as “Minor” and given an overall severity rating of 1.
1.6 Preparation of a Risk Matrix
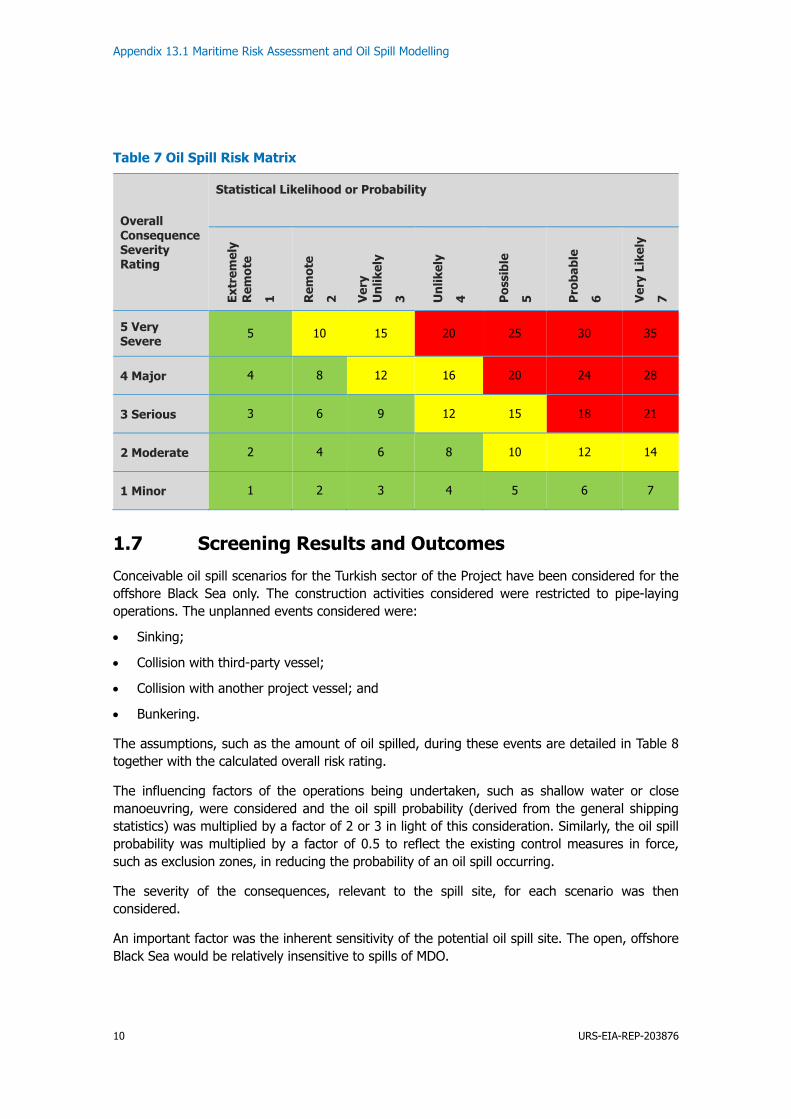
A risk matrix consisting of the statistical likelihood (or probability) versus the overall consequence severity ranking was then prepared as shown in Table 7.
The level of acceptability of the defined risk is calculated by multiplying the overall consequence severity ranking by the statistical probability ranking. The results were then colour coded as follows:
• Risk result of 1 to 9: acceptable (coloured green in matrix);
• Risk result of 10 to 16: undesirable (coloured yellow in matrix); and
• Risk result of 18 and above: unacceptable (coloured red in matrix).
Appendix 13.1 Maritime Risk Assessment and Oil Spill Modelling
10 URS-EIA-REP-203876
Table 7 Oil Spill Risk Matrix
Overall Consequence Severity Rating
Statistical Likelihood or Probability
Ex
trem
ely
Rem
ote
1 Rem
ote
2 Ver
y U
nlik
ely
3 Unl
ikel
y
4 Pos
sibl
e
5 Pro
babl
e
6 Ver
y Li
kely
7
5 Very Severe
5 10 15 20 25 30 35
4 Major 4 8 12 16 20 24 28
3 Serious 3 6 9 12 15 18 21
2 Moderate 2 4 6 8 10 12 14
1 Minor 1 2 3 4 5 6 7
1.7 Screening Results and Outcomes
Conceivable oil spill scenarios for the Turkish sector of the Project have been considered for the offshore Black Sea only. The construction activities considered were restricted to pipe-laying operations. The unplanned events considered were:
• Sinking;
• Collision with third-party vessel;
• Collision with another project vessel; and
• Bunkering.
The assumptions, such as the amount of oil spilled, during these events are detailed in Table 8 together with the calculated overall risk rating.
The influencing factors of the operations being undertaken, such as shallow water or close manoeuvring, were considered and the oil spill probability (derived from the general shipping statistics) was multiplied by a factor of 2 or 3 in light of this consideration. Similarly, the oil spill probability was multiplied by a factor of 0.5 to reflect the existing control measures in force, such as exclusion zones, in reducing the probability of an oil spill occurring.
The severity of the consequences, relevant to the spill site, for each scenario was then considered.
An important factor was the inherent sensitivity of the potential oil spill site. The open, offshore Black Sea would be relatively insensitive to spills of MDO.

URS-EIA-REP-203876 11
Table 8 indicates that the construction of the sub-sea natural gas pipelines across the Black Sea does not present a major risk of oil spills.
Table 8 Event Description and Assumptions and Overall Event Risk Rating
Event Description
Assumption Overall Frequency of Spill Arising
Consequence / Severity Overall Risk Rating
Grounding Not possible. - - -
Collision with third party
MDO spillage of 2,000 m3 (loss of fuel over six hours).
Extremely Remote 1.25x10⁻⁶
Extent = Extensive (3) Sensitivity=Insensitive (1) Recovery = Days/weeks (1) = MODERATE
2
Collision with project vessel
MDO spillage of 750 m3 (loss of fuel over six hours).
Remote 8.4x10⁻⁶
Extent = Extensive (3) Sensitivity=Insensitive (1) Recovery = Days/weeks (1) = MODERATE
4
Bunkering MDO spillage of 10 m3.
Possible 1x10⁻²
Extent = Immediate area (1) Sensitivity=Insensitive (1) Recovery = Days/weeks (1) = MINOR
5
Sinking MDO spillage of 2,000 m3 (loss of fuel over six hours).
Unlikely 1.5x10⁻⁴
Extent = Extensive (3) Sensitivity= Insensitive (1) Recovery = Days/weeks (1) = MODERATE
8
1.8 Oil Spill Modelling
Oil spill modelling has been undertaken (Ref. 3) which provides details of the modelling techniques employed, including input data, modelling parameters and modelling scenarios and associated results.
The oil spill modelling was undertaken using the Oil Spill Contingency and Response (OSCAR) model as developed by SINTEF in Norway. OSCAR consists of a dispersion model based on wind and 3D current data and a component-specific fate model whereby the physical-chemical, toxicity and biodegradation properties of the components of a discharge are modelled. Spill scenarios were stochastically analysed with time series weather and current data, demonstrating how the behaviour of the hydrocarbons change in variable metocean conditions. Stochastic outputs examined shoreline, surface and water column statistics. For the worst case stochastic simulation in terms of hydrocarbons reaching the shore, a deterministic model run was carried out to predict the behaviour and fate of the spill over time in terms of surface sheen development, water column concentrations and oil reaching the shore.

Appendix 13.1 Maritime Risk Assessment and Oil Spill Modelling
12 URS-EIA-REP-203876
An oil spill along the offshore section of the pipeline route could conceivably occur at any location. The most likely reason for such a spill is as a result of the collision of a Project vessel with another Project vessel, although the probability of such a collision occurring is considered to be remote. The probability that such an incident would result in an oil spill is even lower, as a high-energy collision would be required to damage a vessel to such an extent that marine diesel was spilled into the sea. Despite the inherently low probability of an offshore oil spill occurring, modelling was conducted to estimate the area of sea surface that might be affected and the time for which oil would persist on the sea surface.
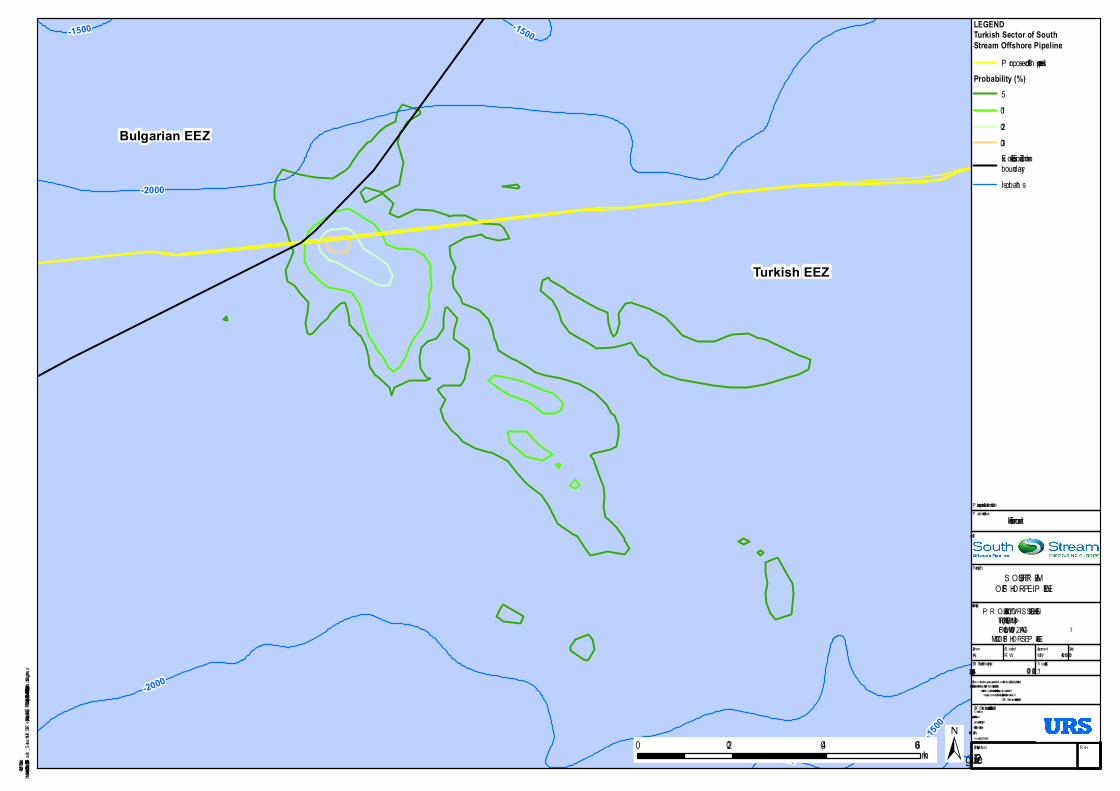
Four locations for oil spill modelling were selected along the pipeline route within the Turkish EEZ as shown on Figure 1 (Locations 1a, 1b, 2 and 3). Oil spill modelling was undertaken for a spill of 2,000 m3 of MDO at each release location.
Modelling Oil Spillage Near the Turkish EEZ Border with Bulgaria (Offshore 1a)
The model outputs are illustrated in Figure 2. It is predicted a localised area of the Black Sea would be affected with a surface slick of thicknesses > 1 μm visible for up to 128 km from the release location. There is a 11% probability of visible surface hydrocarbons reaching Bulgarian waters. Hydrocarbons may enter the Bulgarian EEZ within 6 hours. Dissolved water column concentrations of greater than 50 ppb are predicted a maximum of 100 km away from the release site and therefore are not expected to reach the Turkish coast. Concentrations will take up to 1.5 days to fall below this threshold in localised areas (oil is not expected to have acute toxic effects at water column concentrations less than 50 ppb (Ref. 3)).
For the worst scenarios of oil reaching the shoreline, deterministic modelling was undertaken to predict the mass balance fate of the oil as it disperses over time, typical development and appearance of the surface slick. The modelling has predicted that oil might beach after 5 days across a wide area of coastline but that the oil would arrive in a highly weathered and dispersed state, and would not be visible in the water column.
Modelling Oil Spillage North West Turkish EEZ (Offshore 1b)
The model outputs are illustrated in Figure 3. It is predicted a moderate area of the Black Sea would be affected with a surface slick of thicknesses > 1 μm visible for up to 128 km from the release location. Dissolved water column concentrations of greater than 50 ppb are predicted a maximum of 105 km away from the release site and therefore are not expected to reach the Turkish coast. Concentrations will take up to 2 days to fall below this threshold in localised areas.
It is stressed that the coloured areas in the modelling figures as included herein do not represent the area of an oil slick that might result following a spillage, but indicate the probability of occurrence of a visible oil sheen (thicknesses >1 μm) at any location as based on 30 stochastic model runs to represent the variability of one year of met-ocean data.
For the worst scenarios of oil reaching the shoreline, deterministic modelling was undertaken to predict the mass balance fate of the oil as it disperses over time, typical development and appearance of the surface slick. The modelling has predicted that oil might beach after 5 days across a wide area of coastline, but that the oil would arrive in a highly weathered and dispersed state, and would not be visible in the water column.

URS-EIA-REP-203876 13
Modelling Oil Spillage North Turkish EEZ close to the Ukrainian EEZ border (Offshore 2)
The model outputs are illustrated in Figure 4. It is predicted a moderate area of the Black Sea would be affected with a surface slick of thicknesses > 1 μm visible for up to 115 km from the release location. There is a 20% probability of visible surface hydrocarbons reaching Ukrainian waters. Hydrocarbons may enter international waters within 5 hours. Dissolved water column concentrations of greater than 50 ppb are predicted a maximum of 100 km away from the release site and therefore are not expected to reach the Turkish coast. Concentrations will take up to 1.5 days to fall below this threshold in localised areas.
For the worst scenarios of oil reaching the shoreline, deterministic modelling was undertaken to predict the mass balance fate of the oil as it disperses over time, typical development and appearance of the surface slick. The modelling has predicted that oil might beach after 5 days across a wide area of coastline, but that the oil would arrive in a highly weathered and dispersed state, and would not be visible in the water column.
Modelling Oil Spillage North Turkish EEZ close to the Ukrainian and Russian EEZ borders (Offshore 3)
The model outputs are illustrated in Figure 5. It is predicted a moderate area of the Black Sea would be affected with a surface slick of thicknesses > 1 μm visible for up to 96 km from the release location. There is a 33% probability of visible surface hydrocarbons reaching Russian waters and a 10% chance in Ukrainian waters. Hydrocarbons may enter international waters within 1 hour. Dissolved water column concentrations of greater than 50 ppb are predicted a maximum of 68 km away from the release site, and therefore are not expected to reach the Turkish coast. Concentrations will take up to 1.5 days to fall below this threshold in localised areas.
For the worst scenarios of oil reaching the shoreline, deterministic modelling was undertaken to predict the mass balance fate of the oil as it disperses over time, typical development and appearance of the surface slick. The modelling has predicted that oil might beach after 3 days across a wide area of coastline but that the oil would arrive in a highly weathered and dispersed state, and would not be visible in the water column.

RussianEEZ
Ukrainian EEZ
Romanian EEZ
Turkish EEZ
Bulgarian EEZ
Turkey
Offshore 1a
Offshore 1b Offshore 2
Offshore 3
-50 -50
-20-20 -20
-500
-100
-20
-200
-20
-20
-50
-200
-50
-200
-100
-50
-100
-100 -50-500
-200
-500
-100
-1500-1000 -10
00
-200
-1500
-2000
-2000
-500
-1500 -1000
Purpose of Issue
Project Title
Drawing Title
Drawn Checked
OIL SPILL MODELLINGRELEASE LOCATIONS
SOUTH STREAMOFFSHORE PIPELINE
Scot t HouseAlencon Link, BasingstokeHampshire, RG21 7PPTelephone (01256) 310200Fax (01256) 310201www.ursgloba l. com
URS Infrastructure & Environment UK Limited
DateApproved
RevDrawing Number
This document has been prepared in accordance with the scope of URS' appointment withits c lient and is subject to the terms of that appointment. URS accepts no liability for any
use of this document other than by its client and only for the purposes for whichit was prepared and prov ided. Only written dimensions shall be used.
© URS Infrastructure & Environment UK Limited
URS Internal Project No. Scale @ A4DH RW MW 12/06/2014
CheckDate SuffixCheck
By
For InformationClient
LEGEND
Revision Details
Plot D
ate: 0
3 Jun
2014
File Na
me:I:\5
004 - I
nform
ation S
ystem
s\4636
9082_
South
_Stre
am\MX
Ds\Re
port M
aps -
Turke
y\Tuke
y ESIA
\Chap
ter 13
\Figure
13.1.1
Oil S
pill Mo
delling
Relea
se Loc
ations.
mxd
1:2,200,000
Projection: Lambert Conformal Conic
46369082
0 50 100 150km Figure 1
Oil spill modelling locationsIsobathsExclusive Economic Zoneboundary
Turkish Sector of SouthStream Offshore Pipeline
Proposed offshore pipelines
Bulgarian EEZ
Turkish EEZ
-2000
-1500
-1500
-1500
-2000
-1500
P urpose of Issue
P roject Title
Drawing Title
Drawn Ch ecked
P R OBABILITY OF V IS IBLE S HEEN(THICKNES S > 1 ΜM)
FO LLOW ING A 2,000 M3MDO OFFS HOR E S P ILLAGE
S O UTH S TR EAMOFFS HO R E P IP ELINE
S cott HouseAlençon Link, BasingstokeHampsh ire, R G21 7P PTeleph one (01256) 310200Fax (01256) 310201www.ursglobal.com
UR S Infrastructure & Environment UK Limited
DateApproved
R evDrawing Number
Th is document h as been prepared in accordance with th e scope of UR S ' appointment withits client and is subject to th e terms of th at appointment. UR S accepts no liability for any
use of th is document oth er th an by its client and only for th e purposes for wh ichit was prepared and provided. O nly written dimensions sh all be used.
© UR S Infrastructure & Environment UK Limited
UR S Internal P roject No. S cale @ A4AH R W MW 03/06/2014
For InformationClient
LEGENDPlo
t Date
: 03 Ju
n 2014
File Na
me:I:\5
004 - I
nforma
tion Sy
stems
\46369
082_S
outh_S
tream\M
XDs\R
eport M
aps - T
urkey\
Tukey
ESIA\
Chapt
er 13\F
igure
13.1.2
Proba
bility o
f Visib
le Shee
n thick
ness 1
um Fo
llowing
a 2000
m3 MD
O Offsh
ore Sp
illage.
mxd
1:800,000
P rojection: Lambert Conformal Conic
46369082
0 20 40 60km Figure 2
Turkish Sector of SouthStream Offshore Pipeline
P roposed offsh ore pipelinesProbability (%)
5102030Ex clusive Economic ZoneboundaryIsobath s

Turkey
Turkish EEZ
Bulgarian EEZ
-2000-1500
-1000
-50-20
-500
-100
-2000
P urpose of Issue
P roject Title
Drawing Title
Drawn Ch ecked
P R OBABILITY OF V IS IBLE S HEEN(THICKNES S > 1 ΜM)
FO LLOW ING A 2,000 M3MDO OFFS HO R E S P ILLAGE
S O UTH S TR EAMOFFS HOR E P IP ELINE
S cott HouseAlençon Link, BasingstokeHampsh ire, R G21 7P PTeleph one (01256) 310200Fax (01256) 310201www.ursglobal.com
UR S Infrastructure & Environment UK Limited
DateApproved
R evDrawing Number
Th is document h as been prepared in accordance with th e scope of UR S ' appointment withits client and is subject to th e terms of th at appointment. UR S accepts no liability for any
use of th is document oth er th an by its client and only for th e purposes for wh ichit was prepared and provided. O nly written dimensions sh all be used.
© UR S Infrastructure & Environment UK Limited
UR S Internal P roject No. S cale @ A4AH R W MW 03/06/2014
For InformationClient
LEGENDPlo
t Date
: 03 Ju
n 2014
File Na
me:I:\5
004 - In
forma
tion Sy
stems
\46369
082_S
outh_S
tream
\MXDs
\Repor
t Maps
- Turk
ey\Tu
key ES
IA\Ch
apter
13\Fig
ure 13
.1.3 Pr
obabili
ty of V
isible S
heen th
icknes
s 1 um
Follow
ing a 2
000 m3
MDO O
ffshore
Spilla
ge.mx
d
1:800,000
P rojection: Lambert Conformal Conic
46369082
0 20 40 60km Figure 3
Turkish Sector of SouthStream Offshore Pipeline
P roposed offsh ore pipelinesProbability (%)
510203040Ex clusive Economic ZoneboundaryIsobath s

Turkish EEZ
Ukrainian EEZ
-2000-1500-1000 -2000 -20
00
P urpose of Issue
P roject Title
Drawing Title
Drawn Ch ecked
P R OBABILITY O F V IS IBLE S HEEN(THICKNES S > 1 ΜM)
FO LLO W ING A 2,000 M3MDO O FFS HO R E S P ILLAGE
S O UTH S TR EAMOFFS HO R E P IP ELINE
S cott HouseAlençon Link, BasingstokeHampsh ire, R G21 7P PTeleph one (01256) 310200Fax (01256) 310201www.ursglobal.com
UR S Infrastructure & Environment UK Limited
DateApproved
R evDrawing Number
Th is document h as been prepared in accordance with th e scope of UR S ' appointment withits client and is subject to th e terms of th at appointment. UR S accepts no liability for any
use of th is document oth er th an by its client and only for th e purposes for wh ichit was prepared and provided. O nly written dimensions sh all be used.
© UR S Infrastructure & Environment UK Limited
UR S Internal P roject No. S cale @ A4AH R W MW 03/06/2014
For InformationClient
LEGENDPlo
t Date
: 03 Ju
n 201
4File
Name
:I:\5004
- Info
rmatio
n Syst
ems\4
636908
2_Sout
h_Stre
am\MX
Ds\Re
port M
aps - T
urkey\
Tukey
ESIA\
Chapt
er 13\
Figure
13.1.4
Proba
bility o
f Visib
le Shee
n thick
ness 1
um Fo
llowing
a 2000
m3 MD
O Offsh
ore Sp
illage.
mxd
1:800,000
P rojection: Lambert Conformal Conic
46369082
0 20 40 60km Figure 4
Turkish Sector of SouthStream Offshore Pipeline
P roposed offsh ore pipelinesProbability (%)
5102030Ex clusive Economic ZoneboundaryIsobath s

Turkish EEZ
Ukrainian EEZRussian EEZ
-2000
P urpose of Issue
P roject Title
Drawing Title
Drawn Ch ecked
P R OBABILITY OF V IS IBLE S HEEN(THICKNES S > 1 ΜM)
FO LLOW ING A 2,000 M3MDO OFFS HOR E S P ILLAGE
S O UTH S TR EAMOFFS HO R E P IP ELINE
S cott HouseAlençon Link, BasingstokeHampsh ire, R G21 7P PTeleph one (01256) 310200Fax (01256) 310201www.ursglobal.com
UR S Infrastructure & Environment UK Limited
DateApproved
R evDrawing Number
Th is document h as been prepared in accordance with th e scope of UR S ' appointment withits client and is subject to th e terms of th at appointment. UR S accepts no liability for any
use of th is document oth er th an by its client and only for th e purposes for wh ichit was prepared and provided. O nly written dimensions sh all be used.
© UR S Infrastructure & Environment UK Limited
UR S Internal P roject No. S cale @ A4AH R W MW 03/06/2014
For InformationClient
LEGENDPlo
t Date
: 03 Ju
n 2014
File Na
me:I:\5
004 - I
nforma
tion Sy
stems
\46369
082_S
outh_S
tream\M
XDs\R
eport M
aps - T
urkey\
Tukey
ESIA\
Chapt
er 13\F
igure
13.1.5
Proba
bility o
f Visib
le Shee
n thick
ness 1
um Fo
llowing
a 2000
m3 MD
O Offsh
ore Sp
illage.
mxd
1:736,702
P rojection: Lambert Conformal Conic
46369082
0 20 40 60km Figure 5
Turkish Sector of SouthStream Offshore Pipeline
P roposed offsh ore pipelinesProbability (%)
5102030Ex clusive Economic ZoneboundaryIsobath s

URS-EIA-REP-203876 19
References
Number Reference
Ref. 1 OGP (International Association of Oil & Gas Producers) Risk Assessment Data Directory Report No. 434-10, dated 10 March 2010.
Ref. 2 EMSA (European Maritime Safety Agency) Marine Accident Review 2010.
Ref. 3 Black Sea Diesel and Fuel Release Modelling: South Stream Development. Genesis: Technical Note August 2013.
