appendix 2: forage fishes in the gulf of alaska (pdf, 1.16 mb) · appendix 2: forage fishes in the...
TRANSCRIPT
Appendix 2: Forage Fishes in the Gulf of Alaska Olav A. Ormseth, Liz Conners, Mike Guttormsen, and Johanna Vollenweider
Alaska Fisheries Science Center
Executive summary
The forage fish category in the Gulf of Alaska (GOA) fishery management plan (FMP) contains over fifty species with diverse characteristics. These species have been identified as having ecological importance as prey, and directed fishing is prohibited for the group. Retention of forage fishes in commercial catches is limited to 2% of the target species weight. Because forage fishes are outside of the specification process and stock assessments are not performed, this report departs from the usual SAFE format. After a general introduction, we present background information as well as abundance, distribution, and catch data for each taxonomic group separately. Some tables and figures contain data for more than one group. Common research priorities and references sections are at the end of the report. Major changes
1) The format of the report has been fundamentally changed, with new information added for each taxonomic group.
2) The section on eulachon has been greatly expanded and includes spatial analyses of eulachon distribution and catch.
3) The small-mesh survey data for capelin and eulachon have been expanded to include all sampled areas.
Introduction
The “forage fish” category in the Gulf of Alaska (GOA) fishery management plan (FMP) contains over fifty species from eight families and one order, ranging from smelts to euphasiids (Table 1). While there are some important prey species not included in the group (for example, juvenile stages of some groundfish species have key forage roles), it does contain most of the species that have primary ecosystem roles as prey. Because catch limits are not specified for the forage fish category, this document is not a formal assessment and departs from the usual stock assessment and fishery evaluation (SAFE) format. After a discussion of issues common to all GOA forage fish species (management approaches, data sources, etc.), information for each taxonomic group is presented separately. For each group, we present background information as well as data regarding current stock status, distribution, and incidental fishery catch. Some species (e.g. capelin and eulachon) have been studied extensively in the GOA. It is not the goal of this document to provide an exhaustive review of forage fish biology, but rather to summarize information of use in forage fish management. Forage fishes are a critical part of all marine ecosystems, providing food for larger fishes, seabirds and marine mammals (Wespestad 1987, Yang and Nelson 2000, Palsson 1997, Carscadden and Vilhjalmsson 2002, Baillie and Jones 2003). The growing interest in ecosystem-based approaches to fisheries management has increased the awareness of the key role of forage species and the often sizable gaps in data for these species (Bogstad and Gjosaeter 2001, Ushakov and Prozorkevich 2002, Yndestad and Stene 2002, Matthiasson 2003). As is the case in other boreal ecosystems, the Bering Sea and GOA contain a small number of dominant species with strong predator-prey interactions (Livingston and Tjelmeland 2000). In these systems, populations of forage species may undergo large changes due to climate shifts, fishing, and shifts in

abundance of other prey and predator species (Anderson et al 1997, Dolgov 2002). These shifts in forage species may, in turn, strongly affect the abundance of predators (Rose and O’Driscoll 2002, Davoren and Montvecci 2003, Sinclair et al. 1994). In the GOA, forage fishes are important components of the diets of groundfishes and squids, toothed and baleen whales, pinnipeds, and seabirds (Table 2 and Figure 1). Fluctuations in the availability of forage fishes in the GOA have been suggested as contributing to the decline of seabirds and sea lions (Kuletz et al. 1997, Rosen and Trites 2000, Trites and Donnelly 2003). The smelt species eulachon (Thaleichthys pacificus) and capelin (Mallotus villosus), as well as Pacific sand lance (Ammodytes hexapterus; family Ammodytidae), have the highest biomass of the various forage fish species and have especially important roles in the GOA ecosystem. Therefore, much of the information in this report focuses on these species. Forage fish management in the GOA Prior to 1998, forage fishes in the GOA were managed either as part of the Other Species group (nontarget species caught incidentally in commercial fisheries) or were classified as “nonspecified” in the FMP. In 1998 amendments 36 and 39 to the Bering Sea and Aleutian Islands (BSAI) and GOA FMPs, respectively, created a separate forage fish category. In federal waters, management of this group is governed by section 50 CFR 679b20.doc of the federal code: 50 CFR 679b20.doc § 679.20 General limitations (i) Forage fish (1) Definition. See Table 2c to this part. (2) Applicability. The provisions of § 679.20 (i) apply to all vessels fishing for groundfish in the BSAI or GOA, and to all vessels processing groundfish harvested in the BSAI or GOA. (3) Closure to directed fishing. Directed fishing for forage fish is prohibited at all times in the BSAI and GOA. (4) Limits on sale, barter, trade, and processing. The sale, barter, trade, or processing of forage fish is prohibited, except as provided in paragraph (i)(5) of this section. (5) Allowable fishmeal production. Retained catch of forage fish not exceeding the maximum retainable bycatch amount may be processed into fishmeal for sale, barter, or trade. In sum, directed fishing for species in the forage fish category is prohibited, catches are limited by a maximum retention allowance (MRA) of 2% by weight of the retained target species (Table 10 to 50 CFR part 679), and processing of forage fishes is limited to fishmeal production. The regulation applies only to vessels fishing in federal waters, so onshore processors are not affected by the rule. While the basis for a 2% MRA is not entirely clear, it appears this percentage was chosen to accommodate existing levels of catch that were believed to be sustainable (Federal Register, 1998, vol. 63(51), pages 13009-13012). The intent of amendments 36 and 39 was thus to prevent an increase in forage fish removals, not to reduce existing levels of catch. In 1999, the state of Alaska adopted a statute with the same taxonomic groups and limitations (5 AAC 39.212 of the Alaska administrative code), except that no regulations were passed regarding the processing of forage fishes. This exception has caused some confusion regarding the onshore processing of forage fishes for human consumption (J. Bonney, pers. comm.). Further discussion of the efficacy of the MRA approach is in the section on eulachon.

Sources of information Surveys Since 1984, the Alaska Fisheries Science Center (AFSC) has conducted a biennial (triennial prior to 1999) bottom trawl survey of the GOA for the purposes of groundfish stock assessment. The survey employs a bottom trawl with roller gear and a 5-inch mesh size, and covers areas of the continental shelf and upper slope from depths of 30 m to approximately 500 m. The large mesh size of the gear and the limitation to demersal habitats likely result in poor sampling of forage fishes, which are small and most often pelagic. In addition, species with primarily nearshore habitats may be poorly represented and forage fishes are often characterized by patchy distribution. Although some members of the forage fish category are caught in the groundfish survey, other forage fish species are rarely, if ever, encountered. Therefore, biomass estimates from the bottom trawl survey are not considered reliable measures of forage fish abundance. However, the bottom trawl survey provides an extended time series over which gear and methodology have remained consistent, and may provide minimum biomass estimates and some indication of temporal fluctuations and trends in species at least partially vulnerable to the survey gear (Table 3). The AFSC also performs echo integration-trawl (EIT) surveys directed towards assessment of walleye pollock (Theragra chalcogramma). These surveys focus on the Shelikof Strait area west of Kodiak during the winter, but have occasionally covered a greater area. Summer EIT surveys in the GOA have also occurred in some years. Midwater echosign is sampled by trawling to identify species composition and provide biological information. Capelin backscatter is readily identified and some efforts have been made to estimate capelin biomass from EIT surveys. Eulachon are harder to identify as they do not possess swim bladders, which enhance the reflection of acoustic signals. Recent information of eulachon may enable biomass estimation in the future (J. Horne, AFSC, pers. comm.). In this document, we mainly present data from the sampling tows performed during EIT surveys. Although sampling tows conducted by the EIT surveys are not intended to be quantitative, because the tows target pollock echosign they may be considered random samples with respect to eulachon and capelin. Recent gear studies also suggest that EIT sampling tows substantially undersample eulachon due to escapement through large meshes before reaching the codend (K. Williams, AFSC, pers. comm.). Because gear types have varied over the years, EIT forage fish catches are presented as a percentage by weight of the combined pollock, eulachon, and capelin catch in each tow. For recent years, when the sampling gear has consistently been Aleutian wing trawls (with some minor variation in accessory gear), catch per unit effort (CPUE) is presented for eulachon as kg/hr. For capelin, we also include estimates of capelin biomass based on backscatter observed during summer surveys in 2003 and 2005. A third source of forage fish data in the GOA are small-mesh surveys (32 mm stretched mesh) conducted by NMFS and the Alaska Department of Fish & Game (ADF&G) at seven sites in the central and western GOA (Fig. 2). The purpose of these surveys is to sample shrimp populations, but the small mesh net has proven to be effective at capturing smelt and other forage species when they are present. Pavlof Bay is sampled every year there is a survey, but the other sites are sampled on an alternate-year basis. This is an important survey for monitoring the abundance of forage fishes and juvenile groundfishes, and we strongly recommend that funding be continued for this survey. As is the case for the AFSC bottom trawl survey, the small-mesh survey samples only demersal habitats. Data (CPUE) are presented for eulachon and capelin. Ecosystem models The AFSC has an extensive ecosystem modeling program that uses diet data and other information to construct mass balanced food web models for regional Alaska ecosystems (see Aydin et al. 2007 for more information). These models use a top down approach wherein biomass estimates of species at lower trophic levels are determined by estimating the amount of forage required to sustain higher trophic levels.
The model currently estimates gulfwide biomass for eulachon, capelin, sandlance, Bathylagidae, Myctophidae, and a group containing the remainder of the species in the forage fish category. The model is based primarily on diet data collected during 1990-1994. This type of model provides an alternative estimate of forage fish abundance in the GOA ecosystem, including those species which are not represented in either fishery or survey data. However, these estimates do have some limitations. Modelers have to make a number of assumptions regarding production rates, trophic efficiency, and other parameters that affect the relationships between predators and prey. In addition, diet and abundance data used in the model are outdated and may not reflect current conditions. For example, the Northern fur seal diet input data were derived from values found in the literature from the 1970s, when capelin were thought to be more abundant. Individual research projects A variety of research has been conducted on forage fishes and their ecological interactions. Capelin have received particular attention in recent years from the AFSC and other institutions. Some of these data are presented here and references are included to extensive reviews of forage fish biology. Catch data Forage fishes are caught incidentally in GOA groundfish fisheries, primarily in pelagic pollock trawls. Data regarding these catches are available from fisheries observers working with the AFSC’s Fisheries Monitoring and Analysis (FMA) program and from the NMFS Alaska regional office (AKRO) Catch Accounting System (CAS). Observer data in the GOA are limited because most fishing vessels are sufficiently small to require only limited observer coverage (vessels between 60 and 125 ft.) or no coverage at all (vessels smaller than 60 ft.). In addition, until 2005 forage fish species were identified only to family level. The observer manual now specifies identification of capelin, eulachon, surf smelt, and other smelt, but it is likely that at least some fishes still identified as “other smelt” are either eulachon or capelin. We also include data regarding state-waters catches of eulachon, which are an important subsistence and personal use resource for Alaska Natives and other groups.
Family Osmeridae (smelts)
Smelts are slender schooling fishes found throughout the world. Smelts may be marine, anadromous, or freshwater, and are key forage species in many of the world’s ecosystems (Brodeur et al 1999, Livingston and Tjelmeland 2000). The two dominant smelt species in the GOA are capelin and eulachon. These two species represent the majority of the survey biomass and incidental catch in the forage fish assemblage. Other members of the Osmerid family in the GOA are generally not identified to species and make up only a small fraction of incidental catch. Eulachon Background information Eulachon are slender, silver fishes that are slightly larger than many other forage fish species (max. length 34 cm). They are anadromous, spawning during the spring and summer in freshwater rivers throughout the GOA and eastern Bering Sea (Willson et al. 2006; Figure 3). Run timing may depend on water temperature. In Alaska eulachon typically spawn in mainland glacial rivers with high discharge, although they are also found in clear waters (Hay and McCarter 2000). Aging of eulachon is difficult but most individuals appear to spawn at age 3 or 4, and most die after spawning. However ages up to 9 years have been recorded, and a few individuals may spawn repeatedly (Willson et al. 2006). The oceanic distribution and ecology of eulachons is not well known, but it appears that larvae are rapidly transported

to marine or estuarine waters after spawning (Hay and McCarter 2000). Juveniles may quickly move to offshore waters. Data regarding adult eulachon distribution are presented below. Eulachon have an unusually high lipid content, which may make them especially attractive to predators. Total lipid of eulachon in Alaska ranges from 17-21% (Payne et al. 1999), and the lipid contains a large proportion of monounsaturated fatty acids, particularly oleic acid (Iverson et al. 2002). Marine mammals appear to prefer eulachon as prey. In southeast (SE) Alaska, the presence of Steller sea lions (Eumetopias jubatus) at haulouts was related to the distance to eulachon aggregations and the abundance of eulachon within 20 km (Womble et al. 2005). Scientists with ADF&G often use aggregations of eagles and marine mammals as indicators of eulachon returns to spawning sites in SE Alaska (S. Moffitt, ADF&G, pers. comm.). High lipid content has also made eulachon a valuable resource to humans. Historically, eulachon have been used by Alaska Natives and Canadian First Nations as a source of lighting oil and, more importantly, nutrition. Eulachon are sometimes called candlefish, so named because a dried eulachon can be lit similarly to a candle. Known as “grease”, eulachon oil was an important diet staple and commodity. Trade routes from the coast to interior Alaska and British Columbia were known as “grease trails”. Eulachon are still a prized resource, with subsistence and personal use fisheries in SE and southcentral Alaska as well as British Columbia and Washington state. In March 2008, NMFS accepted a petition from the Cowlitz tribe in Washington state to list eulachon in Washington, Oregon, and California as either threatened or endangered under the Endangered Species Act (Federal Register, 2008, vol. 73(49) pages 13185-13189). The main bases for this petition are declining catches in the Columbia River basin, the general decline in the size of eulachon spawning runs in the northwest U.S. and British Columbia since the early 1990s, and the probability of distinct population segments within eulachon populations along the west coast of North America (the original petition can be found at www.nwr.noaa.gov/Other-Marine-Species/upload/Smelt_Petition_11_07.pdf). NMFS is conducting a status review and is planning to make decision in November 2008. A previous petition filed in 1999 by a separate individual was rejected due to lack of scientific basis. Abundance Estimates of eulachon biomass from GOA bottom trawl surveys have increased during 1984-2007 (Table 3 and Fig. 4), with a particularly large estimate in 2003 of 113,482 t. Similar trends exist in the EIT survey data: the percentage of eulachon in sampling tows fluctuated during the 1990s but has risen dramatically since 2000 (Table 4 and Fig. 5). During this period the pollock biomass estimate declined slightly, which would increase the eulachon percentage, but the decline appears too small to account for the increase in percent of eulachon. Mean eulachon CPUE (kg/hr) in pollock sampling tows was low during the early 2000s but increased in 2007 and 2008 (Table 4 and Fig. 6). In the small-mesh survey, CPUE of eulachon increased during the early 2000s but has been low since 2005 (Table 5 and Fig. 7). Overall, these data point to an increase in eulachon abundance in Alaska during the last decade. This increase has occurred despite the apparent decline in the abundance of spawning eulachon in rivers to the south (SE Alaska, British Columbia, and Washington). Biomass estimates from the bottom trawl survey (51,796 t in 2007) are small relative to the food-web-model estimate of 335,636 t (Table 6). In the future, we hope to generate alternative biomass estimates from the EIT survey data by reanalyzing echosign data and/or using an index relative to pollock biomass. Analysis of spawning eulachon provides additional biomass estimates on a local scale. Biomass estimates of the Copper River run in 2001, based on larval abundance, were between 2,637 t and 8,108 t depending on assumptions regarding levels of river discharge (Moffitt et al. 2002). This resulted in an estimated range of directed commercial fishery exploitation rates of 0.87-2.99%. In Berners Bay in southeast

Alaska, peak abundance during the 2002 spawning run was 139 t although it is unclear how this corresponded to total biomass for that run. Eulachon run strength also appears to fluctuate dramatically among years. The return of spawning eulachon in the Unuk River in southeast Alaska has been extremely low since 2004 and runs in British Columbia rivers have also been weak in recent years. These declines have yet to be explained, but in British Columbia three possible causes have been identified: offshore fishery bycatch, excessive directed fishing, and freshwater habitat destruction. Distribution We investigated eulachon distribution in the central and western GOA using data from EIT sample tows. These surveys are conducted primarily during the winter, so our ability to look at seasonal changes was limited. However in 2003 and 2005, summer surveys were conducted and there was substantial overlap between the winter and summer sampling areas. A comparison of eulachon CPUE (kg/min) during 2005 surveys suggested that few eulachon are present in offshore waters around Kodiak during the summer (Fig. 8). Eulachon CPUE during the winter is much higher, and most eulachon occur in Shelikof Strait. A similar pattern was observed in 2003 (data not shown). A spatial analysis of all sampling tows conducted in the Kodiak area since 1981 confirms the increase in eulachon abundance and suggests that eulachon distribution has changed over the years. These results should be interpreted with caution as sampling effort has increased over time. During the 1980s, the percentage of eulachon in the catch was low and occurred throughout the upper part of the Shelikof trough (Fig. 9). In the 1990s, the percentage of eulachon increased and substantial amounts of eulachon were caught in the lower part of the trough (Fig. 10). The highest catch rates of eulachon were observed during the 2000s, and eulachon abundance appeared to be centered in the upper parts of the trough within Shelikof Strait (Fig. 11). In addition, high catch rates of eulachon were observed in the Shumagin Islands area during the 2000s but not in the 1990s. In the small-mesh survey, the highest eulachon CPUE is in Marmot and Kiliuda Bays on the east side of Kodiak (Table 5 and Fig. 2). The natal origins of eulachon caught in the vicinity of Kodiak Island are not known. A similar situation exists in British Columbia, where eulachon are caught in offshore shrimp fisheries (Hay and McCarter 2000). A genetic stock composition analysis of these catches demonstrated that most of the eulachon caught in any particular offshore area originated from the rivers closest to that area (Beacham et al. 2005). For example, eulachon caught in Chatham Sound in northern British Columbia originated mostly in northern British Columbia Rivers. This suggests that Kodiak-area eulachon are likely to be from rivers in the central and western GOA (see Fig. 3), but this is an issue that should be a research priority. Fishery Catches of eulachon in federal groundfish fisheries have increased since 1997 (Tables 7 & 8 and Fig. 12). These data are somewhat difficult to interpret, as identification of smelts to species level was not required until 2005 and there are still large amounts of “other smelt” reported in the catch. The prevalence of eulachon among other smelts in catches suggests that the majority of “smelt” catch is eulachon. Eulachon catches occur mainly in the central GOA (areas 620 and 630; Table 8). These observations are supported by a spatial analysis of observed eulachon (and smelt) catches in the commercial pelagic pollock trawl fishery from 1990-2007. From 1990-1999, the highest mean catches of smelts occurred to the west of Kodiak in the upper part of Shelikof Strait (Fig. 13A). The pollock fishery (observed hauls) was widely distributed throughout the western and central GOA during this period (Fig. 13B). During the 2000s, the mean size of eulachon catches increased and the site of the largest catches apparently shifted slightly south (Fig. 14A). The observed pollock fishery contracted during the 2000s, and the highest eulachon catches occurred to the south of the area with the highest intensity of pollock fishing effort (Fig. 14B). While the highest catches all occurred to the west of Kodiak Island, the relative

density of eulachon in catches appears to vary less by area: in a comparison of all observed hauls from 1990 to 2007, high percentages of eulachon occurred on both sides of the island (Fig. 15). With the assistance of AKRO we performed an analysis of eulachon deliveries to processors in excess of the 2% MRA (“overages”) in 2007 and 2008. Of 329 deliveries containing eulachon in 2007, 29 deliveries (9%) were overages. In 2008, 46 of 319 deliveries (14%) were overages. These results are based on analysis of delivered weights, and we were unable to determine how many of these overages (if any) resulted in enforcement action. The threat of overages did have some effect on fleet behavior, with boats voluntarily moving to avoid eulachon catches (J. Bonney, pers. comm.). There have been overages in the past and they typically occur over a very short time period when vessels encounter massive aggregations of eulachon (T. Pearson, AKRO, pers. comm.). In 2008, the highest fishery catch rates occurred during the week of March 15 (M. Furuness, AKRO, pers. comm.). Most eulachon are processed as fishmeal, but some have been sold for human consumption. Of the 787 t of eulachon delivered to processing plants in the GOA during 2007-2008, 86% was processed as fishmeal, 11% was discarded, and 3% was sold for human consumption. The fate of eulachon sold for human consumption is unclear, but eulachon have been used in the past as bait and as food for pets and captive marine mammals. Eulachon are also caught in state waters. Subsistence and personal use fisheries in Alaska remove large amounts of eulachon in southcentral and southeast Alaska. The scale of these removals is unclear. For example, in 2003 the reported personal use harvest (based on sportfish license-holder surveys) of eulachon in the 20-Mile River was 4.6 t, while a simultaneous creel survey estimated a 20-Mile River harvest of 14.9 t (Table 9). In addition, there are no reporting requirements for federally-managed subsistence fisheries. In 2006, the total minimum state-waters harvest of eulachon was 41 t (Table 9). There are directed fisheries in Alaska state waters for eulachon in Upper Cook Inlet, the Copper River area, and in southeast Alaska. There has been little commercial activity in recent years, due to either lack of interest or closures resulting from concerns over diminished spawning runs, but there is potential for substantial amounts of harvest. For example, the annual harvest quota for the Copper River is 272 t, although this fishery is closely monitored as a test fishery and the quota is adjusted based on run strength. Capelin Background information Capelin are distributed along the entire coastline of Alaska and south along British Columbia to the Strait of Juan de Fuca (Brown 2002, Naumenko 1996). In the North Pacific Ocean, capelin can grow to a maximum of 25 cm at age 4. Most capelin spawn at age 3 or 4, when they are only 11 to 17 cm (Pahlke 1985). Spawning in Norton Sound, northern Bristol Bay, and around Kodiak Island occurs in intertidal zones of course sand and fine gravel during spring. Few capelin survive spawning. The maturation age of capelin in the Barents Sea was found to be a function of growth rate, with fast-growing cohorts reaching maturity at an earlier age than slow-growing cohorts (Huse, 1998). In the Bering Sea, adult capelin distribution is associated with the annual extent of sea ice (Cianelli and Bailey 2005). However, in the GOA, which remains ice free year round, capelin are thought to overwinter in bays (Brown 2002, Blackburn et al. 1981). Analysis of larval capelin distribution suggests that capelin spawn inshore during summer (with a peak in June-July), and that larvae are subsequently advected from bays in the coastal zone to the continental shelf either by entrainment in freshwater runoff and/or by tidal flushing (Doyle 2002a, 2002b). Larger capelin larvae (>30 mm) appear to actively migrate to the surface layer. Lanksbury et al. (2005) analyzed assemblage-level ichthyoplankton data from autumn research cruises conducted in 2000 and 2001 in the GOA region between the Semidi and Shumagin Islands and noted that osmerids (primarily capelin) had a high frequency of occurrence. Several studies conducted by the AFSC have provided data on capelin length compositions and growth. Data collected during surveys conducted in the vicinity of Barnabas and Chiniak troughs to the east of

Kodiak by the AFSC’s Fishery Interaction Team (FIT) showed that while capelin ranging from 7 to 15 cm have been collected in all of the surveys, the relative frequency of different length classes has been variable (Figure 16). The largest size classes (12 and 13 cm) dominated tows in 2000, but a 32 mm-mesh codend liner was used in that year. In subsequent years (2001-2004), when a 9.5 mm codend liner was used, more fish of smaller size classes were observed and the mode of the lengths ranged between 9 and 10 cm. Variability in length composition was also observed during summer EIT surveys of the central and western GOA in 2003 and 2005 (Table 10 and Figure 17). In 2003 the mode of the length was 8 cm, while in 2005 7 cm capelin were most common. Because the 2005 survey was limited in its spatial extent, and did not sample areas to the northeast of Kodiak where large amounts of capelin were observed in 2003, it is difficult to determine whether these are spatial or temporal differences. We also investigated differences in length-weight relationships among capelin collected during 2000-2002 in the Kodiak FIT studies and in 2002 in SE Alaska (M. Sigler, AFSC, pers. comm.). Weight at length was slightly lower in Kodiak in 2002 relative to 2000 and 2001, while capelin in SE Alaska were slightly heavier at length than those from Kodiak (Fig. 18). These results suggest that there is both spatial and temporal variability in capelin growth Capelin are a major prey item for GOA groundfish. A review of capelin occurrence in groundfish stomachs from the GOA during 1981-2001 indicated that the major fish predators of capelin in both regions were arrowtooth flounder, Pacific cod, Pacific halibut, and walleye pollock (Yang et al. 2005). Capelin occurred frequently in the stomachs of marine fish sampled from the GOA in 1990, 1993, and 1996, and 2001, but were rare in 1999. The size frequency of capelin in fish stomachs varied substantially from year to year, with the 7-10 cm size class (age 1) being most common from 1990 to 1999, but the 10-14 cm size class (age 3) dominating in 2001. Estimates of total capelin consumed by fish predators during the summer feeding season in the GOA ranged from 21,168 t in 1999 to 221,408 t in 1990 (Fig. 19). Annual variation in capelin consumption was attributed primarily to changes in predator biomass, but also to variation in capelin biomass, the availability of capelin during stomach collections, and physical oceanographic factors. Abundance Biomass estimates from the GOA bottom trawl survey are highly variable and it is likely that capelin are particularly ill-sampled by this gear (Table 3 and Fig. 4). Biomass estimates spiked at 1,479 t in 1995 and 7,588 t in 2003. Biomass of capelin in the GOA has also been calculated using echosign data from summer EIT surveys in 2003 and 2005. In 2003, when the survey extended over most of the central and western GOA, capelin biomass was estimated at 115,979 t, two orders of magnitude higher than the bottom trawl estimate (Table 10). The EIT surveys did not sample nearshore areas and were conducted at a time of year when capelin are likely to be spawning in such areas. A third abundance estimate is available from food-web modeling that calculated 2.05 million t of capelin would be required to sustain predation by species at higher trophic levels (Table 6). The percentage of capelin caught in sample tows during EIT surveys in the Shelikof trough area increased during the 2000s but dropped to low levels in 2007 and 2008 (Table 4 and Fig. 5). Capelin have largely disappeared in the small-mesh survey (Table 11 and Fig. 20), an observation that has been attributed to a transformation in the epibenthic community of the GOA due to an oceanic climate regime shift (Anderson and Piatt 1999). The benthic community in the inshore regions of the GOA changed from a historical domination of crustaceans to a groundfish-dominated system. It was hypothesized that the reduction in the capelin catch was due to recruitment failure and increased predation caused by the regime change. This conclusion is supported by the decline in capelin occurrence in groundfish diets (Fig. 19). As discussed below, however, at least some of the perceived decline may also be due to shifts in distribution.

Of the species in the forage fish group, capelin are likely the best candidates for assessment modeling. Capelin stock assessments have been performed in the Barents Sea (Gjosaeter et al 2002), Iceland (Gudmundsdottir and Vilhjalmsson 2002), and Labrador (Carscadden et al 2001), where capelin constitute an important component of the ecosystem and support commercial fisheries. These assessments are based on comprehensive EIT surveys for capelin that are performed on a regular basis (O’Driscoll and Rose 2001, Jorgensen and Olsen 2002, Gjosaeter et al. 2002, Carscadden and Vilhjalmsson 2002, O’Driscoll et al. 2002). Modeling of capelin dynamics is challenging due to the short life history of capelin (Gjosaeter et al 2002, Hjermann et al 2004). While biomass estimation has been successful in Alaska using acoustic backscatter, limited spatial coverage and modeling difficulties continue to place limitations on capelin stock assessment in the GOA. Distribution The summer EIT surveys in 2003 and 2005 provided information on capelin distribution. In 2003, when the survey extent was greatest, capelin backscatter was highest to the northeast of Kodiak Island and in Chiniak and Barnabas troughs to the east of the island (Fig. 21A). Lower capelin backscatter was observed along the Alaska Peninsula and no capelin were observed in Shelikof Strait. In 2005, almost all of the capelin backscatter was observed in Chiniak and Barnabas troughs (Fig. 21B). Hollowed et al. (2007) described the mesoscale distribution of capelin in Chiniak and Barnabas troughs and found that capelin spatial distribution was strongly correlated with thermal fronts, not depth or bottom features. This association to thermal cues has also been shown in Atlantic populations (Carscadden and Nakashima 1997). The ocean regime shift witnessed in the late 1970s resulted in warmer costal water temperatures. Hollowed et al. (2007) hypothesized that the decline in capelin CPUE observed in the inshore small-mesh survey may have been a result of capelin being displaced by warm water in the nearshore areas. If this is the case, perceived capelin declines may be linked to changes in distribution. This could explain the continuing high predation rates of capelin by groundfish seen in the more offshore shelf areas of the GOA sampled by the NMFS groundfish survey (Yang and Nelson 2000). Fishery data Except for 2004, capelin are apparently caught in only small amounts in GOA groundfish fisheries (Table 8 and Fig. 12). As discussed previously, fisheries data are hard to interpret due to limited species identification. It is likely that the same factors that contribute to the surveys’ poor ability to sample capelin (their small size as well as pelagic and nearshore distributions), also reduce the likelihood of incidental catches in the fishery. A small directed fishery for capelin was tried in the Bering Sea in the 1980s but it lasted only a few years and harvested less than 5,000 tons (Wespestad 1987). Elsewhere, directed fisheries for capelin exist in the Barents Sea, near Iceland, and off the Labrador coast of Canada, using trawls and purse seines. These fisheries have historically harvested as much as two million tons per year, but have been subject to wide fluctuations in capelin abundance and repeated stock collapses (Ushakov and Prozorkevic 2002).
Family Ammodytidae (sand lances)
Pacific sand lance is a small (max. length 26 cm) and very slender fish that, although rarely encountered in fisheries or surveys, likely has the second-largest biomass in the GOA according to estimates from mass-balance ecosystem models (Aydin et al. 2007, Table 6), and is a major component of seabird, groundfish, and pinniped diets (Table 2 and Fig. 1). Sand lance is a nearshore species and is generally found in waters of 50 m depth or less (Robards et al. 1999). Sand lances display an unusual burrowing behavior, burying themselves in the substrate at night and during the winter. This is thought to reduce their exposure to predators and reduce energetic demands (Robards et al. 1999). Sand lances emerge

during the day to feed and are generally found in schools when in the water column. Spawning occurs in the intertidal and subtidal zones, and the eggs are demersal. Sand lances are so poorly sampled in the bottom trawl surveys that abundance trends are hard to discern (Table 3). Groundfish fishery catches of sand lance are generally very low, although it spiked in 2000 at 0.35 t (Table 7).
Family Trichodontidae (sandfishes)
The Pacific sandfish (Trichodon trichodon) is found shallow inshore waters to about 50 m depth and grows to a maximum length of 30 cm. Like sand lances, sandfishes exhibit burrowing behavior in which they bury themselves in the sand and come to rest with only their dorsal surface showing. This behavior makes them effective ambush predators. They serve as prey for salmon and other fishes, as well as pinnipeds. There has also been one confirmed account of the sailfin sandfish (Arctoscopus japonicus), a western North Pacific species, in Alaska waters. Trawl survey biomass estimates of sandfish are somewhat variable. Estimates decreased during the 1990s but have increased since 2001 (Table 3). Food-web model estimates are not available for sandfish. Sandfish catch is not reported in the CAS, but catches prior to 2003 ranged from 0.32-3.68 t (Table 7).
Families Pholidae (gunnels) and Stichaeidae (pricklebacks)
Gunnels and pricklebacks (including warbonnets, eelblennys, cockscombs and shannys) are long, compressed, eel-like fishes with long dorsal fins often joined with the caudal fin. Pricklebacks are so named because of the spiny rays in the dorsal fin in most species (some have soft rays at the rear of the dorsal fins). Gunnels have flexible dorsal fin rays; they also differ from pricklebacks in that the anal fin is smaller (the distance from the tip of the snout to the front of the anal fin is shorter than the length of the anal fin). Most species of both families live in shallow nearshore waters among seaweed and under rocks and are less than 45 cm in length. Approximately 24 species of stichaeids and 6 species of pholids occur in Alaska. Life history data for these species are sparse, although some cockscombs in British Columbia attain sexual maturity at age 2 years. Because they are nearshore species, they are not well sampled by the trawl survey. Biomass estimates for the Stichaeidae spiked at 2,008 t in 2001 (Table 3), but are generally much lower. Members of both families are caught in very low amounts in groundfish fisheries (Tables 7 & 8). Families Myctophidae (lanternfishes) and Bathylagidae (deep-sea smelts)
Myctophids and bathylagids are small deep-sea pelagic fishes that are an important prey item for whales, pinnipeds, other deep-dwelling fishes, and squids. Species in both families occur at depth during the day (below 300 m) and migrate to shallower waters (10-100 m) at night to feed. The northern lampfish (Stenobrachius leucopsarus), a common myctophid found in the Bering Sea and GOA, has a maximum length of 13 cm. Deep-sea smelts of the North Pacific Ocean include blacksmelt (Bathylagus spp.) and northern smoothtongue (Leuroglossus stilbius), which have maximum lengths of 12–25 cm. Survey biomass estimates do not exist for these species, although they are easily identified in acoustic surveys. Food-web models estimate myctophid biomass at 185,269 t and bathylagid biomass at 21,512 t. Myctophids are rarely caught in groundfish fisheries in the GOA (Tables 7 & 8), but there are limited commercial fisheries for them in the southern hemisphere.
Family Gonostomatidae (bristlemouths)
This is a large and diverse family of bathypelagic fish that are rarely observed except by researchers. They grow to about 8 cm and can be abundant at depths of up to 5,000 m. As many as six species may occur in the North Pacific Ocean and Bering Sea. Little is known about trends in their abundance.

Order Euphausiacea Along with many copepod species, the euphausiids form a critical zooplanktonic link between the primary producers (phytoplankton) and all upper pelagic trophic levels. These crustaceans, also known as krill, occur in large swarms in both neritic (nearshore) and oceanic (offshore) waters. Members of at least 11 genera of euphausiids are known from the North Pacific Ocean. The most important genuses, in terms of numbers of species, are Thysanopoda, Euphausia, Thysanoëssa, and Stylocheiron. Euphausiids are generally thought to make diurnal vertical migrations, remaining at depth during the day and ascending at night to 100 m or less to feed. However, this is complicated by the fact that as euphausiids grow they are found at deeper depths, except during spawning, which occurs in surface waters. Spawning occurs in spring to take advantage of the seasonal phytoplankton bloom. Hatched nauplii larvae live near the surface to about 25 m. By winter, the young crustaceans are found mainly at depths of 100 m or less, and make diurnal vertical migrations to feed. Sexual maturity is reached the following spring at age 1. After spawning, adult euphausiids gradually descend to deeper depths until winter, when they no longer migrate daily to near-surface waters. In their second spring, they again rise to the surface to spawn; euphausiids older than 2 years are very rarely found. This classical view of euphausiid life history and longevity has been questioned by Nichol (1990), who reported that Antarctic euphausiids may live as long as 6 to 10 years. If north Pacific euphausiids exhibited similar longevity then expected productivity may be much lower. While euphausiids are found throughout oceanic and neritic waters, their swarms are most commonly encountered in areas where nutrients are available for phytoplankton growth. This occurs primarily in areas where upwelling waters are a consistent oceanographic feature. Areas with such features are at the edges of the various domains on the shelf or at the shelf-break, at the heads of submarine canyons, on the edges of gullies on the continental shelf (e.g., Shumagin, Barnabas, Shelikof gullies in the GOA), in island passes in the Aleutian Islands (e.g., Seguam Pass, Tanaga Pass), and around submerged seamounts (e.g., west of Kiska Island). It is no coincidence that these are also prime fishing locations used by commercial fishing vessels seeking zooplanktivorous groundfish, such as pollock, Atka mackerel, sablefish, and many rockfish and flatfish. The species comprising the euphausiid group occupy a position of considerable importance within the North Pacific Ocean food web. Euphausiids are eaten by almost all other major taxa inhabiting the pelagic realm. The diet of many fish species other than the groundfish listed previously, including salmon, smelt (capelin, eulachon, and other osmerids), gadids such as Arctic cod and Pacific tomcod, and Pacific herring is composed, to varying degrees, of euphausiids (Yang and Nelson 2000). They are also the principal item in the diet of most baleen whales (Perez 1990). While copepods generally constitute the major portion of the diet of planktivorous seabirds (e.g., auklets), euphausiids are prominent in the diets of some predominately piscivorous seabirds in certain areas (e.g., kittiwakes on Buldir Island in the Aleutian Islands, Middleton Island in the GOA, and Saint Matthew Island in the Bering Sea). Euphausiids are not currently sought for human use or consumption from the North Pacific Ocean on a scale other than local, but large (about 500,000 t per year) krill fisheries from Japan and Russia have been operating in Antarctic waters since the early 1980s. A limited (500 t) fishery is allowed off the coast of British Columbia, Canada. The catch is used in fish food for fish aquaculture and aquaria.
Data gaps and research priorities The NPFMC and the AFSC are moving toward increased emphasis on understanding the role of forage fishes in the GOA ecosystem, and increased efforts are underway to gather data on the abundance, distribution, and life history of forage species. Recent improvements in both forage fish identification by

observers and catch accounting of smelt species will provide better catch data in the future. Survey techniques for forage species are being studied by a number of groups with the AFSC and academia (see above). Techniques for estimating capelin biomass from EIT surveys are currently being developed, and future gulfwide EIT surveys may provide a means of assessing this species as well as eulachon. The large gaps between biomass estimates from existing surveys and food-web models indicate that the greatest research need is for more realistic estimation of forage fish abundance. The small-mesh survey is an important source of data regarding the abundance of forage fishes and juvenile groundfishes, and we strongly recommend that funding be provided to continue this effort. Understanding the causes of population fluctuations is also of primary importance. Forage fish abundance seems to depend in large part on environmental factors, and forage fishes are probably important links between climate change effects and higher trophic levels. It is important to note that the FMP forage fish group omits some species that have important forage roles, such as herring and juvenile pollock. These species should be included in analyses of forage fish ecology. There is also a need for a better understanding of the oceanic behavior of eulachon. The freshwater origins of eulachon caught in offshore fisheries are unknown, and this information is important for determining the effect of fisheries on eulachon populations.

References Abookire,A.A. and J.F. Piatt. 2005. Oceanographic conditions structure forage fishes into lipid-rich and
lipid-poor communities in lower Cook Inlet, Alaska, USA. Marine Ecology Progress Series 287:229-240.
Anderson, P.J., J.E. Blackburn, and B.A. Johnson. 1997. Declines of forage species in the Gulf of Alaska, 1972-95, as an indicator of regime shift. pp 531-543. In: Baxter BS (ed) Proceedings of the international Symposium on the Role of Forage Fishes in Marine Ecosystems November 13-16, 1996, Anchorage, Alaska. University of Alaska Sea Grant College Program Report 97-01.
Anderson, P., and J.F. Piatt. 1999. Community reorganization in the Gulf of Alaska following ocean climate regime shift. Mar. Ecol. Progr. Ser. 189: 117-123.
Aydin, K.Y., V.V. Lapko, V.I. Radchenko, and P.A. Livingston. 2002. A comparison of the eastern and western Bering Sea shelf and slope ecosystems through the use of mass-balance food web models. U.S. Dep. Commer., NOAA Tech. Memo. NMFS-AFSC-130, 78 p.
Aydin, K., S. Gaichas, I. Ortiz, D. Kinzey, and N. Friday. 2007. A comparison of the Bering Sea, Gulf of Alaska, and Aleutian Islands large marine ecosystems through food web modeling. NOAA Tech. Memo. NMFS-AFSC-178, 298p.
Baillie, S.M. and I.L. Jones. 2003. Atlantic Puffin (Fratercula arctica) chick diet and reproductive performance at colonies with high and low capelin (Mallotus villosus) abundance. Can. J. Zoology 81:1598-1607.
Beacham, T.D., D. hay, and K.D. Le. 2005. Population structure and stock identification of eulachon (Thaleichthys pacificus), and anadromous smelt, in the Pacific Northwest. Marine Biotechnology 7: 363-372
Blackburn, J. E., P.B. Jackson, I.M. Warner, and M.H. Dick. 1981. A survey for spawning forage fish on the east side of the Kodiak Archipelago by air and boat during spring and summer 1979. Final Report OCSEAP R.U No. 553. Alaska Dept. of Fish and Game, Kodiak, Alaska.
Bogstad, B. and H. Gjosaeter. 2001. Predation by cod (Gadus morhua) on capelin (Mallotus villosus) in the Barents Sea: implications for capelin stock assessment. Fisheries Research 53:197-209.
Brown,E.D. 2002. Life history, distribution, and size structure of Pacific, capelin in Prince William Sound and the northern Gulf of Alaska. ICES J Marine Science 59:983-996.
Brown, E.D., J.H. Churnside, R.L. Collins, T. Veenstra, J.J. Wilson, and K. Abnett. 2002. Remote sensing of capelin and other biological features in the North Pacific using lidar and video technology. ICES J Marine Science 59:1120-1130.
Brodeur, R.D., T.M. Wilson, G.E.Walters, and I.V. Melnikov. 1999. Forage fishes of the Bering Sea: distribution, species associations, and biomass trends. In T.R. Loughlin and K. Ohtani (eds.) Dynamics of the Bering Sea. Alaska Sea Grant College Program Report AK-AG-99-03.
Carscadden, J., and B.S. Nakashima. 1997. Abundance and changes in distribution, biology and behavior of capelin in response to cooler waters of the 1990s. pp. 457-468. In Forage Fishes in Marine Ecosystems. Proceedings of the International Symposium on the Role of Forage Fishes in Marine Ecosystems. Alaska Sea Grant College Program Report No. 97-01. University of Alaska Fairbanks, 1997.
Carscadden, J.E, K.T. Frank, and W.C. Leggett. 2001. Ecosystem changes and the effect on capelin (Mallotus villosus ), a major forage species. Can .J Fish Aquatic Sciences 58:73-85.
Carscadden, J.E. and H. Vilhjalmsson. 2002. Capelin - What are they good for? Introduction. ICES J Marine Science 59:863-869.
Cianelli,L, and K.M. Bailey. 2005. Landscape dynamics and resulting species interactions: the cod-capelin system in the southeastern Bering Sea. Marine Ecology Progress Ser. 291:227-236.
Conners, M. E., A.B. Hollowed, and E. Brown. 2002. Retrospective analysis of Bering Sea bottom trawl surveys: regime shift and ecosystem reorganization. Prog. Oceanography 55:209-222.

Davoren,G.K. and W.A. Montevecchi. 2003. Signals from seabirds indicate changing biology of capelin stocks. Marine Ecology Progress Series 258:253-261.
Dolgov, A.V. 2002. The role of capelin (Mallotus villosus ) in the food web of the Barents Sea. . ICES J Marine Science 59:1034-1045.
Doyle, M.J., M.S. Busby, J.T. Duffy-Anderson, S.J. Piquelle, and A.C. Matarese. 2002. Aspects of the early life history of capelin (Mallotus villosus ) in the northwest Gulf of Alaska: a historical perspective based on larval collections October 1977-March 1979. U.S. Dept. of Commerce., NOAA Tech. Memo NMFS-AFSC-132, 32p.
Doyle, M.J., M.S. Busby, J.T. Duffy-Anderson, S.J. Piquelle, and A.C. Matarese. 2002. Early life history of capelin (Mallotus villosus ) in the northwest Gulf of Alaska: a historical perspective based on larval collections October 1977-March 1979. ICES J Marine Science 59:997-1005.
Gauthier,S. and J.K. Horne. 2004. Acoustic characteristics of forage fish species in the Gulf of Alaska and Bering Sea based on Kirchhoff-approximation models. Can. J. Fish. Aquatic Sciences 61:1839-1850.
Gjosaeter,H., B. Bogstad, and S. Tjelmeland. 2002. Assessment methodology for Barents Sea capelin, Mallotus villosus(Muller). ICES J Marine Science 59:1086-1095.
Gudmundsdottir, A., and H. Vilhjalmsson. 2002. Predicting total allowable catches for Icelandic capelin, 1978-2001. ICES J Marine Science 59:1105-1115.
Guttormsen, M. A., and P. T. Yasenak. 2007. Results of the 2003 and 2005 echo integration-trawl surveys in the Gulf of Alaska during summer, Cruises MF2003-09 and OD2005-01. AFSC Processed Rep. 2007-04, 61 p.
Hjermann,D.O., G. Ottersen, and N.C. Stenseth. 2004 Competition among fishermen and fish causes the collapse of Barents Sea capelin. Proc. Nat. Acad. Sci. 101:11679-11684.
Hay, D. and P.B. McCarter. 2000. Status of the eulachon Thaleichthys pacificus in Canada. Research Document 2000/145, Canadian Stock Assessment Secretariat, Department of Fisheries and Oceans Canada.
Hollowed, A.B, C.D. Wilson, P. Stabeno, and S. Salo. 2007. Effect of ocean conditions on the cross-shelf distribution of walleye pollock (Theragra chalcogramma) and capelin (Mallotus villosus). Fisheries Oceanography 16: 142-154.
Iverson, S.J., K.J. Frost, and S.L.C. Lang. 2002. Fat content and fatty acid composition of forage fish and invertebrates in Prince William Sound, Alaska: factors contributing to among and within species variability. Mar. Ecol. Prog. Series 241: 161-181
Huse, G. 1998. Sex-specific life history strategies in capelin (Mallotus villosus)? Can. J. Fish. Aquatic. Sci. 55: 631-638.
Jorgensen, R. 2003. The effects of swimbladder size, condition and gonads on the acoustic target strength of mature capelin. ICES J. Marine Science 60:1056-1062.
Jorgensen, R., and K. Olsen. 2002. Acoustic target strength of capelin measured by single-target tracking in a controlled cage experiment. ICES J Marine Science 59:1081-1085.
Kuletz, K.J., D.B. Irons, B.A. Agler, and J.F.Piatt. 1997. Long-term changes in diets and populations of piscivorous birds and mammals in Prince William Sound, Alaska. In Forage fishes in marine ecosystems: proceedings of the international symposium on the role of forage fishes in marine ecosystems. Alaska Sea Grant College Program Report 97-01, University of Alaska, Fairbanks.
Lanksbury, J.A., J.T. Duffy-Anderson, K.L.Mier, and M. T. Wilson. 2005. Ichthyoplankton abundance, distribution, and assemblage structure in the Gulf of Alaska during September 2000 and 2001. Estuarine, Coastal, & Shelf Science 64:775-789.
Litzow, M.A. J. Piatt, A. A. Abookire, and M.D. Robards. 2004. Energy density and variability in abundance pf pigeon guillemot prey: support for the quality-variability trade-off hypothesis. J. Animal Ecology 73:1149-1156.
Livingston, P.A. and S. Tjelmeland. 2000. Fisheries in boreal ecosystems. ICES J Marine Science 57:619-627.

Logerwell, E. A. and C. D. Wilson. 2004. Species discrimination of fish using frequency-dependent acoustic backscatter. ICES J Marine Science 61:1004-1013.
Matthiasson, T. 2003. Closing the open sea: Development of fishery management in four Icelandic fisheries. Natural Resources Forum 27:1-18.
Mecklenburg, C.W., T.A. Mecklenburg, and L.K. Thorsteinson. 2002. Fishes of Alaska. American Fisheries Society. 1037 p.
Moffitt, S., Marston, B., and Miller, M. 2002. Summary of eulachon research in the Copper River delta, 1998-2002. Regional Information Report No. 2A02-34. Anchorage: Alaska Department of Fish and Game
Meuter, F.J. and B.L. Norcross. 2002. Spatial and temporal patterns in the demersal fish community on the shelf and upper slope regions of the Gulf of Alaska. Fishery Bulletin 100:559-581.
Naumenko, E.A. 1996. Distribution, biology, condition, and abundance of capelin (Mallotus villosus socialis) of the Bering Sea. In Ecology of the Bering Sea: a review of Russian literature, pp 237-256. Ed. by O.A. Mathisen and K.O. Coyle, U. Alaska Sea Grant Report 96-01. 306pp.
Naumenko, E.A. 2002. The dynamics of prespawning capelin (Mallotus villosus socialis) off the West Kamchatka coast. ICES J Marine Science 59:1006-1010.
Nelson, M. 2003. Forage fish species in the Gulf of Alaska. In Stock Assessment and Fishery Evaluation for the Gulf of Alaska. North Pacific Fisheries Management Council, Anchorage, AK.
Nichol, S. 1990. The age-old problem of krill longevity. Bioscience, Vol. 40, No. 11. pp. 833-836. O'Driscoll, R.L. and G.A. Rose. 2001. In situ acoustic target strength of juvenile capelin. ICES J Marine
Science 58:342-345. O'Driscoll, R.L., G.A. Rose, and J.T. Anderson. 2002. Counting capelin: a comparison of acoustic
density and trawl catchability. ICES J Marine Science 59:1062-1071. Ostrand, W.D., K.O. Coyle, G.S.Drew, J.M. Maniscalco and D.B. Irons. 1997. Selection of forage-fish
schools by murrelets and tufted puffins in Prince William Sound, Alaska. In Forage fishes in marine ecosystems: proceedings of the international symposium on the role of forage fishes in marine ecosystems. Alaska Sea Grant College Program Report 97-01, University of Alaska, Fairbanks.
Pahlke, K.A. 1985. Preliminary studies of capelin (Mallotus villosus) in Alaskan waters. Alaska Dept. Fish and Game, Info. Leaf. 250. 64 p.
Palsson, O.K. 1997. Predator-prey interactions of demersal fish species and capelin (Mallotus villosus) in Icelandic waters. In Forage fishes in marine ecosystems: proceedings of the international symposium on the role of forage fishes in marine ecosystems. Alaska Sea Grant College Program Report 97-01, University of Alaska, Fairbanks.
Payne, S., B.A. Johnson, and R.S. Otto. 1999. Proximate composition of some north-eastern Pacific forage fish species. Fish. Oceanogr. 8: 159-177
Perez, M.A. 1990. Review of marine mammal population and prey information for Bering Sea ecosystem studies. U.S. Dep. Commer., NOAA Tech. Memo. NMFS-AFSC-. 86 p.
Robards, M.D., M.F. Willson, R.H. Armstrong, and J.F. Piatt. 1999. Sand lance: A review of biology and predator relations and annotated bibliography. Exxon Valdez Oil Spill Restoration Project 99346 Final Report. USDA Forest Service Research Paper PNW-RP-521
Roed, K.H., S.E. Fevolden, J.S. Christiansen, and L. Midthjell. 2003. Isolation and characterization of DNA microsatellites for capelin Mallotus villosus population genetic studies. Marine Ecology Progress Series 262:299-303.
Rose, G.A. and R.L. O’Driscoll. 2002. Capelin are good for cod: can the northern cod stock rebuild without them? ICES J Marine Science 59:1018-1026.
Rosen, D.A.S., and A.W. Trites. 2000. Pollock and the decline of Steller sea lions: testing the junk-food hypothesis. Can. J. Zoology 78:1243-1250.
Sinclair, E.H. and T.K. Zeppelin. 2002. Seasonal and spatial differences in diet in the western stock of Steller sea lions (Eumetopias jubatus). J Mammology 83:973-990.
Sigler, M., N.Hillgruber, M. Benfield, J. Vollenweider, S. Parker-Stetter, and C. Kenaly. 2005. Scientific research plan: survey strategies for assessment of Bering Sea forage species. Progress report to the North Pacific Research Board.
Tereshchenko, E.S. 2002. The dynamics of population fecundity in Barents Sea capelin. ICES J Marine Science 59:976-982.
Trites, A.W. and C.P. Donnelly. 2003. The decline of Steller sea lions Eumetopias jubatus in Alaska: a review of the nutritional stress hypothesis. Mammal Review 33:3-28.
Ushakov, N.G. and D.V. Prozorkevich. 2002. The Barents Sea capelin - a review of trophic interrelations and fisheries. ICES J Marine Science 59:1046-1052.
Yndestad, H. and A. Stene. 2002. System dynamics of the Barents Sea capelin. ICES J Marine Science 59:1155-1166.
Wespestad, V.G. 1987. Population dynamics of Pacific herring (Clupea palasii), capelin (Mallotus villosus), and other coastal pelagic fishes in the eastern Bering Sea. pp. 55-60 In Forage Fishes of the southeastern Bering Sea. Proceedings of a Conference, November 1986, Anchorage, AK. U.S. Dept. Interior, Minerals Management Service, OCS Study MMS 87-0017.
Willson, M. F., R. H. Armstrong, M. C. Hermans, and K Koski. 2006. Eulachon: A review of biology and an annotated bibliography. AFSC Processed Rep. 2006-12, 243 p.
Wilson, C.D., A.B. Hollowed, M. Shima, P. Walline, and S. Stienessen. 2003. Interactions between commercial fishing and walleye pollock. Alaska Fishery Research Bulletin 10:61-77.
Wilson, M. T., C. M. Jump, and J.T. Duffy-Anderson. In press. Comparative analysis of the feeding ecology of energy-rich and energy-poor forage fishes: capelin (Mallotus villosus) versus walleye pollock (Theragra chalcogramma). Marine Ecology Progress Series.
Womble, J.N., M.F. Willson, M.F. Sigler, B.P. Kelly, and G.R. van Blaricom. 2005. Distribution of Steller sea lions Eumetopias jubatus in relation to spring-spawning fish in SE Alaska. Mar Ecol Prog Ser 294: 271-282
Yang, M-S., and M.W. Nelson. 2000. Food habits of the commercially important groundfishes in the Gulf of Alaska in 1990, 1993, and 1996. U.S. Dept. of Comerc., NOAA Tech. Memo. NMFS-AFSC-112, 174 p.
Yang, M-S, K. Aydin, A. Grieg, G. Lang, and P. Livingston. 2005. Historical review of capelin (Mallotus villosus) consumption in the Gulf of Alaska and eastern Bering Sea. U.S. Dept. of Comerc., NOAA Tech. Memo NMFS-AFSC-155, 89p.
Tables & Figures
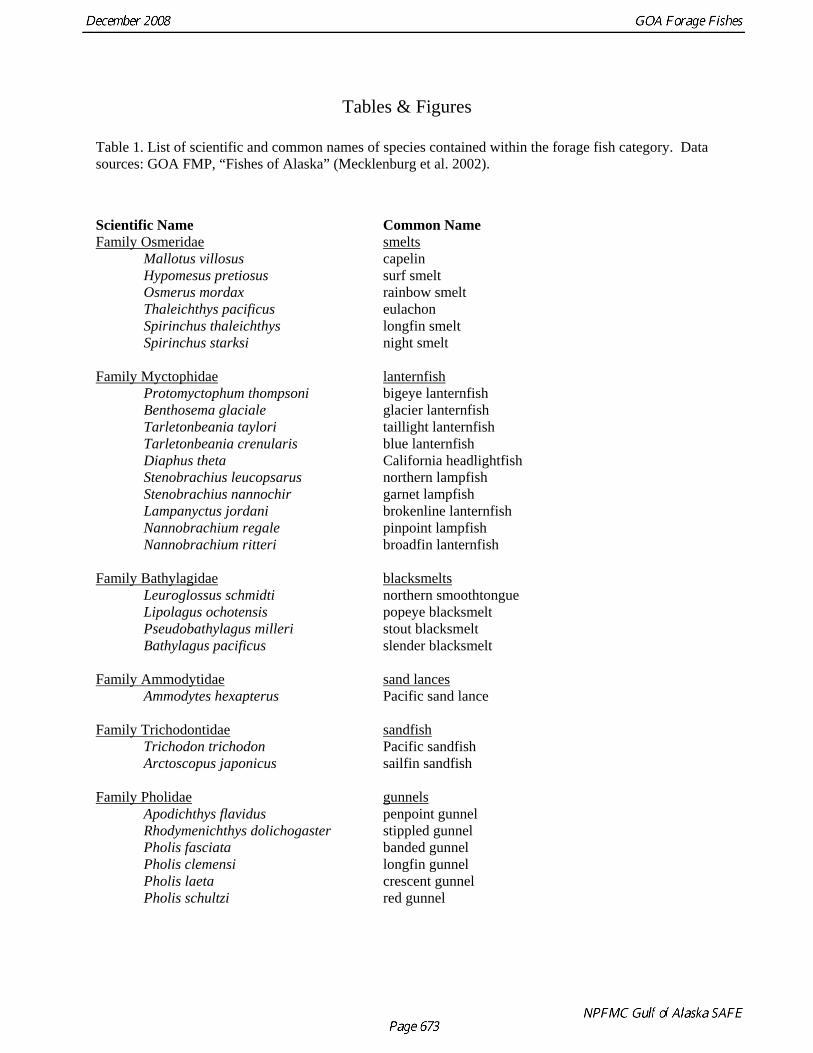
Table 1. List of scientific and common names of species contained within the forage fish category. Data sources: GOA FMP, “Fishes of Alaska” (Mecklenburg et al. 2002).
Scientific Name Common Name Family Osmeridae smelts Mallotus villosus capelin Hypomesus pretiosus surf smelt Osmerus mordax rainbow smelt Thaleichthys pacificus eulachon Spirinchus thaleichthys longfin smelt Spirinchus starksi night smelt Family Myctophidae lanternfish Protomyctophum thompsoni bigeye lanternfish Benthosema glaciale glacier lanternfish Tarletonbeania taylori taillight lanternfish Tarletonbeania crenularis blue lanternfish Diaphus theta California headlightfish Stenobrachius leucopsarus northern lampfish Stenobrachius nannochir garnet lampfish Lampanyctus jordani brokenline lanternfish Nannobrachium regale pinpoint lampfish Nannobrachium ritteri broadfin lanternfish Family Bathylagidae blacksmelts Leuroglossus schmidti northern smoothtongue Lipolagus ochotensis popeye blacksmelt Pseudobathylagus milleri stout blacksmelt Bathylagus pacificus slender blacksmelt Family Ammodytidae sand lances Ammodytes hexapterus Pacific sand lance Family Trichodontidae sandfish Trichodon trichodon Pacific sandfish Arctoscopus japonicus sailfin sandfish Family Pholidae gunnels Apodichthys flavidus penpoint gunnel Rhodymenichthys dolichogaster stippled gunnel Pholis fasciata banded gunnel Pholis clemensi longfin gunnel Pholis laeta crescent gunnel Pholis schultzi red gunnel

Table 1 continued. List of scientific and common names of species contained within the forage fish category. Data sources: GOA FMP, “Fishes of Alaska” (Mecklenburg et al. 2002). Scientific Name Common Name Family Stichaeidae pricklebacks Eumesogrammus praecisus fourline snakeblenny Stichaeus punctatus arctic shanny Gymnoclinus cristulatus trident prickleback Chirolophis tarsodes matcheek warbonnet Chirolophis nugatory mosshead warbonnet Chirolophis decoratus decorated warbonnet Chirolophis snyderi bearded warbonnet Bryozoichthys lysimus nutcracker prickleback Bryozoichthys majorius pearly prickleback Lumpenella longirostris longsnout prickleback Leptoclinus maculates daubed shanny Poroclinus rothrocki whitebarred prickleback Anisarchus medius stout eelblenny Lumpenus fabricii slender eelblenny Lumpenus sagitta snake prickleback Acantholumpenus mackayi blackline prickleback Opisthocentrus ocellatus ocellated blenny Alectridium aurantiacum lesser prickleback Alectrias alectrolophus stone cockscomb Anoplarchus purpurescens high cockscomb Anoplarchus insignis slender cockscomb Phytichthys chirus ribbon prickleback Xiphister mucosus rock prickleback Xiphister atropurpureus black prickleback Family Gonostomatidae bristlemouths Sigmops gracilis slender fangjaw Cyclothone alba white bristlemouth Cyclothone signata showy bristlemouth Cyclothone atraria black bristlemouth Cyclothone pseudopallida phantom bristlemouth Cyclothone pallida tan bristlemouth Order Euphausiacea krill

Table 2. Model estimates of forage fish contribution to diets of seabirds and marine mammals in the GOA. Values are the estimated percentage by weight of the species/group in the predator’s diet. Diet composition based on mass-balance ecosystem model and diet data from the early 1990s (K. Aydin, pers. comm.). “Other forage” includes the families Trichodontidae, Pholidae, Gonostomatidae, and Stichaeidae.
percentage of modeled diet in the GOA capelin sandlance eulachon other forage Myctophidae Toothed Whales Killer whales (transient) - - - - - Killer whales (resident) 17.4 6.2 2.6 3.4 1.6 Porpoises 9.9 3.5 - 1.0 - Sperm & beaked whales - - - - - Baleen Whales Fin whales 8.8 3.1 1.0 1.7 - Humpbacks 17.4 6.1 2.6 3.3 - Minke 25.8 9.1 3.9 6.0 - Sei whales 4.6 1.6 - - - Gray whales - - - - - Right whales - - - - - Pinnipeds Steller sea lions 0.9 - 4.2 2.1 - Steller (juveniles) >1.0 - 4.3 1.9 - N Fur Seal 37.8 33.8 - - - Resident seals - - - - - Sea Otters 6.3 - - - - Seabirds Kittiwakes 28.7 10.1 4.3 5.5 5.5 Fulmars 4.0 - - - - Murres 21.0 7.4 3.0 4.1 - Puffins 40.2 14.2 6.1 10.7 - Cormorants 19.7 49.9 3.0 4.8 1.8 Gulls 54.2 19.2 8.2 14.5 - Auklets 3.3 - - - - Storm Petrels 2.4 - - - - Shearwaters 41.6 11.7 5.0 6.4 3.5 Albatross Jaeger 23.4 8.3 3.5 4.5 -

Table 3. Forage fish biomass estimates from the AFSC GOA bottom trawl survey.
GOA survey biomass (t) species/ group
reg. area 1984 1987 1990 1993 1996 1999 2001 2003 2005 2007
capelin C 387 38 136 46 718 102 275 7,272 428 631 E 7 8 14 76 755 106 298 586 125 W 37 5 0 2 5 34 4 18 2 29
GOA 430 51 151 124 1,479 241 279 7,588 1,015 785 eulachon C 4,767 8,663 19,043 24,172 26,470 11,665 49,061 94,991 40,796 41,184
E 2,300 5,864 8,493 8,278 4,334 2,587 16,882 14,080 9,486 W 38 1,787 453 2,553 1,444 438 2,867 1,610 195 1,126
GOA 7,105 16,314 27,988 35,003 32,248 14,690 51,928 113,482 55,071 51,796 oth. smelts C 0 0 35 30 1 1 0 0 6 2
E 0 160 114 81 63 42 231 6 47 W 1 0 0 92 0 0 0 0 0 0
GOA 1 160 149 203 64 43 0 231 12 48 sandfish C 1,858 558 329 155 135 22 89 80 383 931
E 354 529 377 296 16 542 3,832 75 315 W 12 28 16 69 2 9 6 29 0 0
GOA 2,223 1,115 722 520 153 572 94 3,941 458 1,246 sandlance C 3 13 63 2 5 8 7 8 32 4
E 0 0 1 0 0 2 1 0 0 W 0 2 0 0 1 1 5 2 1 1
GOA 3 15 64 2 5 10 12 11 33 4 Stichaeidae C 163 9 141 180 100 187 2,001 230 221 1,427 E 0 5 3 1 24 28 39 1 1 W 7 0 5 23 19 2 7 10 8 12 GOA 170 15 149 205 143 217 2,008 278 231 1,441

Table 4. Eulachon and pollock catches during AFSC EIT surveys conducted in the GOA, 1981-2008. Pollock biomass estimates (t) are the EIT survey estimates. Eulachon and pollock catches are shown as the mean percentage by weight of each species in sample tows.
pollock biomass estimate
(t)
eulachon % of catch
capelin % of catch
1981 2,785,800 1.7% 0.0% 1982 1983 2,278,200 0.9% 0.0% 1984 1,757,200 1.0% 0.0% 1985 1,175,300 1.4% 0.0% 1986 585,800 3.4% 0.0% 1987 4.9% 0.0% 1988 301,700 4.9% 0.0% 1989 290,500 4.5% 0.0% 1990 374,800 3.2% 0.0% 1991 380,300 7.7% 0.0% 1992 713,400 8.9% 3.0% 1993 435,800 7.2% 0.0% 1994 492,600 7.1% 0.0% 1995 763,600 4.0% 0.0% 1996 777,200 3.2% 0.0% 1997 583,000 2.3% 0.0% 1998 504,800 2.5% 0.0% 1999 2000 448,600 4.6% 13.4% 2001 432,700 5.6% 15.0% 2002 256,700 6.6% 16.6% 2003 317,300 5.9% 8.5% 2004 330,800 3.2% 11.7% 2005 356,100 8.9% 6.0% 2006 293,600 8.8% 17.7% 2007 180,900 15.8% 0.2% 2008 208,032 26.4% 5.6%

Table 5. Mean CPUE (kg/km2) of eulachon in the ADF&G/NMFS small-mesh survey.
eulachon mean CPUE (kg/km2)
Marmot
Bay Kiliuda
Bay
Two-Headed Gully
Alitak Bay
Chignik-Castle Bays
Kuiukta Bay
Pavlof Bay
1972 0.00 1973 1.05 1.51 0.00 1974 0.03 0.42 0.00 1975 0.31 0.01 0.00 1976 12.68 1.97 0.00 0.00 0.23 0.01 0.00 1977 1.17 5.26 0.18 0.03 1978 0.30 1.93 0.24 0.00 0.00 0.02 1979 8.20 0.00 0.00 0.00 0.03 1980 1.77 0.30 1.41 3.33 5.13 0.21 0.02 1981 1.01 1.34 0.39 0.17 1.36 0.66 0.04 1982 0.00 0.00 0.06 1983 0.52 0.69 0.04 1984 1.53 2.08 1.81 0.10 0.00 0.00 1985 0.35 0.46 1.00 0.03 0.01 1986 0.08 1.39 0.75 0.02 1.33 5.44 0.06 1987 0.37 0.02 0.98 2.29 0.11 1988 0.00 1989 0.11 1.97 1.84 0.03 0.00 0.00 0.03 1990 0.05 1991 0.02 1992 0.02 11.26 0.58 0.10 2.85 0.24 0.02 1993 0.01 1994 0.02 1995 0.14 1.68 0.11 0.30 0.95 0.37 0.01 1996 0.01 1997 0.01 1998 0.19 4.50 0.32 0.00 0.08 1999 0.08 2000 0.03 2001 14.00 0.57 0.81 0.09 0.02 2002 0.16 0.45 17.87 3.40 0.02 2003 9.32 16.97 10.20 0.06 0.10 2004 39.35 10.38 5.98 0.00 2005 1.07 3.14 5.36 0.26 0.07 2006 2.46 3.77 4.28 0.09 2007 0.52 0.85 1.36 0.65 0.20

Table 6. Forage fish biomass estimates from mass-balance ecosystem models (Aydin et al. 2007). Estimates are based on diet data from the early 1990s. “Other forage” includes the families Trichodontidae, Pholidae, Gonostomatidae, and Stichaeidae.
species/group biomass estimate (t)
eulachon 335,636 capelin 2,050,112
sandlance 712,880 Myctophidae 185,269 Bathylagidae 21,512 other forage 415,443
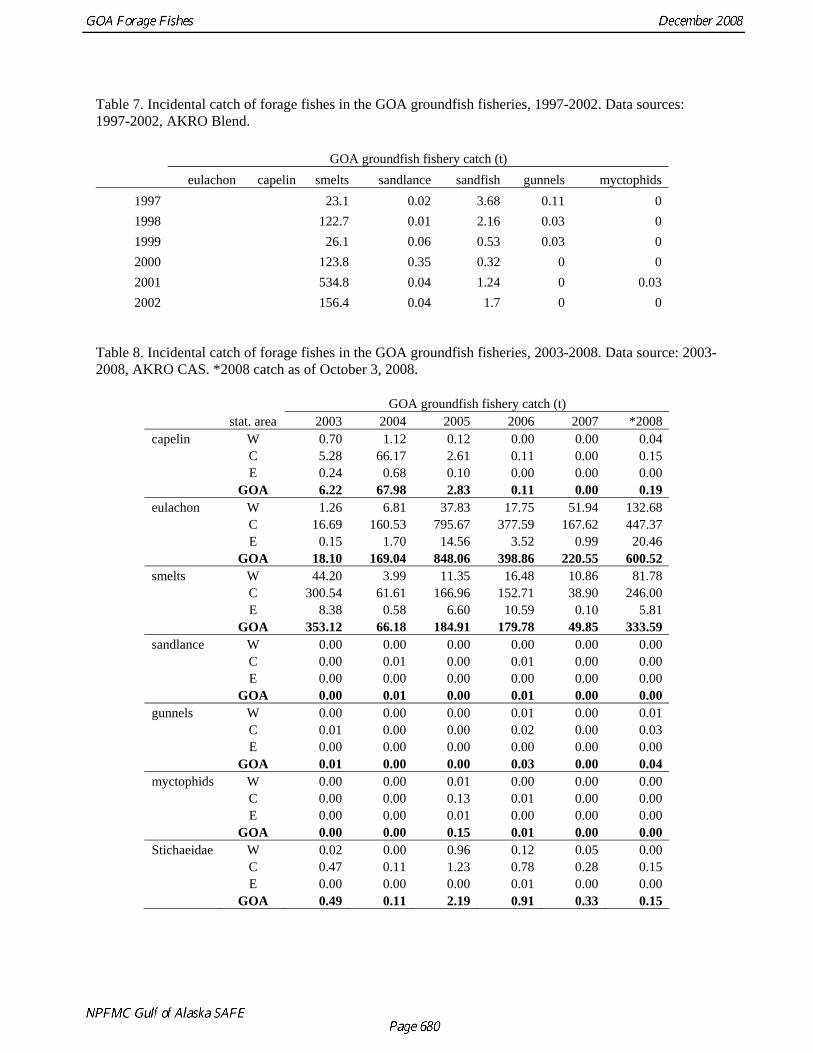
Table 7. Incidental catch of forage fishes in the GOA groundfish fisheries, 1997-2002. Data sources: 1997-2002, AKRO Blend.
GOA groundfish fishery catch (t) eulachon capelin smelts sandlance sandfish gunnels myctophids
1997 23.1 0.02 3.68 0.11 0 1998 122.7 0.01 2.16 0.03 0 1999 26.1 0.06 0.53 0.03 0 2000 123.8 0.35 0.32 0 0 2001 534.8 0.04 1.24 0 0.03 2002 156.4 0.04 1.7 0 0
Table 8. Incidental catch of forage fishes in the GOA groundfish fisheries, 2003-2008. Data source: 2003-2008, AKRO CAS. *2008 catch as of October 3, 2008.
GOA groundfish fishery catch (t) stat. area 2003 2004 2005 2006 2007 *2008 capelin W 0.70 1.12 0.12 0.00 0.00 0.04 C 5.28 66.17 2.61 0.11 0.00 0.15 E 0.24 0.68 0.10 0.00 0.00 0.00 GOA 6.22 67.98 2.83 0.11 0.00 0.19 eulachon W 1.26 6.81 37.83 17.75 51.94 132.68 C 16.69 160.53 795.67 377.59 167.62 447.37 E 0.15 1.70 14.56 3.52 0.99 20.46 GOA 18.10 169.04 848.06 398.86 220.55 600.52 smelts W 44.20 3.99 11.35 16.48 10.86 81.78 C 300.54 61.61 166.96 152.71 38.90 246.00 E 8.38 0.58 6.60 10.59 0.10 5.81 GOA 353.12 66.18 184.91 179.78 49.85 333.59 sandlance W 0.00 0.00 0.00 0.00 0.00 0.00 C 0.00 0.01 0.00 0.01 0.00 0.00 E 0.00 0.00 0.00 0.00 0.00 0.00 GOA 0.00 0.01 0.00 0.01 0.00 0.00 gunnels W 0.00 0.00 0.00 0.01 0.00 0.01 C 0.01 0.00 0.00 0.02 0.00 0.03 E 0.00 0.00 0.00 0.00 0.00 0.00 GOA 0.01 0.00 0.00 0.03 0.00 0.04 myctophids W 0.00 0.00 0.01 0.00 0.00 0.00 C 0.00 0.00 0.13 0.01 0.00 0.00 E 0.00 0.00 0.01 0.00 0.00 0.00 GOA 0.00 0.00 0.15 0.01 0.00 0.00 Stichaeidae W 0.02 0.00 0.96 0.12 0.05 0.00 C 0.47 0.11 1.23 0.78 0.28 0.15 E 0.00 0.00 0.00 0.01 0.00 0.00 GOA 0.49 0.11 2.19 0.91 0.33 0.15

Table 9. Eulachon harvest (t) in state waters of Alaska, 1978-2006. Original data in numbers or pounds converted to metric tons (t) using an average body weight of 60 g or conversion factor 1 lb. = 0.454 kg, respectively. Total harvest values do not include Unuk River subsistence harvest.
20-Mile River
reported personal
use
20-Mile River creel
survey personal
use
statewide reported personal
use
Upper Cook Inlet
directed fishery
Copper River
directed fishery
Unuk River
subsistence and
personal use catch
total minimum
state-waters harvest
1978 - - - 0.1 - - 0.1 1980 - - - 1.8 - - 1.8 1986 7.4 - - - - - 7.4 1987 7.9 - - - - - 7.9 1988 8.4 - - - - - 8.4 1989 6.2 - - - - - 6.2 1990 8.0 - - - - - 8.0 1991 4.2 - - - - - 4.2 1992 2.6 - - - - - 2.6 1993 1.8 - - - - - 1.8 1994 3.0 - 6.4 - - - 6.4 1995 2.0 - 3.2 - - - 3.2 1996 1.3 - 3.7 - - - 3.7 1997 2.3 - 4.6 - - - 4.6 1998 2.0 - 4.8 8.6 78.3 - 91.7 1999 2.7 - 6.5 45.5 no fishery - 51.9 2000 0.8 - 4.7 - 59.2 - 63.9 2001 2.2 - 5.1 - 71 8.5 76.1 2002 4.6 14.9 5.8 - no fishery 2.1 5.8 2003 2.2 - 4.7 - no fishery 8.4 4.7 2004 0.6 - 4.5 - 16.7 0.7 21.2 2005 0.5 - - - no fishery no fishery 0.0 2006 - - 41.3 no fishery no fishery 41.3
Sources:
Jennings, G. B., K. Sundet, and A. E. Bingham. 2007. Participation, catch, and harvest in Alaska sport fisheries during 2004. Alaska Department of Fish and Game, Fishery Data Series No. 07-40, Anchorage.
Miller, M.G. and D. Bosch. 2007. Area management report for the recreational fisheries of Anchorage, 2005 and 2006. Alaska Department of Fish and Game, Fishery Management Report No. 07-53, Anchorage
Moffitt, S., Marston, B., and Miller, M. 2002. Summary of eulachon research in the Copper River delta, 1998-2002. Regional Information Report No. 2A02-34. Anchorage: Alaska Department of Fish and Game
Sigler, M.F., Womble, J.N., Vollenweider, J.J. 2004. Can. J. Fish. Aquat. Sci. 61: 1475–1484 (2004) Spangler, E. K., Spangler, R. E. and B. L. Norcross. 2003. Eulachon subsistence use and ecology investigations. USFWS Office
of Subsistence Management, Fisheries Resource Monitoring Program, Final Report No. 00-041, Anchorage, Alaska D. Bosch, ADF&G, personal communication. M. Miller, ADF&G, personal communication. S. Moffit, ADF&G, personal communication. T. Tisler, ADF&G, personal communication.
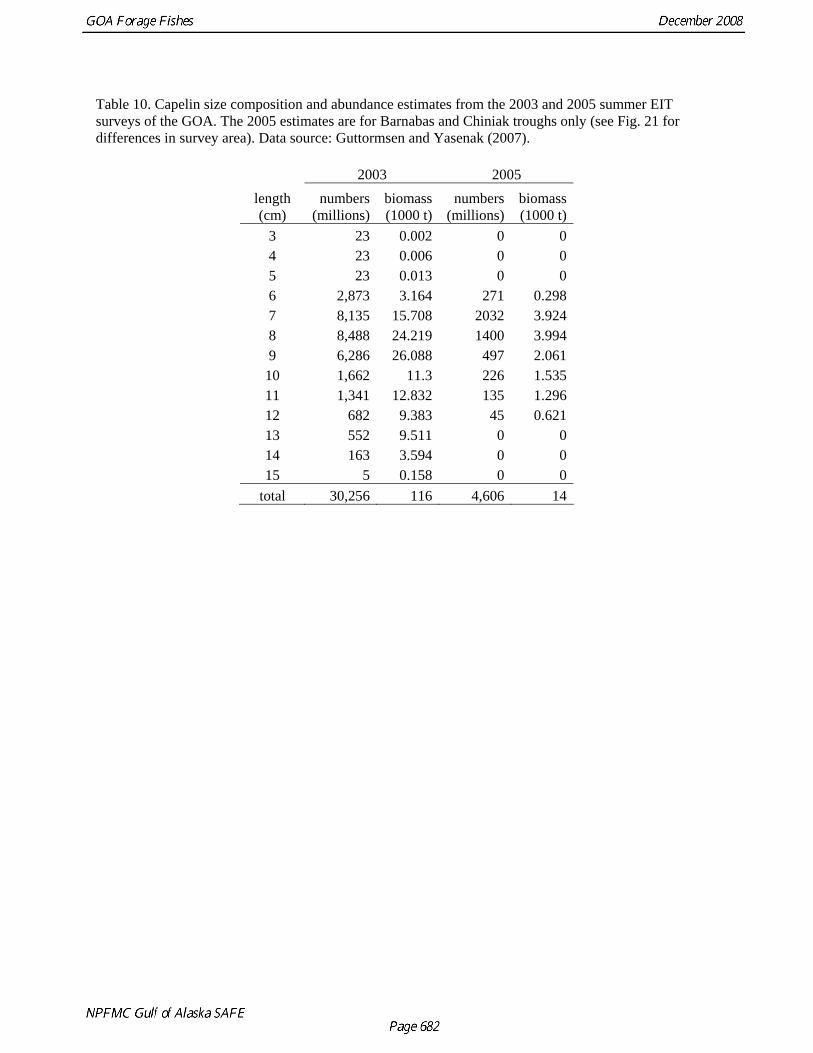
Table 10. Capelin size composition and abundance estimates from the 2003 and 2005 summer EIT surveys of the GOA. The 2005 estimates are for Barnabas and Chiniak troughs only (see Fig. 21 for differences in survey area). Data source: Guttormsen and Yasenak (2007).
2003 2005 length (cm)
numbers (millions)
biomass (1000 t)
numbers (millions)
biomass (1000 t)
3 23 0.002 0 04 23 0.006 0 05 23 0.013 0 06 2,873 3.164 271 0.2987 8,135 15.708 2032 3.9248 8,488 24.219 1400 3.9949 6,286 26.088 497 2.061
10 1,662 11.3 226 1.53511 1,341 12.832 135 1.29612 682 9.383 45 0.62113 552 9.511 0 014 163 3.594 0 015 5 0.158 0 0
total 30,256 116 4,606 14

Table 11. Mean CPUE (kg/km2) of capelin in the ADF&G/NMFS small-mesh survey.
capelin mean CPUE (kg/km2)
Marmot
Bay Kiliuda
Bay
Two-Headed Gully
Alitak Bay
Chignik-Castle Bays
Kuiukta Bay
Pavlof Bay
1972 23.68 1973 15.42 5.05 2.10 1974 3.47 0.17 20.69 1975 0.35 0.00 16.23 1976 1.85 9.84 3.01 0.00 6.32 1.41 12.44 1977 2.67 0.06 0.00 17.01 1978 1.84 0.52 0.05 1.28 2.77 0.72 1979 9.43 13.20 9.13 7.67 6.86 1980 45.78 0.30 2.37 11.15 0.00 0.00 22.40 1981 0.20 0.06 0.06 8.36 0.06 0.00 3.02 1982 5.39 0.04 0.08 1983 0.00 0.04 0.05 1984 0.72 0.02 0.00 0.42 0.00 0.01 1985 0.04 0.00 0.00 0.10 0.03 1986 0.00 0.00 0.05 0.48 0.08 0.00 0.26 1987 0.01 0.00 0.00 0.00 0.00 1988 0.03 1989 0.02 0.00 0.00 0.00 0.04 0.00 0.04 1990 0.04 1991 0.05 1992 0.03 0.00 0.09 0.03 0.18 0.00 0.00 1993 0.00 1994 0.00 1995 0.04 0.00 0.00 0.16 0.00 0.12 0.00 1996 0.00 1997 0.05 1998 0.00 0.00 0.00 0.05 0.03 1999 0.00 2000 0.00 2001 0.07 0.00 0.01 0.14 0.00 2002 0.00 0.00 0.04 0.00 0.00 2003 0.01 0.00 0.02 0.01 0.00 2004 0.00 0.00 0.00 0.07 2005 0.06 0.00 0.06 0.00 0.01 2006 0.00 0.00 0.00 0.03 2007 0.02 0.00 0.00 0.01 0.00
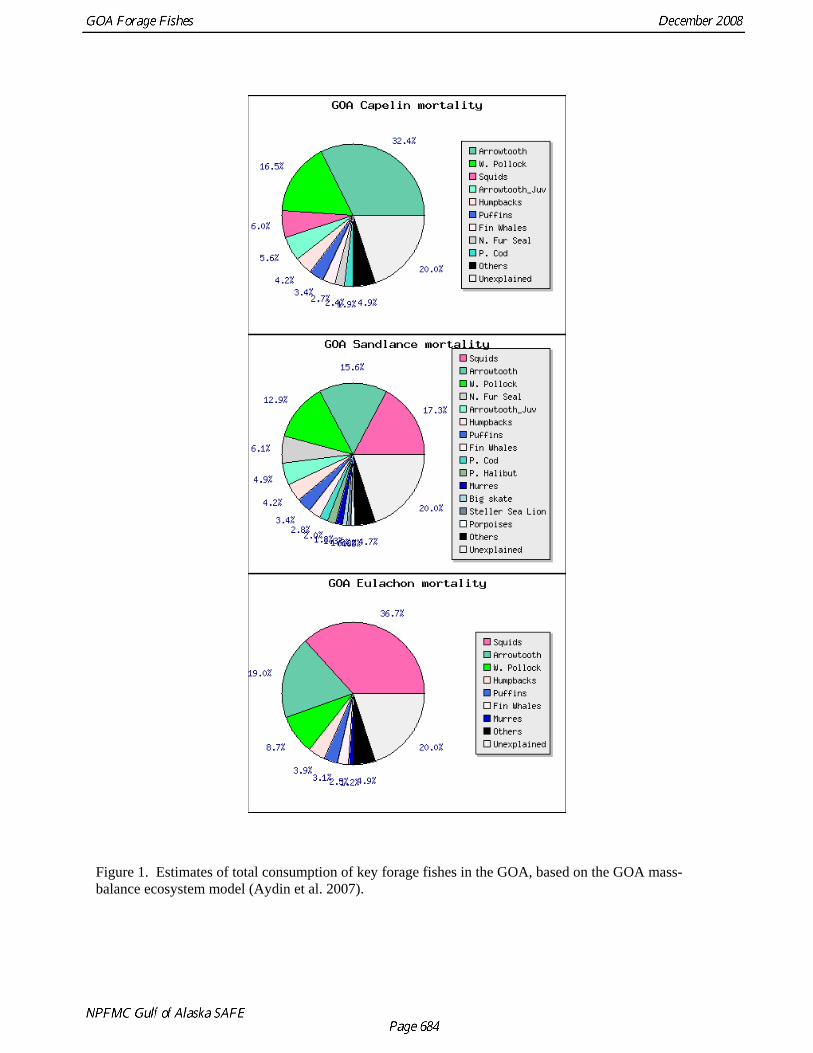
Figure 1. Estimates of total consumption of key forage fishes in the GOA, based on the GOA mass-balance ecosystem model (Aydin et al. 2007).

Figure 2. Map of the western GOA showing locations sampled during ADF&G/NMFS small-mesh bottom trawl surveys. Numbers correspond to these locations: 1) Marmot Bay; 2) Kiliuda Bay; 3) Two-Headed Gully; 4) Alitak Bay; 5) Chignik-Castle Bays; 6) Kuiukta Bay; 7) Pavlof Bay.

Figure 3. Map of Alaska showing known sites of eulachon spawning runs. Southeast Alaska is not shown but supports multiple eulachon spawning runs. Asterisks indicate multiple spawning sites at that location. Figure is from Willson et al. 2006.

0
1,000
2,000
3,000
4,000
5,000
6,000
7,000
8,000
1980 1985 1990 1995 2000 2005 2010
year
biom
ass
(t)
0
20,000
40,000
60,000
80,000
100,000
120,000
eula
chon
bio
mas
s (t)
capelinsandfishStichaeidaeeulachon
Figure 4. Biomass estimates of forage fish species in the GOA from the GOA bottom trawl groundfish survey. Note that eulachon values are on a separate axis because they are so much larger than the values for other species. Data source: RACE database.

0%
5%
10%
15%
20%
25%
30%
1980 1985 1990 1995 2000 2005 2010
year
% e
ulac
hon
0
500,000
1,000,000
1,500,000
2,000,000
2,500,000
3,000,000
pollo
ck b
iom
ass
estim
ate
(mt)
% eulachon% capelinEIT pollock estimate
Figure 5. Eulachon and capelin catch in GOA EIT survey hauls as a percentage of pollock catch, and EIT pollock biomass estimates (t). Data source: RACE database.
0
20
40
60
80
100
120
140
1994 1996 1998 2000 2002 2004 2006 2008 2010
year
mea
n C
PUE
(kg/
hr)
Figure 6. Mean eulachon CPUE (kg/hr) in GOA EIT survey hauls employing Aleutian wing trawl sampling gear. Data source: RACE database.

0
10
20
30
40
50
60
1972
1974
1976
1978
1980
1982
1984
1986
1988
1990
1992
1994
1996
1998
2000
2002
2004
2006
year
mea
n eu
lach
on C
PUE
(kg/
km^2
)Pavlof BayKuiukta BayChignik-Castle BaysAlitak BayTwo-Headed GullyKiliuda BayMarmot Bay
Figure 7. Mean CPUE (kg/km2) of eulachon in the seven sites sampled during ADF&G/NMFS small-mesh surveys. Data source: D. Urban, AFSC.

Figure 8. Eulachon CPUE (kg/hr) during the 2005 GOA EIT survey. Summer hauls in red; winter hauls in light blue. Data source: RACE database.

Figure 9. Eulachon catch during GOA EIT surveys from 1981-1989, shown as a percentage by weight of pollock caught in each haul. Data are from all hauls regardless of gear type. Grey outline indicates 200 m depth contour demarking Shelikof gully. Data source: RACE database.

Figure 10. Eulachon catch during GOA EIT surveys from 1990-1999, shown as a percentage by weight of pollock caught in each haul. Data are from all hauls regardless of gear type. Grey outline indicates 200 m depth contour demarking Shelikof gully. Data source: RACE database.
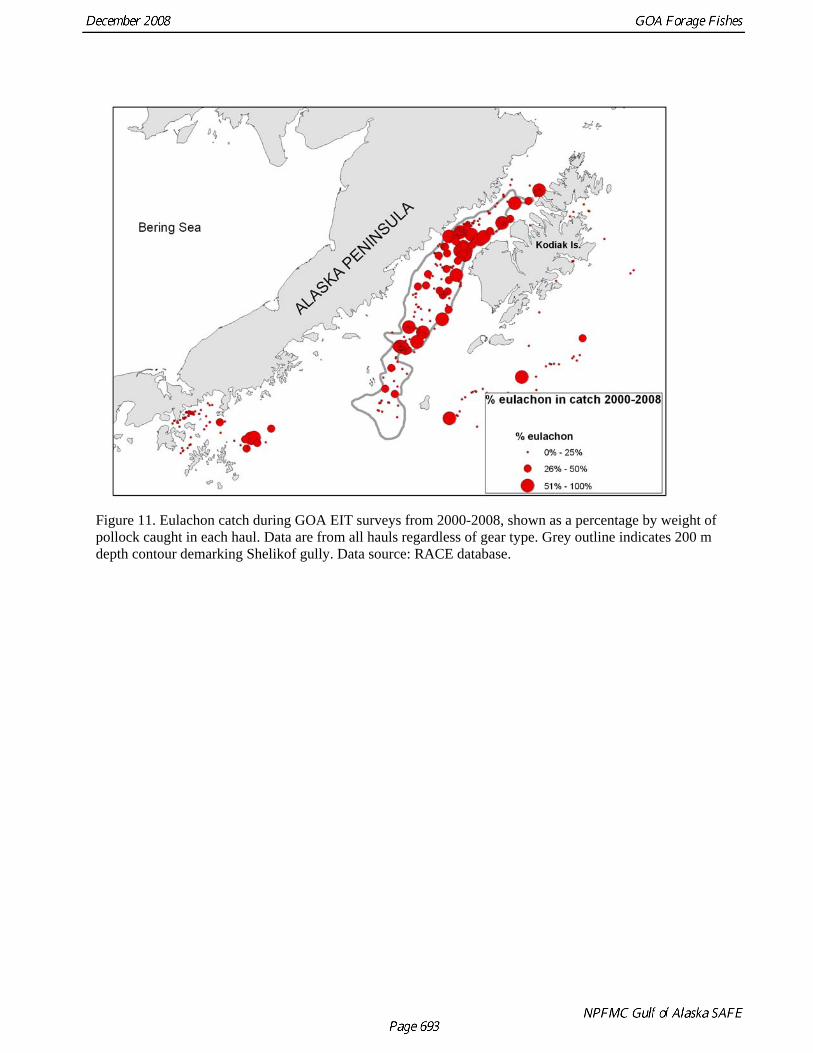
Figure 11. Eulachon catch during GOA EIT surveys from 2000-2008, shown as a percentage by weight of pollock caught in each haul. Data are from all hauls regardless of gear type. Grey outline indicates 200 m depth contour demarking Shelikof gully. Data source: RACE database.

0
100
200
300
400
500
600
700
800
900
1996 1998 2000 2002 2004 2006 2008 2010
year
catc
h (t)
capelineulachonsmelt
Figure 12. Incidental catches of eulachon and capelin in the GOA, 1997-2008. Eulachon and capelin are often identified as “smelts”; consistent species identification began in 2005. Data source: AKRO Blend and CAS.

A
Kodiak
B
Kodiak
Figure 13. (A) Mean incidental catches of eulachon in all GOA groundfish fisheries during 1990-1999. Each grid cell (25 km X 25 km) shows the mean catch for that area. (B) Number of observed pollock hauls in each grid cell during 1990-1999. Data are from the AFSC Fisheries Monitoring and Analysis program, and each grid cell contains at least three hauls.
A
Kodiak
B
Kodiak
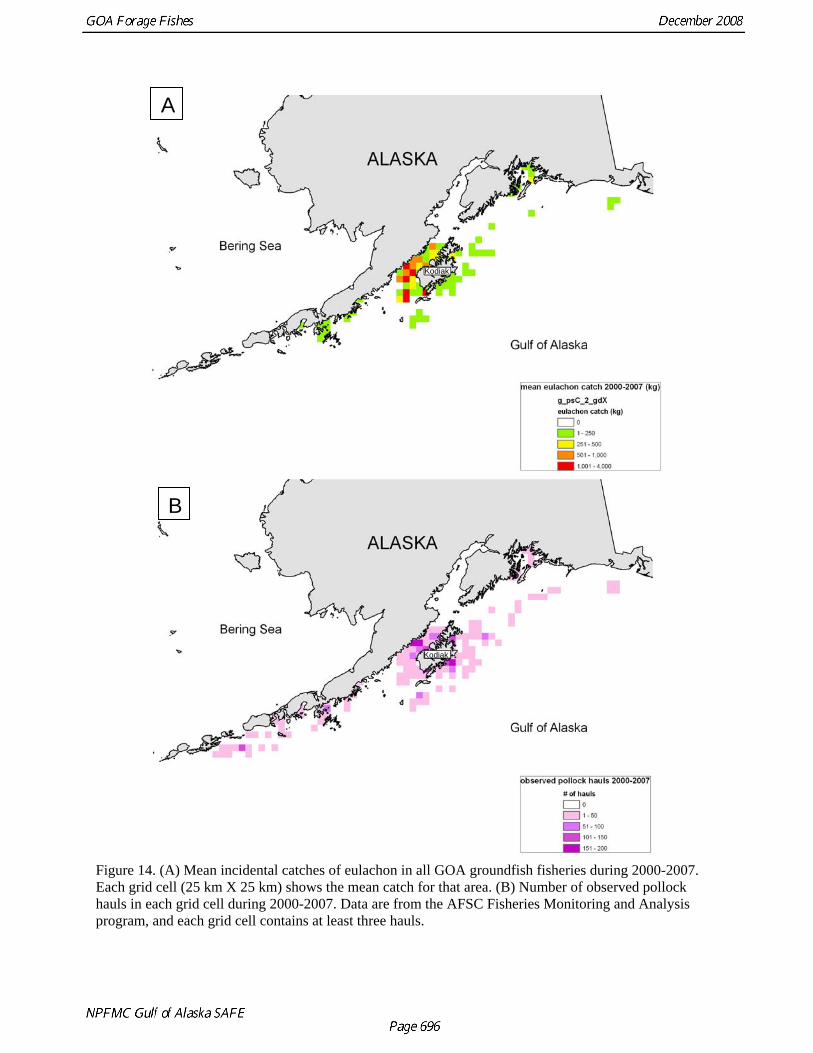
Figure 14. (A) Mean incidental catches of eulachon in all GOA groundfish fisheries during 2000-2007. Each grid cell (25 km X 25 km) shows the mean catch for that area. (B) Number of observed pollock hauls in each grid cell during 2000-2007. Data are from the AFSC Fisheries Monitoring and Analysis program, and each grid cell contains at least three hauls.

Kodiak
Figure 15. Mean percentage of eulachon in pollock fishery catches during 1990-2007. Each grid cell (25 km X 25 km) shows the mean percentage for that area. Data are from the AFSC Fisheries Monitoring and Analysis program, and each grid cell contains at least three hauls.

Kodiak 2000Capelin Length Frequency Distribution
0.0% 5.0%
10.0% 15.0% 20.0% 25.0% 30.0% 35.0% 40.0%
6 7 8 9 10 11 12 13 14 15
Length (cm)
Kodiak 2001Capelin Length Frequency Distribution
0.0%
5.0%
10.0%
15.0%
20.0%
25.0%
30.0%
35.0%
6 7 8 9 10 11 12 13 14 15 Length (cm)
Kodiak 2002Capelin Length Frequency Distribution
0.0% 5.0%
10.0% 15.0% 20.0% 25.0% 30.0%
6 7 8 9 10 11 12 13 14 15
Length (cm)
Kodiak 2004Capelin Length Frequency Distribution
0.0%
5.0%
10.0%
15.0%
20.0%
25.0%
30.0%
35.0%
6 7 8 9 10 11 12 13 14 15 Length (cm)
Figure 16. Length compositions of capelin collected during AFSC FIT studies east of Kodiak in August 2000-2004.
0.000
0.050
0.100
0.150
0.200
0.250
0.300
0.350
0.400
0.450
0.500
3 4 5 6 7 8 9 10 11 12 13 14 15
length (cm)
prop
ortio
n
20032005
Figure 17. Length compositions of capelin caught during GOA EIT surveys in 2003 and 2005.
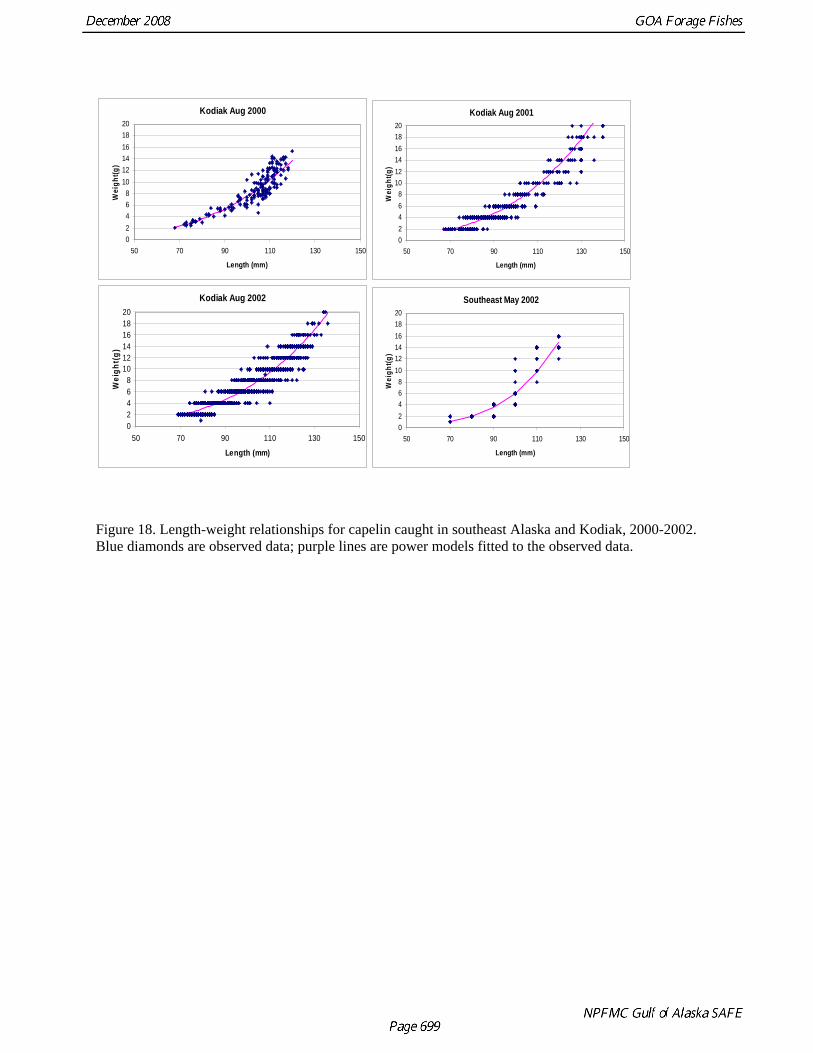
Kodiak Aug 2000
02468
101214161820
50 70 90 110 130 150
Length (mm)
Wei
ght(g
)Kodiak Aug 2001
02468
101214161820
50 70 90 110 130 150
Length (mm)
Wei
ght(g
)
Kodiak Aug 2002
02468
101214161820
50 70 90 110 130 150
Length (mm)
Wei
ght(
g)
Southeast May 2002
02468
101214161820
50 70 90 110 130 150
Length (mm)
Wei
ght(g
)
Figure 18. Length-weight relationships for capelin caught in southeast Alaska and Kodiak, 2000-2002. Blue diamonds are observed data; purple lines are power models fitted to the observed data.

0
20000
40000
60000
80000
100000
120000
140000
160000
180000
1990 1993 1996 1999 2001
Year
Met
ric to
nsArrowtooth flounder
Pacific cod
Pacific halibut
Walleye pollock
Figure 19. Annual trend of population consumption of capelin by four marine fish species in the GOA.
Data source: Yang et al. 2005.

0
10
20
30
40
50
60
70
80
90
1972
1974
1976
1978
1980
1982
1984
1986
1988
1990
1992
1994
1996
1998
2000
2002
2004
2006
year
mea
n ca
pelin
CPU
E (k
g/km
^2)
Pavlof BayKuiukta BayChignik-Castle BaysAlitak BayTwo-Headed GullyKiliuda BayMarmot Bay
Figure 20. Mean CPUE (kg/km2) of capelin in the seven sites sampled during ADF&G/NMFS small-mesh surveys. Data source: D. Urban, AFSC.
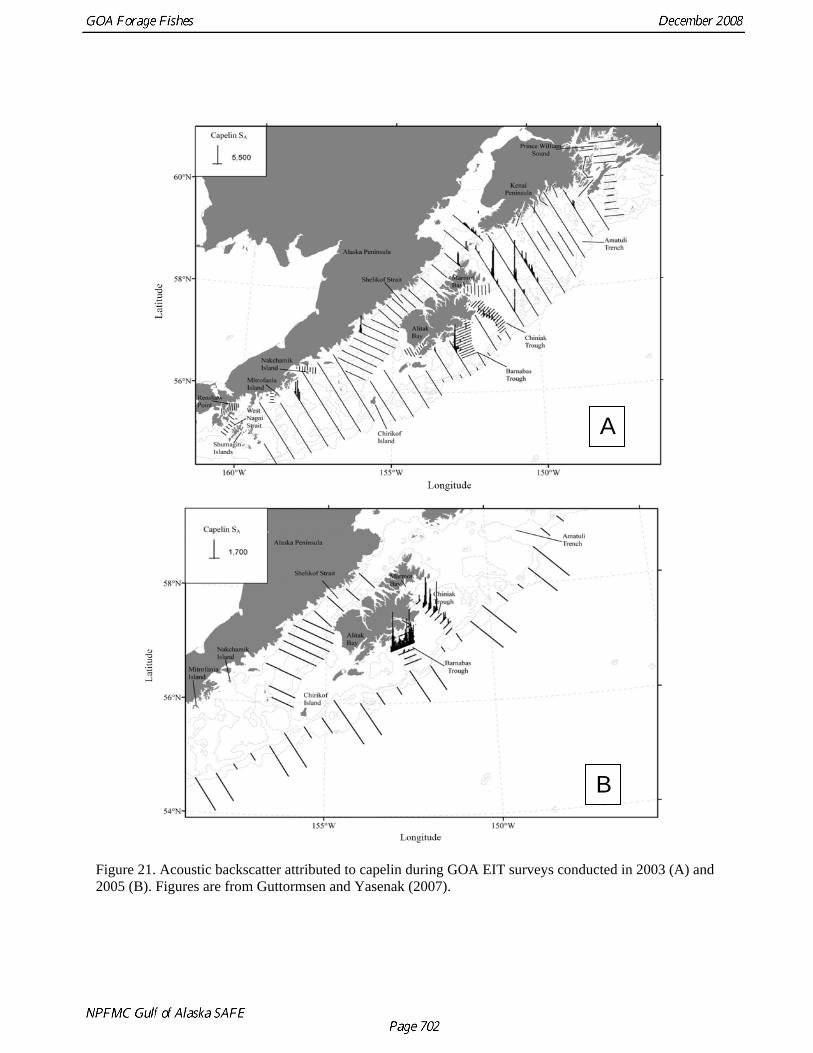
A
B
Figure 21. Acoustic backscatter attributed to capelin during GOA EIT surveys conducted in 2003 (A) and 2005 (B). Figures are from Guttormsen and Yasenak (2007).