appendix 2 - international agency for research on … (1) total2,3.7,8-pcdf isomers, 18 wood clup...
TRANSCRIPT
APPENDIX 2
TABLES ON OCCURRNCE (PCDFs)
~-
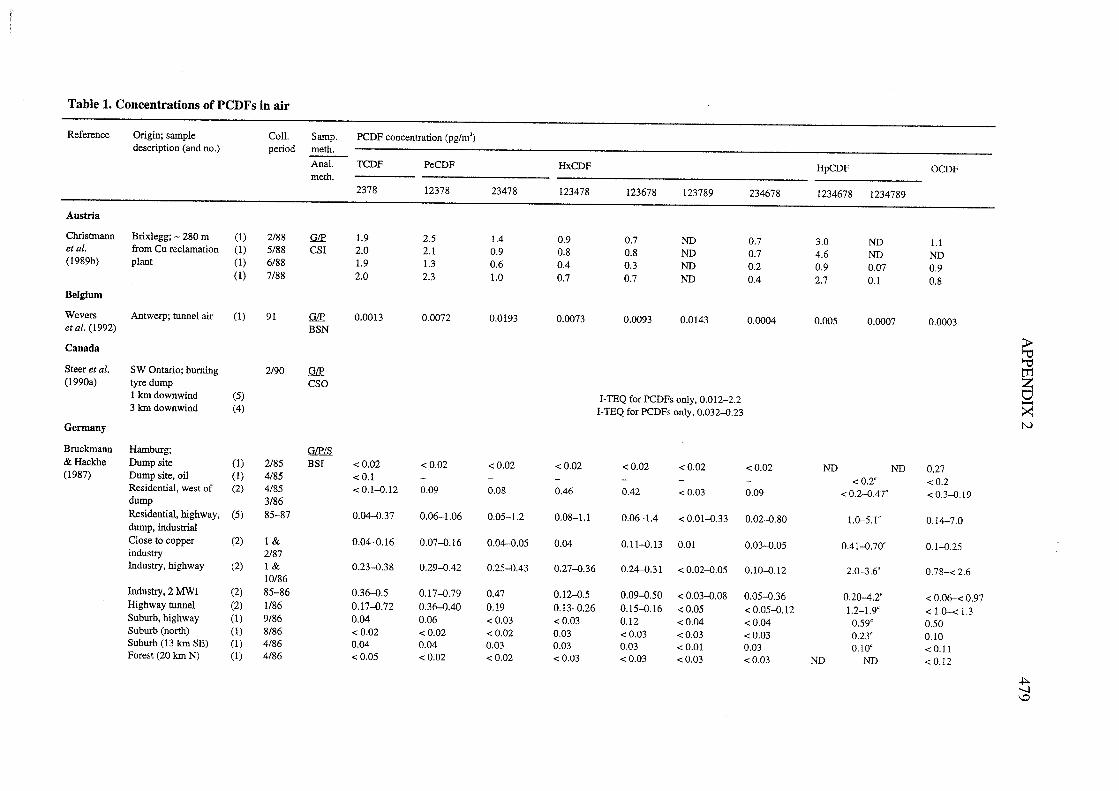
Table 1. Concentrations of PCDFs in air
Reference Origin; sample ColL. Samp, PCDF concentration (pg/m')description (and no,) period meth.
AnaL. TCDF PeCDF HxCDF HpCDF OCDFmeth,
2378 12378 23478 123478 123678 123789 234678 1234678 1234789
Austria
Chrstman Brix1egg; - 280 m (1) 2/88 QL 1.9 2.5 1.4 0,9 0.7 ND 0,7 3,0 ND 1.et al, from Cu reclamation (1) 5/88 CS! 2,0 2.1 0,9 0.8 0.8 ND 0.7 4,6 ND ND(1989b) plant (1) 6/88 1.9 1.3 0,6 0.4 0.3 ND 0,2 0,9 0,07 0,9
(1) 7/88 2.0 2,3 1.0 0.7 0.7 ND 0.4 2,7 0,1 0.8Be1gium
Wevers Antwerp; tunnel ai (1) 91 QL 0,0013 0,0072 0,0193 0,0073 0,0093 0.0143 0.00 0,005 0,0007 0,0003et al. (1992) BSN
;iCanada "ï"ïSteer et al. SW Ontaro; burg 2/90 QL mZ(1990a) tyre dump CSOÜ1 km downwind (5) !-TEQ for PCDFs oruy, 0,012-2,2 -3 km downwind (4) !-TEQ for PCDFs only. O,032-D,23 ~NGermany
Bnickman Hamburg; Qf& Hackhe Dump site (1) 2/85 BS! .:0,02 .:0.02 .: 0,02 .:0,02 .: 0,02 .:0,02 .:0,02 ND ND 0.27(1987) Dump site, oil (1) 4/85 .: 0,1 - - - - - - .:0,2" .:0,2Residential, west of (2) 4/85 .:O,I-D,12 0,09 0,08 0.46 0.42 .: 0,03 0,09 .: O,2-D.47" .:O,3-D,19
dump 3/86Residential, highway, (5) 85-87 0,04,37 0.06- 1.06 0.05-1.2 0.08-1. 0,06-1.4 .: O,Ol-D,33 O,02-D,80 1.0-5,1" 0,14-7.0dump, industralClose to copper (2) 1 & 0.04-.16 0,07-0,16 0,04.05 0.04 0.11-0,13 0,01 O,03-D.05 0.41-D,70" O,I-D.25industr 2/87lndustr, highway (2) 1& 0.23-0.38 O,29-D.42 O,25-D.43 0,27-0.36 0,24-.3 1 .: O,02-D,05 0,10-,12 2,0-3,6" 0,78-. 2,6
10/86lndustr, 2 MW (2) 85-86 0.36-.5 0.1 7-0,79 0.47 0.12-0.5 0,09-0.50 .: 0,03-0,08 0.05-0.36 0,20-.2" .: 0,06- 0,97Highway tunnel (2) 1/86 0.1 7-0,72 0,36-.40 0.19 0,13-0.26 0.15-0.16 .:0.05 .: 0,05-0.12 1.2-1.9" .: 1. 0-.: 1.Suburb, highway (1) 9/86 0,04 0,06 .: 0,03 .: 0,03 0.12 .:0,04 .:0,04 0.59" 0,50Suburb (nort) (1) 8/86 .: 0,02 .:0,02 .: 0,02 0,03 .:0,03 .:0,03 .:0.03 0,23" 0,10Suburb (13 km SE) (1) 4/86 0,04 0,04 0,03 0.03 0,03 .: 0,01 0,03 0,10" .:0,11Forest (20 km N) (1) 4/86 .: 0.05 .:0,02 .:0.02 .:0,03 .:0.03 .:0.03 .:0.03 ND ND .: 0,12
.t..'"
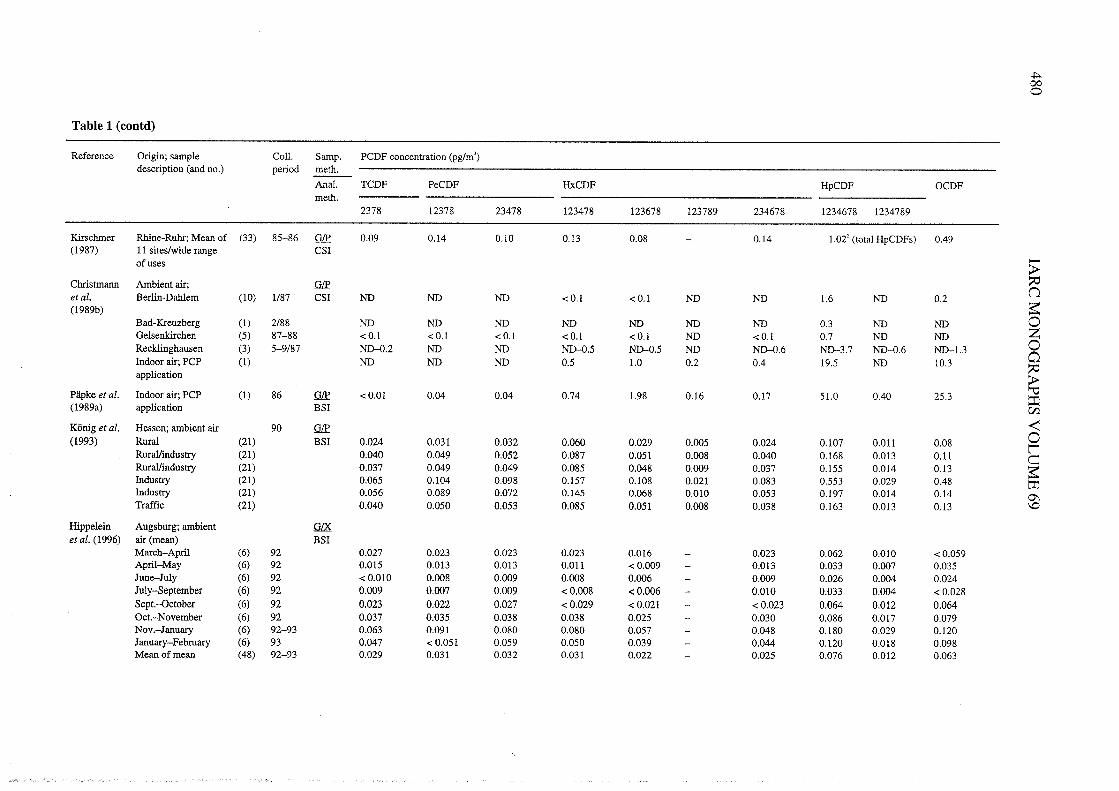
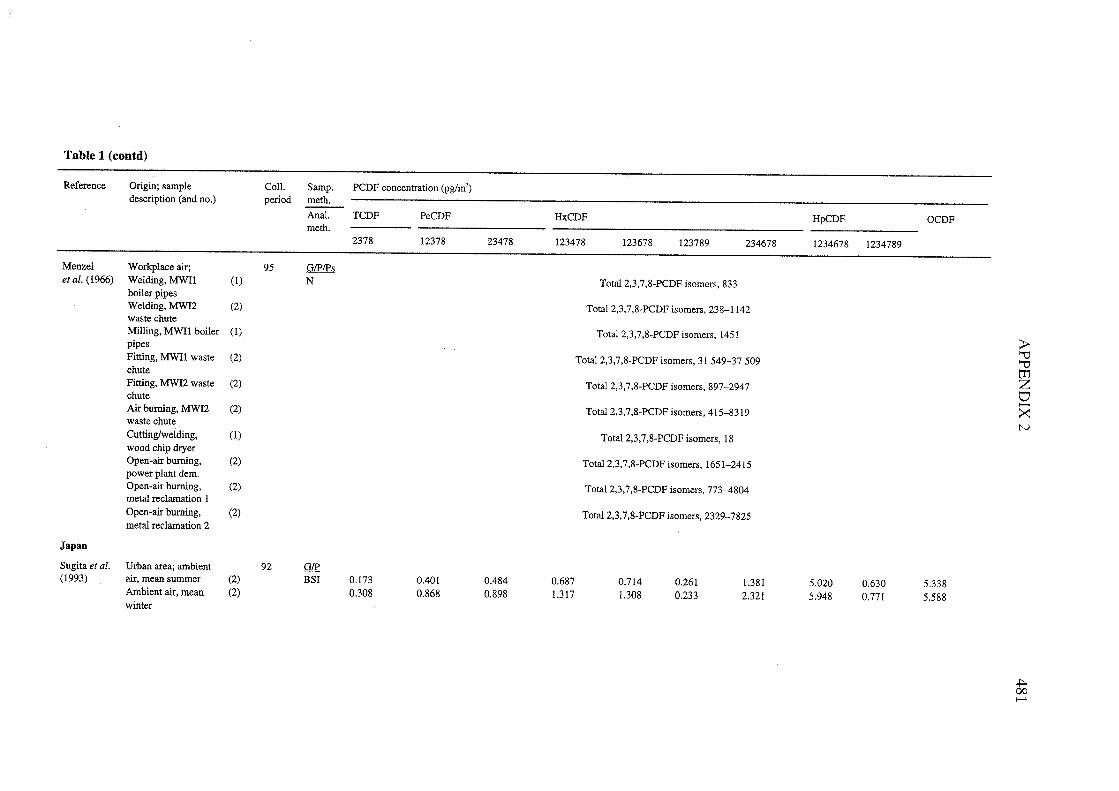
Table 1 (contd)
Reference Origin; sample Coll, Samp, PCDF concentration (pg/m')description (and no.) period meth.
Anal. TCDF PeCDF HxCDF HpCDF OCDFmeth,
2378 12378 23478 123478 123678 123789 234678 1234678 1234789
Menzel Workplace ai; 95 ~et al. (1966) Weldig, MWl (1) N Total2,3,7,8-PCDF isomers, 833
boiler pipesWelding, MW2 (2) TotaI2,3.7,8-PCDF isomers, 238-1142waste chuteMilling, MWIl boiler (1) TotaI2,3,7,8-PCDF isomers, 1451
;¡pipes'"Fittng, MWl waste (2) Total2,3,7,8-PCDF isomers, 31 549-37509 '"chute tT
Fittg, MW2 waste (2) TotaI2,3,7,8-PCDF isomers, 897-2947 Z0chute ..Ai burnng, MW2 (2) Tota2,3,7,8-PCDF isomers, 415-8319 :x
waste chute NCuttng/welding, (1) Total2,3.7,8-PCDF isomers, 18wood clup drer
Open-ai burng, (2) TotaI2,3,7,8-PCDF isomers, 1651-2415power plant dem,Open-air burng, (2) TotaI2,3,7,8-PCDF isomers, 773--804meta reclamation 1Open-ai burnng, (2) Total2,3,7,8-PCDF isomers, 2329-7825metal rec1amation 2
Japan
Sugita et aL. Urban area; ambient 92 G/P(1993) ai, mean summer (2) BSI 0,173 0.401 0.484 0,687 0,714 0,261 1.81 5,020 0,630 5.338
Ambient ai, mean (2) 0.308 0.868 0,898 1.17 1.08 0.233 2,321 5.948 0,771 5.588winter
.l00..
..00N
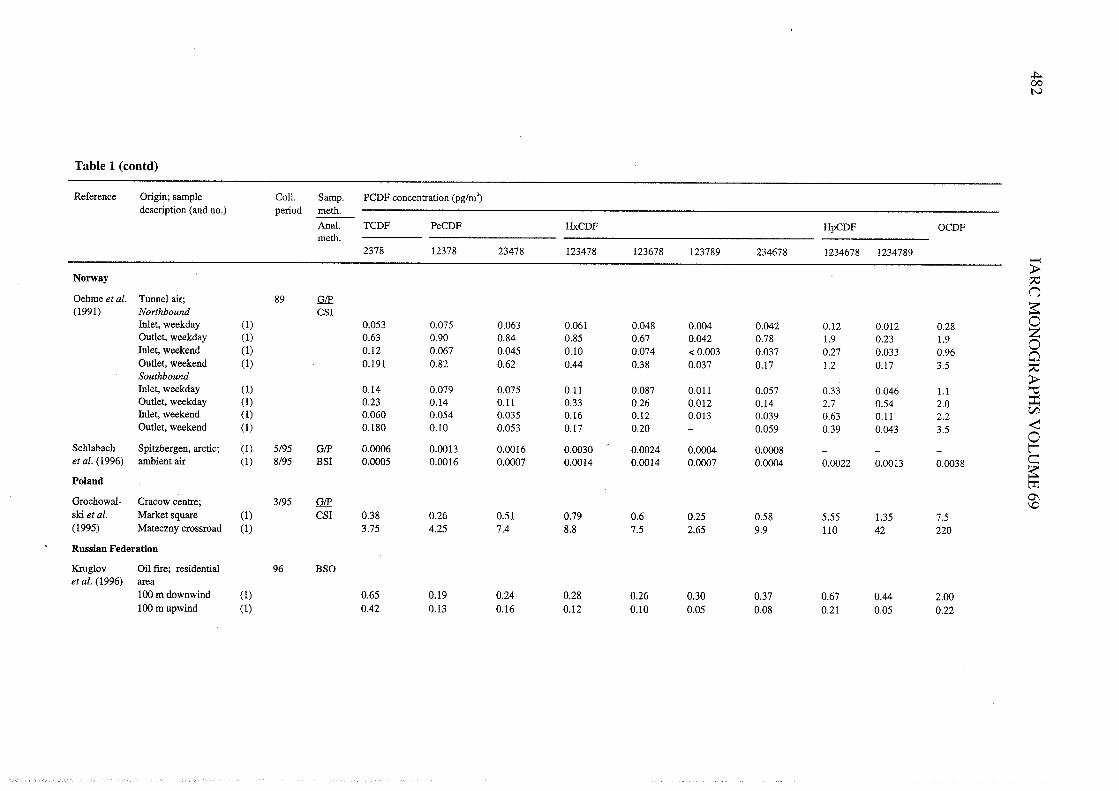
Table 1 (contd)
Reference Origin; sample ColL. Samp, PCDF concentration (pg!m')description (and no,) period meth,
AnaL. TCDF PeCDF HxCDF HpCDF OCDFmeth,
2378 12378 23478 123478 123678 123789 234678 1234678 1234789 -~
Norway ;:(JOehme et al. Tunnel ai; 89 G/P~(1991) Northbound CSI 0Inet, weekday (1) 0.053 0,075 0,063 0,061 0,048 0,00 0,042 0,12 0,012 0,28 ZOutlet, weekday (1) 0,63 0,90 0,84 0,85 0,67 0.042 0,78 1.9 0,23 1.9 0Inet, weekend (1) 0.12 0,067 0,045 0,10 0,074 -:0.003 0,037 0.27 0,033 0,96 0Outlet, weekend (1) 0.191 0,82 0,62 0,44 0.38 0,037 0.17 1.2 0.17 3.5 ;:
Southbound ~Inlet, weekday (1) 0,14 0,079 0.05 0.11 0,087 0,011 0,057 0.33 0.046 1. ""Outlet, weekday (1) 0.23 0,14 0,11 0.33 0,26 0,012 0,14 2,7 0,54 2.0 :=
C/Inlet, weekend (1) 0,060 0,054 0,035 0.16 0.12 0,013 0,039 0,63 0,11 2.2 ~Outlet, weekend (1) 0.180 0,10 0,053 0,17 0.20 - 0,059 0,39 0,043 3,5 0Schlabach Spitzbergen, arctic; (1) 5/95 QL 0.006 0.0013 0,0016 0,0030 0,0024 0.00 0,008 - - - ret aL. (1996) ambient air (1) 8/95 BSI 0.005 0,0016 0.007 0,0014 0,0014 0.007 0,000 0,0022 0,0013 0,0038 c:
~Poland m0\Grochowal- Cracow centre; 3/95 QL \0
ski et al. Market square (1) CSI 0.38 0,26 0.51 0,79 0.6 0.25 0.58 5,55 1.5 7.5(1995) Mateczny crossroad (1) 3.75 4.25 7.4 8,8 7.5 2.65 9,9 110 42 220
Russlan Federation
Krg10v Oil fire; residentia1 96 BSOet aL. (1996) area
100 m downwind (1) 0.65 0.19 0.24 0.28 0,26 0.30 0.37 0.67 0.44 2,00100 m upwind (1) 0.42 0,13 0.16 0.12 0.10 0.05 0.08 0,21 0,05 0.22

r:
Table 1 (contd)
Reference Origin; sample Coll. Samp. PCDP concentration (pglm')description (and no.) period meth,
AnaL. TCDF PeCDF HxCDF HpCDF OCDFmeth,
2378 12378 23478 123478 123678 123789 234678 1234678 1234789
Spai
Abad et al, Catalonia (ambient 93-95 QÆ(1996) ai) BSI
Urban, trafc (8) 0,105 0,055 0.116 1.029 0.05 0,094 0.009 0,298 0.045 0,128Rural, near MWI (12) 0.042 0.012 0,029 0.046 0,027 0.D5 0,00 0.120 0,016 0.126Urban (3) 0.313 0.D0 0.063 0.180 0.073 0.097 ..0.001 0.387 0,043 1.213Urban (3) 0,273 0,020 0,047 0.127 0.050 0.077 0,003 0,287 0,033 1.810MW infuence (2) 0.535 0,115 0,230 0.595 0.210 0.315 0,015 3.425 0,335 126,8Industral, MW (3) 0.377 0,027 0,127 0.413 0,217 0.387 O.oO 1.80 0,200 4.090infuence, traffcHeavy industr near (2) 0,205 0.ü5 0,035 0.080 0,030 0,040 ..0.001 0.220 0.020 1.50 ;:MW (2) 0,350 0.225 0.410 0.480 0.425 0.450 O.oO 1.00 0,110 0,755 "'
"'Sweden tr
ZRappe et al, Rörvik; ambient ai Q 0..(1989a) Wind WSW (1) 9/85 BSI .. 0.003 0.002 0,002 0.002 0,002 .. 0,001 0,002 0,024' (total HpCDFs) 0,026 ~
(1) 1/86 0,005 0,007 0,006 0,008 0,008 0,003 0,007 0.120' (total HpCDFs) 0.100 NWindW,N&E (1) 1/86 0.ü5 0.018 0,027 0.021 0,017 0.00 0.ü8 0.190' (total HPCDFs) 0,270WindE&N (1) 1/86 0.062 0,058 0,069 0,038 0,033 0,014 0,032 0,500" (total HpCDFs) 0,440Wind SE (1) 2/86 0.008 0.011 0,009 0.011 0,011 0,00 0.ü5 0,200' (total HpCDFs)Wind NE (1) 2/86 0,016 0,017 0.ü8 0,014 0,014 0,003 0.017 0,200' (total HpCDFs) 0,140Gothenburg; ambient ai
WindW,N &E (1) 1/86 0.D0 0,039 0,051 0.023 0.ü0 0,004 0.ü0 0.200' (total HpCDFs) 0.150WindE&N (1) 1/86 0.240 0,190 0,240 0.100 0,079 0,0017 0,084 1100' (total HpCDFs) 0.480Wind SE (1) 2/86 0.011 0.019 0,021 0,019 0,018 0,006 0,022 0,260' (total HpCDFs) 0,360
United Kigdom
Clay ton Ambient; l'et al. (1993) Cardif (42) 1/91- B Mean (range) 2,3,7,8-isomers, 0,78 (ND-11)
9/92Manchester (43) 3/91- Mean (range) 2,3,7.8-isomers, 1. (ND-18)
9/92London (43) 1/91- Mean (range) 2,3,7.8-isomers, 0.48 (ND7, 1)
11/92Stevenage (43) 1/91- Mean (range) 2,3,7,8-isomers, 0,36 (ND7.)
4/92 .t00W
.¡00.¡
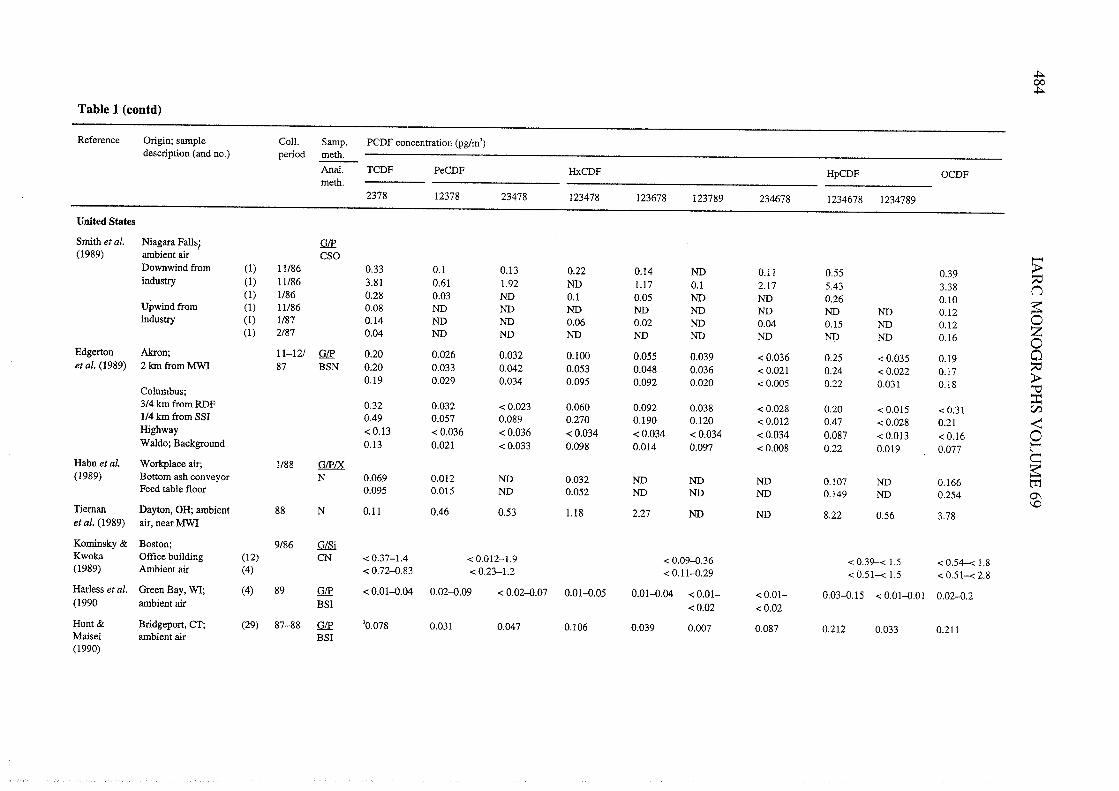
Table 1 (contd)
Reference Origin; sample ColL. Samp. PCDF concentration (pg!m')description (and no,) period meth,-
Anal, TCDF PeCDF HxCDF HpCDF OCDFmeth,
2378 12378 23478 123478 123678 123789 234678 1234678 1234789
United States
Sfith et aL. Niagara Falls; QL(1989) ambient ai CSO -
;iDownwid from (1) 11/86 0.33 0,1 0.13 0.22 0.14 ND 0.11 0,55 0,39 ~industr (1) 11/86 3.81 0,61 1.92 ND 1.7 0.1 2.17 5.43 3.38 n(1) 1/86 0,28 0,03 ND 0.1 0,05 ND ND 0,26 0,10 ~Upwind from (1) 1186 0,08 ND ND ND ND ND ND ND ND 0,12 0industr (1) 1/87 0,14 ND ND 0,06 0,02 ND 0,04 0,15 ND 0,12 Z(1) 2/87 0.04 ND ND ND ND ND ND ND ND 0,16 0Edgerton Akon; 11-121 QL 0,20 0.026 0,032 0.100 0.055 0,039 ~ 0.036 0,25 ~ 0.035 0.19 aet al. (1989) 2 km from MW 87 BSN 0,20 0,033 0,042 0,053 0,048 0.036 ~O,021 0,24 ~ 0,022 0,17 ~
;i0,19 0,029 0,034 0,095 0.092 0,020 ~ 0,005 0,22 0,031 0,18 '"Columbus; :i3/4 km from RDF 0.32 0,032 ~ 0,023 0,060 0.092 0.ü8 ~ 0,028 0,20 ~ 0.015 ~ 0.31 CI1/4 km from SSI 0.49 0,057 0.089 0,270 0.190 0,120 ~0.012 0.47 ~ 0.028 0.21 ~Highway ~ 0.13 ~ 0.036 ~ 0,036 ~ 0.034 ~ 0,034 ~ 0.034 ~ 0.034 0,087 ~ 0,013 ~ 0.16 0Waldo; Background 0,13 0.021 ~ 0.033 0,098 0,014 0.097 ~ 0.008 0,22 0,019 0.077 l'
c:Hah et al. W orkplace alr; 1/88 Qæ ~(1989) Bottom ash conveyor N 0.069 0.012 ND 0,032 ND ND ND 0,107 ND 0,166 trFeed table floor 0.095 0.û5 ND 0,052 ND ND ND 0,149 ND 0,254 0'\0Tiernan Dayton, OH; ambient 88 N 0.1 1 0.46 0,53 1.8 2.27 ND ND 8,22 0,56 3,78
et al. (1989) ai, near MW
Kofinsky & Boston; 9/86 QLKwoka Offce buildig (12) CN ~ 0.37-1.4 ~ 0,012-1.9 ~ 0,09...36 ~ 0,39-~ 1.5 ~ 0,54- i ,8(1989) Ambient ai (4) ~ O,72~,83 ~ 0.23-1.2 ~0,11~.29 ~ O,51-~ 1. ~ 0.51-- 2,8
Harless et al. Green Bay, WI; (4) 89 QL ~ 0.01-0.04 O,02~.09 ~ 0,02-0.07 0,01-0,05 0.01-0.04 ~O,OI- ~O,OI- 0,03-0.15 .: 0,01-0,01 0,02-0,2(1990 ambient ai BSI ~0.02 ~0.02Hunt & Bridgeport, CT; (29) 87-88 QL '0,078 0.ü1 0,047 0,106 0,039 0.007 0,087 0.212 0,033 0,211Maise1 ambient ai BSI(1990)

Analytcal methods: Al analyses use high-resolution gas chromatography; B, high-resolution mass speetrometr; C, low-resolution mass speetrometr; l, isomer-specifie; 0, others; N, no information; S, sophistieatedclean-up (see Table 5 and Section UA in monograph on PCDDs in ths volume)Sampling methods: G, glass fibre fiter; P, polyuethane foam; X, XA; C, carbon; Si. silea; Ps, personal samplingND. not deteeted; MW, municipal waste incinerator; SSI, sewage sludge incinerator; RDF, refuse-derived fuel incineratorData presented are means, Figures in parentheses are ranges. Levels of eongeners not deteeted at known deteetion limits (for examples, 0.02 pglm') are presented as -0 0,02, Contais non-toxie isomersb Including non-2,3,7,8-substituted isomers
.t00VI
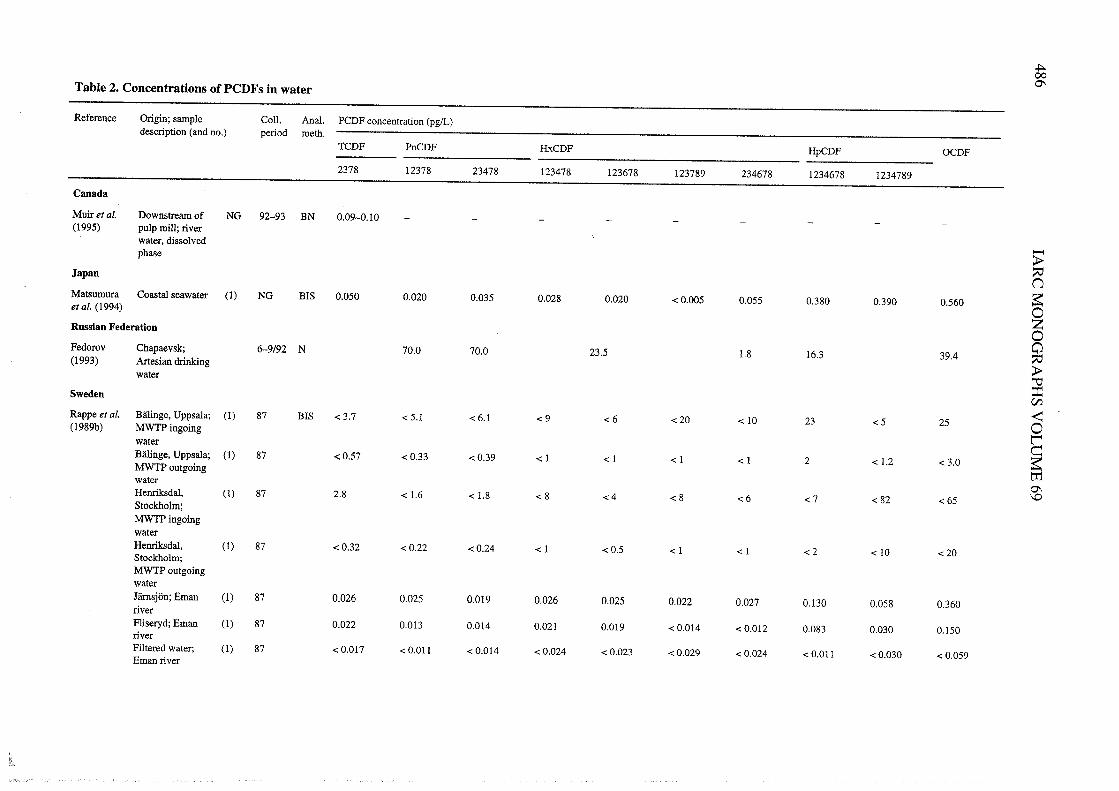
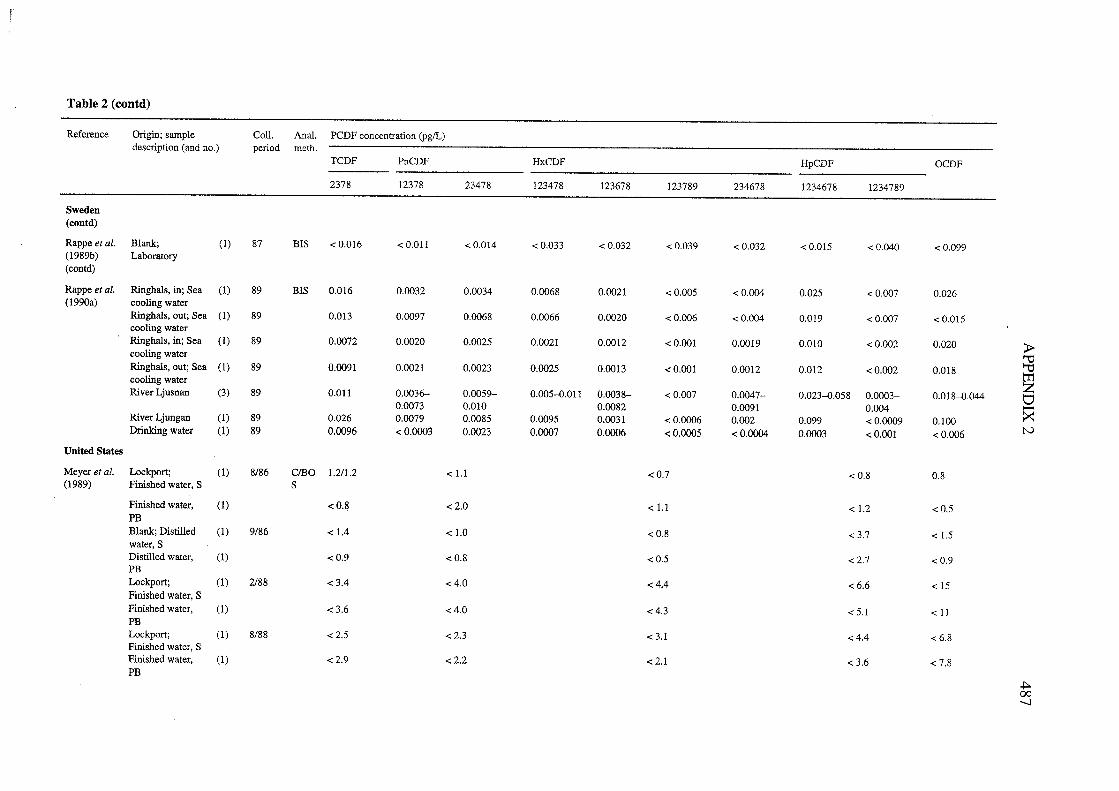
Table 2 (contd)
Reference Orgi; sample Coll, Anal, PCDF concentration (pg/L)descrption (and no,) period meth.
TCDF PnCDF HxCDF HpCDF OCDF-2378 12378 23478 123478 123678 123789 234678 1234678 1234789
Sweden( contd)
Rappe et aL. Blan; (1) 87 BIS .: 0,016 .: 0,011 .: 0,014 .: 0,033 .: 0,032 .: 0,039 .: 0,032 .: 0.05 .: 0,040 .: 0,099(1989b) Laboratory
( contd)
Rappe et aL. Righals, in; Sea (1) 89 BIS 0,016 0,0032 0,0034 0,0068 0.0021 .: 0.005 .: 0.00 0.025 .: 0,007 0,026(1990a) cooling water
Righals, out; Sea (1) 89 0.013 0.0097 0,0068 0,0066 0.0020 .: 0,00 .: 0,00 0,019 .: 0,007 .: 0.05coolig water
Ringhals, in; Sea (1) 89 0.0072 0,0020 0,0025 0,0021 0,0012 .: 0.001 0,0019 0.00 .: 0,002 0,020
~cooling waterRighals, out; Sea (1) 89 0,0091 0,0021 0.0023 0.0025 0,0013 .: 0.001 0.0012 0,012 .: 0.002 0.08 '\trcooling water
ZRiver Ljusnan (3) 89 0,011 0.0036- 0.0059- 0,005-0,011 0,0038- .: 0,007 0.007- 0,023-0.058 0,003- 0.08-0,04 V0,0073 0.00 0,0082 0,0091 0,00 ..River Ljungan (1) 89 0,026 0.0079 0,0085 0.0095 0.0031 .: 0.006 0,002 0,099 .: 0.009 0.100 ~Drnkng water (1) 89 0.0096 .: 0,003 0,0023 0.007 0.00 .: 0,005 .: 0,00 0,003 .: 0,001 .: 0.006 N
United States
Meyer et aL. Lockport; (1) 8/86 ClEO 1.2/1.2 .: 1. .: 0.7 .: 0,8 0,8(1989) Finished water, S S
Finished water, (1) .: 0.8 .: 2.0 .: 1. .: 1.2 .: 0.5PBBlan; Distilled (1) 9/86 .: 1.4 .: 1.0 .: 0,8 .: 3,7 .: 1.water, S
Distilled water, (1) .: 0,9 .: 0,8 .: 0,5 .: 2,7 .: 0.9PBLockport; (1) 2/88 .: 3.4 .: 4.0 .: 4.4 .: 6.6 .:5Finished water, SFinished water, (1) .: 3.6 .: 4,0 .: 4.3 .: 5,1 .: IIPBLockport; (1) 8/88 .: 2.5 .: 2.3 .: 3.1 .: 4.4 .: 6.8Finished water. S
Finshed water, (1) .: 2.9 .: 2,2 .: 2.1 .: 3.6 .: 7,8PB
.t00-.

Table 2 (contd)
Reference Orgin; sample
description (and no,)
ColL.
periodAnaL. PCDF concentration (pgI)meth.
TCDF PnCDF-2378 12378 23478
United States (contd)
Meyer et aL. 19 other (19) 86-87 ND ND (0,3-2,7)(1989) locations; (0.3-2,6)( contd) Finished water, S
Finished water, (19) ND ND (0,4-2.6)PB (0.3-2,7)
HxCDF HpCDF OCDF
123478 123678 123789 234678 1234678 1234789
ND (0.3-1.) ND (0,8--,8) ND (0,6-8,6)
ND (0.3-1.7) ND (0,7-12.4) ND (0,5--8)
Analytical methods: AIl analyses use high-resolution gas chromatography; B, high-resolution mass spectrometr; N, no information; C, low-resolution mass spectrometry; J, isomer-specific; 0, others; S, sophisticatedclean-up (see Table 5 and Section 1..4 in monograph on PCDDs in ths volume)ND, not detected; detection limit in parentheses; MWT, municipal water treatment plant; S, soluble; PB, parcle-boundData presented are means. Figures in parentheses are ranges, Levels of congeners not detected at known detection limits (for examples, 0,02 pg/m') are presented as -0 0.02,
.t0000
-~:;n2:ozoo:;~"i::C/
~ol'C2:m0\\0

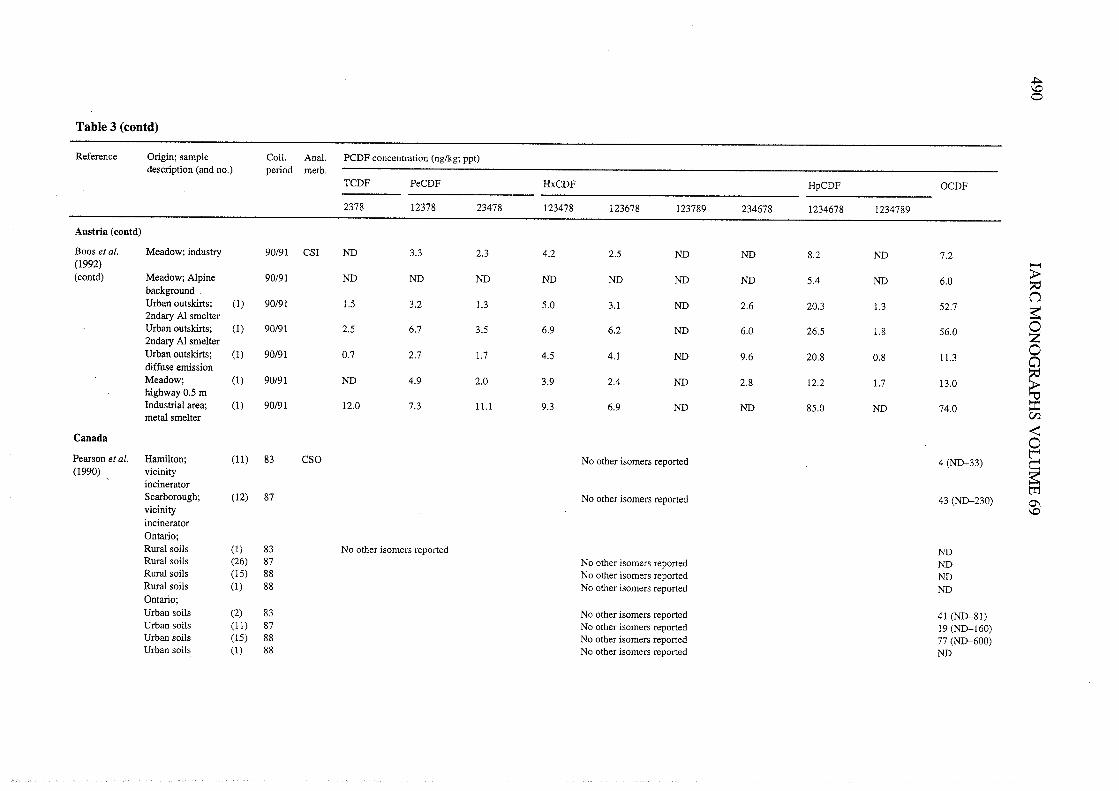
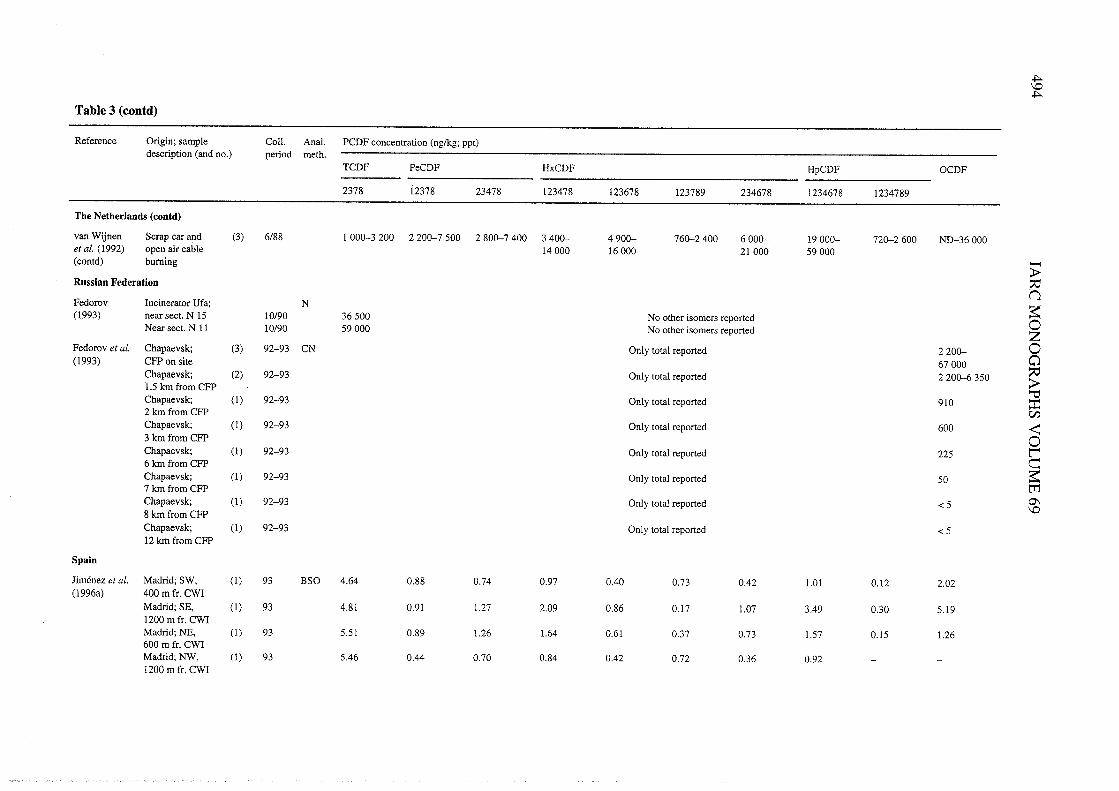
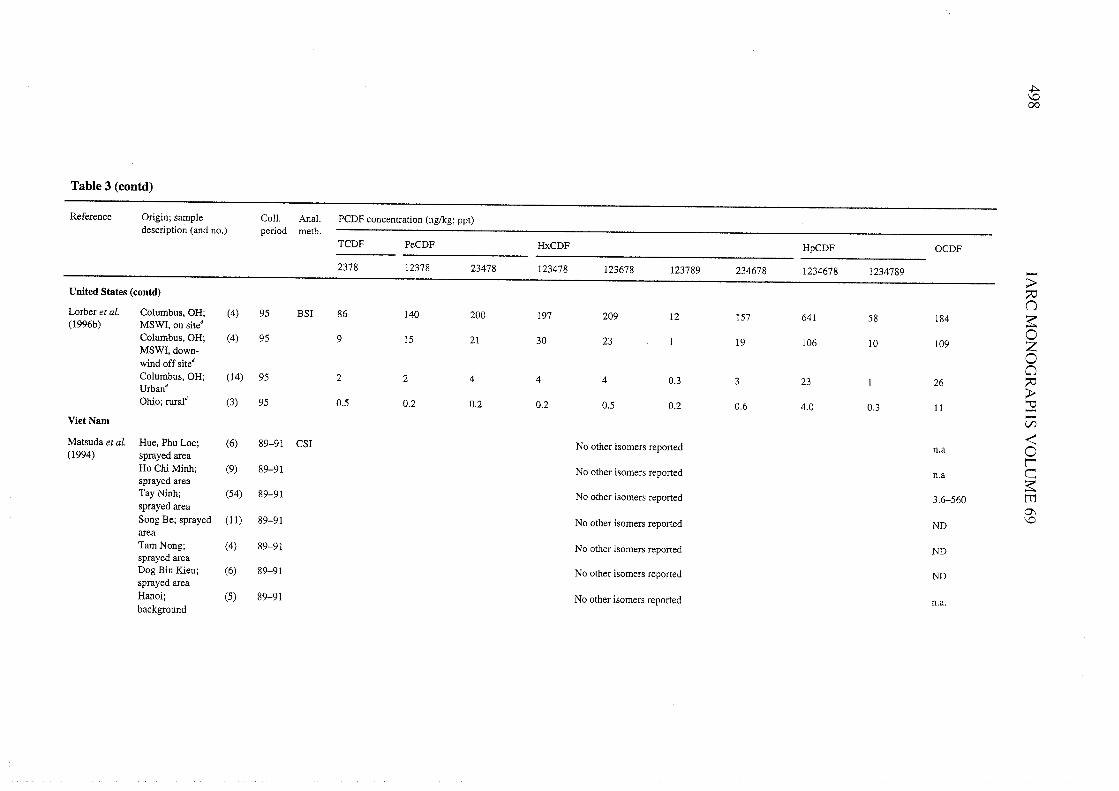
Table 3. Concentrations of PCDFs in soU
Reference Origin; sample Coll, Anal, PCDF concentration (ng!kg; ppt)description (and no,) period meth,
TCDF PeCDF HxCDF HpCDF OCDF-2378 12378 23478 123478 123678 123789 234678 1234678 1234789
Austna
Boos et al. Meadow; urban 90/91 CSI ND 3,0 1. 6.4 2,2 ND 1.9 11. ND 12,1(1992) euussion
Park; urban 90/91 ND 2.6 1. 3.3 2,1 ND ND 9,8 0,5 10,2euussÍonTraffc Ísland; 90/91 3,0 6.5 2,7 11. 4.3 ND ND 38,3 2,9 30,1heavy !rfflc
Meadow; urban 90/91 6.1 4.2 2.2 2,7 3,6 ND 1.8 15,9 1.4 27,2euussÍonMeadow; urban 90/91 ND 2,6 ND 1. 2,1 ND 2,5 12.4 0,5 26,1euussion
;pMeadow; urban 90/91 ND 3,3 1.6 7.1 2,9 ND 2,8 16,6 1.8 20,9 'ieuussion 'i
tTMeadow; urban 90/91 ND 1. ND 2,5 1.5 ND 3,9 26,2 4.2 45.6 ZeuussÍon 0Park; urban 90/91 1. 1. 1. 3,6 1.9 ND 5.4 12,0 ND 13,3 -euussion ~Meadow; cable 90/91 2.3 4,7 3.3 5,2 4,0 ND 5.5 19,0 1.8 30,1 Nproc. plantMeadow; cable 90/91 3,8 13.4 5.3 14,0 5,2 1. 3,2 18.5 4,1 12,8proc. plantMeadow; cable 90/91 2,2 2,3 2,8 3,2 2,9 ND 5,0 12,7 ND 3,5proc. plantMeadow; diffuse 90/91 ND 2,7 1. 5.1 3,2 2,8 4,1 13,5 ND 10,9euussÍonMeadow; diffse 90/91 ND 2,1 0.6 1.9 0,6 ND ND 3,5 0,6 5,1euussionMeadow; Diffuse 90/91 ND 2.4 0,7 ND ND ND ND 3.1 1. 4,6emissionjhighway 100 mMeadow; diffuse 90/91 1.9 1.4 0.6 1.4 1.2 ND ND 5.2 0,5 5,1emission,highway 200 mMeadow; steel 90/91 ND 1. 0.8 1.8 0,8 ND 1.0 5,9 0,6 10,8foundryMeadow; steel 90/91 2.4 1.8 1.6 1.0 0,6 ND 1.2 5,7 0.5 6,8foundry
.t00\0


.t\0N
Table 3 (contd)
Reference Origin; sample ColL. AnaL. PCDF concentration (ng/kg; ppt)description (and no.) period meth,
TCDF PeCDF HxCDF HpCDF OCDF-2378 12378 23478 123478 123678 123789 234678 1234678 1234789
Germany (contd)
Schlesing Herbic. plant; (1) 0( 89 TCDF-HpCDF only totals reported - ..;i(1989) (contd) Boring d, 9 m ::
Hagenmaier Rastatt; site 1 (1) 87 BSI 24 25 20 36 21 4 18 110 12 80 \.et aL. (1992) (1) 89 16 33 18 41 25 4 17 62 12 100 ~
Rastatt; site 2 (1) 87 5000 8240 5240 7010 3880 740 3280 20 900 2860 14200 0(1) 89 4710 9430 3870 7500 4390 780 2530 16900 2360 14200 Z
Rastatt; site 3 (1) 87 440 780 480 880 470 70 370 2200 280 1700 0(1) 89 470 980 480 800 470 80 290 2160 280 1600 c:
Rastatt; site 4 (1) 87 250 420 300 610 330 70 260 1770 220 1400 ::;i(1) 89 350 650 370 790 450 80 290 2310 330 1900 'i
She & Rastatt; ail (77) 87 BSI 140 350 240 390 240 21 180 1010 120 880 ::en
Hagenmaier samples' (10-13300) (10-25000) (3-13 100) (15-21 200) (9-11 500) (1-1470) (6-7940) (51-63600) (3-9630) (40-37000) ~(1996) 0Theisen Kieselrot Cu slag 92 BSI 6800 28 000 14200 94 100 83 300 14200 64 200 1 674600 150 300 314000 l'et aL. (1993) Close to Kieselrot 92 15 72 36 231 204 33 160 2988 200 8120 c:
sport ground; ~garden soi! tr
0\Corresponding 92 2.5 2 1.8 2,9 2.4 0.3 2,5 15,8 0( 0.2 0( 9 \0standard soi!
McLachlan & Field 1; (1) 89 CSI 0,64 0,72 0,88 0,57 0.45 0,06 0,39 3,0 0,20 2,8Reissinger no sludge"
( 1990) Field 2; (1) 89 0,63 1.6 0,89 2,0 0,94 0,19 0,59 7.4 0,38 9sludge for 10 y"
Field 3; (1) 89 2,1 4,2 2,7 5.4 3,2 0,70 1. 19 1.1 29sludge for 30 y'Meadow; (1) 89 2.4 6.4 5,9 9,7 3,8 1. 1.9 31 1.6 43sludge for 30 y'Sewage sludge (1) 89 12 8,2 15 16 10 3.3 15 110 10 400

Table 3 (contd)
Reference Origin; sample Coll. AnaL. PCDF concentration (ng/kg; ppt)description (and no,) period meth,
TCDF PeCDF HxCDF HpCDF OCDF-2378 12378 23478 123478 123678 123789 234678 1234678 1234789
Germany (contd)
Rotard et aL. Ploughland (14) ~94 CSI 1.8 1.8 1. 1. 1.4 0,7 1. (0,7-2,8) 9.5 (3,2-25) 1.0 (0,4-1.6) 18(1994) (0,7-3.4) (0,5-3.4) (0.7-3,1) (0,9-3,3) (0,7-2.4) (0.5-0,9) (3,3-54)
Grassland (7) ~94 2.2 2,7 2,6 2,6 1.9 i. 2,2 (0,1-3,7) 13,1 1. (0,8-2,8) 23,8(0.7-3,6) (0,9-5,0) (1.-5.3 ) (1.0-,8) (0,7-3,7) (0,7-1.8) (4,6-34) (7,4-82)
Deciduous fores! (9) ~94 25.4 36 30 35 26 7.6 18,6 (2,1- 184 15,8 390(7,2-68) (5.9-93) (5.6-86) (3.7-129) (3,3-83) (1.0-27) 54) (25-697) (2.3-63 ) (47-2142)
Coniferous fores! (11) ~94 27.9 36 32 25 21 4.4 17,2 (4,1- 140 10,3 167(10,0-1) (10,5-108) (8,1-97) (5,4-89) (5.4-77) (ND16) 63) (23-646) ( 1.6-50) (18-985)
Jordan ;:'i'iAlawi et aL. Landfill. Amman; tT(1996a) Sample 1 (1) 95 CSI ~ 10 644 494 377 372 ~ 10 581 1280 ~ 10 109 Z
Sample 2 (1) 95 ~ 10 160 115 96 90 ~ 10 145 327 ~ 10 195 U..Sample 3 (1) 95 ~ 10 90 62 72 58 ~ 10 80 387 ~ 10 79 ~Sample 4 (1) 95 ~ 10 109 55 44 38 ~ 10 53 156 ~ 10 15 NSample 5 (1) 95 19 42 111 27 51 ~ 10 23 79 ~ 10 16Sample 6 (1) 95 ~ 10 ~ 10 ~ 10 ~ 10 ~ 10 ~ 10 ~ 10 36 ~ 10 24
The Netherlands
van Wijnen Scrap car dealer (4) 6/88 CSI 39-88 ND-53 37-80 44100 52-120 ND 40-120 390-590 ND-28 150-860et al. (1992) Cable buming (3) 6/88 210-8000 220-12000 210-14000 250-9 300 230-15000 34-1 600 270-16000 800-32000 46-2 200 180-11000
Scrap metal (1) 6/88 370 340 560 980 2300 110 410 3700 360 12000dealer, cablebumingScrap metal (2) 6/88 ND ND ND-310 400-6 000 ND ND ND 1200-5 400 ND 690-5 800dealer, cablebumingScrap car and (4) 6/88 100-5200 150-7400 140-7700 59-6900 210-9400 ND80 150-11 000 470-15000 ND-BOO 330-5 100open air cableburningScrap car and (3) 6/88 17 000- 52 000- 41 000- 75 000- 75 000- 8 200- 94 000- 240 000- 10000- 79 000-open air cable 23 000 91000 53 000 190 000 120 000 18000 150000 450 000 24 000 270 000buming
.t1.VJ

ý,
Table 3 (contd)
Refefence Orgin; samp1e Coll. AnaL. PCDF concentration (ng/kg; ppt)description (and no,) period meth,
TCDF PeCDF HxCDF HpCDF OCDF-2378 12378 23478 123478 123678 123789 234678 1234678 1234789
Spain (contd)
Jiménez et al. Madrid; W, (1) 93 BSO 5.27 1.03 0,62 0,82 0.59 ND 0.41 ND ND 1.6(1996a) 2000 m ff. CWI( contd)
Madrid; SW, (1) 93 13.3 3.51 4,23 15,6 5,60 0,88 6,54 38.4 3,63 64.52000 m ff. CWIMadrid; N, (1) 93 1.1 0.41 0.37 0,74 0.27 0,21 0.36 1.57 0,23 3,142000 m ff. CWIMadrd; S, (1) 93 6.49 0,88 1.49 2,17 0,90 0,23 1.24 1.91 0,25 1.721200 m ff. CWIMadrd; NE, (1) 93 2,92 0.66 0,55 1.03 0.40 0,27 0,52 1.46 0,10 1.2 ~2600 m ff. CWIMadrid; NE, (1) 93 3,58 0,75 0,89 1.65 0,66 0.19 0,70 1.90 0,20 4,70 "'
tr2600 m ff. CWI ZMadrid; NE, (1) 93 5.45 1.20 0,96 1.6 0,59 0,54 0,62 1.63 0,17 1.98 02600 m ff, CWI ..~Madrid; NE, (1) 93 2,93 0,75 0,94 2,06 0,93 0,19 0,96 2,66 0.30 2,29 N3000 m ff. CWIMadrid; NE, (1) 93 1.27 0.40 0.40 0.56 0.25 0.17 0,29 0,94 0,08 3,043000 m ff. CWIMadrid; NE, (1) 93 2.07 0.40 0.47 0,91 0.37 0,16 0.38 1.1 0,11 1.63000 m ff. CWIMadrid, control; (1) 93 2,36 0.37 0,44 0,53 0,19 0,22 0,25 0,66 0,11 0,66NW, 4500 m ff.CWIMadrid, contfo1; (1) 93 1.5 0,32 0.33 0.53 0,27 0.47 0,30 0,76 0,08 1.89NE. 4500 m ff,CWI
Schuhmachef Taragona; 250 m (6) -. 96 BSO 0,34 0.09 0,10 0,22 - ND 0.1 7 0,51 - 0,84et al. (1996) ff. MSWI
Taragona; 500 m (6) -. 96 0.69 0,20 0,12 0.23 0,09 0,06 0,15 0,64 0.09 0,85ff. MSWITaragona; 750 m (6) -. 96 1.28 0,21 0.33 1.8 0.43 0,15 0,61 3,60 0,31 3,88ff, MSWITaragona; (6) -. 96 1.4 0,22 0,25 0,64 0,23 0,10 0,33 1.3 0,15 1.81000 m ff. MSWI
.t\0VI


Table 3 (contd)
Reference Orgin; sample ColL. AnaL. PCDF concentration (ng!kg; ppt)description (and no,) period meth,
TCDF PeCDF HxCDF HpCDF OCDF-2378 12378 23478 123478 123678 123789 234678 1234678 1234789
Taiwan (contd)
Soong & Ling PCP production (1) -0 96 CSO 311 2596 65 211 162 172 293 41 150 1089 432 700(1996) plant site
PCP production (1) -0 96 44 670 16550 7946 142000 37 333 248 400 93 960 22470000 672 500 471 700000plant sile
United Kingdom
Kjeller et aL. Rothamsted (1) 1846 BSI 0,790 1. 00 0.820 1. 000 0.630 -0 0,01 0,680 3,300 0,250 2,900(1991) (semi-rural); (1) 1856 0.450 0,590 0.460 0,640 0.380 -0 0,01 0,310 1.200 0.080 0,980
archived sarples (1) 1893 0,290 0.320 0.350 0.430 0,340 -00,01 0,540 1.500 0,087 1. 00 ~(0-23 cm depth) (1) 1914 0.420 0,680 0,500 0,650 0.460 -00,01 0.400 1.900 0,110 1.400 "1(1) 1944 1.200 1. 00 1. 00 1.600 0.730 -0 0,01 0,500 3,200 0,660 7.600 "1(1) 1956 0,740 1. 000 0,830 1.00 0,750 -0 0,01 0.560 4,900 0,230 4.400 m(1) 1966 0,930 0,710 0,820 1. 00 0,810 -0 0,02 0,650 3,600 0,280 3.00 a(1) 1980 0,870 0,930 0,790 1. 00 0,710 -0 0,02 0.530 3.600 0.450 4,200 -(1) 1986 1. 000 1. 000 0,860 1.00 0,810 -0 0,01 0,530 4,200 0,310 5,200 ~
Creaser et aL. 50 km grd UK; (7) -0 89 BSI Only total reported 55 (-0 2-622)N
(1989) all sarples50 km grd UK; (65) -0 89 Only total reported 27 (-0 2-144)reduced data set
Creaser et aL. Urban soils (19) -0 90 BSI Only total reported 196(7.3-(1990) (5 ciiies) 1100)
Stenhouse & Different semi- (12) 90 BSO 17 (3-50) 4 (1-10) 2 (1-5) 12 (3-30) 15 (3-39) 30 (10-90)Badsha (1990) urban sites
United States
Reed et al, Elk River, MI; (1) 9/88 BSI ND ND ND ND ND ND 7,1 72 ND 120
(1990) sile 1 untiledElk River, MI; (1) 9/88 ND ND ND ND ND ND ND ii ND NDsite 1 tiledElk River, MI; (1) 9/88 ND ND ND ND ND ND ND 26 ND 60site 2 untiledElk River, MI; (1) 9/88 !\'D ND ND ND ND ND ND 80 ND 270site 2 iiled
l:\0..
.t\000
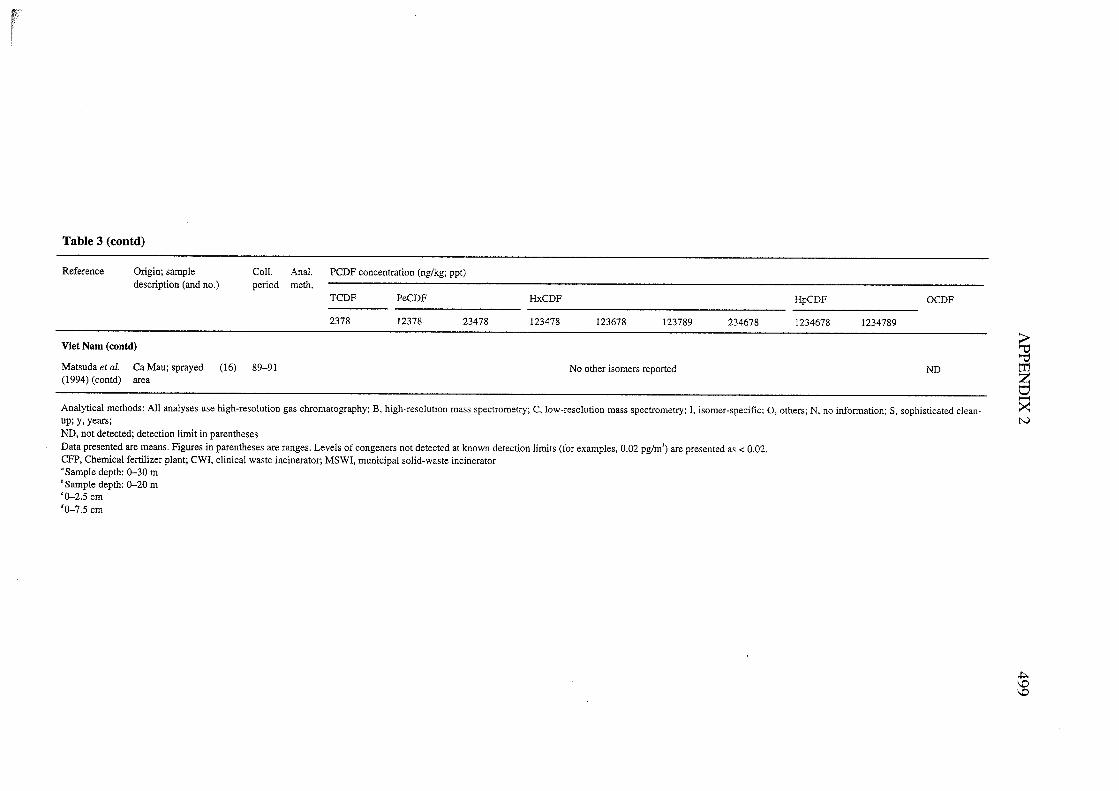
Table 3 (contd)
Reference Ongin; sample
descnption (and no,)ColL.
penodAnal.meth.
PCDF concentration (ng/kg; ppt)
TCDF PeCDF HxCDF HpCDF OCDF
2378 12378 23478 123478 123678 123789 234678 1234678 1234789
Viet Nam (contd)
Matsuda et aL.
(1994) (contd)
Ca Mau; sprayedarea
(16) 89-91 No other isomers reported ND
Analytical methods: Ali analyses use high-resolution gas chromatography; B, high-resolution mass spectrometr; C, low-resolution mass spectrometry; l, isomer-specific; 0, others; N, no information; S, sophisticated clean-up; y, years;ND, not detected; detection liDÛt in parenthesesData presented are means. Figures in parentheses are ranges, Levels of congeners not delected al known detection liDÛts (for examples, 0,02 pg/m') are presented as .. 0.02,CFP. CheDÛcal fertlizer plant; CWI, clinical waSle incinerator; MSWI, municipal solid-waste incineralor'Sample depth: 0-30 mb Sample depth: 0-20 m
'0-2.5 cmdO-7.5 cm
;pi-i-tTZV-~N
~\0\0
Uto..