appendix 2 to the environmental report - surrey … 2 to the environmental report review of district...
TRANSCRIPT

The Surrey Transport Plan Appendix 2 to the Environmental Report Review of District & Borough Environmental Baselines January 2011
Contents Page Appendix 2 Review of District & Borough Environmental Baselines
2-A Baseline Review for the Air Quality Receptor 1
2-B Baseline Review for the Climate Change Receptor 4
2-C Baseline Review for the Land, Soil & Mineral Resources Receptor 9
2-D Baseline Review for the Materials Efficiency & Waste Receptor 14
2-E Baseline Review for the Water Resources & Management Receptor 17
2-F Baseline Review for the Built Environment Receptor 22
2-G Baseline Review for the Historic Environment & Archaeology Receptor 25
2-H Baseline Review for the Natural Environment & Biodiversity Receptor 28
2-I Baseline Review for the Landscape & Visual Amenity Receptor 33
2-J Baseline Review for the Welfare, Health & Well-being Receptor 35
Appendix 2 to the Surrey Transport Plan Environmental Report – January 2011

Appendix 2-A: Review of District & Borough LDF Baseline for Air Quality Elmbridge Borough Council
Objective To ensure air quality continues to improve.
Indicators, Targets & Trends
Indicator: No. & location of AQMAs. Baseline: There are 7 AQMAs in Elmbridge. Target: To reduce no. AQMAs. Indicator: No. properties affected by poor air quality. Indicator: Level of vehicle emissions. Indicator: Annual average NO2 & PM10 within AQMAs relative to national standards. Trend: Levels of PM10 have never been measured within AQMAs in Elmbridge, which were declared due to failure to meet national objectives relative to NO2. Indicator: No. days when air pollution is moderate or high. Target: To reduce no. days when air quality is moderate or high. Trend: No overall trend is obvious but the increase, which reflects the national trend, is a concern.
Epsom & Ewell Borough Council
Objective To ensure air quality continues to improve.
Indicators, Targets & Trends
Indicator: Annual average NO2 & PM10 within AQMAs relative to national standards. Indicator: No. properties affected by poor air quality. Indicator: Level of vehicle emissions.
Guildford Borough Council
Objective To ensure air quality continues to improve & noise/light pollution is reduced.
Indicators, Targets & Trends
Indicator: No. & location of properties affected by poor air quality. Baseline: The borough continues to not exceed the pollutant thresholds set by NAQS. There are no AQMAs. Target: To continue to not exceed the NAQS pollutant thresholds. Indicator: Days when air pollution is moderate or high. Target: To continue to not exceed the NAQS pollutant thresholds. Trend: In general there has been a long term decline in the no. air pollution days in urban areas. In rural areas the series can be volatile from year to year & there is no clear trend.
Mole Valley District Council
Objective To ensure air quality continues to improve.
Indicators, Targets & Trends
Indicator: Annual average NO2 & PM10 within AQMAs relative to national standards. Baseline: No AQMAs within the district. Local monitoring indicates that air quality is within national limits. Target: UK air quality objective for end of 2005 for NO2 & PM10 (annual mean of <40µg/m3). Problems & Constraints: Significant proportion of annual mean PM10 derived from regional background sources & outside LA control. NO2 calculation method may be amended. Indicator: No. properties affected by poor air quality. Baseline: Local monitoring indicates that air quality is within national limits. Problems & Constraints: A definition of what poor air quality is, is needed. Indicator: Level of vehicle emissions. Target: To limit emissions of hydrocarbons to 35% of 1999 level by 2006, of total oxides of nitrogen to 45% of 1999 level by 2006, of particulates to 80% of 1999 level by 2006, & carbon monoxide to 35% of 1999 level by 2006. Trend: Surrey is on track to meet the 2006 targets. Problems & Constraints: Data is shown at a county level, districts would require raw data.
Reigate & Banstead Borough Council
Objective To ensure air quality continues to improve.
Indicators, Targets & Trends
Indicator: Annual average NO2 concentration & for trend purposes 3 year rolling average within AQMAs relative to national standards. Baseline: For RBBC in 2007 UK AQO exceeded at 3 of 9 AQMAs. Target: For concentrations of NO2 to not exceed an annual mean of 40µg/m3. Trend: With the exception of Horley (Area 3) it is likely that 5 of the remaining AQMAs will improve so as to meet national NO2 standards by 2010, with the remaining 3 sites meeting the standard by 2020. Problems & Constraints: Growing no. flights from Gatwick within the Horley AQMA. At the remaining sites where traffic is the main pollution source any significant increase in traffic over that forecast, changes in fleet mix, or a disproportionate increase in HGV’s will increase pollution. Indicator: No. properties affected by poor air quality (i.e. within AQMA).
Appendix 2 to the Surrey Transport Plan Environmental Report – January 2011
1

Appendix 2-A: Review of District & Borough LDF Baseline for Air Quality
Reigate & Banstead Borough Council
Objective To reduce road congestion & the need to travel.
Indicators, Targets & Trends
Indicator: Level of vehicle emissions (100% in 1999): hydrocarbons; total oxides of nitrogen; particulates; carbon monoxide. Target: Targets set at a Surrey level. Trend: Surrey is on track to meet 2006 targets.
Runnymede Borough Council
Objective To reduce air pollution & ensure air quality continues to improve.
Indicators, Targets & Trends Indicator: Days when air pollution is moderate or high.
Spelthorne Borough Council
Objectives To ensure air quality continues to improve & pollution is reduced.
Indicators, Targets & Trends
Indicator: Annual average NO2 & PM10 within AQMAs relative to national standards. Target: For concentrations of NO2 & PM10 to not exceed annual means of 40µg/m3. Trends: Improving, but exceedences associated with certain highways. Problems & Constraints: A significant proportion of annual mean PM10 is derived from regional background sources & are outside the control of LAs. Calculation method based on NO2 maybe amended. Indicator: No. properties affected by poor air quality. Problems & Constraints: There is a need for a definition of what is poor air quality.
Surrey Heath Borough Council
Objectives To ensure air quality continues to improve in line with national &/or WHO targets.
Indicators, Targets & Trends
Indicator: Levels of main pollutants. Target: For SHBC in 2003 NAQS targets not exceeded for CO, NO2, PM10, O3 & SO2. Targets set in UK NAQS. Indicator: No. days when air pollution is moderate or high for NO2, SO2, O3, CO or PM10. Target: Target for urban areas is 9-19 days & for rural areas is 42 days. Indicator: Population living in AQMAs.
Tandridge District Council
Objectives To ensure air quality continues to improve.
Indicators, Targets & Trends
Indicator: Annual average NO2 & PM10 within AQMAs relative to national standards. Baseline: For TDC average NO2 readings from 25 stations across the district in 2008 was 23.5 µg/m3. Target: The UK air quality objective for the end of 2005 for NO2 and PM10 is an annual mean of <40 µg/m3. Problems & Constraints: A significant proportion of current annual mean PM10 is derived from regional background sources & are outside the control of LAs. Calculation method based on NO2 may be amended. Indicator: No. properties affected by poor air quality. Baseline: For TDC, local monitoring indicates that air quality is within national limits. Problems & Constraints: There is a need for a definition of what poor air quality is. Indicator: Level of vehicle emissions (100% in 1999) for: hydrocarbons, total oxides of nitrogen, particulates, and carbon monoxide. Target: For Surrey the targets are to limit hydrocarbon emissions to 35% of 1999 levels by 2006, to limit NOx emissions to 45% of 1999 levels by 2006, to limit PM10 emissions to 80% of 1999 levels by 2006, & to limit CO emissions to 35% of 1999 levels by 2006. Trends: Surrey is on track to meet the 2006 targets. Problems & Constraints: This indicator has not been reported in the Surrey LTP Progress Report 2008.
Waverley Borough Council
Objectives Topic not covered
Indicators, Targets & Trends Topic not covered
Appendix 2 to the Surrey Transport Plan Environmental Report – January 2011
2
Appendix 2-A: Review of District & Borough LDF Baseline for Air Quality
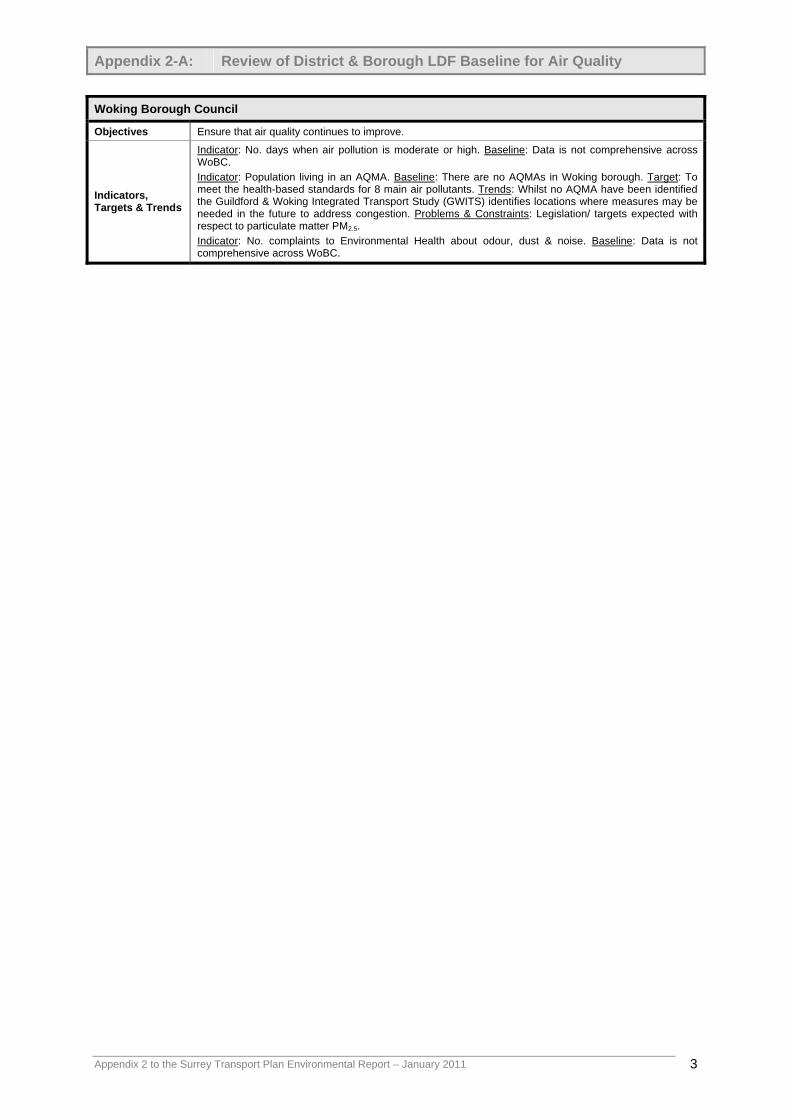
Woking Borough Council
Objectives Ensure that air quality continues to improve.
Indicators, Targets & Trends
Indicator: No. days when air pollution is moderate or high. Baseline: Data is not comprehensive across WoBC. Indicator: Population living in an AQMA. Baseline: There are no AQMAs in Woking borough. Target: To meet the health-based standards for 8 main air pollutants. Trends: Whilst no AQMA have been identified the Guildford & Woking Integrated Transport Study (GWITS) identifies locations where measures may be needed in the future to address congestion. Problems & Constraints: Legislation/ targets expected with respect to particulate matter PM2.5. Indicator: No. complaints to Environmental Health about odour, dust & noise. Baseline: Data is not comprehensive across WoBC.
Appendix 2 to the Surrey Transport Plan Environmental Report – January 2011
3

Appendix 2-B: Review of District & Borough LDF Baseline for Climate Change
Elmbridge Borough Council
Objective To reduce greenhouse gases. Indicator: Emissions of greenhouse gases CO2. Baseline: For Elmbridge in 2007 emissions were estimated at 14.04 tonnes per capita. Target: For a 10% reduction on baseline levels in Year 3. Trends: Elmbridge is higher than the national average by 5.1% & the regional average by15.5%.
Indicators, Targets & Trends
Objective Support economic growth which is inclusive, innovative & sustainable.
Indicators, Targets & Trends
Indicator: Amount of energy (average annual domestic consumption) supplied to homes & businesses. Baseline: For Elmbridge in 2004, the figure for gas is 24,935 KWh and for electricity is 5,566 KWh. Trends: Domestic energy consumption increased by 17.5% in UK between 1990 & 2002. In 2002 there was a 2.5% decrease in fuel consumption in UK compared with 2001. Indicator: No. homes taking up energy saving grants for loft insulation, double glazing, or cavity wall insulation. No. homes installing low energy lightbulbs. Target: To cut household carbon emissions by 1% p.a (2002-05 energy efficiency commitment).
Objective To increase efficiency of new & existing development.
Indicators, Targets & Trends
Indicator: No. dwellings meeting code for sustainable homes standard Indicator: Energy use per capita (average annual domestic consumption). Baseline: For Elmbridge in 2004, figure for gas was 24,935 KWh & for electricity 5,566 KWh.
Objective To increase the production & use of renewable energy. Indicator: Installed capacity for energy production from renewable sources. Amount of energy contributed by wind, hydro & landfill gas sources. Target: Sub-regional targets for Surrey & Thames Valley in SEP are 202 MW by 2010 & 271 MW by 2016. The Surrey Structure Plan had a target for 10% of energy requirement to be met from renewable sources.
Indicators, Targets & Trends
Epsom & Ewell Borough Council
Objective To reduce greenhouse gases. Indicators, Targets & Trends Indicator: Emissions of greenhouse gases CO2.
Objective To increase energy efficiency of new & existing development.
Indicators, Targets & Trends
Indicator: Energy use per capita. Indicator: Improvement in dwelling SAP rating across the district. Indicator: No. homes incorporating CHP heating.
Objective To increase the production & use of renewable energy.
Indicators, Targets & Trends
Indicator: Installed capacity for energy production from renewable sources. Indicator: Annual electricity production from renewable sources. Indicator: Installed capacity for heat generation from renewable sources. Indicator: Annual heat production from renewable sources. Indicator: Greenhouse gases displaced annually by total renewable energy generation. Indicator: Area of land planted with short rotation coppice. Indicator: Area of land planted with energy crops for transport biofuels.
Guildford Borough Council
To make the best use of previously developed land & existing buildings, encouraging sustainable construction. Objective
Indicators, Targets & Trends
Indicator: % new build & retrofit homes meeting EcoHomes ‘very good’ or ‘excellent’ standard & % commercial buildings meeting BREEAM ‘very good’ standard.
To address the causes of climate change through reducing emissions & ensure that the borough is prepared for its impacts. Objective
Indicators, Targets & Trends
Indicator: Emissions of greenhouse gases CO2. Trends: Greenhouse gas emissions in 2003 rose 1.6% on the previous year.
Objective To reduce the global, social & environmental impact of consumption of resources. Indicators, Targets & Trends
Indicator: No. developments using sustainable building techniques. Problems & Constraints: Consider separate indicator dealing with the incorporation of green roofing into new developments.
Appendix 2 to the Surrey Transport Plan Environmental Report – January 2011
4

Appendix 2-B: Review of District & Borough LDF Baseline for Climate Change
Guildford Borough Council
Objective To increase energy efficiency & the proportion of energy generated from renewable sources.
Indicators, Targets & Trends
Indicator: Energy use per capita. Baseline: 40.71 GJ per capita. For Guildford annual consumption of gas energy is 23,334 kWh per capita (cf. SE average of 20,542 kWh) & of electrical energy is 5,271 kWh per capita (cf. SE average of 4,958 kWh). There are currently 3 PV generation stations in Guildford. Trends: Worldwide annual energy use has increased 17 fold during the 20th century. Indicator: Improvement in dwelling SAP rating across borough. Indicator: No. homes incorporating CHP heating. Indicator: Installed capacity for energy production from renewable sources. Indicator: Energy production from locally sourced biomass. Indicator: Proportion of existing woodland used for wood fuel. Indicator: % new build & retrofit homes meeting EcoHomes ‘very good’ standard. Indicator: % commercial buildings meeting BREEAM ‘very good’ Standard. Indicator: No. renewable energy/fuel schemes introduced. Target: 1 landfilll gas electricity site & 4 PV installations.
Mole Valley District Council
Objective To reduce greenhouse gases.
Indicators, Targets & Trends
Indicator: Emissions of greenhouse gases CO2. Target: To reduce CO2 emissions by 20% on 1990 levels by 2010 & by 60% by 2050.
Objective To achieve sustainable production & use of resources.
Indicators, Targets & Trends
Indicator: Amount of energy supplied to homes & businesses. Baseline: For MVDC in 2003, per domestic consumer gas 24,296 KWh & electricity 5,681 KWh, per commercial consumer gas 425,461 KWh & electricity 57,782 KWh. Trends: Domestic energy use 19% higher than national average. Indicator: No. homes taking up energy saving grants for loft insulation, double glazing or cavity wall insulation. Baseline: For MVDC in 2003/04, 219 loft insulation grants, 116 cavity wall insulation, 1,883 double glazing, 2,539 low energy lightbulbs. Target: To cut household carbon emissions by 1% p.a. Indicator: % new build & retrofit homes at EcoHomes ‘excellent’ standard & % commercial buildings at BREEAM ‘excellent’ standard. Problems & Constraints: Data may not be available from Building Control.
Objective To increase efficiency of new & existing development.
Indicators, Targets & Trends
Indicator: Energy use per capita. Baseline: For MVDC in 2005 35,400 kWh. Indicator: Improvement in dwelling SAP rating across district. Problems & Constraints: Concern as to how this could be monitored. Indicator: No. homes incorporating CHP heating. Indicator: Estimated energy savings. Baseline: For MVDC in 2003/04 20,254 GJ, 5,626,147 kWh.
Objective To increase the production & use of renewable energy.
Indicators, Targets & Trends
Indicator: Installed capacity for energy production from renewable sources. Baseline: For MVDC in 2007 56kWe. Target: Target is 271 MW by 2016. Indicator: Annual electricity production form renewable sources. Baseline: For MVDC in 2006 1.03 MW. Target: Target is for 20% of electricity to come from renewable sources by 2020. Trend: Increase of 1,263 GWh from 2005-06, (+7.5%). Indicator: Installed capacity for heat generation from renewable sources. Indicator: Annual heat production from renewable sources. Indicator: Greenhouse gases displaced annually by total renewable energy production. Indicator: Area of land planted with short rotation coppice. Indicator: Area of land planted with energy crops for transport biofuels.
Reigate & Banstead Borough Council
Objective To reduce greenhouse gases. Indicator: Local estimate of CO2.emissions. Baseline: For RBBC in 2006 1,012 tonnes CO2 & 7.8 tonnes per capita. Target: To reduce CO2 emissions by 20% by 2010 from 1990 levels. Trends: Defra figures suggest a 6% reduction in total CO2 has been achieved over 3 years.
Indicators, Targets & Trends
Objective Support economic growth that is inclusive, innovative & sustainable. Indicators, Targets & Trends Indicator: Carbon footprint.
Appendix 2 to the Surrey Transport Plan Environmental Report – January 2011
5

Appendix 2-B: Review of District & Borough LDF Baseline for Climate Change
Reigate & Banstead Borough Council (continued)
Objective To increase energy efficiency.
Indicators, Targets & Trends
Indicator: Energy use per capita. Trends: South east no clear trend apparent, little change since 1970. Indicator: Improvement in dwelling SAP rating across district. Baseline: For RBBC in 2004 average SAP rating was 54. Target: To achieve an average SAP rating of 65 by 2016. Trends: Increase in SAP rating of 2 occurred across the whole housing stock between 2003-04. An upwards trend is likely. Indicator: Installed capacity for CHP. Target: For 10,000 MWe by 2010. Trends: The biomass scheme incorporated into Park 25 is presently the largest scheme of its type in south east England. Problems & Constraints: Domestic micro-CHP market is not expected to be significant in the short term, but larger micro & mini-CHP have considerable potential in the small business sector.
Objective To increase the production & use of renewable energy/fuels.
Indicators, Targets & Trends
Indicator: Installed capacity for energy production from renewable sources (MWe). Baseline: For RBBC for 2008 the figures are 3-7 MWe (landfill gas) & 0.84 MWth biomass (Park 25). Target: For R&B for 2010 is 2.8 MWe (excluding landfill gas). Trends: For the south east the trend is upwards. For RBBC little movement in micro-generation of renewable electricity. Indicator: Annual electricity production form renewable sources (MWhe). Baseline: For RBBC in 2007 the figure is 0.37 MWe. Indicator: Installed capacity for heat generation from renewable sources (MWth). Baseline: For RBBC the figure is 0.84 MWth. Trends: Increase trend in heat energy from woodchip. Indicator: Annual heat production from renewable sources (MWth). Indicator: Area of land planted with short rotation coppice (hectares). Greenhouse gases displaced annually by total (heat & power) renewable energy generation (tonnes CO2 equivalent). Indicator: Area of land planted with energy crops for transport biofuels (hectares).
Runnymede Borough Council
To address the causes of climate change through reducing emissions & ensure that the South East is prepared for its impacts. Objective
Indicators, Targets & Trends
Indicator: Emissions of greenhouse gases from energy consumption, transport & land use & waste management. Baseline: For RBC the figure was 69,561 kilotonnes of GHG.
Objective To reduce the global, social & environmental impact of consumption of resources by using sustainably produced & local products.
Indicators, Targets & Trends
Indicator: % new build & retrofit homes meeting EcoHomes ‘very good’ standard. Baseilne: For RBC the figure is 0%. Indicator: % commercial buildings meeting BREEAM ‘very good’ standard.
Objective To increase energy efficiency & the proportion of energy generated from renewable sources in the region.
Indicators, Targets & Trends
Indicator: Energy use per capita. Baseline: For RBC in 2004, 22,000 - 27,000 Kwh per capita per year. Indicator: Installed capacity for energy production from renewable sources. Baseline: For RBC for 2006 the figure was 1,800 Kwh.
Spelthorne Borough Council
Objective To achieve sustainable production & use of resources.
Indicators, Targets & Trends
Indicator: Energy use per capita. Trend: south east, no clear trend apparent little change since 1970. Indicator: % new build & retrofit homes meeting EcoHomes ‘excellent’. Indicator: % commercial buildings meeting BREEAM ‘excellent’. Indicator: No. homes incorporating CHP heating.
Objective To increase the production & use of renewable energy/fuels.
Indicators, Targets & Trends
Indicator: Installed capacity for energy production from renewable sources (MWe). Target: 202 MW for 2010, & 271 MW for 2016. Indicator: Energy production from locally sourced biomass.
Surrey Heath Borough Council
Objective To reduce greenhouse gases emissions. Indicators, Targets & Trends
Indicator: Emissions of greenhouse gases by sector. Target: Target is to reduce CO2 emissions by 20% by 2010 from a 1990 baseline figure.
Objective To increase energy efficiency & increase the use of renewable energy. Indicators, Targets & Trends
Indicator: Energy use per capita. Baseline: For SHBC in 2003 average fuel use per dwelling was 8 GJ. Indicator: % renewable energy. Target: 10% renewable energy by 2010.
Appendix 2 to the Surrey Transport Plan Environmental Report – January 2011
6

Appendix 2-B: Review of District & Borough LDF Baseline for Climate Change
Surrey Heath Borough Council (continued)
Objective To promote the use of materials & products produced by sustainable methods.
Indicators, Targets & Trends
Indicator: % new build & retrofit homes meeting EcoHomes ‘very good’ standard. Target: For all residential development to be built to BRE EcoHomes ‘excellent’ standard by 2010. Indicator: % commercial buildings meeting BREEAM ‘very good’ standard.
Tandridge District Council
Objective To reduce greenhouse gases (GHG). Indicators, Targets & Trends
Indicator: Emissions of GHG (CO2). Baseline: For TDC, per capita emissions in 2006 were 6.3 tonnes. Target: 80% reduction in GHG emissions by 2050 (Climate Change Act 2008).
Objective To achieve sustainable production & sue of resources.
Indicators, Targets & Trends
Indicator: Amount of energy supplied to homes & businesses. Baseline: For TDC in 2007, total consumption of domestic electricity & gas was 832,515 MWh. Target: To reduce domestic consumption of gas & electricity. Trends: Gradual reduction over the last 3 years. Indicator: No. homes taking up energy saving grants for loft insulation, double glazing or cavity wall insulation. Target: To cut household C emissions by 1% p.a. (2002-05 energy efficiency commitment). Indicator: % new build & retrofit homes meeting Code Level 3 & % commercial buildings meeting BREEAM ‘very good’ standard. Baseline: From Oct 2008 new development to be Code Level 3.
Objective To increase efficiency of new & existing development.
Indicators, Targets & Trends
Indicator: Energy use per capita. Trends: SE, no clear trend apparent, little change since 1970. Indicator: Improvement in dwelling SAP rating across area. Baseline: In 2007/08 figure was 55. Indicator: No. homes incorporating CHP heating.
Objective To increase the production & use of renewable energy.
Indicators, Targets & Trends
Indicator: Installed capacity for energy production from renewable sources (MWe). Target: 25.2 KWp from TDC PVs & all new housing source at least 10% of energy from renewables. Indicator: Annual electricity production form renewable sources (MWhe). Baseline: For TDC in 2007/08 figure was 4.49 MWhe. Indicator: Installed capacity for heat generation from renewable sources. Indicator: Annual heat production from renewable sources (MWth). Indicator: GHG displaced annually by total (heat & power) renewable energy generation (tonnes CO2 equivalent). Target: To generate 10% of electricity from renewable sources by 2010 & 20% by 2020. Indicator: Area of land planted with short rotation coppice (ha). Indicator: Area of land planted with energy crops for transport biofuels.
Waverley Borough Council
Objective To use energy, water & other natural resources efficiently.
Indicators, Targets & Trends Indicator: Renewable energy capacity installed by type.
Woking Borough Council
Objectives Reduce the causes of climate change & prepare for its impacts.
Indicators, Targets & Trends
Indicator: Emissions of greenhouse gases from energy consumption, transport, land use & waste management. Baseline: For WoBC, borough wide CO2 emissions reduction for all categories in 2007 was 21%. Target: To reduce the amount of CO2 equivalent emissions by 80% of the 1990 level by 2090 in steps of 10% up to 2050 and 5% from 2050 to 2090. Problems & Constraints: Data is not currently available in the required format. It is anticipated that the adoption of National Indicator 188 (planning to adapt to climate change) within the LAA for Surrey will lead to better data becoming available. Indicator: Emissions of greenhouse gases from council run properties. Baseline: For WoBC the corporate CO2 emissions reduction in 2007 was 80%. Target: To reduce the amount of CO2 equivalent emissions by 80% of the 1990 level by 2090 in steps of 10% up to 2050 and 5% from 2050 to 2090. Problems & Constraints: Need to clarify that the baseline year for reduction is 1990.
Objectives Reduce the impact of consumption of resources by using sustainably produced & local products.
Indicators, Targets & Trends
Indicator: Proportion of housing achieving Code for Sustainable Homes Levels 3, 4 & 5 & commercial buildings achieving BREEAM ‘very good’. Baseline: For WoBC, no data for the Code for Sustainable Homes, & in 2006 1 BREAAM bespoke assessment rated ‘excellent’ (of 15 made). Target: Between 2008 & 2010 for all new housing to achieve CfSH Level 3, in 2011-2013 Level 4 & in 2013-2016 Level 5. Problems & Constraints: Improvement is needed in the implementation & measurement of sustainable design & construction. A new standard for non-domestic buildings is anticipated.
Appendix 2 to the Surrey Transport Plan Environmental Report – January 2011
7
Appendix 2-B: Review of District & Borough LDF Baseline for Climate Change
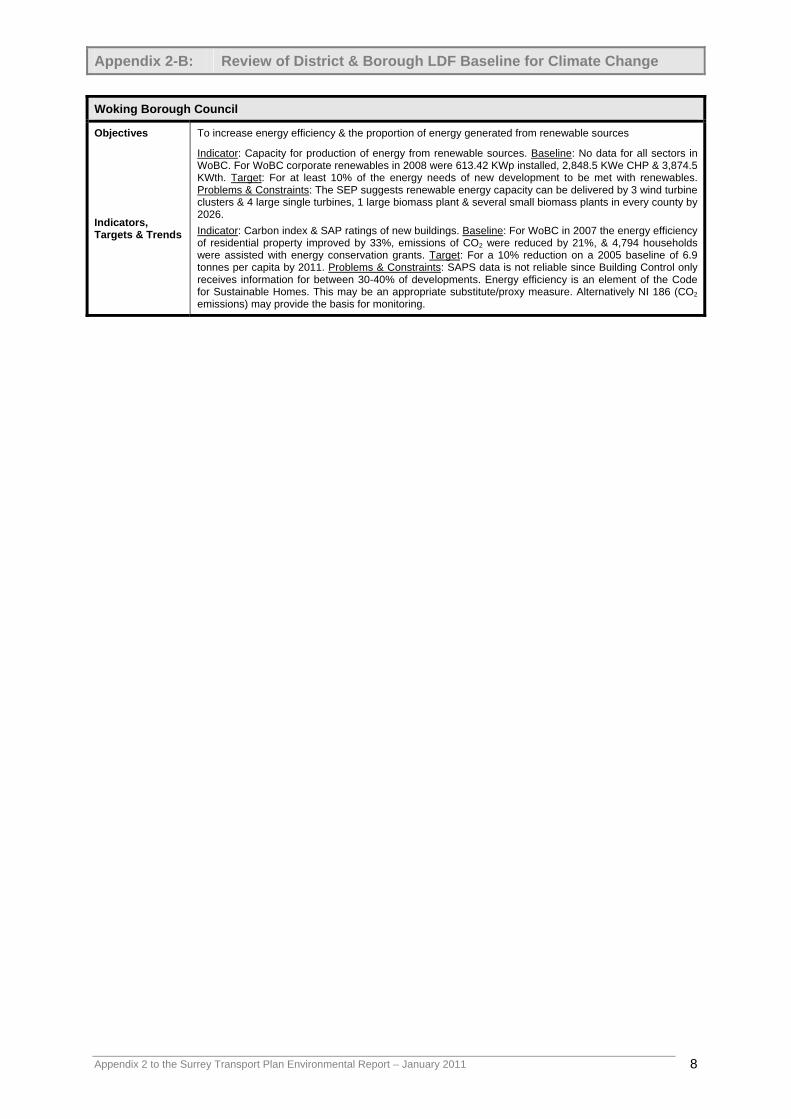
Woking Borough Council
Objectives To increase energy efficiency & the proportion of energy generated from renewable sources
Indicators, Targets & Trends
Indicator: Capacity for production of energy from renewable sources. Baseline: No data for all sectors in WoBC. For WoBC corporate renewables in 2008 were 613.42 KWp installed, 2,848.5 KWe CHP & 3,874.5 KWth. Target: For at least 10% of the energy needs of new development to be met with renewables. Problems & Constraints: The SEP suggests renewable energy capacity can be delivered by 3 wind turbine clusters & 4 large single turbines, 1 large biomass plant & several small biomass plants in every county by 2026. Indicator: Carbon index & SAP ratings of new buildings. Baseline: For WoBC in 2007 the energy efficiency of residential property improved by 33%, emissions of CO2 were reduced by 21%, & 4,794 households were assisted with energy conservation grants. Target: For a 10% reduction on a 2005 baseline of 6.9 tonnes per capita by 2011. Problems & Constraints: SAPS data is not reliable since Building Control only receives information for between 30-40% of developments. Energy efficiency is an element of the Code for Sustainable Homes. This may be an appropriate substitute/proxy measure. Alternatively NI 186 (CO2 emissions) may provide the basis for monitoring.
Appendix 2 to the Surrey Transport Plan Environmental Report – January 2011
8
Appendix 2-C: Review of District & Borough LDF Baseline for Land, Soil & Mineral Resources
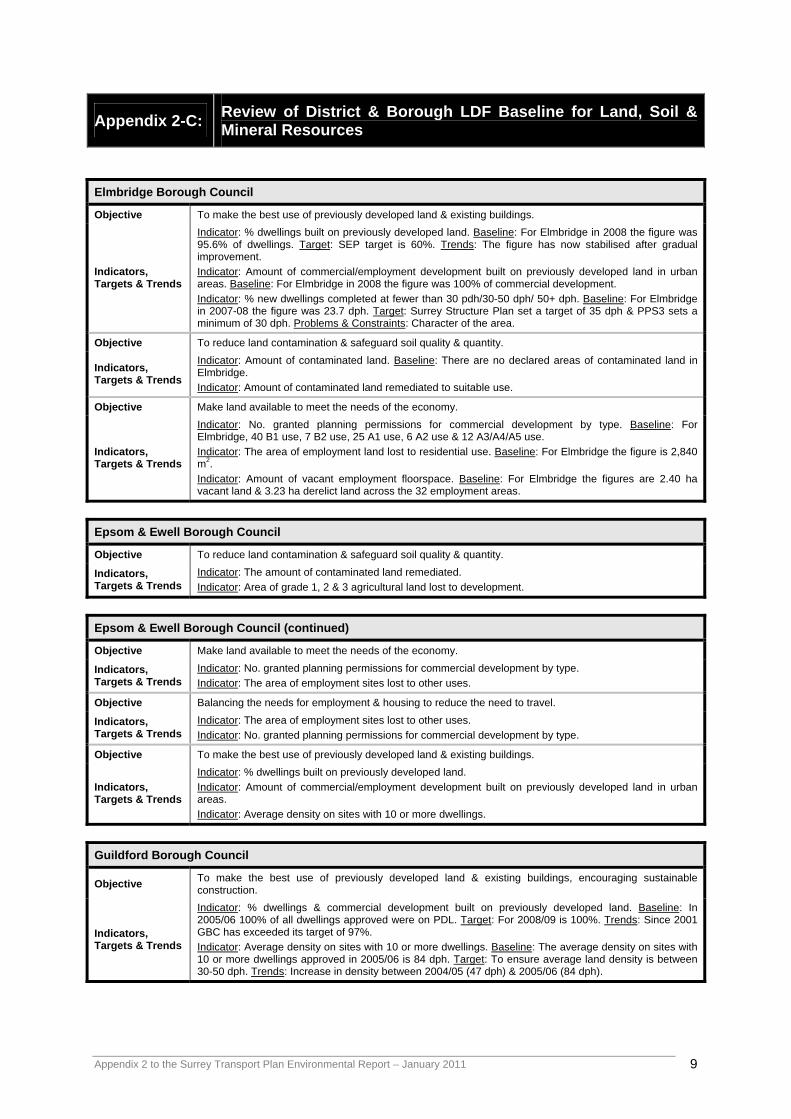
Elmbridge Borough Council
Objective To make the best use of previously developed land & existing buildings.
Indicators, Targets & Trends
Indicator: % dwellings built on previously developed land. Baseline: For Elmbridge in 2008 the figure was 95.6% of dwellings. Target: SEP target is 60%. Trends: The figure has now stabilised after gradual improvement. Indicator: Amount of commercial/employment development built on previously developed land in urban areas. Baseline: For Elmbridge in 2008 the figure was 100% of commercial development. Indicator: % new dwellings completed at fewer than 30 pdh/30-50 dph/ 50+ dph. Baseline: For Elmbridge in 2007-08 the figure was 23.7 dph. Target: Surrey Structure Plan set a target of 35 dph & PPS3 sets a minimum of 30 dph. Problems & Constraints: Character of the area.
Objective To reduce land contamination & safeguard soil quality & quantity.
Indicators, Targets & Trends
Indicator: Amount of contaminated land. Baseline: There are no declared areas of contaminated land in Elmbridge. Indicator: Amount of contaminated land remediated to suitable use.
Objective Make land available to meet the needs of the economy.
Indicators, Targets & Trends
Indicator: No. granted planning permissions for commercial development by type. Baseline: For Elmbridge, 40 B1 use, 7 B2 use, 25 A1 use, 6 A2 use & 12 A3/A4/A5 use. Indicator: The area of employment land lost to residential use. Baseline: For Elmbridge the figure is 2,840 m2. Indicator: Amount of vacant employment floorspace. Baseline: For Elmbridge the figures are 2.40 ha vacant land & 3.23 ha derelict land across the 32 employment areas.
Epsom & Ewell Borough Council
Objective To reduce land contamination & safeguard soil quality & quantity. Indicator: The amount of contaminated land remediated. Indicators,
Targets & Trends Indicator: Area of grade 1, 2 & 3 agricultural land lost to development.
Epsom & Ewell Borough Council (continued)
Objective Make land available to meet the needs of the economy.
Indicators, Targets & Trends
Indicator: No. granted planning permissions for commercial development by type. Indicator: The area of employment sites lost to other uses.
Objective Balancing the needs for employment & housing to reduce the need to travel.
Indicators, Targets & Trends
Indicator: The area of employment sites lost to other uses. Indicator: No. granted planning permissions for commercial development by type.
Objective To make the best use of previously developed land & existing buildings.
Indicators, Targets & Trends
Indicator: % dwellings built on previously developed land. Indicator: Amount of commercial/employment development built on previously developed land in urban areas. Indicator: Average density on sites with 10 or more dwellings.
Guildford Borough Council
Objective To make the best use of previously developed land & existing buildings, encouraging sustainable construction. Indicator: % dwellings & commercial development built on previously developed land. Baseline: In 2005/06 100% of all dwellings approved were on PDL. Target: For 2008/09 is 100%. Trends: Since 2001 GBC has exceeded its target of 97%. Indicators,
Targets & Trends Indicator: Average density on sites with 10 or more dwellings. Baseline: The average density on sites with 10 or more dwellings approved in 2005/06 is 84 dph. Target: To ensure average land density is between 30-50 dph. Trends: Increase in density between 2004/05 (47 dph) & 2005/06 (84 dph).
Appendix 2 to the Surrey Transport Plan Environmental Report – January 2011
9

Appendix 2-C: Review of District & Borough LDF Baseline for Land, Soil & Mineral Resources
Guildford Borough Council (continued)
Objective To reduce the area of land affected by contamination & safeguard soil quality & quantity (including agricultural land).
Indicators, Targets & Trends
Indicator: Amount of contaminated land remediated to suitable new use. Baseline: GBC recorded 61 remediated contaminated sites between 2001 & 2004. Approximately 300 potentially contaminated former industrial sites are known to exist in the borough. Indicator: No. developments on Grade 1, 2 & 3 agricultural.
Objective To reduce the global, social & environmental impact of consumption of resources.
Indicators, Targets & Trends
Indicator: Area of allotment sites & % occupancy. Baseline: The borough has 15 allotment sites covering 16.24 ha with 336 plots & 264 tenants. Target: To enable all to share in access to the provision of allotments & to meet demand. Problems & Constraints: Demand outstrips supply – need to provide more sites. Indicator: Amount of mineral extracted & no. extraction & processing sites. Target: For the rate of extraction to be no more than land bank of permitted sites. Trends: Surrey mineral production requirement decreased from 3.4 million tonnes to 2.62 million tonnes between 2001 & 2004.
Objective To provide for appropriate commercial development opportunities to meet the needs of the economy. Indicator: Amount of commercial floor space lost/gained through planning permissions & completions for commercial development. Baseline: In 2005/06, 46 planning applications for commercial development approved. Trends: In 2004/05, 41 approvals. Indicators,
Targets & Trends Indicator: No. employment sites lost to other uses. Baseline: In 2005/06, 9 approvals involving the loss of business, industrial or warehousing land. Trends: In 2004/05, 13 approvals.
Mole Valley District Council
Objective To make the best use of previously developed land & existing buildings.
Indicators, Targets & Trends
Indicator: % dwellings built on previously developed land. Baseline: For MVDC in 2005-06, 96.7% & in 2006-07 89.8%. Target: For 90% new housing to be on PDL in urban areas. Trends: % is increasing. Indicator: The amount of commercial/employment development built on previously developed land in urban areas. Baseline: For MVDC in 2005/06, 100% & in 2006/07 94%. Target: For 80% of additional major commercial development to be in urban areas with good access. Indicator: Average density on sites with 10 or more dwellings. Baseline: For MVDC in 2006/07, 50.9 dph. Target: For new housing developments to be at least 35 dph. Trends: Densities should rise as new developments reflect expectations of PPS3. Problems & Constraints: Lack of comparative data.
Objective To reduce land contamination & safeguard soil quality & quantity. Indicator: Amount of contaminated land remediated to suitable use. Problems & Constraints: No Part IIA sites investigated for data.
Indicators, Targets & Trends Indicator: Area of Grade 1, 2 & 3 agricultural land lost to development. Trends: No loss of Grade 1 or 2
agricultural land. Problems & Constraints: Not specifically monitored but no new development permitted /completed on greenfield sites in recent years.
Mole Valley District Council (continued)
Objective Make land available to meet the needs of the economy.
Indicators, Targets & Trends
Indicator: No. granted planning permissions for commercial development. Baseline: For MVDC in Mar 2008 office (B1) 42,050 m2 & industry/ storage (B1c/B2/B8) 19,450 m2. Indicator: The area of employment sites lost to other uses. Baseline: For MVDC in 2006/07, 2.09ha. Indicator: % vacant employment floorspace. Baseline: For MVDC in 2007/08, offices 7.4% & industry/storage 2.4%.
Reigate & Banstead Borough Council
Objective To make the best use of previously developed land & existing buildings.
Indicators, Targets & Trends
Indicator: % dwellings built on previously developed land. Baseline: For RBBC in 2007/08 the figure was 99%. Target: Target is 80%. Problems & Constraints: RBBC target was reduced to 80% in 2006 due to the new Horley sectors being built on greenfield sites. Indicator: Amount of commercial development built on previously developed land in urban areas. Baseline: For RBBC in 2007/08 the figure was 93%. Target: Surrey SP target is 80% & SEP target is 60%. Indicator: Average density on sites with 10 or more dwellings. Baseline: For RBBC in 2007/08 the figure was 40 dph. Target: Surrey SP target was at least 35 dph & SEP is 40 dph. Trends: Even small permissions in Reigate & Redhill are achieving densities of 35-36 dph. 84% of all completions are 30 dph & above.
Appendix 2 to the Surrey Transport Plan Environmental Report – January 2011
10

Appendix 2-C: Review of District & Borough LDF Baseline for Land, Soil & Mineral Resources
Reigate & Banstead Borough Council (continued)
Objective To reduce land contamination & safeguard soil quality & quantity.
Indicators, Targets & Trends
Indicator: Area of Grade 1, 2 & 3a agricultural land lost to development. Baseline: No Grade 1 or 2 land in RBBC. Trends: The relative proportions of graded agricultural land in Surrey are unlikely to change. Indicator: Area of sites addressed through Part 2A. Problems & Constraints: Limited resource is diverted to planning work. Indicator: Area of sites addressed through the planning process. Trends: 14.33 acres in 2007/08, 14.53 acres in 2006/07 & 15.29 acres in 2005/06. Problems & Constraints: Dependent on property & finance markets. Indicator: No. sites remediated through the planning process. Trends: 5 sites in 2007/08, 12 sites in 2006/07, 6 sites in 2005/06. Problems & Constraints: Dependent on property & finance markets. Indicator: Area of sites addressed voluntarily. Problems & Constraints: Lack of land owner awareness of the contaminated land regime. Indicator: Method of remediation adopted. Trends: ‘dig & dump’ continues to be the preferred method of remediation, despite advances in bioremediation techniques & increases in landfill tax. Problems & Constraints: Remediation method is normally determined by cost. This favours ‘dig & dump’.
Objective Make land available to meet the needs of the economy. Indicator: No. granted planning permissions for commercial development.
Indicators, Targets & Trends Indicator: The area of employment sites lost to other uses. Baseline: For RBBC 3 former industrial sites
lost to residential development.
Runnymede Borough Council
Objective To improve efficiency in land use through the re-use of previously developed land & existing buildings, including re-use of materials from buildings & encourage urban renaissance. Indicator: Development on previously developed land. Baseline: For RBC in 2007/08 figure was 100%. Indicators,
Targets & Trends Indicator: Derelict land & empty properties. Baseline: For RBC the figure was 2 ha.
Spelthorne Borough Council
Objective To make the best use of previously developed land & existing buildings.
Indicators, Targets & Trends
Indicator: % dwellings built on previously developed land. Baseline: For SBC for 2002/03 the figure was 97.6%. Target: Surrey Structure Plan had a target of 70%. Indicator: Average density on sites with 10 or more dwellings (dph). Baseline: For SBC for 2003/04 the figure was 55 dph. Target: Surrey SP target was 35 dpha. Trends: Increasing & significantly above the Surrey average.
Objective To reduce land contamination & safeguard soil quality & quantity.
Indicators, Targets & Trends
Indicator: Amount of contaminated land remediated to suitable use. Indicator: Area of Grade 1, 2 & 3 agricultural land lost to development. Trends: No loss of Grade 1 or 2 agricultural land.
Objective Provide for appropriate commercial development opportunities to meet the needs of the economy.
Indicators, Targets & Trends
Indicator: Area of employment sites lost to other uses. Baseline: For SBC in 2003/04 the 1.35 ha. Indicator: Total quantity of commercial floorspace. Indicator: Total quantity of retail floorspace.
Objective To achieve sustainable production & use of resources. Indicators, Targets & Trends Indicator: No. allotment sites & % occupancy.
Surrey Heath Borough Council
Objective To make the best use of previously developed land & existing buildings.
Indicators, Targets & Trends
Indicator: % dwellings built on previously developed land. Baseline: For SHBC in 2000-2004 the figure was 99.1%. Target: 90% of new dwellings to be on PDL in urban areas. Trends: Development on PDL increasing over the last 5 years. Problems & Constraints: Potential housing pressure for development on open spaces in future. Indicator: % new businesses on previously developed land. Baseline: For SHBC in 2003/04 the figure was 100%. Indicator: % increase in densities within town centres & settlement areas.
Objective To reduce contamination & safeguard soil quality & quantity. Indicators, Targets & Trends Indicator: No. known contaminated land sites.
Appendix 2 to the Surrey Transport Plan Environmental Report – January 2011
11

Appendix 2-C: Review of District & Borough LDF Baseline for Land, Soil & Mineral Resources
Tandridge District Council
Objective To make the best use of previously developed land & existing buildings.
Indicators, Targets & Trends
Indicator: % dwellings built on previously developed land. Baseline: For TDC the figure for 2007/08 is 94%. Target: For 95% of housing development to be on PDL from 2006-2011. Trends: Between 2005/06 & 2006/07 the sharp decline was due to the Local Plan allocation at Red Lane for 108 units. Indicator: Amount of commercial development built on previously developed land in urban areas. Baseline: For TDC in 2007/08 the figure was 91%. Target: For 80% of employment development to be provided on PDL. Problems & Constraints: Figure used does not consider whether site is urban or rural. Indicator: % new dwellings completed at <30 dph, 30-50 dph, and >50 dph. Baseline: For TDC in 2007/08 figures were 22% at <30 dph, 50% at 30-50 dph, and 28% at >50 dph. Target: Average density per year should reach 30 dph. Trends: Densities should rise as they meet the expectations of PPS3.
Objective To reduce land contamination & safeguard soil quality & quantity.
Indicators, Targets & Trends
Indicator: Amount of contaminated land remediated. Baseline: For TDC there is no ‘contaminated land’ as defined under Part IIA of the EPA 1990. Target: If land is designated as contaminated in the future it should be brought back into use. Indicator: Area of Grade 1, 2 & 3 agricultural land lost to development. Baseline: For TDC in 2008 the figure was 0 ha. Trends: No loss of Grade 1 or 2 agricultural land.
Objective Make land available to meet the needs of the economy.
Indicators, Targets & Trends
Indicator: Area of employment sites lost to other uses. Baseline: For TDC in 2007/08 the figure was 1.02 ha.
Waverley Borough Council
Objective To ensure everyone has the opportunity to live in a decent & affordable housing. Indicators, Targets & Trends
Indicator: % new & converted dwellings on PDL (target 90%). Indicator: Density of completed dwellings (target = average of 35 dph).
Objective To prevent & control pollution Indicators, Targets & Trends Indicator: Contaminated Land Register.
Objective To maintain & enhance the quality of landscapes & townscapes. Indicators, Targets & Trends Indicator: Development on previously developed land.
Objective To use energy, water & other natural resources efficiently. Indicators, Targets & Trends Indicator: Derelict & vacant land in urban areas.
Waverley Borough Council
Objective To encourage sustained economic growth Indicator: Business development (amount of land developed for employment type, employment land supply by type, loss of employment land). Indicators,
Targets & Trends Indicator: Target 80% employment development will be provided on land previously used for employment purposes.
Woking Borough Council
Objective Make the best use of previously developed land & existing buildings.
Indicators, Targets & Trends
Indicator: Proportion of new dwellings built on previously developed land (PDL). Baseline: For WoBC in 2007-08 the figure was 100%. Target: Surrey Structure Plan target was 90% of housing on PDL. Indicator: Proportion of new business floorspace built on PDL. Baseline: For WoBC from 2003-08 the figure was 100%. Target: for 80% of new business floorspace to be on PDL. Trends: The target is being met & exceeded. Indicator: Amount of derelict land. Trends: Derelict land is being identified proactively. Indicator: Housing densities in urban areas. Baseline: For WoBC in 2007-08 the figure was 250 dph in the town centre, and 109 dph in district centres. Target: A minimum of 30 dph. Trends: The target is being exceeded, in 2006-07 substantially. Problems & Constraints: Possible overprovision of 1 & 2 bedroom properties & raises the question of whether open space needs are being met.
Appendix 2 to the Surrey Transport Plan Environmental Report – January 2011
12

Appendix 2-C: Review of District & Borough LDF Baseline for Land, Soil & Mineral Resources
Woking Borough Council (continued)
Objective Maintain agricultural soil quality & reduce the number of sites that are contaminated.
Indicators, Targets & Trends
Indicator: Development on the best & most versatile agricultural land. Baseline: For WoBC in 2007-08 there was no development on BMV. Target: To give preference to development on land classified as ALC Grade 3b, Grade 4 & Grade 5. Trends: No significant issues have arisen in Woking. Indicator: Proportion of LA area inspected for contaminated land annually. Indicator: Area of land affected by contamination brought back into beneficial use. Trends: Remediation of Westfield Tip & provision of 198 dwellings, 2008 to 2013.
Objective Reduce the impact of consumption of resources by using sustainably produced & local products. Indicator: No. allotment plots in the borough & % vacant. Baseline: For WoBC in June 2008, there were 779 plots, 18 vacant plots and 80 people on the waiting list. Trends: Deficiency of allotments in some areas. Problems & Constraints: Explore opportunities to create new site in north & west of the borough.
Indicators, Targets & Trends
Appendix 2 to the Surrey Transport Plan Environmental Report – January 2011
13

Appendix 2-D: Review of District & Borough LDF Baseline for Materials Efficiency & Waste
Elmbridge Borough Council
Objective Support economic growth which is inclusive, innovative & sustainable.
Indicators, Targets & Trends
Indicator: No. businesses achieving reduction in consumption of resources, or mitigating the effects of practices that would otherwise result in degradation of natural resources. Indicator: No. businesses actively engaging in the Sustainable Business Programme.
Objective To achieve sustainable production & use of resources.
Indicators, Targets & Trends
Indicator: Amount of waste disposed of in landfill. Baseline: For Elmbridge in 2004/05 44,968 tonnes of waste was landfilled. Target: For MSW minimisation in Surrey is 50% by 2015, & for C&I waste is 55% by 2015. Indicator: Waste collected per capita. Baseline: For Elmbridge in 2005-06 440kg of MSW were collected per head. Target: To reduce MSW. Indicator: % waste recycled. Baseline: For Elmbridge in 2005-06 20.9% of waste was recycled. Target: The LAA targets are 36% for year 1, 38% for year 2 & 40% for year 3. Indicator: % waste composted. Baseline: For Elmbridge in 2005-06 0.5% of waste was composted. Target: The LAA targets are 36% for year 1, 38% for year 2 & 40% for year 3.
Epsom & Ewell Borough Council
Objective None identified Indicators, Targets & Trends None identified
Guildford Borough Council
Objective To make the best use of previously developed land & existing buildings, encouraging sustainable construction.
Indicators, Targets & Trends Indicator: No./% construction sites recycling waste on site.
Objective To reduce the global, social & environmental impact of consumption of resources.
Indicators, Targets & Trends
Indicator: No. developments using sustainable building techniques. Problems & Constraints: Consider separate indicator dealing with the incorporation of green roofing into new developments. Indicator: Recycling on development sites.
Objective To reduce waste generation & disposal, & achieve the sustainable management of waste.
Indicators, Targets & Trends
Indicator: Total amount of untreated MSW disposed of in landfill. Baseline: MSW arisings in 2003/04 was 36,737 tonnes. Problems & Constraints: The MSW part of the waste stream represents only a proportion of the total waste produced in the borough. Indicator: Total amount of treated waste going to landfill. Problems & Constraints: This figure would be calculated by taking total MSW arising & deducting the amounts of waste recycled, composted or converted to energy. Indicator: Waste collected per capita. Baseline: In 2003/04 355 kg. Indicator: Percentage of waste recycled. Baseline: In 2003/04 18.14%. Target: 60%. Indicator: Percentage of waste composted. Baseline: In 2003/04 2.23%. Indicator: % energy recovery from waste (e.g. through incineration, etc.). Indicator: Amount of secondary recycled aggregates used as % of total.
Mole Valley District Council
Objective To achieve sustainable production & use of resources.
Indicators, Targets & Trends
Indicator: No. construction sites recycling or reusing demolition waste. Indicator: Amount of waste disposed of in landfill. Indicator: Waste collected per capita. Baseline: For MVDC in 2005/06 0.38 tonnes. Indicator: % waste recycled. Baseline: For MVDC in 2006/07, 39.18%. Target: 42% for 2008/09. Trends: % recycled is increasing steadily. Indicator: % waste composted. Baseline: For MVDC in 2003/05 0.6%. Trends: % composted is increasing steadily.
Appendix 2 to the Surrey Transport Plan Environmental Report – January 2011
14
Appendix 2-D: Review of District & Borough LDF Baseline for Materials Efficiency & Waste
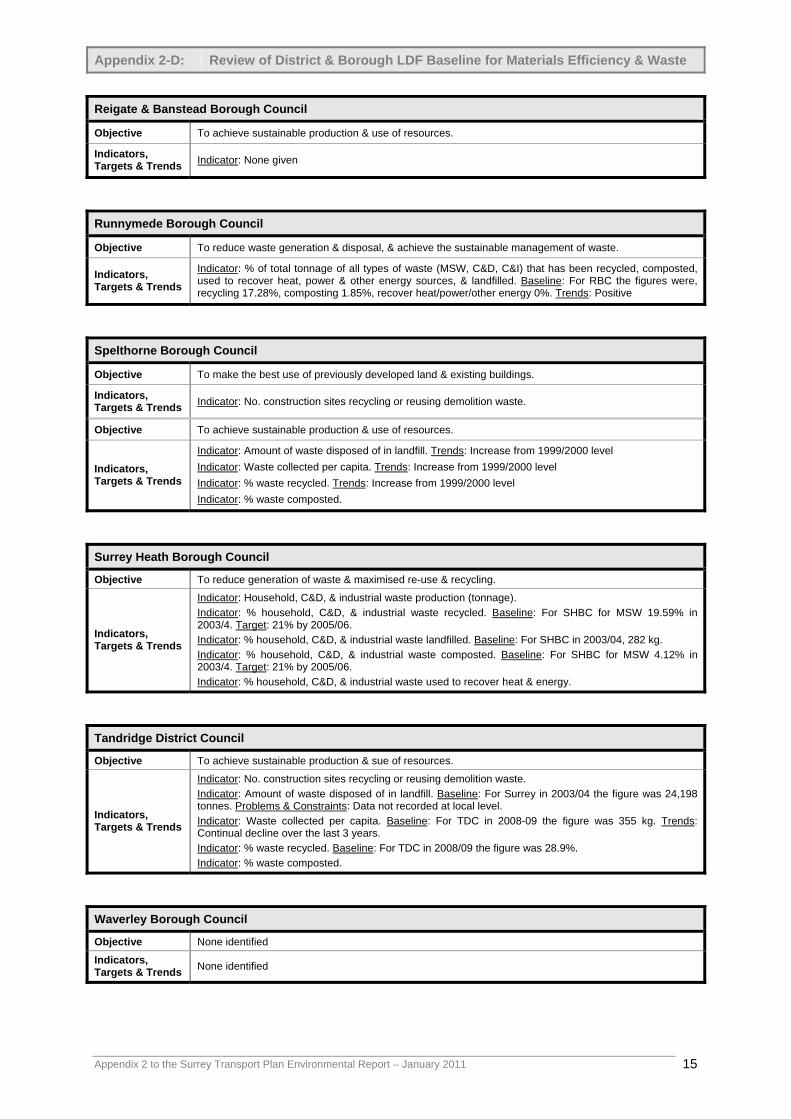
Reigate & Banstead Borough Council
Objective To achieve sustainable production & use of resources.
Indicators, Targets & Trends Indicator: None given
Runnymede Borough Council
Objective To reduce waste generation & disposal, & achieve the sustainable management of waste.
Indicator: % of total tonnage of all types of waste (MSW, C&D, C&I) that has been recycled, composted, used to recover heat, power & other energy sources, & landfilled. Baseline: For RBC the figures were, recycling 17.28%, composting 1.85%, recover heat/power/other energy 0%. Trends: Positive
Indicators, Targets & Trends
Spelthorne Borough Council
Objective To make the best use of previously developed land & existing buildings.
Indicators, Targets & Trends Indicator: No. construction sites recycling or reusing demolition waste.
Objective To achieve sustainable production & use of resources.
Indicators, Targets & Trends
Indicator: Amount of waste disposed of in landfill. Trends: Increase from 1999/2000 level Indicator: Waste collected per capita. Trends: Increase from 1999/2000 level Indicator: % waste recycled. Trends: Increase from 1999/2000 level Indicator: % waste composted.
Surrey Heath Borough Council
Objective To reduce generation of waste & maximised re-use & recycling.
Indicators, Targets & Trends
Indicator: Household, C&D, & industrial waste production (tonnage). Indicator: % household, C&D, & industrial waste recycled. Baseline: For SHBC for MSW 19.59% in 2003/4. Target: 21% by 2005/06. Indicator: % household, C&D, & industrial waste landfilled. Baseline: For SHBC in 2003/04, 282 kg. Indicator: % household, C&D, & industrial waste composted. Baseline: For SHBC for MSW 4.12% in 2003/4. Target: 21% by 2005/06. Indicator: % household, C&D, & industrial waste used to recover heat & energy.
Tandridge District Council
Objective To achieve sustainable production & sue of resources.
Indicators, Targets & Trends
Indicator: No. construction sites recycling or reusing demolition waste. Indicator: Amount of waste disposed of in landfill. Baseline: For Surrey in 2003/04 the figure was 24,198 tonnes. Problems & Constraints: Data not recorded at local level. Indicator: Waste collected per capita. Baseline: For TDC in 2008-09 the figure was 355 kg. Trends: Continual decline over the last 3 years. Indicator: % waste recycled. Baseline: For TDC in 2008/09 the figure was 28.9%. Indicator: % waste composted.
Waverley Borough Council
Objective None identified
Indicators, Targets & Trends None identified
Appendix 2 to the Surrey Transport Plan Environmental Report – January 2011
15

Appendix 2-D: Review of District & Borough LDF Baseline for Materials Efficiency & Waste
Woking Borough Council
Objective Reduce waste generation & disposal & achieve sustainable management of waste.
Indicator: Proportion of MSW that has been: recycled; composted; used to recover heat, power & other energy sources; & land filled. Baseline: For WoBC in 2007 the figures were, 27% MSW recycled, 11% MSW composted, 0% MSW used to recover heat etc., and 62% MSW landfilled. Target: for 40% MSW to be reused, recycled or composted by 2010, 45% by 2015 and 50% by 2020. Trends: Woking is above the average performance in recycling and has affected a steady decline in the proportion of waste sent to landfill. The Waste Strategy Target for 2010 is already being met.
Indicators, Targets & Trends
Indicator: Total tonnage of household waste produced. Baseline: For WoBC in 2007-08 the figure was 382,000 kg. Trends: Despite increasing recycling, total household waste is increasing. This is partly explained by an increase in population.
Appendix 2 to the Surrey Transport Plan Environmental Report – January 2011
16

Appendix 2-E: Review of District & Borough LDF Baseline for Water Resources & Management
Elmbridge Borough Council
Objective To minimise the harm from flooding.
Indicators, Targets & Trends
Indicator: No. properties at risk from flooding (Zones 2 & 3). Baseline: In Elmbridge 12,500 properties are in Flood Zone 2 or 3. Target: To prevent all inappropriate development in the flood plain. Trends: The figure has increased after the release of the EA flood zones data for 2004, indicating a greater area at risk of flooding. Indicator: No. planning permissions given contrary to Environment Agency advice. Baseline: For Elmbridge the figure for 2008 was zero.
Objective To maintain & improve the water quality of the rivers & groundwater. Indicator: % rivers in plan area whose biological quality is rated as ‘good’. Baseline: For Elmbridge in 2005 the figure was 100%. Trends: Biological quality has improved & needs to be maintained at 100%. Indicator: % rivers in plan area whose chemical quality is rated as ‘good’. Baseline: For Elmbridge in 2005 the figure was 84.78%. Trends: Chemical quality has improved.
Indicators, Targets & Trends
Indicator: Incidents of major & significant water pollution. Objective To ensure that the borough is prepared for the impacts of climate change. Indicators, Targets & Trends Indicator: Capacity during ‘critical periods’ to supply water without need for restrictions.
Objective To increase efficiency of new & existing development. Indicator: Household per capita consumption of water (daily use). Baseline: For Elmbridge in 2004 the figure was 168 litres. Target: To stabilise PCC of water at current levels. Trends: Water consumption per person in households increased by 7% between 1992 & 2001 in England & Wales.
Indicators, Targets & Trends
Epsom & Ewell Borough Council
Objective To minimise the harm from flooding.
Indicators, Targets & Trends
Indicator: No. properties at risk from flooding. Indicator: No. properties built with sustainable drainage installed. Indicator: No. properties linked to sustainable drainage systems. Indicator: Area of land identified for flood storage purposes as part of CFMP considered for future revision.
Epsom & Ewell Borough Council (continued)
Objective To maintain & improve the water quality of the rivers & groundwater. Indicator: % rivers in plan area whose biological quality is rated as ‘good’. Indicator: % rivers in plan area whose chemical quality is rated as ‘good’. Indicators,
Targets & Trends Indicator: Quality of groundwater.
Objective To ensure that the district is prepared for the impacts of climate change. Indicators, Targets & Trends Indicator: Capacity during ‘critical periods’ to supply water without need for restrictions.
Guildford Borough Council
Objective To reduce the risk of flooding & the resulting detriment to public well being, the economy & the environment.
Indicators, Targets & Trends
Indicator: No. properties at risk from flooding. Baseline: The EA has identified 8,750 properties in the Thames Region south east area in the floodplain & at risk from flooding. Target: No development to be permitted in the floodplain against EA advice. Problems & Constraints: PPS 25 to be considered & the SFRA. Indicator: No. buildings within the floodplain of the River Wey. Indicator: No./% new or redevelopments built with sustainable drainage /SuDS installed. Target: All new development/re-developments over 1 ha should incorporate SuDS. The Sustainable Development & Construction SPD adopted in Dec 2005 states that water efficiency measures should be part of all new development. Trends: Trend data will be available in the future. Problems & Constraints: Monitoring of SPD has commenced but further work is required before figures can be reported. Indicator: No. developments built on floodplains within the borough per year/floodplain area (sq m) developed per year. Baseline: For Guildford no permissions are known to have been granted in 2005/06 contrary to EA advice. Target: No development to be permitted in the floodplain against the advice of the EA. Problems & Constraints: EA suggest monitoring area of flood plain developed above baseline. Baseline should be current level.
Appendix 2 to the Surrey Transport Plan Environmental Report – January 2011
17

Appendix 2-E: Review of District & Borough LDF Baseline for Water Resources & Management
Guildford Borough Council (continued)
To make the best use of previously developed land & existing buildings, encouraging sustainable construction. Objective
Indicators, Targets & Trends Indicator: No. dwellings incorporating grey water/rainwater harvesting.
Objective To conserve & enhance biodiversity within the plan area.
Indicators, Targets & Trends
Indicator: Conservation limit for salmon rivers. Target: To maintain, develop & improve salmon, freshwater fish & eel fisheries in freshwaters, estuaries & coastal waters. Indicator: Area or length of fluvial or estuarine habitat improvement. Target: To maintain, develop & improve salmon, freshwater fish & eel fisheries in freshwaters, estuaries & coastal waters. Indicator: Ecological & chemical water quality & extent & condition of river buffer zones. Target: To maintain, develop & improve salmon, freshwater fish & eel fisheries in freshwaters, estuaries & coastal waters. Indicator: No. & % (of total) new developments with wildlife friendly Sustainable Drainage Systems.
To address the causes of climate change through reducing emissions & ensure that the borough is prepared for its impacts. Objective
Indicator: Capacity during ‘critical periods’ to supply water without the need for additional restrictions. Problems & Constraints: Alternatively consideration could be given to sourcing data on aquifer recharge, extent to which new developments incorporate measures to assist rainwater infiltration.
Indicators, Targets & Trends
Objective To maintain & improve the water quality of the region’s rivers & groundwater, & to achieve sustainable water resources management.
Indicators, Targets & Trends
Indicator: % rivers in plan area whose biological/chemical quality is rated as ‘good’ or ‘fair’. Baseline: Aim to protect water quality in rivers, ditches & streams from pollution through integrated land use & development control activities. Target: Potential targets are EA river quality objectives. Indicator: Quality & quantity of groundwater. Target: To maintain sufficient supply for essential services & environmental needs. Trends: Fall in 2003 south east groundwater levels. Problems & Constraints: Lack of local data. Indicator: Household per capita consumption. Target: To stabilise per capita consumption. Trends: South east 2002/03 168 litres per day unmeasured & 145 litres measured. Problems & Constraints: Per capita consumption in the south east has grown by 3-5%. Indicator: Water resource supply/demand balance. Trends: Oct 2004 to Mar 2006 was the driest 18 month Oct to Mar period on record. There is an increasing demand for water – more single occupant households & greater use of appliances like power showers & dishwashers. Indicator: No. dwellings incorporating grey water/rainwater harvesting & other water efficiency measures.
Mole Valley District Council
Objective To minimise the harm from flooding.
Indicator: No. properties at risk from flooding. Baseline: For MVDC in 2004 1,559 properties. Target: To prevent all inappropriate development in the flood plain. Problems & Constraints: EA flood zones are subject to revision. Indicator: No. new properties linked to sustainable drainage systems. Target: For new development applications to show that sustainable drainage has been considered & implemented if appropriate. Problems & Constraints: Requires monitoring arrangements, concern whether this can be done accurately from planning or building control sources.
Indicators, Targets & Trends
Indicator: Area of land identified for flood storage purposes as part of CFMP considered for future revision. Problems & Constraints: EA CFMP indicates general locations but does not identify sites.
Objective To maintain & improve the water quality of the rivers & groundwater.
Indicator: % rivers in plan area whose biological quality is rated as ‘good’. Baseline: River Mole in 2007, at Dorking ‘fairly good’. Indicator: % rivers in plan area whose chemical quality is rated as ‘good’. Baseline: River Mole in 2007, at Dorking ‘fairly good’. Indicators,
Targets & Trends Indicator: Quality of groundwater. Baseline: 85% of Sutton & East Surrey’s water supply comes from groundwater sources, in 2003 99.76% of tests complied with regulations. Target: To maintain sufficient supply for essential services & environmental needs. Trends: Fall in 2003 in SE groundwater levels.
Objective To ensure that the district is prepared for the impacts of climate change.
Indicators, Targets & Trends Indicator: Capacity during ‘critical periods’ to supply water without need for restrictions.
Appendix 2 to the Surrey Transport Plan Environmental Report – January 2011
18

Appendix 2-E: Review of District & Borough LDF Baseline for Water Resources & Management
Mole Valley District Council (continued)
Objective To achieve sustainable production & use of resources.
Indicators, Targets & Trends
Indicator: Household per capita consumption of water. Baseline: Average domestic household use is 700 litres per day. Target: To stabilise PCC of water at current levels. Trends: PCC In 2002/03 in SE has grown by 3-5% although it is now stabilising. Problems & Constraints: Data needs to be rechecked & revised. Indicator: Water supply & demand balance. Indicator: No. water meters installed. Target: To increase no. installed by 10% by 2006. Trends: Slow increase in no. households with metered water supply. Problems & Constraints: Data needs to be rechecked & revised. Indicator: % new developments incorporating grey water collection.
Reigate & Banstead Borough Council
Objective To minimise the harm from flooding.
Indicators, Targets & Trends
Indicator: No. properties at risk from flooding. Target: To prevent all inappropriate development in the floodplain. Trends: The effects of climate change will increase the risk of flooding to properties. Indicator: No. new properties linked to sustainable drainage systems.
Objective To maintain & improve the water quality of the region’s rivers & groundwater. Indicators, Targets & Trends None given.
Objective To ensure that the district is prepared for the impacts of climate change. Indicators, Targets & Trends
Indicator: Capacity during ‘critical periods’ to supply water without the need for restrictions. Target: For no homes or businesses to suffer water supply restrictions.
Runnymede Borough Council
Objective To reduce the risk of flooding & the resulting detriment to public well-being, the economy & the environment.
Indicators, Targets & Trends
Indicator: Properties at risk from flooding. Baseline: For RBC in 2006 8,298 residential properties & 605 commercial properties at risk of flooding. Indicator: New development with sustainable drainage installed.
To address the causes of climate change through reducing emissions & ensure that the South East is prepared for its impacts. Objective
Indicators, Targets & Trends Indicator: Capacity during ‘critical periods’ to supply water without the need for restrictions.
Objective To maintain & improve the water quality of the region’s rivers & coasts, & to achieve sustainable water resource management.
Indicators, Targets & Trends
Indicator: Rivers of ‘good’ or ‘fair’ chemical or biological water quality. Trends: Neutral/unchanged. Indicator: Compliance with EC Bathing Waters Directive. Trends: Positive. Indicator: Per capita consumption of water. Trends: Positive. Indicator: Incidents of major & significant water pollution. Baseline: For RBC no incidents of major or significant water pollution.
Spelthorne Borough Council
Objective To minimise the harm from flooding.
Indicators, Targets & Trends
Indicator: No. properties at risk from flooding. Baseline: For SBC the figure is 1,502 dwellings. Target: To prevent all inappropriate development in the flood plain. Trends: The figure has increased after the release of the EA flood zones 2004 indicating a greater area at risk of flooding. Indicator: No. properties linked to sustainable drainage systems. Target: For all new development applications to show that sustainable drainage has been considered & implemented if appropriate.
Objective To achieve sustainable production & use of resources.
Indicators, Targets & Trends
Indicator: Household per capita consumption of water. Target: To stabilise PCC of water at current levels. Trends: PCC in SE has grown by 3-5% although it is now stabilising. Indicator: No. dwellings incorporating greywater/rainwater harvesting.
Objective To maintain & improve the water quality of the region’s rivers & groundwater. Indicator: % rivers in plan area whose biological quality is rated as ‘good’.
Indicators, Targets & Trends Indicator: % rivers in plan area whose chemical quality is rated as ‘good’. Target:For sufficient supply for
essential services & environmental needs. Trends: Fall in 2003, SE, groundwater levels.
Appendix 2 to the Surrey Transport Plan Environmental Report – January 2011
19

Appendix 2-E: Review of District & Borough LDF Baseline for Water Resources & Management
Surrey Heath Borough Council
Objective To reduce the risk of flooding.
Indicators, Targets & Trends
Indicator: No. properties flooded per annum. Indicator: No. planning permissions with sustainable drainage installed. Problems & Constraints: Not recorded. Projects difficult to categorise. Not mandatory under PPS25.
Objective To maintain & improve the quality of water resources.
Indicators, Targets & Trends
Indicator: Biological/chemical quality of rivers & tributaries. Baseline: For SHBC in 2001 figure for chemical quality was 100% compliant. Target: For all inland & coastal waters to reach ‘good’ status by 2015. Indicator: Effect of new development on the rate of surface water runoff. Indicator: No. planning permissions with sustainable drainage systems. Indicator: Groundwater quality.
Objective To encourage reduced water consumption. Indicators, Targets & Trends Indicator: Water consumption per capita.
Tandridge District Council
Objective To minimise the harm from flooding. Indicator: No. properties at risk from flooding (Zones 2 & 3). Baseline: For TDC the figures are 695 properties within Flood Zone 3 & 1,314 properties within Flood Zone 2. Target: To prevent all inappropriate development in the flood plain. Problems & Constraints: Environment Agency flood zones are subject to revision and consequently you may not be comparing like with like. Indicator: No. properties linked to sustainable drainage systems. Target: For all applications to show that sustainable drainage and flood defences have been considered if appropriate. Problems & Constraints: Requires setting up monitoring. Concern to whether this can be done accurately from planning applications or building control sources given latter is only partial (i.e. no NHBC information).
Indicators, Targets & Trends
Indicator: Area of land identified for flood storage purposes as part of CFMP considered for future revision. Problems & Constraints: Environment Agency CFMP indicates general locations but does not identify sites. May not be developed into proposals – depends on funding & review by EA.
Objective To maintain & improve the water quality of the rivers & groundwater. Indicator: % rivers in plan area whose biological quality is rated as ‘good’. Indicator: % rivers in plan area whose chemical quality is rated as ‘good’. Baseline: For TDC in 2007 River Eden at Haxted Mill graded ‘D’ (‘fair’ quality). Indicators,
Targets & Trends Indicator: Quality of groundwater. Baseline: For TDC area, 85% of Sutton & East Surrey’s water supply comes from groundwater sources. In 2003 21,112 tests were carried out & 99.76% of these tests complied with regulations. Target: Sufficient supply for essential services & environmental needs.
Objective To ensure that the district is prepared for the impacts of climate change. Indicator: Capacity during ‘critical periods’ to supply water without the need for restrictions. Baseline: For TDC area, Sutton & East Surrey Water implemented a hose pipe ban in 2005 & 2006. Target: For no homes or businesses to suffer water supply restrictions.
Indicators, Targets & Trends
Objective To achieve sustainable production & sue of resources.
Indicators, Targets & Trends
Indicator: Household per capita consumption of water. Target: To stabilise PCC of water at current (2002/03) levels. Trends: PCC in SE has grown by 3-5% although it is now stabilising. Indicator: Water supply & demand balance. Problems & Constraints: EA have only published a graph & no figures are available. Indicator: No. water meters installed. Baseline: For TDC in Jan 2005, there had been 626 meters installed since April 2002. Target: To increase no. installed by 10% by 2006. Indicator: % new developments incorporating grey water collection.
Waverley Borough Council
Objective To reduce vulnerability to the impacts of climate change, especially flooding. Indicator: No. properties located within flood zone 2 or flood zone 3 (target – no new development on undeveloped land at high risk of flooding). Indicators,
Targets & Trends Indicator: No. planning permissions granted contrary to Environment Agency advice. Indicator: Sustainable drainage systems installed.
Appendix 2 to the Surrey Transport Plan Environmental Report – January 2011
20

Appendix 2-E: Review of District & Borough LDF Baseline for Water Resources & Management
Woking Borough Council
Objective Reduce the risk of flooding & the resulting detriment of public well-being, the economy & the environment.
Indicators, Targets & Trends
Indicator: Amount of development permitted in the floodplain against the advice of the EA. Baseline: For WoBC no development permitted in floodplain against EA advice on flood defence or water quality grounds since adoption of the Local Plan in 1999. Indicator: No. planning applications for new residential & commercial development incorporating a sustainable drainage system. Baseline: For WoBC in 2007/08 the figure was 29%. Target: PPS25 requires LDF to reduce flood risk & consequences of flooding through new development. Trends: Code for Sustainable Homes & BREEAM standards & WoBC Climate Neutral Development Guidance encourage application of SuDS in new development. Application appears to be erratic.
Objective Reduce the causes of climate change & prepare for its impacts. Indicators, Targets & Trends
Indicator: Capacity during ‘critical periods’ to supply water without need for restrictions. Trends: Three Valleys Water reports water supply problems not expected if new reservoir in Oxfordshire completed.
Objective Maintain & improve the water quality of the region’s rivers & groundwater, & achieve sustainable water resources management.
Indicators, Targets & Trends
Indicator: Rivers of ‘good’ or ‘fair’ chemical quality; Rivers of ‘good’ or ‘fair’ biological quality. Baseline: For WoBC in 2004, 85.9% of rivers of good chemical quality, 14.1% of fair chemical quality, 72.5% of good biological quality, & 27.5% of fair biological quality. Target: By 2005 for 91% of river length to comply with EA River Quality Objectives. Trends: Data suggests improvement required. Problems & Constraints: Advice from Defra or EA required re. accuracy & continuing availability of data, clarification of current objective & an updated target. Indicator: Consumption of water. Baseline: For WoBC, non-metered figure is 177 litres per person per day, & metered figure is 143 litres. Woking consumes approximately 21 million litres of water per day. Target: Reduce consumption to 130 litres per person per day. Trends: Water consumption is very high. Indicator: Incidents of major & significant water pollution. Baseline: For WoBC in 2004-07, no Category 1 or 2 incidents. Target: By 2007, achieve 12% reduction in Category 1 or 2 pollution incidents from all sectors. Trends: Thames region saw overall 1% increase in water pollution incidents between 2004 & 2007, but category 1 incidents dropped from 19 to 11 & category 2 incidents dropped from 79 to 53. Indicator: No. new dwellings incorporating greywater systems/rainwater harvesting. Problems & Constraints: Water consumption is an element of the Code for Sustainable Homes. Indicator: Pressure on water resources. Trends: Three Valleys Water reports that water supply is not expected to be a problem if a new reservoir in Oxfordshire is completed.
Appendix 2 to the Surrey Transport Plan Environmental Report – January 2011
21

Appendix 2-F: Review of District & Borough LDF Baseline for the Built Environment
Elmbridge Borough Council
Objective To minimise the harm from flooding.
Indicators, Targets & Trends
Indicator: No. properties at risk from flooding (Zones 2 & 3). Baseline: In Elmbridge 12,500 properties are in Flood Zone 2 or 3. Target: To prevent all inappropriate development in the flood plain. Trends: The figure has increased after the release of the EA flood zones data for 2004, indicating a greater area at risk of flooding. Indicator: No. planning permissions given contrary to Environment Agency advice. Baseline: For Elmbridge the figure for 2008 was zero.
Objective To improve the accessibility of all services & facilities.
Indicators, Targets & Trends Indicator: Proportion of (major) development located in accessible areas – sites of 5+ dwellings.
Objective To reduce road congestion & the need for travel.
Indicator: Proportion of new development incorporating maximum parking standards. Baseline: For Elmbridge in 2007/08, average for fully completed sites was 1.8 spaces per dwelling. Trends: This is a 0.2% increase on the last 2 years. This is above the 1.5 average that needs to be met in the borough.
Indicators, Targets & Trends
Epsom & Ewell Borough Council
Objective To minimise the harm from flooding.
Indicators, Targets & Trends
Indicator: No. properties at risk from flooding . Indicator: No. properties or households that have access to the Environment Agency’s flood warning service.
Objective Balancing the needs for employment & housing to reduce the need to travel.
Indicators, Targets & Trends
Indicator: Area of employment sites lost to other uses. Indicator: No. granted planning permissions for commercial development. Indicator: Housing completions. Indicator: Proportion of major development located in accessible areas.
Objective To reduce road congestion & the need for travel.
Indicators, Targets & Trends Indicator: Proportion of new development incorporating maximum parking standards.
Guildford Borough Council
Objective To reduce the risk of flooding & the resulting detriment to public well being, the economy & the environment.
Indicators, Targets & Trends
Indicator: No. properties at risk from flooding. Baseline: EA identified 8,750 properties in the Thames Region SE Area in the floodplain & at risk from flooding. Target: For no development to be permitted in the floodplain against EA advice. Problems & Constraints: PPS 25 to be considered & the SFRA. Indicator: No. buildings within the floodplain of the River Wey.
Objective To make the best use of previously developed land & existing buildings, encouraging sustainable construction.
Indicator: % dwellings & commercial development built on previously developed land. Baseline: In 2005/06 100% of all dwellings approved were on PDL. Target: BVPI target for 2008/09 is 100%. Trends: Since 2001 GBC has exceeded its target of 97%. Indicator: Average density on sites with 10 or more dwellings. Baseline: The average density on sites with 10 or more dwellings approved in 2005/06 is 84 dph. Target: To ensure average land density is between 30-50 dph. Trends: Increase in the density between 2004/05 (47 dph) & 2005/06 (84 dph).
Indicators, Targets & Trends
Indicator: No. homes affected by subsidence.
Objective To provide for appropriate commercial development opportunities to meet the needs of the economy.
Indicator: Amount of commercial floor space lost/gained through planning permissions & completions for commercial development. Baseline: In 2005/06 46 planning applications for commercial development approved. Trends: In 2004/05 41 approvals. Indicators,
Targets & Trends Indicator: No. employment sites lost to other uses. Baseline: In 2005/06 9 approvals involving the loss of business, industrial or warehousing land. Trends: In 2004/05 13 approvals.
Appendix 2 to the Surrey Transport Plan Environmental Report – January 2011
22

Appendix 2-F: Review of District & Borough LDF Baseline for the Built Environment
Mole Valley District Council
Objective To minimise the harm from flooding.
Indicators, Targets & Trends
Indicator: No. properties at risk from flooding. Baseline: For MVDC in 2004 1,559 properties. Target: To prevent all inappropriate development in the flood plain. Problems & Constraints: EA flood zones are subject to revision. Indicator: No. properties or households that have access to the Environment Agency’s flood warning system.
Objective Make land available to meet the needs of the economy.
Indicators, Targets & Trends
Indicator: No. granted planning permissions for commercial development. Baseline: For MVDC in Mar 2008 office (B1) 42,050 m2 & industry/ storage (B1c/B2/B8) 19,450 m2. Indicator: The area of employment sites lost to other uses. Baseline: For MVDC in 2006/07 2.09ha. Indicator: % vacant employment floorspace. Baseline: For MVDC in 2007/08, offices 7.4% & industry/storage 2.4%. Indicator: Shop surveys (growth/change in floorspace use & vacancy rates).
Reigate & Banstead Borough Council
Objective To minimise the harm from flooding.
Indicators, Targets & Trends
Indicator: No. properties at risk from flooding. Target: To prevent all inappropriate development in the floodplain. Trends: The effects of climate change will increase the risk of flooding to properties. Indicator: No. properties or households that have access to the EA’s flood warning system.
Objective To reduce road congestion & the need to travel. Indicators, Targets & Trends
Indicator: LA to have implemented a local parking management plan. Target: To have the plan implemented by 2006.
Objective Make land available to meet the needs of the economy. Indicator: No. granted planning permissions for commercial development.
Indicators, Targets & Trends Indicator: The area of employment sites lost to other uses. Baseline: For RBBC 3 former industrial sites
lost to residential development.
Runnymede Borough Council
To reduce the risk of flooding & the resulting detriment to public well-being, the economy & the environment. Objective
Indicators, Targets & Trends
Indicator: Properties at risk from flooding. Baseline: For RBC in 2006 8,298 residential properties & 605 commercial properties at risk of flooding.
Spelthorne Borough Council
Objective To minimise the harm from flooding. Indicator: No. properties at risk from flooding. Baseline: For SBC the figure is 1,502 dwellings. Target: To prevent all inappropriate development in the flood plain. Trends: The figure has increased after the release of the EA flood zones 2004 indicating a greater area at risk of flooding.
Indicators, Targets & Trends
Objective Provide for appropriate commercial development opportunities to meet the needs of the economy.
Indicators, Targets & Trends
Indicator: No. granted planning permissions for commercial development. Indicator: Area of employment sites lost to other uses. Baseline: For SBC in 2003/04 the 1.35 ha. Indicator: Total quantity of commercial floorspace. Indicator: Total quantity of retail floorspace.
Surrey Heath Borough Council
Objective To reduce the risk of flooding. Indicators, Targets & Trends Indicator: No. properties flooded per annum.
Objective To make the best use of previously developed land & existing buildings. Indicators, Targets & Trends Indicator: Amount of empty properties.
Objective To support existing economic & agricultural activity in rural areas. Indicators, Targets & Trends Indicator: Vacant floorspace. Baseline: For SHBC in 2002/03 41,009 sq m.
Appendix 2 to the Surrey Transport Plan Environmental Report – January 2011
23

Appendix 2-F: Review of District & Borough LDF Baseline for the Built Environment
Surrey Heath Borough Council (continued)
Objective To sustain & enhance the viability & vitality of town centres. Indicators, Targets & Trends Indicator: Vacant floorspace. Baseline: For SHBC in 2002/03 41,009 sq m.
Tandridge District Council
Objective To minimise the harm from flooding.
Indicators, Targets & Trends
Indicator: No. properties at risk from flooding (Zones 2 & 3). Baseline: Figures for TDC, 695 properties in Flood Zone 3 & 1,314 in Flood Zone 2. Target: To prevent all inappropriate development in the flood plain. Problems & Constraints: EA flood zones subject to revision & may not be comparing like with like. Indicator: No. properties or households that have access to the EA’s flood warning service. Baseline: For TDC, all residents are able to sign up to the EA Floodline Warning Direct.
Objective To reduce road congestion & the need for travel. Indicators, Targets & Trends
Indicator: Proportion of new development incorporating maximum parking standards. Target: 100% (may be considered on a site by site basis). Problems & Constraints: Not currently monitored.
Objective Make land available to meet the needs of the economy. Indicator: No. granted planning permissions for commercial development. Baseline: Figures for TDC in 2007/08, 2,453 m2.
Indicators, Targets & Trends Indicator: Area of employment sites lost to other uses. Baseline: Figure for TDC in 2007/08, 1.02 ha.
Indicator: % vacant employment floorspace. Baseline: Figure for TDC in 2000-01, 7%. Trends: 1999-2001 level remained stable. Problems & Constraints: No longer monitored at national or local level.
Waverley Borough Council
Objective To maintain & enhance the quality of landscapes & townscapes. Indicators, Targets & Trends Indicator: Developments awarded Waverley design award.
Objective To reduce vulnerability to the impacts of climate change, especially flooding. Indicators, Targets & Trends
Indicator: No. properties located within flood zone 2 or flood zone 3 (target – no new development on undeveloped land at high risk of flooding).
Objective To encourage sustained economic growth
Indicators, Targets & Trends
Indicator: Available business premises; employment statistics; vacancy rates of commercial property within town centres.
Objective To encourage efficient patterns of movement. Indicator: % completed non-residential development complying with car parking standards. Indicators,
Targets & Trends Indicator: Amount of completed retail & leisure development & % in town centres.
Woking Borough Council
Objective Reduce the risk of flooding & the resulting detriment of public well-being, the economy & the environment. Indicator: No. properties alleviated from flood risk. Baseline: For WoBC, none to date. Target: PPS25 requires LDF to reduce flood risk & consequences of flooding through new development. Trends: Westfield Tip/Hoe Stream, 198 dwellings to be alleviated from flood risk, 2008 to 2013.
Indicators, Targets & Trends
Objective Make the best use of previously developed land & existing buildings. Indicator: Housing densities in urban areas. Baseline: Figure for WoBC in 2007-08, 250 dph in town centre, & 109 dph in district centres. Target: Minimum of 30 dph. Trends: Target being exceeded, in 2006-07 substantially. Problems & Constraints: Perhaps indicative of overprovision of 1 & 2 bedroom properties & raises the question of whether open space needs are being met.
Indicators, Targets & Trends
Objective Provide a range of commercial development opportunities to meet the needs of the economy &, in particular, support & enhance the economies of town & local centres. Indicator: Amount of commercial & industrial floorspace. Baseline: For WoBC in 2007, 408,000 m2 of office space, 142,000 m2 of factory space & 104,000 m2 of warehouse space. Problems & Constraints: Data alone does not provide much information about trends or issues. The Employment Land Review will assist in this respect.
Indicators, Targets & Trends
Indicator: Amount of vacant commercial & industrial floorspace. Baseline: Figure for WoBC in 2007, 16.5% vacancy. Trends: Vacancy rates have increased. Problems & Constraints: The Employment Land Review will provide more information about the circumstances & issues. Indicator: Vacant floorspace in the town & village centres. Baseline: For WoBC in 2007 town centre vacancy is 8%, the rest of the urban area is 24% & the green belt is 5%. Trends: The data indicates that vacancy rates are high outside the town centre & the green belt.
Appendix 2 to the Surrey Transport Plan Environmental Report – January 2011
24

Appendix 2-G: Review of District & Borough LDF Baseline for the Historic Environment & Archaeology
Elmbridge Borough Council
Objective To protect & enhance the natural, archaeological & historic environments & cultural assets.
Indicators, Targets & Trends
Indicator: No. Listed Buildings, ancient monuments & Conservation Areas. Baseline: In 2007/08, 8 Grade I LBs, 24 Grade II* LBs, 743 Grade II LBs, 6 Ancient Monuments, & 24 Conservation Areas. Target: No reduction in these numbers. Indicator: Proportion of statutory Listed Buildings at risk. Baseline: In 2008,1 Grade II* LB at risk. Target: No statutory Listed Buildings at risk. Indicator: Proportion of statutory Listed Buildings demolished or removed from the list owing to approved or unauthorised alterations. Baseline: In 2008, the figure was zero. Indicator: No. statutory Listed Buildings demolished. Baseline: In 2008, the figure was zero. Target: For this figure to remain at zero. Indicator: Proportion of Scheduled Ancient Monuments at risk. Baseline: In 2008, the figure was zero. Target: For this figure to remain at zero. Indicator: No. sites of archaeological importance. Baseline: 91 Areas of High Archaeological Potential. Indicator: Proportion of Conservation Areas with an appraisal that has been reviewed within the previous 5 years. Baseline: There are 7 CAs. Target: To work through the agreed list of priority areas.
Epsom & Ewell Borough Council
Objective To protect & enhance the natural, archaeological & historic environments & cultural assets.
Indicators, Targets & Trends
Indicator: No. Listed Buildings, ancient monuments & Conservation Areas (CAs). Indicator: Proportion of statutory Listed Buildings at risk. Indicator: Proportion of statutory Listed Buildings demolished or removed from the list owing to approved or unauthorised alterations. Indicator: Proportion of scheduled ancient monuments at risk. Indicator: Proportion of potential archaeological sites where acceptable assessment took place & proportion where archaeological recording took place to a satisfactory standard having been required. Indicator: Proportion of CAs with an appraisal that has been reviewed within the previous 5 years. Indicator: No. unauthorised works undertaken within CAs in previous 4 years that have been enforced against. Indicator: No. properties open to the public on heritage open days.
Guildford Borough Council
Objective To protect & enhance, & where appropriate make accessible for enjoyment the natural, archaeological & historic environments & cultural assets of Guildford, for the benefit of both residents & visitors.
Indicators, Targets & Trends
Indicator: No. Listed Buildings (statutory & locally listed), historic parks & gardens, Areas of High Archaeological Potential & Scheduled Ancient Monuments. Baseline: 1,070 LBs, 261 locally LBs & other structures, including 21 SAMs, 178 AHAPs. Target: To protect AMs & LBs in accordance with PPG15 & PPG16. Indicator: No. Conservation Area appraisals completed per year. Baseline: 38 CAs. Trends: 7 appraisals completed. Problems & Constraints: No. CA appraisals completed will depend on resource availability & extent to which up to date appraisals are already in place for some CAs. Indicator: No./% total no. statutory listed buildings at risk. Baseline: 9 LBs at risk. Target: To decrease no. LBs at risk. Problems & Constraints: The latest Buildings at Risk Register is 2004. Indicator: No./% total no. statutory listed buildings demolished or removed from the list owing to approved or unauthorised alterations. Indicator: No./% total no. SAMs at risk/lost or damaged. Baseline: 1 SAM. Target: 0%. Problems & Constraints: Influence that the planning system can have is limited as these are not within LA control. Indicator: No. properties open to the public on heritage open days. Baseline: 60 buildings in total. Target: To increase access to the historic environment for all. Indicator: Proportion of planning applications with identified potential archaeological impacts, where acceptable archaeological assessment &/or mitigation occurred. Target: 100%.
Appendix 2 to the Surrey Transport Plan Environmental Report – January 2011
25

Appendix 2-G: Review of District & Borough LDF Baseline for the Historic Environment & Archaeology
Mole Valley District Council
Objective To protect & enhance the natural, archaeological & historic environments & cultural assets.
Indicators, Targets & Trends
Indicator: No. Listed Buildings, Ancient Monuments & Conservation Areas. Baseline: In 2004, 6 Grade I LBs, 43 Grade II* LBs, 943 Grade II LBs, 27 AMs, 28 CAs. Target: No reduction in these numbers. Indicator: Proportion of statutory Listed Buildings at risk. Baseline: In 2007, 2 LBs. Target: Reduce figure. Trends: No. at risk is declining. Problems & Constraints: Require a proper risk survey of all LBs. Indicator: Proportion of statutory Listed Buildings demolished or removed from the list owing to approved or unauthorised alterations. Baseline: In 2007, zero. Target: Figure to remain at zero. Indicator: Proportion of AMs at risk. Baseline: 1 out of 27 (3.7%) AMs. Problems & Constraints: May not be within LPA control. Some AMs at risk due to management rather than through development. Indicator: Proportion of Conservation Areas with an appraisal that has been reviewed within the previous 5 years. Baseline: 3 out of 28 CAs. Target: For 4 to be completed each year from 2006. Problems & Constraints: Dependent on additional resources through planning delivery grant. Indicator: No. unauthorised works undertaken within Conservation Areas in the previous 4 years that have been enforced against.
Reigate & Banstead Borough Council
Objective To protect & enhance the natural, archaeological & historic environments & cultural assets.
Indicators, Targets & Trends
Indicator: No. Listed Buildings, Ancient Monuments & Conservation Areas. Baseline: In 2008, 5 Grade I LBs, 18 Grade II* LBs, 427 Grade II LBs, 526 Local List LBs, 21 AMs, & 17 CAs. Target: No reduction in these no.s & upgrade/add where appropriate. Trends: Large increases not anticipated, additions continue to occur as part of DC process. Problems & Constraints: Additions are resource intensive. Indicator: Proportion of statutory LBs at risk. Baseline: In 2008, no Grade I or Grade II* LBs at risk & 2.3% of Grade II LBs at risk. Target: Reduce figure. Trends: Continued reduction. Problems & Constraints: Removal of Historic Buildings Grant Fund. Indicator: Proportion of statutory LBs demolished or removed from the list owing to approved or unauthorised alterations. Baseline: In 2008, zero. Target: Figure to remain at zero. Trends: Rigorous enforcement ensures standard of LBs maintained. Problems & Constraints: Lack of Historic Buildings Grant for appropriate maintenance. Indicator: Proportion of AMs at risk. Baseline: In May 2005, 2 AMs. Target: To persuade owners to make repairs. Trends: Lack of local powers is problematic & lack of grant fund makes influence difficult. Indicator: Proportion of potential archaeological sites where acceptable archaeological assessment/ recording took place. Target: For investigation & recording targets to be 100%. Indicator: Proportion of CAs with an appraisal that has been reviewed within the previous 5 years. Baseline: 3 in progress. Target: For 1 to be undertaken per year. Trends: 1 per year. Problems & Constraints: Additional funding for map preparation needed. Conservation assistant post lost. Indicator: No. unauthorised works undertaken within CAs in previous 4 years that have been enforced against. Target: To investigate all breaches & take action where expedient. To monitor quality of area on regular basis. Trends: Breaches at a very low level due to rigorous enforcement. Problems & Constraints: The absence of a Historic Buildings Grant Fund slows progress in remedying cases. Indicator: No. properties open to the public on heritage open days. Target: To maintain current levels.
Runnymede Borough Council
Objective To protect, enhance & make accessible for enjoyment, the region’s countryside & historic environment.
Indicators, Targets & Trends
Indicator: % buildings of Grade I & II at risk of decay. Baseline: For RBC in 2007 there were no buildings at risk. Trends: Neutral/unchanged
Spelthorne Borough Council
Objective To protect & enhance the natural, archaeological & historic environments.
Indicators, Targets & Trends
Indicator: No. Listed Buildings, Ancient Monuments & Conservation Areas. Target: No reduction in current no.s. Indicator: Statutory Listed Buildings at risk. Baseline: In 2004, 1 LB at risk. Target: See figure reduced. Indicator: Statutory Listed Buildings demolished. Baseline: For 2002-2004, zero. Target: Figure to remain at zero. Indicator: Proportion of Ancient Monuments damaged by unlawful works. Indicator: No. properties open to the public on heritage open days. Baseline: In 2004, zero. Target: To increase from zero. Indicator: Proportion of planning applications with potential archaeological impacts where acceptable assessment &/or mitigation occurred.
Appendix 2 to the Surrey Transport Plan Environmental Report – January 2011
26

Appendix 2-G: Review of District & Borough LDF Baseline for the Historic Environment & Archaeology
Surrey Heath Borough Council
Objective To protect & where appropriate enhance the landscape, buildings, sites & features of archaeological, historical or architectural interest & their settings.
Indicator: No. Listed Buildings, Ancient Monuments & Conservation Areas. Baseline: In 2004, 175 LBs, 4 AMs & 9 CAs.
Indicators, Targets & Trends
Indicator: Statutory Listed Buildings at risk. Baseline: Between 2002 & 2004, none. Indicator: No. statutory Listed Buildings demolished. Baseline: Between 2002 & 2004, none. Indicator: Ancient Monuments at risk. Baseline: Between 2002 & 2004 no AMs at risk.
Tandridge District Council
Objective To protect & enhance the natural, archaeological & historic environments & cultural assets.
Indicators, Targets & Trends
Indicator: No. Listed Buildings, Ancient Monuments & Conservation Areas. Baseline: In 2009, 20 Grade I LBs, 52 Grade II* LBs, 524 Grade II LBs, 20 AMs & 19 CAs. Target: No reduction in these numbers. Indicator: Proportion of statutory Listed Buildings at risk. Baseline: In 2009, 1 LB at risk. Target: Reduce figure. Trends: The no. at risk is declining. Indicator: Proportion of statutory Listed Buildings demolished or removed from the list owing to approved or unauthorised alterations. Baseline: For 2000-2009, zero. Target: Figure to remain at zero. Indicator: Proportion of Ancient Monuments damaged by unlawful works. Problems & Constraints: Not within LPA control. Indicator: Proportion of planning applications with identified potential archaeological impact, where acceptable archaeological assessment &/or mitigation occurred. Indicator: Proportion of Conservation Areas with an appraisal that has been reviewed within the previous 5 years. Baseline: 18 CAs, 1 appraisal carried out in 2002. Indicator: No. unauthorised works undertaken within Conservation Areas in previous 4 years that have been enforced against.
Waverley Borough Council
Objective To maintain & enhance the quality of landscapes & townscapes.
Indicator: No. Listed Buildings deemed to be at risk. Indicator: Additional Listed Buildings.
Indicators, Targets & Trends Indicator: No. & area of designated Conservation Areas.
Indicator: Loss or damage through development to designated sites & buildings of international, national & county heritage importance.
Objective To conserve & enhance the historic environment.
Indicators, Targets & Trends
Indicator: No. Ancient Monuments, historic parks & gardens, heritage features & sites of archaeological importance.
Woking Borough Council
Objective Protect, enhance & where appropriate make accessible for the enjoyment the natural, archaeological & historic environments & cultural assets & landscapes of Woking.
Indicators, Targets & Trends
Indicator: No. Listed Buildings, locally listed buildings, Ancient Monuments & Conservation Areas. Baseline: In Feb 2008, 4 Grade I LBs, 10 Grade II* LBs, 165 Grade II LBs, 330 locally listed buildings & 5 AMs. Trends: Between 1999 & 2008 an increase of 21 LBs in the borough, 18 of which are tombs. Indicator: No. Conservation Area character appraisals. Baseline: In 2005-06, 6 new appraisals, 5 of 25 appraisals up to date in 2006-07, & 0 new appraisal in 2007-08. Trends: Only 5 less than 5 years old Indicator: No. Listed Buildings & Ancient Monuments at risk of decay. Baseline: In 2008, 0 buildings on the At Risk Register. Trends: All at risk buildings have been removed from the Register. Indicator: No. properties open to the public on heritage days. Baseline: In 2008, 13. Trends: Steady increase in no. properties open to the public on heritage days. Indicator: Historic landscapes. Baseline: No historic landscapes designated in the borough. Indicator: No. sites in areas of high archaeological potential where development takes place without prior assessment. Baseline: In 2007-08, no development took place without prior assessment. Target: For archaeological factors to be taken fully into account. Trends: Planning policy appears to be providing appropriate control.
Appendix 2 to the Surrey Transport Plan Environmental Report – January 2011
27

Appendix 2-H: Review of District & Borough LDF Baseline for the Natural Environment & Biodiversity
Elmbridge Borough Council
Objective To conserve & enhance biodiversity within the plan area.
Indicators, Targets & Trends
Indicator: Population of wild birds. Target: By 2010, to achieve a sustained increase in the regional wild bird population. Trends: Decrease in numbers since 1970. Indicator: No. characteristic rare species & priority habitats. Indicator: Extent (hectares) & condition of land designated as a SSSI. Baseline: 1 SSSI is 100% favourable, 1 is 100% recovering, & 1 is 97.55% recovering & 2.45% declining. Target: By 2010, to ensure that 95% of SSSIs are in favourable or recovering condition. Indicator: No. SNCIs & LNRs within Elmbridge. Baseline: In 2008, 14 SNCIs in the borough. Indicator: Extent of ancient woodlands. Baseline: In 2008, 16 sites covering 218.53 ha. Target: To protect & preserve these areas. Trends: Surrey is the most wooded county in the UK. Problems & Constraints: Sites below 2 ha in size are currently excluded from the data. Indicator: Extent & condition of key habitats for which BAPs have been established. Indicator: No. new developments contributing to mitigation of Thames Basin Heaths SPA. Baseline: In 2008, 15 schemes.
Objective To protect & enhance the natural, archaeological & historic environments & cultural assets.
Indicator: Loss of greenspace. Indicators, Targets & Trends
Indicator: Improvements to greenspace. Indicator: No. green spaces qualifying for Green Flag status. Baseline: No greenspaces with Green Flag status, but 3 sites entered for 2009.
Objective To ensure that the borough is prepared for the impacts of climate change.
Indicator: No. sites of ecological inertest where flora & fauna were damaged by an extreme or persistent weather event. Target:: For the ecological value of all sites to be capable of recovery following an extreme or persistent weather event. Problems & Constraints: The no. sites could be a useful indicator but there is no centralised control & many bodies would need to be contacted.
Indicators, Targets & Trends
Epsom & Ewell Borough Council
Objective To conserve & enhance biodiversity within the plan area. Indicator: Hectares of land designated as a SSSI. Baseline: 129.65 ha of land designated as SSSI.
Indicators, Targets & Trends
Indicator: No. & area of SNCIs & LNRs within Epsom & Ewell. Baseline: 17 SNCIs covering 596 ha, includes 2 LNRs covering 50.4 ha. Indicator: Extent of ancient woodlands.
Objective To protect & enhance the natural, archaeological & historic environments & cultural assets.
Indicators, Targets & Trends
Indicator: Level of recreation activity associated with biodiversity. Indicator: Achievement of ‘Accessible Natural Greenspace Standards’. Indicator: Promotion & safeguard of open land & green corridors in urban areas. Indicator: Improvement in accessibility of the countryside to the public via the Rights of Way network.
Objective To ensure that the district is prepared for the impacts of climate change. Indicators, Targets & Trends
Indicator: No. sites of ecological inertest where flora & fauna were damaged by an extreme or persistent weather event.
Guildford Borough Council
Objective To protect & enhance, & where appropriate make accessible for enjoyment the natural, archaeological & historic environments & cultural assets of Guildford, for the benefit of both residents & visitors. Indicator: Level of recreation activity associated with biodiversity (e.g. recorded visit no.s to wildlife reserves, visitor centres, proportion of ancient & non-ancient woodland having public access). Indicator: Achievement of ‘Accessible Natural Greenspace Standards’. Target: People in towns & cities should have greenspace <300 m from home, at least 1 accessible 20 ha site within 2km, 1x 100 ha site within 5km & 1x 500 ha within 10 km & 1ha of LNR per 1,000 people. Problems & Constraints: Applying standard may mask local deficiency & may be worth applying standards at a ward or parish level.
Indicators, Targets & Trends
Indicator: Open space & formal recreational facility assessment – total quantity & qualitative assessment scores, e.g. square metres of parks & open space per 1,000 population.
Appendix 2 to the Surrey Transport Plan Environmental Report – January 2011
28

Appendix 2-H: Review of District & Borough LDF Baseline for the Natural Environment & Biodiversity
Guildford Borough Council (continued)
Objective To conserve & enhance biodiversity within the plan area.
Indicators, Targets & Trends
Indicator: Population of wild birds. Target: To be in line with the Surrey BAP. Trends: The overall indicator of 113 breeding bird populations in the UK is nearly 10% higher than in 1970. Indicator: No. internationally & nationally important designated wildlife & geological sites (SSSI, SPA, SAC & Ramsar Sites). Baseline: 16 SSSIs covering 2,576.09 ha, a % of which is in unfavourable condition. Target: To aim to meet SSSI, SPA, SAC & Ramsar objectives. Problems & Constraints: Site integrity to be assessed based on condition of designated features of interest. Indicator: Area of internationally & nationally important designated wildlife & geological sites (SSSI, SPA, SAC & Ramsar Sites) damaged. Baseline: 16 SSSIs covering 2,576.09 ha, a % of which is in unfavourable condition. Target: To aim to meet SSSI, SPA, SAC & Ramsar objectives. Problems & Constraints: Site integrity to be assessed based on condition of designated features of interest. Indicator: Extent & condition of habitats for which BAPs have been established. Target: To be in line with those set out in the Surrey BAP. Indicator: No., area & condition of SNCIs & LNRs within the borough. Baseline: 140 SNCIs & 10 RIGS. Problems & Constraints: Also consider separate indicator referring to protection of river corridors & their buffer zones. Indicator: No. characteristic rare species & priority habitats. Target: To maintain, develop & improve salmon, freshwater fish & eel fisheries in freshwaters, estuaries & coastal waters. Indicator: Amount, reported condition, reported levels of damage to, extent of active management of ancient woodlands. Target: To achieve favourable condition of ancient woodland & to avoid significant loss. Trends: Almost 50% of ancient woodland remaining in the 1930’s has been lost or degraded. Indicator: No. & area of SPA within the borough. Baseline: Thames Basin Heaths SPA designated in March 2005. Indicator: No. species occurring in the borough which have a SAP. Indicator: Area of land actively managed for nature conservation. Target: To maintain & enhance BAP habitats & species in line with targets. Indicator: Conservation limit for salmon rivers. Target: To maintain, develop & improve salmon, freshwater fish & eel fisheries in freshwaters, estuaries & coastal waters. Indicator: Area or length of fluvial or estuarine habitat improvement. Target: To maintain, develop & improve salmon, freshwater fish & eel fisheries in freshwaters, estuaries & coastal waters. Indicator: Ecological & chemical water quality & extent & condition of river buffer zones. Target: To maintain, develop & improve salmon, freshwater fish & eel fisheries in freshwaters, estuaries & coastal waters. Indicator: Area of land newly dedicated to wildlife in new developments. Indicator: No. developments with green (e.g. sedum) roofs developed in borough. Indicator: No. & % (of total) new developments with wildlife friendly sustainable drainage systems.
Mole Valley District Council
Objective To conserve & enhance biodiversity within the plan area. Indicator: Ha land designated as SSSI. Baseline: In 2008, 2,030 ha (47% favourable, 44% recovering). Target: No reduction in extent of SSSI & ensure 95% of SSSIs are in favourable or recovering condition by 2010. Problems & Constraints: Quality of SSSI out of LA control, primarily a land management issue.
Indicators, Targets & Trends
Indicator: No. & area of SNCIs & LNRs within Mole Valley. Baseline: In 2004, 52 SNCI (855 ha), 28 potential SNCI (627.5ha), 11 part SNCI/pSNCI, & for 2006/07, 5 LNRs (99.39 ha). Problems & Constraints: Much Mole Valley SNCI information is out of date, new surveys needed. Indicator: Extent of ancient woodlands. Baseline: In 2004, total area 3,023 ha. Problems & Constraints: Condition not generally monitored.
Objective To ensure that the district is prepared for the impacts of climate change. Indicators, Targets & Trends
Indicator: No. sites of ecological interest where flora or fauna were damaged by extreme or persistent weather event. Target: For the ecological value of all sites to be capable of recovery.
Reigate & Banstead Borough Council
Objective To conserve & enhance biodiversity within the plan area. Indicator: Extent & condition of land designated as a SSSI. Baseline: For 2000-05, 606.6 ha SSSI (93% favourable or recovering). Target: No reduction in extent of SSSI & ensure 95% of SSSIs are favourable or recovering by 2010. Problems & Constraints: Quality of SSSI out of LA control, primarily a land management issue. Indicator: Extent & condition of other key habitats for which BAPs have been established (e.g. area of habitat lost as a result of planning permissions).
Indicators, Targets & Trends
Indicator: No., area & condition of SNCIs & LNRs. Trends: The no. & area of SNCIs, potential SNCIs & LNRs is increasing. Indicator: Extent & condition of ancient woodlands. Baseline: Current estimate, 495 ha. Target: To preserve & protect these areas.
Appendix 2 to the Surrey Transport Plan Environmental Report – January 2011
29

Appendix 2-H: Review of District & Borough LDF Baseline for the Natural Environment & Biodiversity
Reigate & Banstead Borough Council (continued)
Objective To ensure that the district is prepared for the impacts of climate change.
Indicators, Targets & Trends
Indicator: No. sites of ecological interest where flora or fauna were damaged by an extreme or persistent weather event (e.g. tree loss from storm, species loss resulting from habitat change caused by persistent dry or wet conditions). Target: Ecological value of all sites to be capable of recovery. Problems & Constraints: No. sites could be a useful indicator but there is no centralised control & many bodies would need to be contacted.
Runnymede Borough Council
Objective To conserve & enhance the region’s biodiversity.
Indicators, Targets & Trends
Indicator: Population of wild birds. Indicator: Condition of SSSIs. Baseline: 96.74% favourable or recovering condition. Indicator: Extent & condition of key habitats for which BAPs have been established. Indicator: Extent of ancient woodlands. Baseline: 303.5 ha.
Objective To protect, enhance & make accessible for enjoyment, the region’s countryside & historic environment. Indicators, Targets & Trends Indicator: Land covered by management schemes.
Spelthorne Borough Council
Objective To conserve & enhance biodiversity within the plan area.
Indicators, Targets & Trends
Indicator: Population of gadwall & shoveler. Target: By 2010, a sustained increase in regional wild bird population. Trends: Stable in general but decrease within designated SPA sites. Problems & Constraints: May be difficult to record by district, but may be possible to show data by a wider area. Indicator: Extent & condition of land designated as a SSSI. Baseline: In 2004, 4 SSSIs covering 749.9 ha, 37.7% in favourable & 26.6% in recovering condition. Target: No reduction in extent of SSSI & ensure 95% of SSSIs are in favourable or recovering condition by 2010. Indicator: Extent & condition of key habitats for which BAPs have been established. Indicator: No., area & condition of SNCIs & LNRs within Spelthorne. Baseline: 26 SNCIs covering 784.88 ha. Problems & Constraints: No LNRs in Spelthorne.
Objective To protect & enhance the natural, archaeological & historic environments. Indicator: Achievement of ‘Accessible Natural Greenspace Standards’ (Natural England). Target: For a natural area to be within 300 metres of home or workplace. Problems & Constraints: Natural area & standards need to be defined. This may duplicate open space standard
Indicators, Targets & Trends
Surrey Heath Borough Council
Objective To improve opportunities for access to education, employment, recreation, health, community services & cultural opportunities for all sectors of the community.
Indicators, Targets & Trends
Indicator: Hectares of accessible green space per 1,000 people. Target: For 1ha accessible natural green space per 1,000 people.
Objective To encourage the enjoyment of the countryside, open spaces & local biodiversity. Indicators, Targets & Trends
Indicator: Hectares of accessible green space per 1,000 people. Target: For 1ha accessible natural green space per 1,000 people.
Objective To conserve & enhance the borough’s biodiversity.
Indicators, Targets & Trends
Indicator: No./area & condition of SNCIs & LNRs within the plan area. Baseline: 987.55 ha of SNCIs & 1 LNR. Target: To halt loss of biodiversity by 2010. Trends: Lowland heathland is a threatened landscape suffering declines since late 19th century. Problems & Constraints: Estimate of SNCIs based on Local Plan 2000 boundaries & may need to be changed. Indicator: Population of characteristic rare species & areas of priority habitats. Target: By 2010, sustained increase in regional wild bird population. Trends: Decrease in no.s since 1970s. Indicator: Population of farmland birds. Baseline: In 2003, 120 nightjar, 64 woodlark & 453 Dartford warbler. Target: By 2010, sustained increase in regional wild bird population. Trends: Decrease in numbers since 1970s. Indicator: Increase in accessible greenspace, habitat links/corridors. Target: For 1ha accessible natural green space per 1,000 people. Indicator: Area of land actively managed for nature conservation. Indicator: No. & condition of heathland sites appropriately managed. Target: For all heathland sites to be appropriately & sustainably managed by 2005. Indicator: Amount of long-term funding secured for sustainable management of heathland in Surrey. Target: To secure long term funding for the sustainable management of heathland in Surrey.
Appendix 2 to the Surrey Transport Plan Environmental Report – January 2011
30
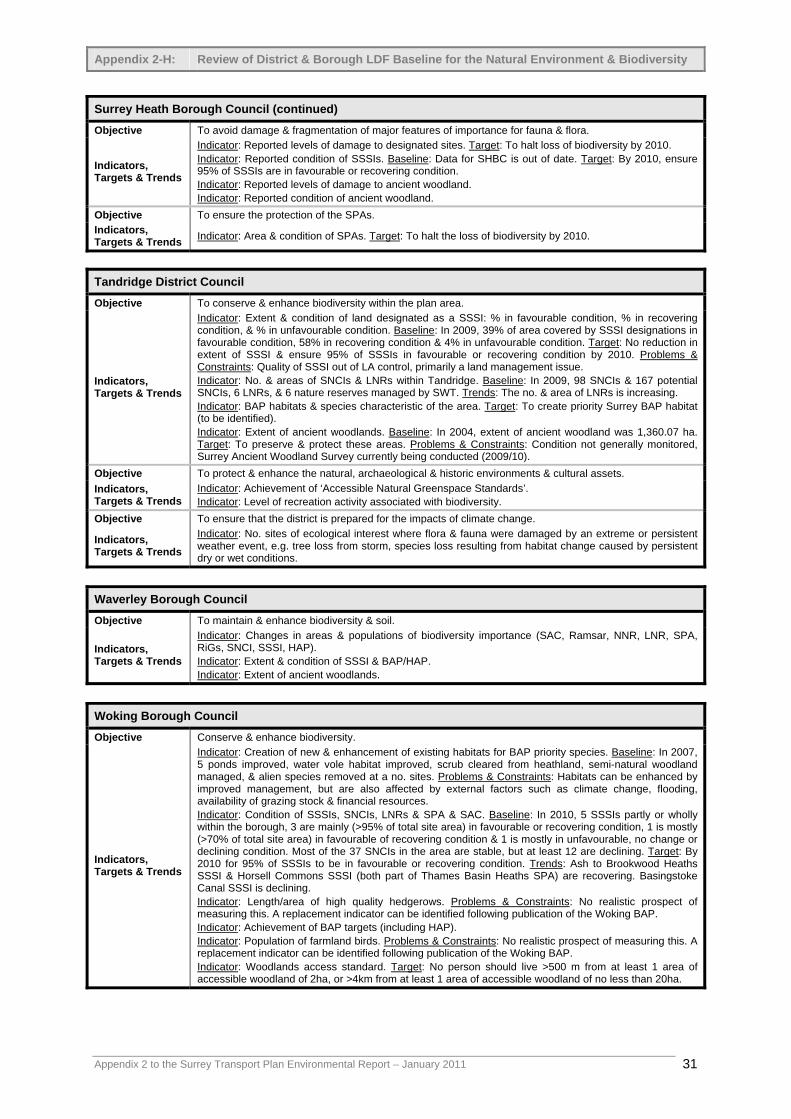
Appendix 2-H: Review of District & Borough LDF Baseline for the Natural Environment & Biodiversity
Surrey Heath Borough Council (continued)
Objective To avoid damage & fragmentation of major features of importance for fauna & flora.
Indicators, Targets & Trends
Indicator: Reported levels of damage to designated sites. Target: To halt loss of biodiversity by 2010. Indicator: Reported condition of SSSIs. Baseline: Data for SHBC is out of date. Target: By 2010, ensure 95% of SSSIs are in favourable or recovering condition. Indicator: Reported levels of damage to ancient woodland. Indicator: Reported condition of ancient woodland.
Objective To ensure the protection of the SPAs. Indicators, Targets & Trends Indicator: Area & condition of SPAs. Target: To halt the loss of biodiversity by 2010.
Tandridge District Council
Objective To conserve & enhance biodiversity within the plan area.
Indicators, Targets & Trends
Indicator: Extent & condition of land designated as a SSSI: % in favourable condition, % in recovering condition, & % in unfavourable condition. Baseline: In 2009, 39% of area covered by SSSI designations in favourable condition, 58% in recovering condition & 4% in unfavourable condition. Target: No reduction in extent of SSSI & ensure 95% of SSSIs in favourable or recovering condition by 2010. Problems & Constraints: Quality of SSSI out of LA control, primarily a land management issue. Indicator: No. & areas of SNCIs & LNRs within Tandridge. Baseline: In 2009, 98 SNCIs & 167 potential SNCIs, 6 LNRs, & 6 nature reserves managed by SWT. Trends: The no. & area of LNRs is increasing. Indicator: BAP habitats & species characteristic of the area. Target: To create priority Surrey BAP habitat (to be identified). Indicator: Extent of ancient woodlands. Baseline: In 2004, extent of ancient woodland was 1,360.07 ha. Target: To preserve & protect these areas. Problems & Constraints: Condition not generally monitored, Surrey Ancient Woodland Survey currently being conducted (2009/10).
Objective To protect & enhance the natural, archaeological & historic environments & cultural assets. Indicator: Achievement of ‘Accessible Natural Greenspace Standards’. Indicator: Level of recreation activity associated with biodiversity.
Indicators, Targets & Trends Objective To ensure that the district is prepared for the impacts of climate change.
Indicator: No. sites of ecological interest where flora & fauna were damaged by an extreme or persistent weather event, e.g. tree loss from storm, species loss resulting from habitat change caused by persistent dry or wet conditions.
Indicators, Targets & Trends
Waverley Borough Council
Objective To maintain & enhance biodiversity & soil. Indicator: Changes in areas & populations of biodiversity importance (SAC, Ramsar, NNR, LNR, SPA, RiGs, SNCI, SSSI, HAP). Indicators,
Targets & Trends Indicator: Extent & condition of SSSI & BAP/HAP. Indicator: Extent of ancient woodlands.
Woking Borough Council
Objective Conserve & enhance biodiversity.
Indicators, Targets & Trends
Indicator: Creation of new & enhancement of existing habitats for BAP priority species. Baseline: In 2007, 5 ponds improved, water vole habitat improved, scrub cleared from heathland, semi-natural woodland managed, & alien species removed at a no. sites. Problems & Constraints: Habitats can be enhanced by improved management, but are also affected by external factors such as climate change, flooding, availability of grazing stock & financial resources. Indicator: Condition of SSSIs, SNCIs, LNRs & SPA & SAC. Baseline: In 2010, 5 SSSIs partly or wholly within the borough, 3 are mainly (>95% of total site area) in favourable or recovering condition, 1 is mostly (>70% of total site area) in favourable of recovering condition & 1 is mostly in unfavourable, no change or declining condition. Most of the 37 SNCIs in the area are stable, but at least 12 are declining. Target: By 2010 for 95% of SSSIs to be in favourable or recovering condition. Trends: Ash to Brookwood Heaths SSSI & Horsell Commons SSSI (both part of Thames Basin Heaths SPA) are recovering. Basingstoke Canal SSSI is declining. Indicator: Length/area of high quality hedgerows. Problems & Constraints: No realistic prospect of measuring this. A replacement indicator can be identified following publication of the Woking BAP. Indicator: Achievement of BAP targets (including HAP). Indicator: Population of farmland birds. Problems & Constraints: No realistic prospect of measuring this. A replacement indicator can be identified following publication of the Woking BAP. Indicator: Woodlands access standard. Target: No person should live >500 m from at least 1 area of accessible woodland of 2ha, or >4km from at least 1 area of accessible woodland of no less than 20ha.
Appendix 2 to the Surrey Transport Plan Environmental Report – January 2011
31

Appendix 2-H: Review of District & Borough LDF Baseline for the Natural Environment & Biodiversity
Woking Borough Council
Protect, enhance & where appropriate make accessible for the enjoyment the natural, archaeological & historic environments & cultural assets & landscapes of Woking. Objective
Indicators, Targets & Trends
Indicator: Access to & use of the natural environment. Baseline: 42% of residents used parks & open spaces in the borough at least once a week, a further 22% used them about once a month. Target: For each household to be within 300 m of 1 natural greenspace, within 2km of a 20 ha site, within 5km of a 100 ha site & within 10km of a 500 ha site, & for there to be 1 ha of LNR per 1,000 people. Trends: The 2007 PPG17 Audit reported that 90% of households use natural & semi-natural open space.
Appendix 2 to the Surrey Transport Plan Environmental Report – January 2011
32

Appendix 2-I: Review of District & Borough LDF Baseline for the Landscape & Visual Amenity
Elmbridge Borough Council
Objective To protect & enhance the natural, archaeological & historic environments & cultural assets. Indicator: Loss of greenspace.
Indicators, Targets & Trends
Indicator: Improvements to greenspace. Indicator: No. green spaces qualifying for Green Flag status. Baseline: For Elmbridge there are no greenspaces with Green Flag status, but 3 sites have been entered for 2009.
Epsom & Ewell Borough Council
Objective To protect & enhance the natural, archaeological & historic environments & cultural assets. Indicator: Achievement of ‘Accessible Natural Greenspace Standards’.
Indicators, Targets & Trends Indicator: Promotion & safeguard of open land & green corridors in urban areas.
Indicator: Improvement in accessibility of the countryside to the public via the Rights of Way network.
Guildford Borough Council
To protect & enhance, & where appropriate make accessible for enjoyment the natural, archaeological & historic environments & cultural assets of Guildford, for the benefit of both residents & visitors. Objective
Indicators, Targets & Trends
Indicator: Achievement of ‘Accessible Natural Greenspace Standards’. Target: People living in towns & cities should have greenspace <300 m from home, 1ha of LNR per 1,000 people, & at least 1 accessible 20 ha site within 2km of home, 1x 100 ha site within 5km & 1x 500 ha within 10 km. Problems & Constraints: Applying this standard may mask local deficiency & may be worth applying the standards at a ward or parish level. Indicator: Open space & formal recreational facility assessment – total quantity & qualitative assessment scores, e.g. square metres of parks & open space per 1,000 population.
Mole Valley District Council
Objective To protect & enhance the natural, archaeological & historic environments & cultural assets. Indicators, Targets & Trends Indicator: Improvement in accessibility of the countryside to the public via the Rights of Way network.
Reigate & Banstead Borough Council
Objective None given Indicators, Targets & Trends None given
Runnymede Borough Council
Objective To protect, enhance & make accessible for enjoyment, the region’s countryside & historic environment. Indicators, Targets & Trends
Indicator: Land covered by management schemes. Indicator: Access to & use of the countryside.
Spelthorne Borough Council
Objective To protect & enhance the natural, archaeological & historic environments.
Indicators, Targets & Trends
Indicator: Achievement of ‘Accessible Natural Greenspace Standards’ (Natural England). Target: For a natural area to be within 300 m of home or workplace. Problems & Constraints: Natural area & standards need to be defined. This may duplicate open space standard.
Surrey Heath BC Borough Council
To improve opportunities for access to education, employment, recreation, health, community services & cultural opportunities for all sectors of the community. Objective
Indicators, Targets & Trends
Indicator: Ha accessible green space per 1,000 people. Target: For 1ha accessible natural green space per 1,000 people.
Appendix 2 to the Surrey Transport Plan Environmental Report – January 2011
33

Appendix 2-I: Review of District & Borough LDF Baseline for the Landscape & Visual Amenity
Surrey Heath BC Borough Council (continued)
Objective To encourage the enjoyment of the countryside, open spaces & local biodiversity. Indicators, Targets & Trends
Indicator: Ha accessible green space per 1,000 people. Target: For 1ha accessible natural green space per 1,000 people.
Objective To conserve & enhance the borough’s biodiversity. Indicators, Targets & Trends
Indicator: Ha accessible green space per 1,000 people. Target: For 1ha accessible natural green space per 1,000 people.
Objective To maintain & enhance the quality of countryside, green belt & open space areas. Indicators, Targets & Trends Indicator: % change of green belt & open space area.
Tandridge District Council
Objective To protect & enhance the natural, archaeological & historic environments & cultural assets. Indicator: Achievement of ‘Accessible Natural Greenspace Standards’.
Indicators, Targets & Trends
Indicator: Promotion & safeguard of open land & green corridors in urban areas. Baseline: In 2004, 1.03 ha formal parks per 1,000 people, 28.9 ha other public open space per 1,000 people, & no green corridors. Indicator: Length (no.) of Public Rights of Way improved or created using developer contributions allowing for improvement in accessibility of the countryside to the public. Baseline: Footpaths 503 & 632 (Dormansland walking routes to Dormans Station) provided.
Waverley Borough Council
Objective To improve the health of the population. Indicator: % eligible open spaces managed to Green Flag Award standard. Indicator: Amount of green space lost or gained within settlements.
Indicators, Targets & Trends
Objective To maintain & enhance the quality of landscapes & townscapes.
Indicators, Targets & Trends
Indicator: Area of landscape designations. Indicator: Loss or damage through development to designated sites & buildings of international, national & county heritage importance.
Woking Borough Council
Protect, enhance & where appropriate make accessible for the enjoyment the natural, archaeological & historic environments & cultural assets & landscapes of Woking. Objective
Indicators, Targets & Trends Indicator: Historic landscapes. Baseline: No historic landscapes designated in the borough.
Appendix 2 to the Surrey Transport Plan Environmental Report – January 2011
34

Appendix 2-J: Review of District & Borough LDF Baseline for Welfare, Health & Well-being
Elmbridge Borough Council
Objective To facilitate the improved health & wellbeing of the whole population.
Indicator: Population & age structure. Baseline: Total population, 121,936. Problems & Constraints: Aging population.
Indicators, Targets & Trends
Indicator: Life expectancy (years). Baseline: In 2004-06, for males 80.4 years & for females 83.6 years. Trends: 0.6 increase for males, no change for females from 2001-2004 to 2003-2005. Indicator: % people whose health is classed as good. Baseline: In April 2001, 76.2%. Indicator: Health ranking for Indices of Multiple Deprivation.
Objective To create & maintain safer & more secure communities. Indicator: No. recorded offences (per 1,000 people): domestic violence; violence against the person; sexual offences; robbery; burglary; theft of motor vehicle; theft from motor vehicle; drug offences. Baseline: In 2004, estimated as 350+ cases. Target: To reduce crime. Trends: UK crime rate dropped in 2009. Indicators,
Targets & Trends Indicator: Proportion of people living in fear of crime: % very worried about burglary; % high level of worry about car crime; % high level of worry about violent crime. Trends: Fear of crime is high. Indicator: Deaths & casualties arising from fires per 100,000 population. Baseline: For 2006, 12. Indicator: Crime ranking from the Indices of Multiple Deprivation.
Objective To reduce noise pollution. Indicators, Targets & Trends
Indicator: % people who would benefit from new quiet road surfacing. Trends: Surrey County Council predict the use of low noise surfacing will benefit 16% of the population by 2010/11.
Objective To reduce light pollution. Indicators, Targets & Trends
Indicator: No. new floodlighting installations including the number of fittings installed which minimise light pollution.
Epsom & Ewell Borough Council
Objective To reduce noise pollution.
Indicators, Targets & Trends Indicator: % people who would benefit from quiet road surfacing.
Objective To reduce light pollution.
Indicators, Targets & Trends
Indicator: No. new floodlighting installations including the number of fittings installed which minimise light pollution.
Objective To facilitate the improved health & wellbeing of the whole population.
Indicator: Life expectancy.
Indicators, Targets & Trends
Indicator: % people whose health is classed as good. Indicator: No. new healthcare facilities provided & no. lost to alternative uses. Indicator: Performance of Acute NHS Trust & completion of Extra Care Housing.
Objective To reduce poverty & social exclusion.
Indicators, Targets & Trends
Indicator: % all respondents satisfied with the local bus service. Indicator: Access to services.
Objective To create & maintain safer & more secure communities.
Indicators, Targets & Trends
Indicator: No. recorded offences per 1,000 people. Indicator: Proportion of people that live in fear of crime. Indicator: Pedestrians/cyclists – no. killed & seriously injured. Indicator: No. people killed or seriously injured in road accidents. Indicator: Deaths & casualties arising from fires.
Objective To protect & enhance the natural, archaeological & historic environments & cultural assets.
Indicators, Targets & Trends Indicator: Improvement in accessibility of the countryside to the public via the Rights of Way network.
Appendix 2 to the Surrey Transport Plan Environmental Report – January 2011
35

Appendix 2-J: Review of District & Borough LDF Baseline for Welfare, Health & Well-being
Guildford Borough Council
Objective To facilitate the improved health & wellbeing of the whole population.
Indicators, Targets & Trends
Indicator: Death rates from circulatory disease, cancer, accidents & suicide. Target: To reduce death rates from preventable causes & improve other indicators of health & well being over the long-term. Trends: Between 1950 & 1999 cancer deaths rose from 15% to 27% in men & from 16% to 23% in women – overtaking heart disease, stroke & infectious diseases as the other major killers in England & Wales. Problems & Constraints: The planning system can have limited influence. Indicator: Average life expectancy. Baseline: 77.8 years for males & 83.2 years for females. Trends: Guildford is 29th best life expectancy in England for males, & 5th best for females. Problems & Constraints: The planning system can have limited influence. Indicator: % people who describe their health good/very good. Baseline: 94.3%. Trends: Slight improvement on Surrey average of 94%. Problems & Constraints: The planning system can have limited influence. The indicator relies on subjective opinion.
Objective To create & maintain safer & more secure communities.
Indicators, Targets & Trends
Indicator: No. recorded offences per 1,000 people. Baseline: Total notifiable crime between Aug & Oct 2006 was 1,854 incidents. Trends: Guildford ranked 95th out of 376 LAs. Total notifiable crime between Aug & Oct 2005 was 1,900 incidents. In 2006 this was 2.5% less than the previous year. Indicator: Level of domestic burglaries, violent offences against the person & vehicle crimes. Baseline: 3.26 burglaries per 1,000 population, 9.22 vehicle crimes per 1,000 population, & 7.45 violent crimes per 1,000 population. Trends: Burglaries are below Surrey average of 3.38. For vehicle crime & violent crime Guildford is above Surrey averages of 8.73 & 6.34. Problems & Constraints: Perception / fear of crime must also be considered. Indicator: % residents expressing fear of crime concerns within the borough. Target: Home Office delivery target is to reduce levels of fear of violent crime, burglary & car crime to below levels reported in the 2001 British Crime Survey by 2006. Indicator: Pedestrians/cyclists – no. killed & seriously injured. Baseline: Between 1994 & 2004, 177 pedestrians & 78 cyclists killed or seriously injured. Target: 40% reduction by 2010. Trends: Decrease. Indicator: Road safety – no. children killed & seriously injured. Baseline: Between 1994 & 2004, 73 children killed or seriously injured. Target: 50% reduction by 2010. Trends: Annual decrease.
Objective To reduce poverty & social exclusion.
Indicators, Targets & Trends
Indicator: % all respondents satisfied with the local bus service. Baseline: Between 2003 & 2004 satisfaction rose from 29% to 34% countywide. Target: Original target of 54% for 2003/04 revised to 39%. Trends: Small rise in satisfaction. Indicator: Access to services. Target: To improve access to key facilities for all. Trends: Above average performance in terms of local services & below average performance in terms of local amenities. Indicator: % rural respondents satisfied with transport in the borough, including access to town centre.
Objective To create & sustain vibrant communities
Indicators, Targets & Trends
Indicator: % people who say they are satisfied with their local area. Baseline: BVPI survey found that residents felt that access to nature, parks & open spaces, shopping facilities, sports & leisure facilities were improving, whereas traffic congestion, wage levels & cost of living, affordable decent housing, levels of crime & pollution levels were deteriorating. Trends: On some indicators levels of satisfaction are below the national averages for 2001. When asked what needed most improving 59% of residents were not satisfied with traffic congestion, where as the national average is 22%, affordable housing had 42% not satisfied cf. 16% nationally. Levels of pollution & health provision needed least improvement. Indicator: Provision of key services in the most accessible locations.
Objective To ensure air quality continues to improve & noise/light pollution is reduced. Indicator: Road traffic noise reduction rate for each Transport Planning Area. Baseline: Road traffic is the greatest source of ambient noise residents are exposed to. A3 trunk road runs through borough & M25 passes through north east of the area. A3 is a particular source of noise nuisance to residents between Stag Hill & Westborough where noise can reach levels equivalent to Category D of PPG24. Indicators,
Targets & Trends Indicator: No. complaints relating to light pollution. Indicator: No. noise pollution incidents recorded. Indicator: No. areas of tranquillity within the borough. Baseline: Surrey is the least tranquil county in England. Trends: Tranquillity has declined since the 1960’s.
To protect & enhance, & where appropriate make accessible for enjoyment the natural, archaeological & historic environments & cultural assets of Guildford, for the benefit of both residents & visitors. Objective
Indicators, Targets & Trends
Indicator: Achievement of ‘Accessible Natural Greenspace Standards’. Target: People living in towns & cities should have greenspace <300 m from home, 1 ha of LNR per 1,000 people, & at least 1 accessible 20 ha site within 2 km of home, 1x 100 ha site within 5 km & 1x 500 ha within 10 km. Problems & Constraints: Consider applying standards at a ward or parish level. Indicator: Open space & formal recreational facility assessment – total quantity & qualitative assessment scores, e.g. square metres of parks & open space per 1,000 population.
Appendix 2 to the Surrey Transport Plan Environmental Report – January 2011
36

Appendix 2-J: Review of District & Borough LDF Baseline for Welfare, Health & Well-being
Mole Valley District Council
Objective To facilitate the improved health & wellbeing of the whole population.
Indicators, Targets & Trends
Indicator: Life expectancy. Baseline: For MVDC in 2001, for males 77.7 years & females 82.6 years & in 2004-06 for males 79.9 years & females 83.4 years. Trends: Life expectancy is above the England average & is increasing for both males & females. Indicator: % people whose health is classed as good. Indicator: Rate of physical activity. Baseline: For MVDC in April 2007, 24.33% of the population participated in sport. Problems & Constraints: Definition of sport participation used is % adult (16+) population taking part in at least moderate intensity sport & active recreation of at least 30 minutes duration on at least 3 days a week.
Objective To reduce poverty & social exclusion. Indicator: % all respondents satisfied with the local bus service. Target: 46% satisfaction by 2010. Trends: Satisfaction is increasing.
Indicators, Targets & Trends
Indicator: Local bus services (passenger journeys per year). Target: 25.8 million by 2010/11. Trends: Amount of journeys per year is increasing. Indicator: Access to services. Indicator: % rural households at set distances from key services.
Objective To create & maintain safer & more secure communities.
Indicators, Targets & Trends
Indicator: No. recorded offences per 1,000 people. Baseline: In 2006/07, 10 violent offences, 2 burglaries, 1 motor vehicle theft & 6 thefts from motor vehicles. Trends: No. recorded offences decreasing for majority of crimes. Problems & Constraints: Different statistics may not be comparable. Indicator: The proportion of people that live in fear of crime. Indicator: Pedestrians/cyclists – no. killed or seriously injured. Baseline: In 2006, 36.1 pedestrians & 33.6 cyclists. Indicator: No. people killed or seriously injured in road accidents. Baseline: In 2006, 424 persons. Trends: Slight increase in casualties. Indicator: Deaths & casualties arising from fires. Baseline: In 2005, 17 in total.
Objective To reduce noise pollution.
Indicators, Targets & Trends
Indicator: The monitoring of LEQ noise levels around airports. Baseline: In May 2005, total area covered by 66+ LEQ was 260.1 ha & 83 address points/properties. Target: No increase in no. properties affected. Problems & Constraints: The noise contours may be revised over time & current (1996) forecasts are based on daytime data only. Indicator: % population who would benefit from new quiet road surfacing.
Objective To reduce light pollution. Indicators, Targets & Trends Indicator: No. new floodlighting installations including no. fittings installed which minimise light pollution.
Objective To protect & enhance the natural, archaeological & historic environments & cultural assets. Indicators, Targets & Trends Indicator: Improvement in accessibility of the countryside to the public via the Rights of Way network.
Reigate & Banstead Borough Council
Objective To facilitate the improved health & wellbeing of the whole population.
Indicators, Targets & Trends
Indicator: Life expectancy. Baseline: In 2004-06, for males 78.7 years & females 81.7 years. Trends: There has been an increase. Indicator: % people who said their health was poor. Baseline: In April 2001, 6.0%. Indicator: A&E emergency admission waits (% patients admitted to hospital via A&E within 4 & 12 hours of decision to admit). Baseline: For Surrey & Sussex Healthcare NHS Trust in 2008/09, 100% admitted within 2 hours. Target: No-one (98%) to be waiting in A&E for over 4 hours. Indicator: Physically active children. Baseline: In 2006/07, 74.1% of children. Indicator: Proportion of children who walk/cycle to school. Baseline: In 2007, 39% walk & 1% cycle at primary & 40% walk & 2% cycle at secondary. Target: For Surrey for 2008/09, for 300 schools to actively participate in sustainable travel initiatives.
Objective To create & maintain safer & more secure communities. Indicator: No. recorded offences in 2007/08 per 1,000 people. Baseline: In 2007/08, 16 violent offences, 1 robbery, 3 burglaries, 2 thefts of motor vehicles, & 5 thefts from vehicles. Trends: Increase in violent offences, burglaries & thefts from vehicles & decrease in other offences. Indicator: Proportion of people that live in fear of crime. Problems & Constraints: The fear of crime tends to still be rising although total crime is still decreasing.
Indicators, Targets & Trends Indicator: Pedestrians/cyclists – no. killed or seriously injured. Trends: Decreasing. Problems &
Constraints: Generally higher levels of pedestrians affected, may be due to more urban environment. Indicator: Road safety – all ages killed or seriously injured. Target: 40% reduction in people killed or seriously injured on a 1994-98 baseline by 2010, & 50% reduction in no.s for children. Trends: Decreasing. Problems & Constraints: Motorcycle figures showing a significant increase. Indicator: Deaths & casualties arising from fires per 100,000 population.
Appendix 2 to the Surrey Transport Plan Environmental Report – January 2011
37

Appendix 2-J: Review of District & Borough LDF Baseline for Welfare, Health & Well-being
Reigate & Banstead Borough Council (continued)
Objective To improve accessibility to all services & facilities. Indicators, Targets & Trends Indicator: Surrey County Council accessibility mapping.
Objective To ensure environmental noise exposure is minimised. Indicator: LAEQ levels around airports. Baseline: In 2007, 4,800 people & 48.89 km2 affected by LAeq of >57 dB (4.7% increase on 2006). Target: To decrease extent of LAeq contours & no. properties affected. Indicator: Levels of noise around major roads. Target: Decrease extent of LAeq contours & no. properties affected. Indicator: No. complaints relating to sources of noise of an industrial or commercial nature.
Indicators, Targets & Trends
Objective To reduce light pollution. Indicators, Targets & Trends
Indicator: No. new floodlighting installations including no. fittings installed which minimise light pollution. Indicator: No. light pollution complaints made to LA.
Runnymede Borough Council
Objective To facilitate the improved health & wellbeing of the population & reduce inequalities in health.
Indicators, Targets & Trends
Indicator: Death rates from circulatory disease, cancer, accidents & suicide. Baseline: In 2006, 250 deaths from CHD, 281 cancer deaths, 26 deaths from accidents & 7 suicides. Indicator: Life expectancy. Baseline: In 2005, 78.7 years for males & 82.3 years for females.
Objective To reduce crime & the fear of crime.
Indicators, Targets & Trends
Indicator: Level of domestic burglaries, violent offences & vehicle crimes. Baseline: Per 1,000 population, 12.24 burglaries, 9.27 violent offences & 2.79 vehicle thefts. Indicator: Fear of crime.
Objective To create & sustain vibrant communities. Indicator: % people satisfied with their local area as a place to live. Indicator: % people who feel that their local area is a place where people from different backgrounds & communities can live together harmoniously. Indicators,
Targets & Trends Indicator: % people who have carried out any of a specific list of actions, unpaid, for someone who is not a relative. Baseline: In 2001, 9%.
Objective To improve accessibility to all services & facilities. Indicators, Targets & Trends Indicator: % rural households at set distances from key services.
Objective To protect, enhance & make accessible for enjoyment, the region’s countryside & historic environment. Indicators, Targets & Trends Indicator: Access to & use of the countryside.
Spelthorne Borough Council
Objective To facilitate the improved health & wellbeing of the whole population. Indicators, Targets & Trends Indicator: % people whose health is classed as not good. Baseline: In April 2001, 6.6%.
Objective To create & maintain safer & more secure communities.
Indicators, Targets & Trends
Indicator: No. recorded offences per 1,000 people. Indicator: The proportion of people that live in fear of crime. Indicator: Pedestrians/cyclists – no. killed & seriously injured per 100,000 population.
Objective To minimise noise pollution. Indicators, Targets & Trends
Indicator: The monitoring of LEQ levels around airports. Indicator: Total length of quiet road surfacing.
Objective To protect & enhance the natural, archaeological & historic environments. Indicator: Achievement of ‘Accessible Natural Greenspace Standards’ (Natural England). Target: For a natural area to be within 300 m of every home or workplace. Problems & Constraints: Natural area & standards need to be defined. This may duplicate open space standard.
Indicators, Targets & Trends
Objective To improve accessibility & reduce road congestion & the need to travel. Indicators, Targets & Trends Indicator: Bus routes with disabled access.
Objective To achieve sustainable production & use of resources. Indicator: No. new floodlighting installations including no. fittings installed which minimise light pollution. Indicators,
Targets & Trends Indicator: % new development adhering to Institute of Light Engineers guidance.
Appendix 2 to the Surrey Transport Plan Environmental Report – January 2011
38

Appendix 2-J: Review of District & Borough LDF Baseline for Welfare, Health & Well-being
Surrey Heath Borough Council
Objective To improve the populations health.
Indicators, Targets & Trends
Indicator: Life expectancy. Baseline: In 2000-2002, 81.5 years for females & 77.6 years for males. Indicator: Death rate per 100,000 by accidents Target: To reduce accidents by at least 20% by 2010. Indicator: % people who describe their health as good. Baseline: For SHBC in 2001, 76.7%. Indicator: % people who describe their health as poor. Baseline: For SHBC in 2001, 5.3%. Indicator: % increase in the participation rate in sport. Target: To increase participation by 1% per year until 2020, & for 50% of population participant in 30 minutes activity 5 times a week by 2020.
Objective To reduce crime & fear of crime.
Indicators, Targets & Trends
Indicator: Vehicle crime per 1,000 population. Baseline: In 2002/03, 5.25. Target: To reduce vehicle crime by 30% from 1998/99 to 2004. Indicator: % respondents (Fear of Crime Surveys) feeling unsafe or worried about crime per gender. Baseline: In 2002/03, 9% worried about burglary, 11% car crime & 16% violent crime. Target: An improvement on baseline year.
Objective To improve opportunities for access to education, employment, recreation, health, community services & cultural opportunities for all sectors of the community.
Indicators, Targets & Trends
Indicator: % urban & rural residential population within walking distance of key services. Target: For all services to be within 10km for 90% rural households. Indicator: % new development within 1km of main employment areas. Indicator: % new residential development within 1km of good public transport links. Indicator: % new commercial development within 1km of good public transport links. Target: For 80% of additional commercial development to be located in town centres or sites in urban areas accessible by public transport, cycling & walking. Indicator: Access to services for disabled people. Indicator: Ha accessible green space per 1,000 people. Target: 1 ha accessible natural green space per 1,000 people. Indicator: Public transport accessibility score (PTAL).
Objective To reduce noise pollution. Indicators, Targets & Trends
Indicator: % respondents concerned with different categories of noise. Indicator: Proportion of tranquil areas/loss of tranquillity.
Objective To encourage the use of more sustainable modes of transport (public transport/walking/cycling) & reduce traffic congestion.
Indicators, Targets & Trends
Indicator: Frequency/reliability of public transport. Indicator: Access to public transport
Tandridge District Council
Objective To facilitate the improved health & wellbeing of the whole population.
Indicators, Targets & Trends
Indicator: Life expectancy. Baseline: In 2005-07, for males 79.9 years cf. 78.8 years in 2001-03, & for females 83.4 years cf. 81.7 years in 2001-03. Trends: Increase in 1.1 years for males & 1.7 years for females Indicator: % people whose health is classed as good. Baseline: In April 2001, 73.63%.
Objective To reduce poverty & social exclusion.
Indicators, Targets & Trends
Indicator: Access to services. Baseline: In 2003/04, 91% of respondents could access local shops very or fairly easily, 86% could access a post office, 89% could access a chemist or pharmacy, 86% could access a shopping centre or supermarket, 90% could access publicly accessible green space, 84% could access a shop selling fresh fruit and vegetables, 82% could access a bank or cashpoint, 87% could access a public transport facility, 81% could access a library, 55% could access a cultural or recreational facility, 74% could access a sport or leisure centre, 45% could access a local hospital, & 53% could access a council or neighbourhood office. Indicator: % rural households at set distances from key services. Baseline: Between 2000 & 2007 access to cashpoints improved slightly, however banks & building societies & post offices are less accessible. Within the same time period % of residents within 4 km of doctors’ surgeries increased from 82% to 87%. Access to both primary & secondary schools remained virtually unchanged since 2000.
Objective To create & maintain safer & more secure communities. Indicator: No. recorded offences per 1,000 people. Baseline: In 2008/09, 8.8 offences of violence against the person per 1,000 people, 0.67 sexual offences per 1,000 people, 0.34 robberies per 1,000 people, 8.19 burglaries per 1,000 people, 9.47 offences against vehicles per 1,000 people, & 1.9 drugs offences were 1,000 people. Trends: Violence against the person, sexual offences & drug offences have risen. Robbery, burglary & offences against vehicles have decreased. Indicators,
Targets & Trends Indicator: Proportion of people that live in fear of crime. Indicator: Pedestrians/cyclists – no. killed or seriously injured. Baseline: In 2003, no cyclists & 7 pedestrians killed or seriously injured. Indicator: No. people killed or seriously injured in road accidents. Baseline: In 2006 (excluding motorways & trunk roads), 483 people killed or seriously injured.
Appendix 2 to the Surrey Transport Plan Environmental Report – January 2011
39

Appendix 2-J: Review of District & Borough LDF Baseline for Welfare, Health & Well-being
Tandridge District Council (continued)
Objective To reduce noise pollution.
Indicators, Targets & Trends
Indicator: Monitoring of LEQ noise levels around airports. Baseline: In 2004, area covered was 1,283.34 ha & 1,262 address points. Target: No increase in extent of LEQ contours & no. properties affected. Indicator: % population which would benefit from quiet road surfacing. Target: Surrey target is 16% in 2010. Trends: Already exceeded the target for 2010.
Waverley Borough Council
Objective To reduce poverty & social exclusion. Indicators, Targets & Trends
Indicator: % new residential development within 30 minutes public transport time of GP, hospital, secondary school, employment & a major health centre.
Objective To improve the health of the population. Indicators, Targets & Trends
Indicator: % new residential development within 30 minutes public transport time of GP, hospital & a major health centre.
Objective To improve the education & skills of the population. Indicators, Targets & Trends Indicator: % new residential development within 30 minutes public transport time of a secondary school.
Objective To reduce crime, the fear of crime & antisocial activity. Indicators, Targets & Trends Indicator: Level of vehicle theft.
Objective To improve accessibility to services, facilities & amenities
Indicators, Targets & Trends
Indicator: % new residential development within 30 minutes public transport time of GP, hospital, secondary school, employment & a major health centre. Indicator: Additional retail development in & around town centres (target 90%).
Objective To improve the satisfaction of people with their neighbourhood as a place to live. Indicators, Targets & Trends
Indicator: % new residential development within 30 minutes public transport time of GP, hospital, secondary school, employment & a major health centre.
Objective To encourage efficient patterns of movement. Indicators, Targets & Trends
Indicator: % new residential development within 30 minutes public transport time of GP, hospital, secondary school, employment & a major health centre.
Woking Borough Council
Objective Improve the health & wellbeing of the population & reduce inequalities in health. Indicator: Proportion of people who describe their health as good. Baseline: 74.4% describe their health as good. Trends: Census data indicates the borough is a relatively healthy place to live. Census data is, however, 7 years old. Indicator: Proportion of people who describe their health as not good. Baseline: 5.9% describe their health as not good. Indicator: Proportion of people with a limiting long-term illness. Baseline: 13% describe themselves as having a limiting long-term illness. Indicator: Life expectancy. Baseline: In 2004-06, for males 79.3 years & for females 82.9 years. Indicator: Death rates from circulatory disease, cancer, accidents & suicide. Baseline: In 2004-06, standardised mortality ratio for deaths from circulatory disease was 81.3%, for cancer was 95.1% & for accidents was 94.4%. Indicator: No. people using sports/leisure facilities, local parks & open spaces. Baseline: In 2006, 13%, used facilities daily, 29% weekly, 22% monthly, 15% in last 6 months, & 7% in last year. Trends: Use rates have increased with those never using facilities falling by nearly 50% between 2003 & 2006. In addition the General Survey 2006 showed that 76% of residents were very satisfied or fairly satisfied with parks & open spaces in the borough. However no. fairly dissatisfied residents had risen from 4% to 6% in 2006. Problems & Constraints: SANGS may be a better indicator.
Indicators, Targets & Trends
Objective Create & maintain safer & more secure communities. Indicator: No. vehicle crimes per 1,000 population. Baseline: In 2007-08, 6.8. Trends: Total no. crimes committed in 2006/07 was 74.63 per 1,000 people compared to 77.85 in 2005/06, a drop of 4.1%.
Indicators, Targets & Trends
Indicator: Proportion of local people who feel safe in their local environment. Baseline: In 2006, 93% felt very or fairly safe in daytime, & 7% felt very unsafe at night. Trends: Night time safety is an issue for a proportion of the population. Indicator: No. road users killed or seriously injured. Baseline: In 2003, 36. Target: For Surrey, to reduce no.s to 386 for the county by 2010. Trends: No strong trend can be identified.
Appendix 2 to the Surrey Transport Plan Environmental Report – January 2011
40

Appendix 2-J: Review of District & Borough LDF Baseline for Welfare, Health & Well-being
Woking Borough Council (continued)
Objective Create & sustain vibrant communities. Indicator: Proportion of people who say that they are satisfied with their local area as a place to live. Baseline: In 2006, 74%. Trends: Whilst majority of people are satisfied, improvement is possible. The LDF can draw on IMD to identify a focus. Indicator: Proportion of people who say they are satisfied with the provision of community & leisure facilities. Baseline: In 2006, 65%. Trends: Whilst majority of people are satisfied, improvement is possible. Indicator: Provision of key services in the town & village centres. Baseline: 76% stated that provision of doctors surgeries was adequate, & 76% stated that provision of convenience shops was adequate.
Indicators, Targets & Trends
Indicator: Proportion of convenience stores in local centres. Trends: Suggested substitute data, proportion of market share for convenience goods in local centres.
Objective Ensure that air quality continues to improve. Indicators, Targets & Trends Indicator: Light pollution.
Protect, enhance & where appropriate make accessible for the enjoyment the natural, archaeological & historic environments & cultural assets & landscapes of Woking. Objective
Indicators, Targets & Trends
Indicator: Access to & use of the natural environment. Baseline: 42% of residents used parks & open spaces at least once a week & a further 22% about once a month. Target: For each household to be within 300 m of 1 natural greenspace, within 2km of a 20 ha site, within 5km of a 100 ha site & within 10km of a 500 ha site, & for there to be 1 ha of LNR per 1,000 people. Trends: The 2007 PPG17 Audit reported that 90% of households use natural & semi-natural open space.
Improve public transport & reduce congestion by providing jobs & services close to where people live or where they can access them by public transport. Objective
Indicator: Access to, frequency & reliability of public transport. Trends: Urban areas have good accessibility to services & areas to the south west, south east & north have poor access. Indicator
Indicators, Targets & Trends
: Proportion of new residential development within 30 minutes public transport time of key services. Baseline: In 2007-08, 96.4% for GP surgeries, 80.85% for hospitals, 100% for primary schools, 72.6% for secondary schools, 92.2% for employment areas, & 98% for the town centre. Problems & Constraints: Whilst performance has been reasonable in general, there is scope for improvement. In particular, access to secondary school & hospital has not been satisfactory in the majority of new development.
Appendix 2 to the Surrey Transport Plan Environmental Report – January 2011
41