appendix 3 summary report - huduser.gov · appendix 3 . summary report: energy star adjustment for...
TRANSCRIPT
APPENDIX 3
Summary Report:
ENERGY STAR Adjustment for
HUD-52667 Spreadsheet Model
Jason Glazer
GARD Analytics, Inc.
Prepared for the U.S. Department of Housing & Urban Development, Office of Policy Development and Research October 15, 2012

1
GARD Analytics, Inc. ENERGY STAR Adjustment 2012
1. Introduction
In recent years, the Department of Housing and Urban Development (HUD) has made available a Microsoft Excel spreadsheet model to assist Public Housing Authorities (PHAs) in developing utility allowances for the Section 8 Existing Housing Choice Voucher program. The spreadsheet model computes the utility allowances in a format consistent with the HUD Form HUD-52667, the form which is often used by PHAs to document the utility allowances provided.
2. Background
The U.S. Department of Housing and Urban Development (HUD) operates the Housing Choice Voucher program, also referred to as the Section 8 Existing program. The Housing and Community Development Act of 1974 authorized the Section 8 program which has been modified several times, including by the Quality Housing and Work Responsibility Act of 1998 which resulted in the current Housing Choice Voucher program. Program participants receive assistance that pays for part of the cost of an eligible rental housing unit. The program-allowed total housing cost includes not only the contract rent charged, but also an allowance for any tenant-paid utilities such as electricity, natural gas and other fuels. This program-allowed housing cost is subject to constraints on the total rent allowed for a unit with a given number of bedrooms. This means that the higher the estimated tenant-paid utility cost, the less the allowed contract rent.
Local Public Housing Authorities are required to routinely update the allowances for utility costs. To assist in this process, HUD developed a standard form called HUD-52667 to show what type of utility cost information should be provided, plus guidance on how to estimate utility allowances. The guidance included an estimate of the amount of energy consumed for each end-use (e.g. heating, water heating, lighting and refrigeration, cooking, etc.). These utility allowances are usually printed in a tabular format with values in dollars per month for each major energy use, and further subcategorized by housing structure type and number of bedrooms. For instance, there are normally different tables for single family detached, row houses, low-rise multi-family, and high-rise multi-family structure types. The recommended format with this level of detail is provided by the HUD- 52667 form.
The instructions for the HUD-52667 form were developed shortly after passage of the Housing and Community Development Act of 1974. This was at the beginning of an energy crisis that had yet to affect housing construction practices. Housing from this era had few of the conservation features that people now take for granted, such as sufficient wall and roof insulation, double-paned “thermal” windows, and efficient furnaces, heat pumps, air conditioners, and water heaters. The guidance provided for determining the utility allowances had not been significantly updated as of 2002, yet the common use of more energy conserving building practices had typically reduced the amount of energy used for heating, cooking and water heating in a typical residence. This resulted in the utility allowances, if developed according to HUD guidance, being larger than necessary to cover the energy costs for the residents. Indirectly, these larger than necessary utility allowances had the effect of lowering the allowed contract rents for some structure types. In addition, and somewhat offsetting, the housing stock has also changed since the 1970’s, especially due to larger average new home sizes.
2
GARD Analytics, Inc. ENERGY STAR Adjustment 2012
In 2002 and 2003, GARD Analytics worked with HUD to create a spreadsheet version of HUD Form 52667. It was primarily based on data from the U.S. Department of Energy’s 1997 Residential Energy Consumption Survey (RECS). The report documenting this effort was titled “Utility Allowance Model Final Report” and dated June 5, 2003. The data and assumptions used were largely derived from “A Look at Residential Energy Consumption in 1997” published by the U.S. Department of Energy - Energy Information Administration. A multiple linear regression approach was applied with the RECS data to derive correlations for most of the end-uses shown on the HUD-52667 form. For heating energy consumption, for example, the relationship developed was based on heating degree-days and number of bedrooms. Separate correlations were developed for each residential structure type.
In September 2005, the engineering firm of 2rw+di updated the energy model using data from the U.S. Department of Energy’s Residential Energy Consumption Survey (RECS) from 2001 in a report titled “Utility Model Evaluation.” The update also modified the spreadsheet model to adjust for building age and the use of heat pumps. The report included a review of the analytical soundness of the model and an assessment of the model’s accuracy.
In February 2007, GARD Analytics updated the model as described in the report “Final Report on HUD-52667 Spreadsheet Update.” This update included revising the method by which heat pump efficiencies are adjusted for climatic conditions, updating the heating energy use calculation to adjust for climatic conditions, and comparing the results of the spreadsheet with actual data. This update continued to use the data from the 2001 U.S. Department of Energy’s Residential Energy Consumption Survey, since more current RECS data had not been released.
In January 2011, GARD Analytics updated the model as described in “Update of the HUD-52667 Spreadsheet Model with Department of Energy Residential Energy Consumption Survey Data from 2005.” In this update, the equations in the spreadsheet related to the energy consumption estimates for heating, cooking, air conditioning, water heating and other end uses were updated using data from the U.S. Department of Energy’s 2005 Residential Energy Consumption Survey (RECS). Overall thirty equations were updated.
3. Scope
The scope of this report is limited to recommending adjustments for ENERGY STAR rated homes and was described as:
“… developing an estimate of the percentage by which new ENERGY STAR rated residential construction reduces energy consumption. The factor(s) developed may be either in the form an adjustment to average energy consumption or average energy consumption for recently built (e.g. since 2000) structures. If feasible, provide separate estimates to the extent possible for mobile homes, single family detached, 2-4 unit structures and 5+ unit structures.”
While it might be possible to derive adjustment factors based on a good national sample of metered data from actual buildings that were built using the various ENERGY STAR rated home programs, no such database was found. The U.S. Department of Energy’s Residential Energy Consumption Survey (RECS) is the source of data used for deriving most of the energy equations used in the HUD-52267 Spreadsheet Model but it does not provide any questions related to the ENERGY STAR home programs so it cannot be used. The RECS data does include some questions on

3
GARD Analytics, Inc. ENERGY STAR Adjustment 2012
appliances that are part of the ENERGY STAR program but that is different from ENERGY STAR rated homes.
Another approach that could be used is to create adjustment factors would be to use building energy modeling programs such as REM/Rate, EnergyGauge, EnergyPlus, or eQUEST. This would be more time consuming and would depend a great deal on the type of assumptions made. Modeling was not performed as part of this project.
Instead, the approach taken was to search the existing literature. This included literature provided by the ENERGY STAR program as well as literature from other parties related to ENERGY STAR rated homes.
4. On Line Literature Search
The primary source of information was literature found online. Fortunately, the ENERGY STAR web site includes many useful documents aimed not just at consumers but also at home industry professionals.
https://www.energystar.gov/ In addition, a search using Google Scholar was made that is focused on literature published on the internet.
http://scholar.google.com/
The following table summarizes the searches performed and the number of items found that were reviewed. No additional pages of results were sought after a page was found with no valuable links.
Term Items Reviewed
“HERS Validation” 100
“Home Energy Rating” 100
“ENERGY STAR Homes” 250
“ENERGY STAR Multifamily High Rise” 100
“ENERGY STAR Manufactured Home” 100
This search resulted in identifying over 180 documents. These were subsequently reviewed and most were determined not to be directly beneficial to the goals of finding adjustment factors for ENERGY STAR rated homes. Approximately 50 files were found that appeared to be more promising and were reviewed in more detail. These were further reviewed for specific results that were pertinent for the subject and, if such results were found, these are discussed below in this document. The literature selected appears in the bibliography.

4
GARD Analytics, Inc. ENERGY STAR Adjustment 2012
5. ENERGY STAR Programs
The overall ENERGY STAR program has many parts including those that apply to residences, commercial buildings, as well as building components such as furnaces, windows, and lighting. The focus of this effort is the impact on an entire residence if it is ENERGY STAR rated. Although individual ENERGY STAR rated appliances, lighting, and heating and cooling equipment are not being separately analyzed as part of this study, entire residences that are ENERGY STAR rated are very likely to include ENERGY STAR rated appliances.
The overall ENERGY STAR program that is related to residences is made up of separate programs, as described in following sections.
5.1 Certified New Homes
The Certified New Homes program applies directly to single family detached residences.
https://www.energystar.gov/index.cfm?c=new_homes.hm_index
For low-rise multifamily buildings, this same Certified New Homes program can still apply, as described on the following web page:
https://www.energystar.gov/index.cfm?c=bldrs_lenders_raters.nh_multifamily_units
Some additional requirements described in the Attached Housing Policy are shown on the following web page:
https://www.energystar.gov/index.cfm?c=bldrs_lenders_raters.nh_attached_housing
These requirements must be followed for low-rise multifamily buildings such as: each dwelling unit in the building must receive a separate ENERGY STAR label and the dwelling units with the most exposed wall area and highest window-to-wall ratio on the floor must meet the ENERGY STAR requirements.
The Certified New Homes program is currently based on the criteria of being 15% more energy efficient that homes built to the 2004 International Residential Code which, according to the ENERGY STAR web site, “typically makes them 20-30% more efficient than standard homes.”
The Certified New Homes program is on its third version. The first version applied from 1995 to 2005. Version 2 applied from 2006-2011. Version 3 applies from January 1, 2012 and later. For New Homes with a permit date and final inspection dates that occur during the transition to Version 3, a special Version 2.5 is available to make the transition easier. More details on the history of the program can be found at:
https://www.energystar.gov/index.cfm?c=new_homes.nh_history
5.2 Manufactured Home
The Certified New Homes requirements are also applied to dwelling units under the Qualified Manufactured Homes program for homes built in a factory meeting the Manufactured Home Construction and Safety Standards, commonly called the HUD Code. The energy efficiency of the homes is the same as the Certified New Homes program but the inspection and approval process is different since some is performed in the plant where the dwelling unit is constructed.
https://www.energystar.gov/index.cfm?c=bldrs_lenders_raters.pt_builder_manufactured

5
GARD Analytics, Inc. ENERGY STAR Adjustment 2012
The Certified New Homes program also applies to homes that are constructed of multiple modules that are manufactured in a factory. A Qualified Modular Home can be rated just like a site built home or like a manufactured home and the verification process can be split between the plant and the site.
https://www.energystar.gov/index.cfm?c=bldrs_lenders_raters.homes_guidelns_modular
In summary, the Certified New Homes program applies to the single family detached option on the HUD 52667 form as well as to single family attached, apartment buildings with 2-4 units when following the Attached Housing Policy, and to manufactured and modular homes that may include part of the verification process at the factory.
5.3 Qualified Multifamily High Rise Buildings
Separate from the Certified New Homes program is the ENERGY STAR Qualified Multifamily High Rise Buildings program. For this program, the building needs to have at least five dwelling units and be at least four stories tall. Some four or five story buildings may continue to fall under the Certified New Homes program but all multifamily buildings that are six or more stories fall under the high rise requirements. Unlike the Certified New Homes program, the baseline requirement is to be 15% more energy efficiency than ASHRAE Standard 90.1-2007. More details can be found at:
https://www.energystar.gov/index.cfm?c=bldrs_lenders_raters.nh_multifamily_highrise
Clearly some buildings in the HUD 52667 spreadsheet model that use the RECS category for apartments buildings with five or more units would fall under this category although some would not. The adjustment factor based on this could be applied only to the Unit Type of Highrise similar to how other special adjustments are made to townhouses within a row or at the end of a row.
5.4 Home Performance
A related program called Home Performance with ENERGY STAR is aimed at existing dwelling units and is focused on encouraging homeowners to make homes more energy efficient. That program starts with a whole-house energy assessment and recommended improvements to the homeowner. Verification after the improvements have been implemented is also part of the process. It is not included in the current scope of this investigation since it does not result in a home that is rated as ENERGY STAR certified. The amount of energy savings varies from home to home.
https://www.energystar.gov/index.cfm?c=home_improvement.hpwes_sponsors_about
6. Weighting by Version
According to the ENERGY STAR Overview of 2011 Achievements (EPA 2012) more than 1.3 million homes have earned the ENERGY STAR Certified New Home label through 2011. The graph showing the timing of these labels reproduced from this report will be used to estimate the relative impact of various versions of ENERGY STAR Certified New Homes.

6
GARD Analytics, Inc. ENERGY STAR Adjustment 2012
Based on the graph, approximately 520,000 homes were certified prior to 2005 which presumably were using the original “version 1.0” of ENERGY STAR Certified New Homes program. Version 1 of the program started in 1995 even though the graph starts in 2000. Since Version 3 was phased in January 2012, currently we can assume that approximately 98,000 homes have been certified under that version of the program (assuming three-fourths of the 2010 130,000 homes). Presuming that in 2011 another 130,000 homes under Version 2 were built, that means that the following assumptions may be used:
Version 1 – 36% based on 520,000/(1,200,000+ 130,000 + 98,000)
Version 3 – 7% based on 98,000/(1,200,000+ 130,000 + 98,000)
Version 2 – 57% based on remainder

7
GARD Analytics, Inc. ENERGY STAR Adjustment 2012
If this approach is updated in the future, the weighting of each of the three versions should be reconsidered based on the latest data. This weighting procedure did not end up being applied as part of the analysis done for this report but may be useful in the future.
7. Anticipated Savings
For home under the ENERGY STAR Certified New Homes program, the expected savings based on EPA analysis are described in EPA 2009. This technical background paper from EPA provides estimates of energy savings for all three historical versions of the ENERGY STAR Certified New Home program. For Version 1, savings shown are:
These results are describes as from “a GIS-based analysis completed by Lawrence Berkeley National Lab and EPA estimated the national average energy savings of a Version 1 ENERGY STAR qualified home.” Since these results are not shown in comparison to a baseline, it would be difficult to determine the percent energy savings. In the same EPA document, when comparing the first and second versions of the program it states the goal is:
“An energy savings goal of at least 15% over 2004 IECC or local code, whichever was more stringent. This was a relaxation of the previous 30% savings over 1993 MEC, and was necessitated by the increased stringency of the IECC over MEC, the NAECA-induced change in minimum air conditioner efficiency, and the inclusion of additional end-uses.”
This implies that the first version of the program was intended to provide a 30% savings over the typical code at the time, the 1993 Model Energy Code (MEC) which applied primarily to single family and low-rise multifamily buildings. The MEC is the predecessor to the International Energy Conservation Code (IECC).
From this small amount of information, it is impossible to disaggregate the savings by climate or type of building since this is all that is stated. The two references in EPA 2009 that would provide additional details are from reports described as internal EPA analyses and were not available to review.
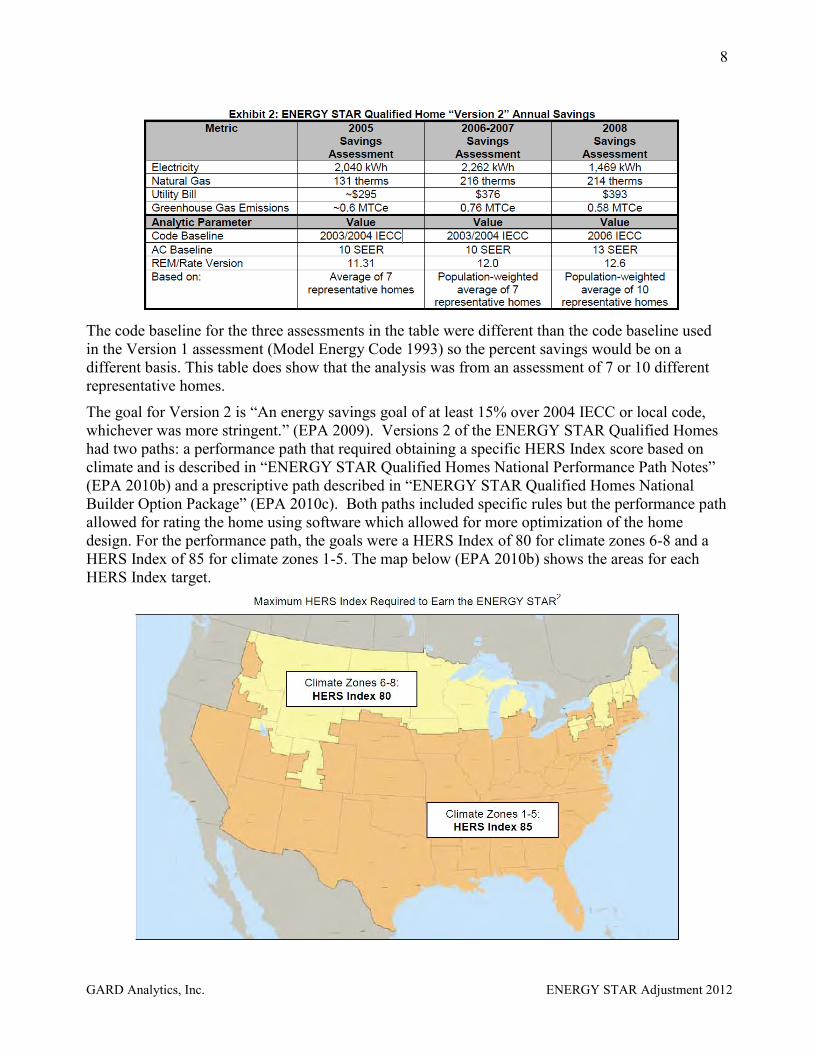
For Version 2 of the ENERGY STAR Qualified Home program the savings reported in EPA 2009 were summarized from three different assessments and are shown as:
8
GARD Analytics, Inc. ENERGY STAR Adjustment 2012
The code baseline for the three assessments in the table were different than the code baseline used in the Version 1 assessment (Model Energy Code 1993) so the percent savings would be on a different basis. This table does show that the analysis was from an assessment of 7 or 10 different representative homes.
The goal for Version 2 is “An energy savings goal of at least 15% over 2004 IECC or local code, whichever was more stringent.” (EPA 2009). Versions 2 of the ENERGY STAR Qualified Homes had two paths: a performance path that required obtaining a specific HERS Index score based on climate and is described in “ENERGY STAR Qualified Homes National Performance Path Notes” (EPA 2010b) and a prescriptive path described in “ENERGY STAR Qualified Homes National Builder Option Package” (EPA 2010c). Both paths included specific rules but the performance path allowed for rating the home using software which allowed for more optimization of the home design. For the performance path, the goals were a HERS Index of 80 for climate zones 6-8 and a HERS Index of 85 for climate zones 1-5. The map below (EPA 2010b) shows the areas for each HERS Index target.

9
GARD Analytics, Inc. ENERGY STAR Adjustment 2012
Portions are excluded from the map “due to the unique nature of some state codes and/or climates, EPA has agreed to allow regionally-developed definitions of ENERGY STAR in California, Hawaii, and the Pacific Northwest to continue to define program requirements.” (EPA 2010b)
The HERS Index is calculated using “RESNET Mortgage Industry National Home Energy Rating Standards” (RESNET 2006) which defines that the “..rating Index shall be a numerical integer value that is based on a linear scale constructed such that the HERS Reference Home has an Index value of 100 and a home that uses no net purchased energy has an Index value of 0 (zero). Each integer value on the scale shall represent a 1% change in the total energy use of the Rated home relative to the total energy use of the Reference home.” So the goal of a HERS Index of 80 in climate zones 6-8 is a 20% energy savings and the HERS Index of 85 in climate zones 1-5 corresponds to a 15% energy savings. The climate zones are shown in the following table based on their heating degree day (HDD) and cooling degree day (CDD) criteria (ICC 2009).
Table of Climate Zones
Zone Number Thermal Criteria
1 9000 < CDD50°F
2 6300 < CDD50°F < 9000
3A and 3B 4500 < CDD50°F < 6300
4A and 4B CDD50°F < 4500 and 3600 < HDD65°F < 5400
3C CDD50°F ≤ 4500 and HDD65°F ≤ 3600
4C 3600 < HDD65°F < 5400
5 5400 < HDD65°F < 7200
6 7200 < HDD65°F < 9000
7 9000 < HDD65°F < 12600
8 12600 < HDD65°F
For Version 3 of the ENERGY STAR qualified homes program the results shown in EPA 2009 are:
For this assessment, the code baseline is the 2006 version of the IECC. The main page of the Certified New Homes program states for the Version 3 program:
10
GARD Analytics, Inc. ENERGY STAR Adjustment 2012
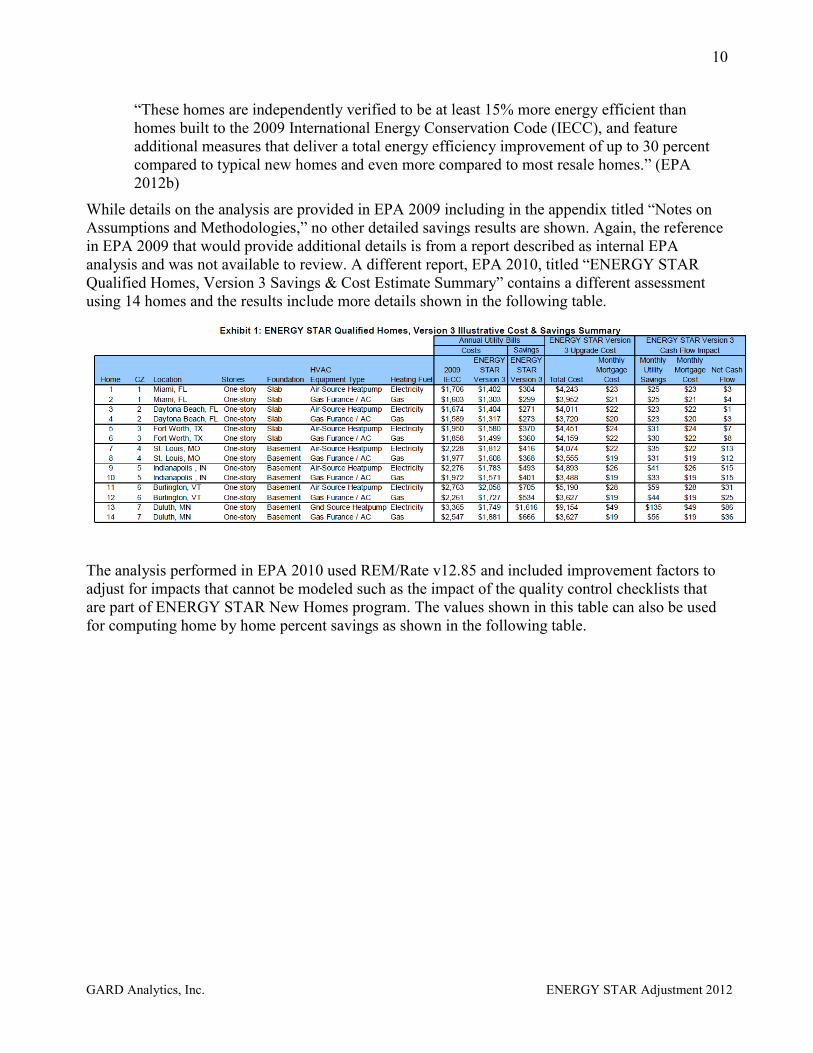
“These homes are independently verified to be at least 15% more energy efficient than homes built to the 2009 International Energy Conservation Code (IECC), and feature additional measures that deliver a total energy efficiency improvement of up to 30 percent compared to typical new homes and even more compared to most resale homes.” (EPA 2012b)
While details on the analysis are provided in EPA 2009 including in the appendix titled “Notes on Assumptions and Methodologies,” no other detailed savings results are shown. Again, the reference in EPA 2009 that would provide additional details is from a report described as internal EPA analysis and was not available to review. A different report, EPA 2010, titled “ENERGY STAR Qualified Homes, Version 3 Savings & Cost Estimate Summary” contains a different assessment using 14 homes and the results include more details shown in the following table.
The analysis performed in EPA 2010 used REM/Rate v12.85 and included improvement factors to adjust for impacts that cannot be modeled such as the impact of the quality control checklists that are part of ENERGY STAR New Homes program. The values shown in this table can also be used for computing home by home percent savings as shown in the following table.
11
GARD Analytics, Inc. ENERGY STAR Adjustment 2012
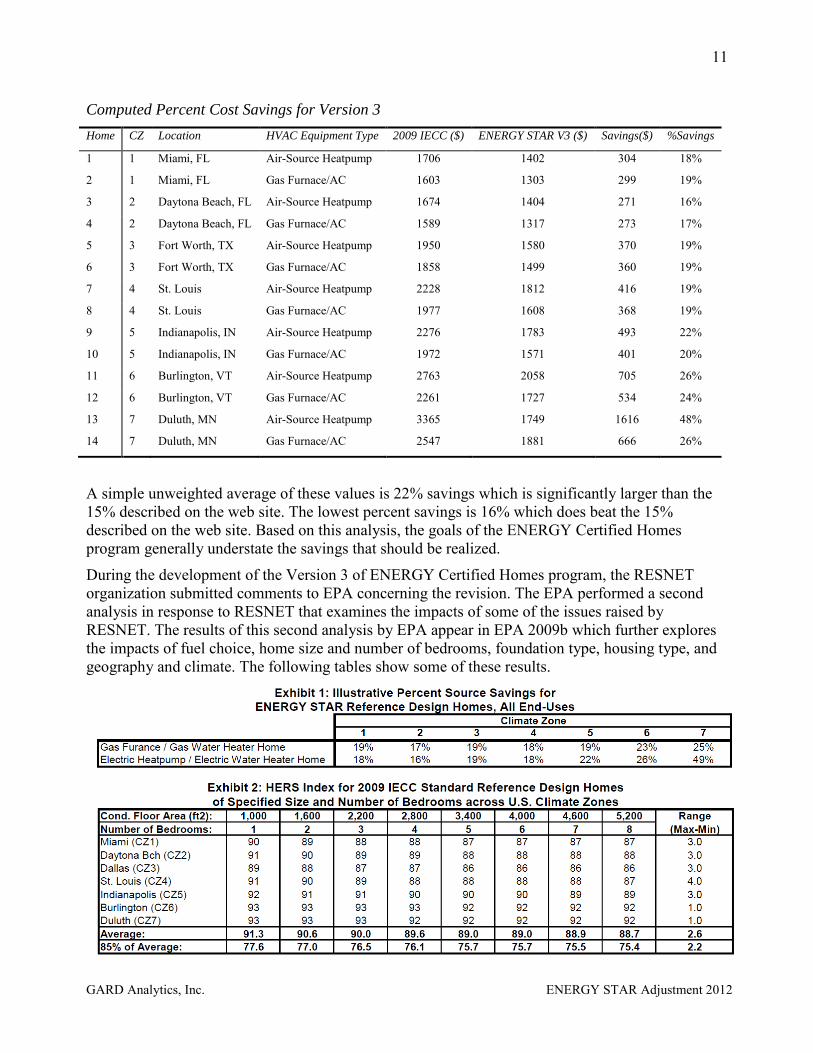
Computed Percent Cost Savings for Version 3
Home CZ Location HVAC Equipment Type 2009 IECC ($) ENERGY STAR V3 ($) Savings($) %Savings
1 1 Miami, FL Air-Source Heatpump 1706 1402 304 18%
2 1 Miami, FL Gas Furnace/AC 1603 1303 299 19%
3 2 Daytona Beach, FL Air-Source Heatpump 1674 1404 271 16%
4 2 Daytona Beach, FL Gas Furnace/AC 1589 1317 273 17%
5 3 Fort Worth, TX Air-Source Heatpump 1950 1580 370 19%
6 3 Fort Worth, TX Gas Furnace/AC 1858 1499 360 19%
7 4 St. Louis Air-Source Heatpump 2228 1812 416 19%
8 4 St. Louis Gas Furnace/AC 1977 1608 368 19%
9 5 Indianapolis, IN Air-Source Heatpump 2276 1783 493 22%
10 5 Indianapolis, IN Gas Furnace/AC 1972 1571 401 20%
11 6 Burlington, VT Air-Source Heatpump 2763 2058 705 26%
12 6 Burlington, VT Gas Furnace/AC 2261 1727 534 24%
13 7 Duluth, MN Air-Source Heatpump 3365 1749 1616 48%
14 7 Duluth, MN Gas Furnace/AC 2547 1881 666 26%
A simple unweighted average of these values is 22% savings which is significantly larger than the 15% described on the web site. The lowest percent savings is 16% which does beat the 15% described on the web site. Based on this analysis, the goals of the ENERGY Certified Homes program generally understate the savings that should be realized.
During the development of the Version 3 of ENERGY Certified Homes program, the RESNET organization submitted comments to EPA concerning the revision. The EPA performed a second analysis in response to RESNET that examines the impacts of some of the issues raised by RESNET. The results of this second analysis by EPA appear in EPA 2009b which further explores the impacts of fuel choice, home size and number of bedrooms, foundation type, housing type, and geography and climate. The following tables show some of these results.

12
GARD Analytics, Inc. ENERGY STAR Adjustment 2012
These results show some differences in HERS Index scores. The percent savings estimate for HERS Index scores is 1% for every 1 point below 100.
The energy savings predictions made so far in this section have been from EPA sources. Studies from other sources can also be used to understand the potential energy savings. While a large number of studies were reviewed, those that predict specific savings by climate or building type are limited.
In “Comparing Apples, Oranges and Grapefruit” (Fairey 2006) an analysis was performed “to determine the relationship between the U.S. Department of Energy’s Building America (BA) Benchmarking Analysis methods and the energy efficiency analysis methods used by the International Energy Conservation Code (IECC), the Residential Energy Services Network (RESNET), and the Home Energy Rating Systems (HERS) industry for similar purposes.” Since ENERGY STAR is based on the HERS Index, this comparison sheds light on the savings related to that especially in comparison to the IECC which sets the code minimum.
For the analysis, the Florida Solar Energy Center (FSEC) used EnergyGauge USA Version 2.5 Release 9 based on the DOE-2.1e simulation engine. The following graph shows some results from that study by climate zone:

13
GARD Analytics, Inc. ENERGY STAR Adjustment 2012
The graph shows the savings a prototype home built to the ENERGY STAR Certified New Homes version 2 in various cities, as compared to various baselines. The BA (Building America) is intended to represent standard practice construction in the mid 1990s and the results indicate savings should range from 25% to 35% when compared to ENERGY STAR qualified homes. It also shows that compared to the IECC 2006, savings should be from 8% to 15%.
The following map (DOE 2012) shows the level of adoption of residential building energy codes that are equivalent or more energy efficient than the IECC codes. Various versions of the IECC or derivatives are the most common residential energy code across the country.

14
GARD Analytics, Inc. ENERGY STAR Adjustment 2012
Another result of this same analysis is shown in the following graph which is based on the 2005 HERS Index.

15
GARD Analytics, Inc. ENERGY STAR Adjustment 2012
According to the definition of the HERS Index, a standard American new home (circa 2006) is intended to have a HERS Index of 100. This is not based on monitoring the performance of new homes but on predictive modeling based on assumptions that new homes are built just to code and no further. The green dotted line indicates the HERS Index that corresponds with ENERGY STAR Qualified Homes Version 2. It shows that IECC 2006 has HERS Indices of 95 to 97. It also indicates that the Building American (BA) Reference ranges from 111 to 131 which is intended to represent standard practice construction in the mid 1990s, higher scores since these buildings would have been built to earlier, less energy efficiency, building energy codes. This graph provides a comparison of the HERS Index goals of the ENERGY STAR Home program compared to IECC 2006 and to earlier constructions practices, BA Reference.
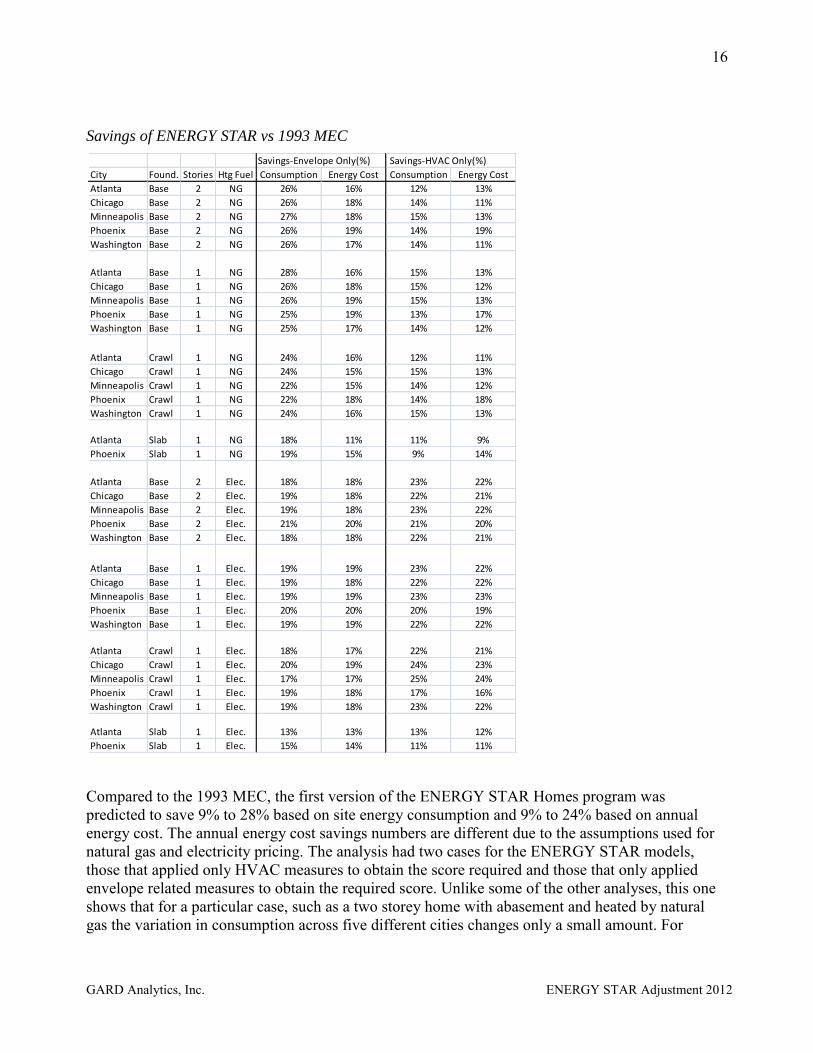
In an earlier study titled “EPA ENERY STAR Homes Program: Energy and Environmental Implications” (GARD 2002) estimates were made of energy savings of the first version of ENERGY STAR Homes program using REM/Rate and is focused on the difference in energy savings between homes with gas and electric appliances. These results are related to single family homes. The comparisons are made between the first version of ENERGY STAR Homes and the 1993 Model Energy Code (MEC) which is the predecessor to the International Energy Conservation Code (IECC). The report cited was prepared by the staff of GARD Analytics which also employs the author of this paper.
The following table is derived from values shown in Appendix A of the GARD 2002 report.
16
GARD Analytics, Inc. ENERGY STAR Adjustment 2012
Savings of ENERGY STAR vs 1993 MEC
Compared to the 1993 MEC, the first version of the ENERGY STAR Homes program was predicted to save 9% to 28% based on site energy consumption and 9% to 24% based on annual energy cost. The annual energy cost savings numbers are different due to the assumptions used for natural gas and electricity pricing. The analysis had two cases for the ENERGY STAR models, those that applied only HVAC measures to obtain the score required and those that only applied envelope related measures to obtain the required score. Unlike some of the other analyses, this one shows that for a particular case, such as a two storey home with abasement and heated by natural gas the variation in consumption across five different cities changes only a small amount. For
Savings-Envelope Only(%) Savings-HVAC Only(%)
City Found. Stories Htg Fuel Consumption Energy Cost Consumption Energy Cost
Atlanta Base 2 NG 26% 16% 12% 13%
Chicago Base 2 NG 26% 18% 14% 11%
Minneapolis Base 2 NG 27% 18% 15% 13%
Phoenix Base 2 NG 26% 19% 14% 19%
Washington Base 2 NG 26% 17% 14% 11%
Atlanta Base 1 NG 28% 16% 15% 13%
Chicago Base 1 NG 26% 18% 15% 12%
Minneapolis Base 1 NG 26% 19% 15% 13%
Phoenix Base 1 NG 25% 19% 13% 17%
Washington Base 1 NG 25% 17% 14% 12%
Atlanta Crawl 1 NG 24% 16% 12% 11%
Chicago Crawl 1 NG 24% 15% 15% 13%
Minneapolis Crawl 1 NG 22% 15% 14% 12%
Phoenix Crawl 1 NG 22% 18% 14% 18%
Washington Crawl 1 NG 24% 16% 15% 13%
Atlanta Slab 1 NG 18% 11% 11% 9%
Phoenix Slab 1 NG 19% 15% 9% 14%
Atlanta Base 2 Elec. 18% 18% 23% 22%
Chicago Base 2 Elec. 19% 18% 22% 21%
Minneapolis Base 2 Elec. 19% 18% 23% 22%
Phoenix Base 2 Elec. 21% 20% 21% 20%
Washington Base 2 Elec. 18% 18% 22% 21%
Atlanta Base 1 Elec. 19% 19% 23% 22%
Chicago Base 1 Elec. 19% 18% 22% 22%
Minneapolis Base 1 Elec. 19% 19% 23% 23%
Phoenix Base 1 Elec. 20% 20% 20% 19%
Washington Base 1 Elec. 19% 19% 22% 22%
Atlanta Crawl 1 Elec. 18% 17% 22% 21%
Chicago Crawl 1 Elec. 20% 19% 24% 23%
Minneapolis Crawl 1 Elec. 17% 17% 25% 24%
Phoenix Crawl 1 Elec. 19% 18% 17% 16%
Washington Crawl 1 Elec. 19% 18% 23% 22%
Atlanta Slab 1 Elec. 13% 13% 13% 12%
Phoenix Slab 1 Elec. 15% 14% 11% 11%
17
GARD Analytics, Inc. ENERGY STAR Adjustment 2012
envelope only the savings varies from 26% to 27%, a change of only 1% across very different climates. Generally, little sensitivity to climate is demonstrated with the results of this analysis.
No studies were found that specifically predicted the savings of the ENERGY STAR programs aimed at manufactured homes, modular homes, or high-rise or low-rise multifamily buildings.
8. Realized Savings
The measured savings for the ENERGY STAR Certified New Homes program was reported in a number of sources, as described in the following paragraphs.
In “Energy Savings from the Wisconsin ENERGY STAR Homes Program” (Pigg 2002) the study compared 100 ENERGY STAR homes to 175 non-participating homes in Wisconsin and showed a savings of 9.4% +/-5.7% for gas usage and 5.7%+/-7.6 for electricity usage but due to the relatively large sampling uncertainty it makes it difficult to draw definitive conclusions from the study. One of the conclusions reached was “the electricity analysis is also complicated by demographic and attitudinal differences between the participant and nonparticipant study groups” and also “there are hints that program participants are somewhat more complacent about their energy using habits than non-participants.” In other words, occupants of ENERGY STAR homes may be more likely to have habits that use more energy than occupants of non-ENERGY STAR homes.
In “An Exploratory Study on Energy Consumption of ENERGY STAR and Non-ENERGY STAR Homes” (Kulkarni 2010) compared 30 ENERGY STAR homes to 30 non-ENERYG STAR homes in Nevada and showed a 12.48% savings for annual electricity and -2.38% savings (an increase) in annual natural gas consumption. The summer electricity consumption was reduced by 16.36% and the winter gas consumption did not change.
In “Measuring Public Benefit from Energy Efficient Homes” (Swanson 2005) the study looked at 3336 baseline homes and 2979 ENERGY STAR homes in the Phoenix Arizona area built from 1995 to 2004. This study showed no gas energy savings for the ENERGY STAR homes and 4% electricity savings. But “slightly more than half of all Baseline homes appear to have met ENERGY STAR standards” which increases the efficiency of homes in the Baseline category well past what would be required to be code minimum. The savings estimates were confounded because the floor area of ENERGY STAR homes was typically larger than non-ENERGY STAR homes as well as being more likely to have swimming pools. When regression analysis of the dataset was applied and ENERGY STAR homes were compared to baseline homes that were not ENERGY STAR compliant, the ENERGY STAR homes used 16% less summer/cooling electricity.
In “Do ENERGY STAR Homes Live Up to their Promoted Energy Savings?” (Martin 2002) looked at over 900 homes of which 78 were ENERGY STAR homes built in 1998 and 1999 in Alachua County Florida. The results showed a 4% savings for the 1999 portion of the survey and 10% savings for the 2000 portion of the survey for ENERGY STAR homes compared to standards homes constructed during that time. For the 2000 data, heating savings was estimated to be 36% savings, cooling was 16%, and non-heating gas use was shown as an increase of 21%.
In “Evaluation, Measurement and Verification of the 2004 & 2005 California Statewide ENERGY STAR New Homes Program” (RLW 2007) the study showed an overall realization rate of 0.92 of actual to predicted electricity savings and 0.65 for actual to predicted gas consumption. No specific savings percentages were described in the report.

18
GARD Analytics, Inc. ENERGY STAR Adjustment 2012
In “Houston Home Energy Efficiency Study” (Hassel 2009) more than 226,000 homes built from 2003 to 2007 were included in the study. These represented homes built by dozens of production builders. Of these, 114,000 were baseline homes and 106,000 were ENERGY STAR homes. Energy use data was collected from the utilities from 2002 to 2008. The study also included the results of 14,000 REM/Rate simulations on a subset of homes. The results of the study showed that summer/cooling energy was 5% less for ENERGY STAR homes and the total electricity usage was 4% less for ENERGY STAR homes than baseline homes. In addition, gas usage decreased 5%. The following table from the report shows a remarkable trend in Base versus ES (ENERGY STAR) homes. Both Base and ENERGY STAR homes increased in efficiency from those built in 2002 to those built in 2007. Total electricity usage declined by 16 percent on the average and cooling electricity dropped by 18%.
The conclusions as to why the savings from ENERGY STAR homes in this study was not as significant as expected were “…typical construction practices were considerably better than the code-minimum HERS reference home, especially with respect to air conditioner efficiency. ENERGY STAR home program testing of duct systems, and perhaps building envelope leakage, may have affected standard trade practices creating spillover savings in the baseline homes.” In addition, “it is important to clarify that these results do not mean ENERGY STAR homes are using more energy than predicted. ENERGY STAR homes perform very close to the predictions of the HERS models, but baseline homes perform much better than the reference homes defined by the HERS standard. The better-than-code construction practices of baseline homes substantially reduced the difference between ENERGY STAR and baseline homes.”
One study looked at multifamily residential buildings in New York City titled “Energy Efficiency in Multifamily Affordable Housing: How can precedents of high performance affordable housing inform energy efficient building practices in this sector?” (Lehman 2009) and explicitly applied the
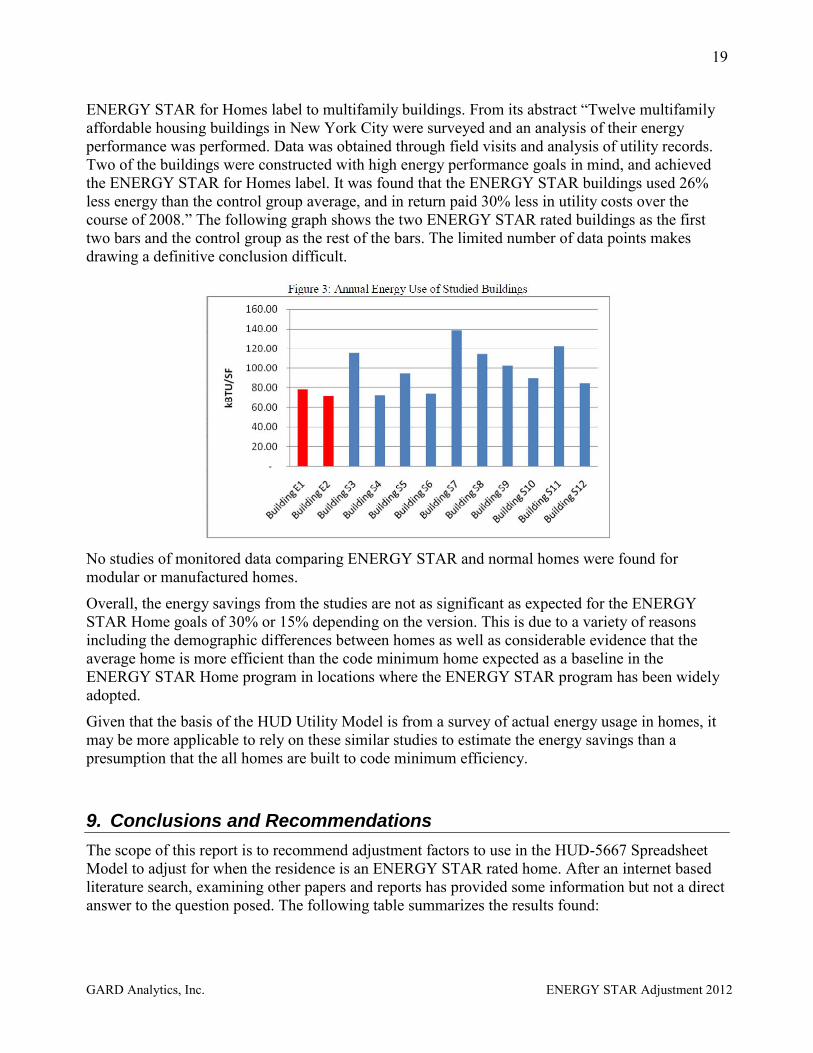
19
GARD Analytics, Inc. ENERGY STAR Adjustment 2012
ENERGY STAR for Homes label to multifamily buildings. From its abstract “Twelve multifamily affordable housing buildings in New York City were surveyed and an analysis of their energy performance was performed. Data was obtained through field visits and analysis of utility records. Two of the buildings were constructed with high energy performance goals in mind, and achieved the ENERGY STAR for Homes label. It was found that the ENERGY STAR buildings used 26% less energy than the control group average, and in return paid 30% less in utility costs over the course of 2008.” The following graph shows the two ENERGY STAR rated buildings as the first two bars and the control group as the rest of the bars. The limited number of data points makes drawing a definitive conclusion difficult.
No studies of monitored data comparing ENERGY STAR and normal homes were found for modular or manufactured homes.
Overall, the energy savings from the studies are not as significant as expected for the ENERGY STAR Home goals of 30% or 15% depending on the version. This is due to a variety of reasons including the demographic differences between homes as well as considerable evidence that the average home is more efficient than the code minimum home expected as a baseline in the ENERGY STAR Home program in locations where the ENERGY STAR program has been widely adopted.
Given that the basis of the HUD Utility Model is from a survey of actual energy usage in homes, it may be more applicable to rely on these similar studies to estimate the energy savings than a presumption that the all homes are built to code minimum efficiency.
9. Conclusions and Recommendations
The scope of this report is to recommend adjustment factors to use in the HUD-5667 Spreadsheet Model to adjust for when the residence is an ENERGY STAR rated home. After an internet based literature search, examining other papers and reports has provided some information but not a direct answer to the question posed. The following table summarizes the results found:
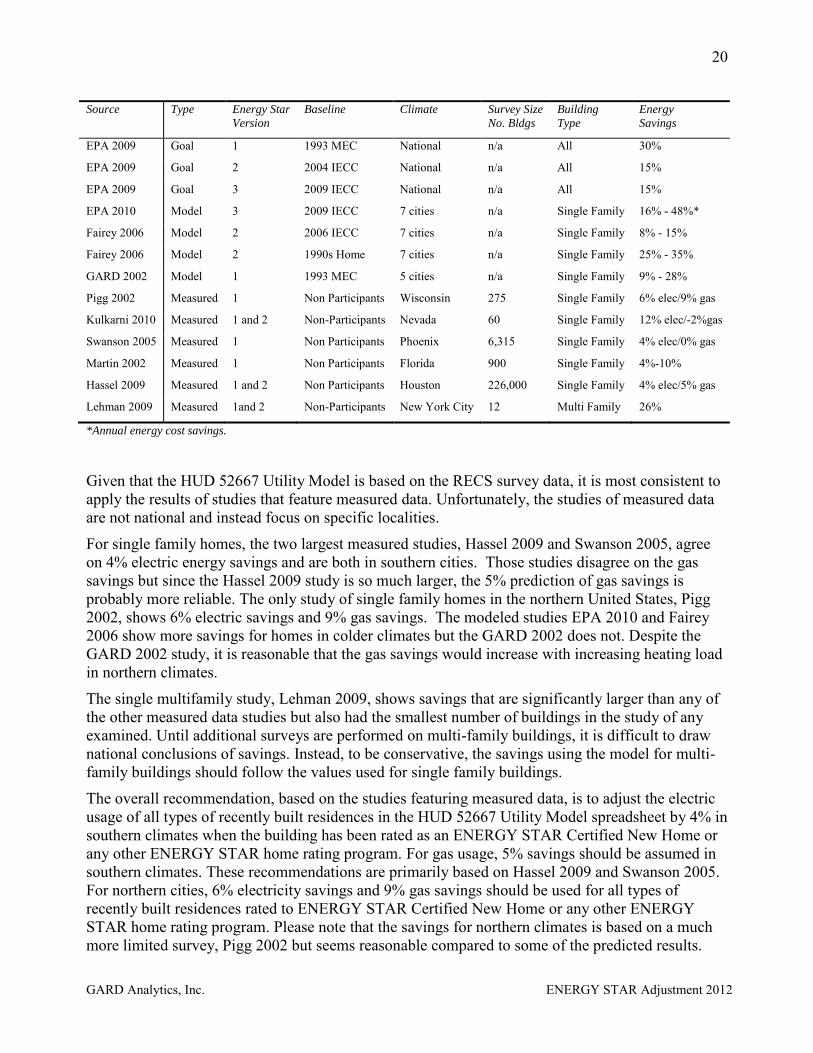
20
GARD Analytics, Inc. ENERGY STAR Adjustment 2012
Source Type Energy Star
Version
Baseline Climate Survey Size
No. Bldgs
Building
Type
Energy
Savings
EPA 2009 Goal 1 1993 MEC National n/a All 30%
EPA 2009 Goal 2 2004 IECC National n/a All 15%
EPA 2009 Goal 3 2009 IECC National n/a All 15%
EPA 2010 Model 3 2009 IECC 7 cities n/a Single Family 16% - 48%*
Fairey 2006 Model 2 2006 IECC 7 cities n/a Single Family 8% - 15%
Fairey 2006 Model 2 1990s Home 7 cities n/a Single Family 25% - 35%
GARD 2002 Model 1 1993 MEC 5 cities n/a Single Family 9% - 28%
Pigg 2002 Measured 1 Non Participants Wisconsin 275 Single Family 6% elec/9% gas
Kulkarni 2010 Measured 1 and 2 Non-Participants Nevada 60 Single Family 12% elec/-2%gas
Swanson 2005 Measured 1 Non Participants Phoenix 6,315 Single Family 4% elec/0% gas
Martin 2002 Measured 1 Non Participants Florida 900 Single Family 4%-10%
Hassel 2009 Measured 1 and 2 Non Participants Houston 226,000 Single Family 4% elec/5% gas
Lehman 2009 Measured 1and 2 Non-Participants New York City 12 Multi Family 26%
*Annual energy cost savings.
Given that the HUD 52667 Utility Model is based on the RECS survey data, it is most consistent to apply the results of studies that feature measured data. Unfortunately, the studies of measured data are not national and instead focus on specific localities.
For single family homes, the two largest measured studies, Hassel 2009 and Swanson 2005, agree on 4% electric energy savings and are both in southern cities. Those studies disagree on the gas savings but since the Hassel 2009 study is so much larger, the 5% prediction of gas savings is probably more reliable. The only study of single family homes in the northern United States, Pigg 2002, shows 6% electric savings and 9% gas savings. The modeled studies EPA 2010 and Fairey 2006 show more savings for homes in colder climates but the GARD 2002 does not. Despite the GARD 2002 study, it is reasonable that the gas savings would increase with increasing heating load in northern climates.
The single multifamily study, Lehman 2009, shows savings that are significantly larger than any of the other measured data studies but also had the smallest number of buildings in the study of any examined. Until additional surveys are performed on multi-family buildings, it is difficult to draw national conclusions of savings. Instead, to be conservative, the savings using the model for multi-family buildings should follow the values used for single family buildings.
The overall recommendation, based on the studies featuring measured data, is to adjust the electric usage of all types of recently built residences in the HUD 52667 Utility Model spreadsheet by 4% in southern climates when the building has been rated as an ENERGY STAR Certified New Home or any other ENERGY STAR home rating program. For gas usage, 5% savings should be assumed in southern climates. These recommendations are primarily based on Hassel 2009 and Swanson 2005. For northern cities, 6% electricity savings and 9% gas savings should be used for all types of recently built residences rated to ENERGY STAR Certified New Home or any other ENERGY STAR home rating program. Please note that the savings for northern climates is based on a much more limited survey, Pigg 2002 but seems reasonable compared to some of the predicted results.
21
GARD Analytics, Inc. ENERGY STAR Adjustment 2012
The reason for these savings numbers being so much lower than the savings goals touted by the EPA for the ENERGY STAR home program is due to a difference in the baseline. For the EPA, the baseline is for homes that just meet the energy efficiency requirements of the local building energy code. The results of the surveys indicate that where the ENERGY STAR home programs have been successful, spillover effects from those program cause the construction practice of typical homes to be substantially more energy efficient than homes built to just meet the local building energy codes. Essentially, the success of the ENERGY STAR home program has increased the efficiency of homes in general, not just those seeking a rating under the program and this has diminished the difference between those two groups of homes.
While a more detailed energy study based on building energy simulation models could be valuable in determining the level of savings for various types of residences and with a wider range of climate specific data, it would be important in such a study to clearly understand the baseline case for the residences should not be code minimum but instead reflects the actual construction practices across the country.
Perhaps the best solution to this problem would be to incorporate an additional question in future versions of the DOE/EIA RECS survey that asks the homeowner if the residence has been rated using ENERGY STAR or other incentive programs. Unfortunately, it may be years before adding such a question to a future survey would occur and additional years before analyzing results from the future survey could be performed.
10. Bibliography
DOE 2012. Status of State Energy Code Adoption. National Status-At-Glance, Current Residential. http://www.energycodes.gov/adoption/states . Viewed on October 15, 2012.
EPA 2009. Overview of Evolving ENERGY STAR Qualified Homes Program & Methodology for Estimating Savings. May 5, 2009. EPA. http://www.energystar.gov/ia/partners/bldrs_lenders_raters/downloads/2011_Technical_Background.pdf
EPA 2009b. EPA Response to RESNET’s Comments on the Proposed ENERGY STAR 2011 Qualified New Homes Guidelines. https://www.energystar.gov/ia/partners/bldrs_lenders_raters/downloads/EPA_Response_to_RESNET.pdf
EPA 2010. ENERGY STAR Qualified Homes, Version 3 Savings & Cost Estimate Summary. https://www.energystar.gov/ia/partners/bldrs_lenders_raters/downloads/EstimatedCostandSavings.pdf
EPA 2010b. ENERGY STAR Qualified Homes National Performance Path Notes. http://www.energystar.gov/ia/partners/bldrs_lenders_raters/downloads/PerfPathTRK.pdf
EPA 2010c. ENERGY STAR Qualified Homes National Builder Option Package. http://www.energystar.gov/ia/partners/bldrs_lenders_raters/downloads/Nat_BOP_Final.pdf
EPA 2012. ENERGY STAR Overview of 2011 Achievements. EPA. www.energystar.gov/ia/partners/publications/pubdocs/2011_4-Pager_508c_060812.pdf March 2012.
22
GARD Analytics, Inc. ENERGY STAR Adjustment 2012
EPA 2012b. Web page referenced on October 1, 2012. https://www.energystar.gov/index.cfm?c=new_homes.hm_index
Fairey 2006. Fairey, Philip; Conlon, Carlos; Martin, Eric; Chandra, Subrato. Comparing Apples, Oranges and Grapefruit: An Analysis of Current Building Energy Analysis Standards for Building American, Home Energy Ratings and the 2006 International Energy Conservation Code. FSEC-CR-1650-06. http://www.fsec.ucf.edu/en/publications/pdf/FSEC-CR-1650-06.pdf September 2006.
GARD 2002. EPA ENERY STAR Homes Program: Energy and Environmental Implications. GARD Analytics. http://www.aga.org/SiteCollectionDocuments/KnowledgeCenter/OpsEng/CodesStandards/0908ENERGYGARD.PDF October 2002.
Hassel 2009. Hassel, Shaun; Blasnik, Michael; Hannas, Benjamin. Houston Home Energy Efficiency Study. http://www.advancedenergy.org/buildings/knowledge_library/FINAL_Paper_Houston_Energy_Efficiency_Study.pdf December 16 2009.
ICC 2009. International Energy Conservation Code. International Code Council. www.iccsafe.org. January 2009.
Kulkarni 2010. Kulkarni, Prajakta Amolprasad. An Exploratory Study on Energy Consumption of ENERGY STAR and Non-ENERGY STAR Homes. Masters of Science Thesis. University of Nevada, Las Vegas. May 2010.
Lehman 2009. Lehman, Joshua. Energy Efficiency in Multifamily Affordable Housing: How can precedents of high performance affordable housing inform energy efficient building practices in this sector? http://envstudies.brown.edu/theses/JoshuaLehmanThesis.pdf Brown University. May 12, 2009.
Martin 2002. Martin, Eric; Vieira, R.; Hanson; B.; Sonne, J.; Jones, P.; Koppitch, K.;Phillips S.; Gumber, T. Do ENERGY STAR Homes Live Up to their Promoted Energy Savings? A Comparison of Utility Bill Data for Recently Built ENERGY STAR and Control Homes in Alachua County, Florida. 2002.
Pigg 2002. Pigg, Scott. Energy Savings from the Wisconsin ENERGY STAR Homes Program, Scott Pigg, Energy Center of Wisconsin, Research Report 211-1. October 2002
RLW 2007. Evaluation, Measurement and Verification of the 2004 & 2005 California Statewide ENERGY STAR New Homes Program. CALMAC ID PGE0218. http://www.calmac.org/publications/Final_Version_of_04-05_CAESNH_report.pdf July 18, 2007.
Swanson 2005. Swanson, Colby; Blasnik, Michael; Calhoun, Eric. Measuring Public Benefit from Energy Efficient Homes. 2005