appendix-5.3 natural condition surveyopen_jicareport.jica.go.jp/pdf/11737756_07.pdf ·...
TRANSCRIPT

Appendix-5.3
Natural Condition Survey
A5.3-1
5.3 Natural Condition Survey
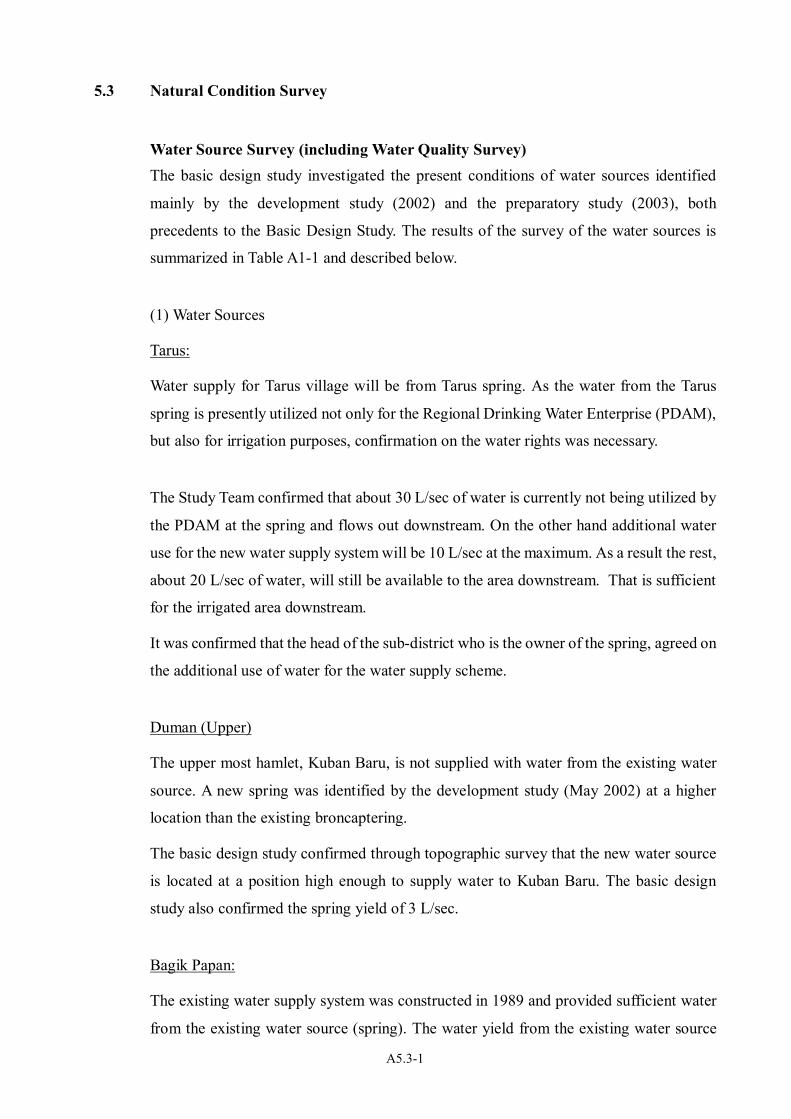
Water Source Survey (including Water Quality Survey) The basic design study investigated the present conditions of water sources identified
mainly by the development study (2002) and the preparatory study (2003), both
precedents to the Basic Design Study. The results of the survey of the water sources is
summarized in Table A1-1 and described below.
(1) Water Sources
Tarus:
Water supply for Tarus village will be from Tarus spring. As the water from the Tarus
spring is presently utilized not only for the Regional Drinking Water Enterprise (PDAM),
but also for irrigation purposes, confirmation on the water rights was necessary.
The Study Team confirmed that about 30 L/sec of water is currently not being utilized by
the PDAM at the spring and flows out downstream. On the other hand additional water
use for the new water supply system will be 10 L/sec at the maximum. As a result the rest,
about 20 L/sec of water, will still be available to the area downstream. That is sufficient
for the irrigated area downstream.
It was confirmed that the head of the sub-district who is the owner of the spring, agreed on
the additional use of water for the water supply scheme.
Duman (Upper)
The upper most hamlet, Kuban Baru, is not supplied with water from the existing water
source. A new spring was identified by the development study (May 2002) at a higher
location than the existing broncaptering.
The basic design study confirmed through topographic survey that the new water source
is located at a position high enough to supply water to Kuban Baru. The basic design
study also confirmed the spring yield of 3 L/sec.
Bagik Papan:
The existing water supply system was constructed in 1989 and provided sufficient water
from the existing water source (spring). The water yield from the existing water source

A5.3-2
has declined to 1.3 L/sec (measured by the basic design study team) due to deforestation
by re-settlers settled on the area above the spring. As the existing water source is no
longer sufficient for the water supply scheme, the recent Development Study (2002) has
already identified the new water source (M.A. Balas-I).
It was re-confirmed by this study that the new water source is available for the scheme (no
water rights issues exist), and that it has adequate volume and is of good quality.
Labuhan Mapin:
It was reported that the water supply to Labhan Mapin was not sufficient and therefore,
development of new water sources would be required.
The observations and conclusions by the basic design study are as follows;
The development study reported that:
Water flow from the spring (M.A. Remas) to the broncaptering was reduced to 6 L/sec
(measured in the rainy season by the development study) because a fallen tree damaged
the flow path and disturbed the water flow.
PDAM Sumbawa repaired the damage in 2001, resulting in a water flow of 11 L/sec to the
broncaptering even in the dry season (measured by the development study).
The basic design study confirmed that:
・ Water volume collected by the broncaptering is 9.5 L/sec, and the water flow at the lowest BPT (Break Pressure Tank) was also 9.5 L/sec, indicating no major leakage from the transmission pipe.
・ There was about 9.5 L/sec of leakage from a damaged part of the broncaptering. As the damaged part was repairable with simple concrete patch works, PDAM Sumbawa explained that they will repair it during the coming dry season.
・ Total of 19 L/sec will be available for the existing water supply system if the damaged part is repaired to restore the water flow to the system to the original level of 20 L/sec.
・ It was also confirmed by the Basic Design Study that the present water supply to Labuhan Mapin is 7.9 L/sec. That exceeds the required water flow to the designed scheme by the Development Study (2002).
・ On the other hand, the Team observed leakage from distribution pipes, illegal connections by-passing flow meters, unclosed water taps wasting water, and other forms of wastage.

A5.3-3
From the above observations the basic design study concludes that development of new
water sources is not justifiable. Rather than that, proper operation and maintenance of the
water supply system, including repairing the leaking pipes, banning illegal connections
and, accepting adequate metering regulations will solve the impending problem of
insufficient water.
Spring water discharge has been smaller than before due to illegal forest cutting. To
preserve spring water as a resource, it is necessary to stop such an illegal act.
(2) Water Quality
Out of the nine (9) water supply schemes, water quality analysis was carried out for the
following three systems, for which the preceding preparatory study pointed out the
necessity for further investigation on water sources.
・ Duman (Upper) ・ Bagik Papan ・ Labuhan Mapin
Water samples taken from the water sources by the team were sent to a laboratory
immediately after the sampling. The result of the water quality analysis is shown in Table
A1-2 together with the results of the other six (6) systems for which water quality analysis
had already been carried out by the development study (2002). The reports from the
laboratory for the water samples analyzed for the Basic Design Study are also attached.
a. Water quality evaluation as drinking water
The Indonesian guidelines for drinking water quality are also shown in the Table A1-2.
The table shows that all the analyzed samples are within the Indonesian guidelines for
drinking water quality except for bacteria and coliform.
b. Hydrogeological interpretation
In addition to the water quality analysis for drinking water, hydro-geological
interpretation was carried out using the following items.
・ Cation: Na, K, Ca, Mg

A5.3-4
・ Anion : Cl, HCO3, CO3, SO4
Analyzed results were converted from milligram per liter (mg/L) to milli-equivalent per
liter, thereafter plotted on a ‘Trilinear diagram’ and ‘Stiff diagram’ as shown in Figure
A1-1 and Figure A1-2 respectively.
1) Figure A1-1 Trilinear diagram shows all the water plots within the domain-I that
represents water circulating near the ground surface, including surface water. 2) Figure A1-2 Stiff diagram shows two typical patterns; (1) water from Labuhan Mapin
and Tarus show a similar pattern (pattern-A), (2) the others show the a second similar pattern (pattern-B). Pattern-A, which is strongly affected by the carbonated aquifer, is grouped in the Ca-HCO3 type. ・ It is considered that the springs of Labuhan Mapin and Tarus originate from
limestone aquifers, and the aquifers are being relatively quickly recharged by surface water.
・ The other water sources originate from very shallow aquifers, which are directly recharged by surface water. Water flow of those water sources may be strongly affected by rainfall.
A5.3-5
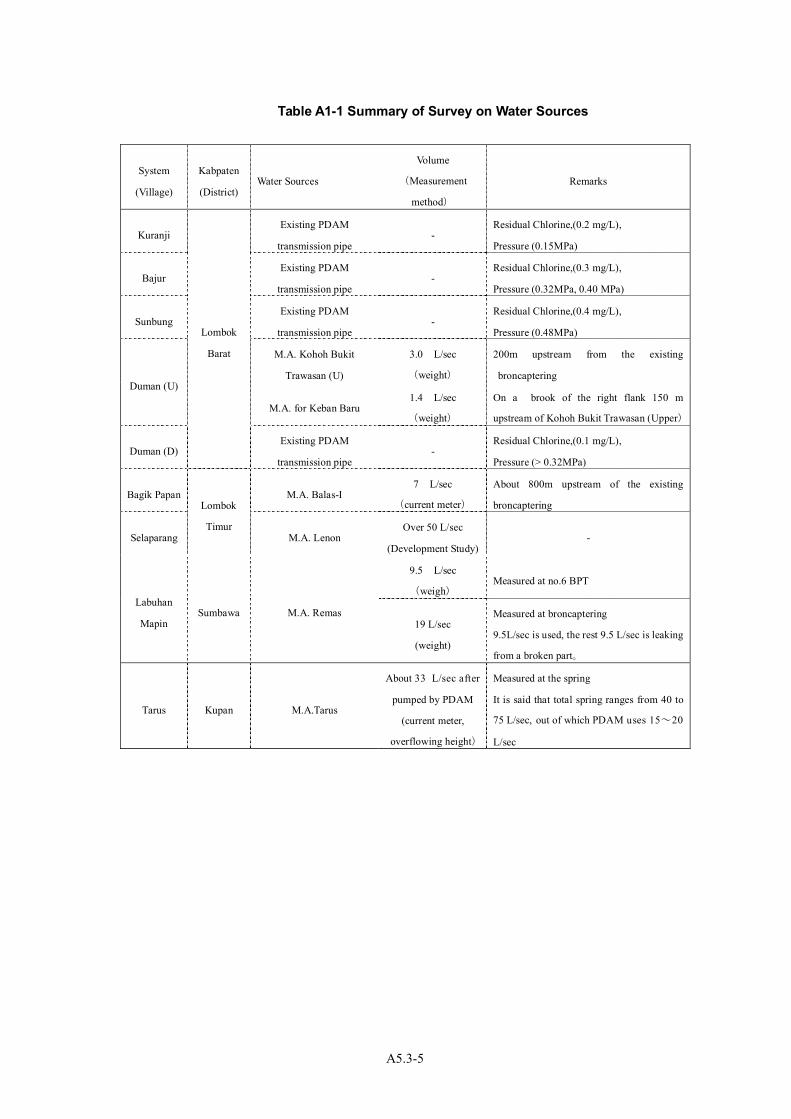
Table A1-1 Summary of Survey on Water Sources
System
(Village)
Kabpaten
(District) Water Sources
Volume
(Measurement
method)
Remarks
Kuranji Existing PDAM
transmission pipe -
Residual Chlorine,(0.2 mg/L),
Pressure (0.15MPa)
Bajur Existing PDAM
transmission pipe -
Residual Chlorine,(0.3 mg/L),
Pressure (0.32MPa, 0.40 MPa)
Sunbung Existing PDAM
transmission pipe -
Residual Chlorine,(0.4 mg/L),
Pressure (0.48MPa)
M.A. Kohoh Bukit
Trawasan (U)
3.0 L/sec
(weight)
200m upstream from the existing
broncaptering Duman (U)
M.A. for Keban Baru 1.4 L/sec
(weight)
On a brook of the right flank 150 m
upstream of Kohoh Bukit Trawasan (Upper)
Duman (D)
Lombok
Barat
Existing PDAM
transmission pipe -
Residual Chlorine,(0.1 mg/L),
Pressure (> 0.32MPa)
Bagik Papan M.A. Balas-I 7 L/sec
(current meter)
About 800m upstream of the existing
broncaptering
Selaparang
Lombok
Timur M.A. Lenon
Over 50 L/sec
(Development Study)-
9.5 L/sec
(weigh) Measured at no.6 BPT
Labuhan
Mapin Sumbawa M.A. Remas
19 L/sec
(weight)
Measured at broncaptering
9.5L/sec is used, the rest 9.5 L/sec is leaking
from a broken part。
Tarus Kupan M.A.Tarus
About 33 L/sec after
pumped by PDAM
(current meter,
overflowing height)
Measured at the spring
It is said that total spring ranges from 40 to
75 L/sec, out of which PDAM uses 15~20
L/sec

Table A1-2 Results of Water quality Analysis
Village T(℃) pH EC NH4 NO3 NO2 Bacteria T.Coliform Cr Fl As Pb Se Hg CN Fe Cd Mn Cu Na K Ca Mg Cl HCO3 SO4 SiO4
TotakHardness
asCaCO3
Note
(mS/m) (mg/L) (mg/L) (mg/L) colony (mg/L) (mg/L) (mg/L) (mg/L) (mg/L) (mg/L) (mg/L) (mg/L) (mg/L) (mg/L) (mg/L) (mg/L) (mg/L) (mg/L) (mg/L) (mg/L) (mg/L) (mg/L) (mg/L) (mg/L)
Labuhan Mapin(No.6BPT)
24.2 7.7 34.1 0.0 0.0 0.0 30.0 D <0.01 0.1 <0.005 <0.005 <0.005 <0.001 <0.01 <0.01 <0.001 <0.01 <0.02 11.7 <0.02 45.1 11.2 3.9 202.0 6.8 26.7 158.7
Labuhan Mapin(MA Remas)
22.0 7.4 34.7 0.0 0.0 0.0 30.0 D <0.01 0.0 <0.005 <0.005 <0.005 <0.001 <0.01 <0.01 <0.001 <0.01 <0.02 10.5 <0.02 43.0 10.2 3.7 205.1 6.8 79.7 149.6
Duman (Upper) 22.0 7.8 6.7 0.0 0.0 0.0 30.0 D <0.01 0.2 <0.005 <0.005 <0.005 <0.001 <0.01 0.1 <0.001 <0.01 <0.02 5.9 <0.02 4.1 1.3 3.3 29.0 0.9 13.2 15.5
Bagik Papan 21.0 7.4 29.0 0.0 0.0 0.0 30.0 D <0.01 0.5 <0.005 <0.005 <0.005 <0.001 <0.01 <0.01 <0.001 <0.01 <0.02 19.1 <0.02 22.7 11.9 5.1 156.0 5.0 49.4 105.6
Kuranji
Bajur
Sunbung 28.3 7.0 11.8 0.0 2.5 0.0 0.0 ND <0.006 0.1 <0.001 <0.01 <0.007 <0.001 <0.01 <0.04 <0.005 <0.02 <0.03 8.4 4.0 5.6 3.5 0.0 75.6 2.3 55.5 28.6
Selaparan 22.1 6.6 16.0 <0.1 2.0 <0.02 25.0 ND <0.006 0.2 <0.001 <0.01 <0.007 <0.001 <0.01 <0.04 <0.005 <0.02 <0.03 8.7 3.4 9.7 4.9 4.8 56.4 2.8 29.0 44.6
Duman(Lower) 25.2 6.7 14.8 0.0 4.0 0.0 0.0 ND <0.006 0.4 <0.001 <0.01 <0.007 <0.001 <0.01 <0.04 <0.005 <0.02 <0.03 10.2 6.1 6.9 4.7 2.3 96.1 <0.94 58.0 36.6
Tarus 27.9 6.9 53.1 <0.1 5.0 <0.02 >100 D <0.006 0.1 <0.001 <0.01 <0.007 <0.001 <0.01 <0.04 <0.005 <0.02 <0.03 20.5 1.3 79.9 2.8 7.2 335.4 4.3 9.0 210.9
Potable WaterGuidelineIndonesia
- - - - 10.0 1.0 - ND 0.05 1.40 0.05 0.05 0.01 0.00 0.10 0.30 0.005 0.10 1.00 200 - - - 250 - 400 - -
*ND:Non Detected D:Detected
Analysis by B
asic Design S
tudy
Analysis by D
evelopment S
tudy
<0.001 <0.01 <0.04 54.8<0.9484.60.0 27.9<0.0050.1 <0.001 <0.01 <0.00728.2 7.1 11.6 2.5 2.5 0.1 0.0 ND
Measured in site Health-related Item Hydrogeology-related Item
4.3<0.02 <0.03 8.9 3.45.5<0.006
A5.3-6
Total Hardness as CaCO3

Figure 2.3.2-2 Stiff DiagramFigure 2.3.2-1 Trilinear Diagram
I
II
III
IV
A5.3-7
Figure A1-1 Figure A1-2

Appendix-5.4
Social Condition Survey

A5.4-1
5.4 Social Condition Survey
(1) Summary of the Interview Survey
1) General description of interview survey
An interview survey was conducted to verify the willingness to pay (WTP) for water fees on
the improved water supply in three villages (Duman Upper, Bagik Papan, and Selaparang)
that were pointed out in preparatory study report. The interview survey was contracted to a
local consultant firm. The survey was carried out through interview style based on the
Contingent Valuation Method (CVM). The collections of data were done using a structured
questionnaire. The householder was asked how much he or she was willing to pay for a given
level of service on the improved water supply. The collected data were analyzed statistically.
The questionnaire differs from the usual household survey greatly in that an evaluation
scenario was explained. Thus, interviewees were informed about all important aspects, such
as the present situation of water supply in a village, the hypothetical situation of the
improved water system, and operation and maintenance (O&M) methods of the system. The
interviewees were given special impetus to answer honestly by careful explanation to
consider whether they would truly be able to pay, or whether there was a possibility that it
might become impossible for them to buy necessary items.
2) Sample collection and analysis
The interview survey was conducted in Duman Upper and Bagik Papan where there will be a
Type C system (village/water user’s association management), and in Selaparang where
there will be a Type A system (PDAM management).
Table B1-1 Sample Size (CVM)
Province District Village Type House Connection Public Tap Total
Lombok Barat Duman Upper 126 126
252
Bagik Papan C 126 126 252 NTB
Lombok Timur Selaparang A 125 125 250 Total 754
①Duman Upper and Bagik Papan:
In Duman Upper and Bagik Papan, the interview survey was conducted on 252 households
A5.4-2
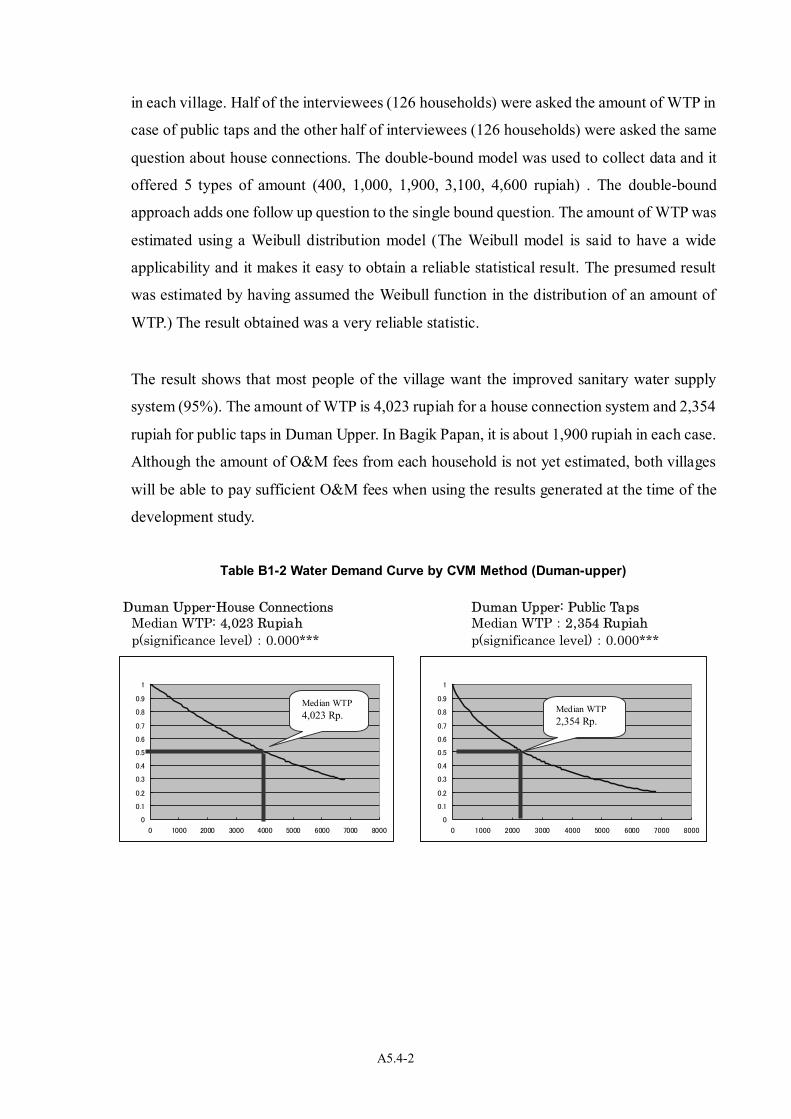
in each village. Half of the interviewees (126 households) were asked the amount of WTP in
case of public taps and the other half of interviewees (126 households) were asked the same
question about house connections. The double-bound model was used to collect data and it
offered 5 types of amount (400, 1,000, 1,900, 3,100, 4,600 rupiah) . The double-bound
approach adds one follow up question to the single bound question. The amount of WTP was
estimated using a Weibull distribution model (The Weibull model is said to have a wide
applicability and it makes it easy to obtain a reliable statistical result. The presumed result
was estimated by having assumed the Weibull function in the distribution of an amount of
WTP.) The result obtained was a very reliable statistic.
The result shows that most people of the village want the improved sanitary water supply
system (95%). The amount of WTP is 4,023 rupiah for a house connection system and 2,354
rupiah for public taps in Duman Upper. In Bagik Papan, it is about 1,900 rupiah in each case.
Although the amount of O&M fees from each household is not yet estimated, both villages
will be able to pay sufficient O&M fees when using the results generated at the time of the
development study.
Table B1-2 Water Demand Curve by CVM Method (Duman-upper)
Duman Upper-House Connections Duman Upper: Public Taps Median WTP: 4,023 Rupiah Median WTP:2,354 Rupiah p(significance level):0.000*** p(significance level):0.000***
0
0.1
0.2
0.3
0.4
0.5
0.6
0.7
0.8
0.9
1
0 1000 2000 3000 4000 5000 6000 7000 8000
Median WTP 2,354 Rp.
0
0.1
0.2
0.3
0.4
0.5
0.6
0.7
0.8
0.9
1
0 1000 2000 3000 4000 5000 6000 7000 8000
Median WTP 4,023 Rp.

A5.4-3
Table B1-3 Water Demand Curve by CVM Method (Bagik Papan)
Bagik Papan- House Connections Bagik Papan- Public Taps Median WTP:1,909 Rupiah Median WTP:1,903 Rupiah p(significance level):0.000*** p(significance level):0.000*** In Bagik Papan, although many households are willing to pay more O&M fees for house
connections than public taps, the medium WTP is almost the same at 1,900 rupiah. The
following three reasons are mentioned for the cheaper amount of the WTP; 1) Except for one
hamlet, there is access to water such as using shallow wells, irrigation channels or springs,
despite unsanitary conditions. 2) A common reason that it cannot be paid is that he or she
could not afford to pay, even though they understood the importance of O&M. 3) Most of
the households are poor and daily seasonal labor. Moreover, because of poverty, there is also
a high number of migrant male workers in Bagik Papan.
② Selaparang:
The interview survey was conducted to 250 households in Selaparang. Half of the
interviewees (125 households) were asked their WTP for public taps system, and the
remaining 125 households were asked the same question for house connections.
In Selaparang, all households want the improved water supply system. First of all, the WTP
for house connections was asked on four prepared amounts (4,200, 4,800, 5,400, 6,000
rupiah) that was set up in consideration of the PDAM tariff. Most of the households (99%)
answered that they were able to pay. According to the interviewers, households answered
that they were able to pay a water charge of more than 10,000 rupiah. At present, households
have paid an average 513 rupiah per day for purchasing water, which if converted to a
monthly charge is 15,390 rupiah. Therefore, there is no doubt about WTP for house
0
0.1
0.2
0.3
0.4
0.5
0.6
0.7
0.8
0.9
1
0 1000 2000 3000 4000 5000 6000 7000 8000
Median WTP 1,909 Rp.
0
0.1
0.2
0.3
0.4
0.5
0.6
0.7
0.8
0.9
1
0 1000 2000 3000 4000 5000 6000 7000 8000
Median WTP 1,903 Rp.

A5.4-4
connections in Selaparang. This is because piped water has been supplied only after
midnight, although an existing PDAM system is connected. Therefore, households feel very
strong stress under the present service, and if there is an improved water supply system, they
will pay as much as they can for the water charge.
On the other hand, the WTP for public taps was asked for four prepared amounts (1,580,
1,800, 2,000, 2,200 rupiah). In the results, a number of households (78%) answered that they
did not want to pay the water fees for public taps. This is because Care International once
installed a public tap system for water supply in the community. However, the amount of
water was limited and it caused scrambling for water between households. In order to
prevent the same problem, many households want to pay for a house connection system
rather than a public tap system.
Table B1-4 Water Demand Curve by CVM Method (Selaparang)
Selaparang - House Connections Selaparang - Public taps Median WTP:13,358 Rupiah Median WTP:1,000 Rupiah p(significance level):0.192 p(significance level):0.001***
The result of the estimation was calculated using a logit model. The CVM result for house
connections (see left box) shows that the coefficient on this variable is not statistically
significant (p-value is larger than 0.1). However, it showed that 124 households out of 125
households would pay and there is no doubt about WTP for house connections. On the other
hand, the WTP for public taps was cheaper as 1,000 rupiah, and 97 households out of 125
households did not want to pay because of the above-mentioned reasons.
0
0.1
0.2
0.3
0.4
0.5
0.6
0.7
0.8
0.9
1
0 500 1000 1500 2000 2500 3000
Yes確率
Median WTP 1,000 Rp.
0
0.1
0.2
0.3
0.4
0.5
0.6
0.7
0.8
0.9
1
0 2000 4000 6000 8000 10000 12000 14000
Yes確率
Median WTP 13,359 Rp.

A5.4-5
(2) Baseline Survey of the Community
1) General description of the baseline survey
The baseline survey was conducted to collect baseline data on the socio-economic
conditions in the project site. The baseline survey was contracted by a local consultant firm.
The survey was conducted at nine (9) systems in eight (8) project villages in the entire
project site. Only a baseline survey was carried out this time, since the more detailed
socio-economic survey was conducted during the development study. The survey was to
randomly cover at lease 20 households at each site as listed below.
Table B2-1 Number of Survey Samples (Baseline Survey)
Survey area:9 systems in 8 project villages
Province District village Number of Household in area to be served (2001) No. of Samples
Kuranji 441 20 Bajur 1,230 30 Sumbung 449 25 Duman (upper) 809 25
Lombok Barat
Duman (lower) 147 20 Bagik Papan 647 25 Lombok Timur Selaparang 663 25
NTB
Sumbawa Labuhan Mapin 634 25 NTT Kupang Tarus 603 20
Total 5,622 215
2) Results of the baseline survey
A brief summary of the results of the baseline survey is shown in Table B2-2. The detailed
results of the baseline survey were prepared for each village. In the targeted villages,
households use different water sources for drinking and washing purposes. Therefore, in
many cases, they do not see the quality of drinking water as a problem, but washing water is
felt to be dirty. Most of the households are dissatisfied with water quantity. Especially in the
dry season, many people have to walk a long distance to fetch water from a spring or river. It
makes women, who have the primary responsibility for water collection, become
overworked. According to the incidence rate at the health center, the incidence of water born
disease is higher in the dry season. There are not sufficient amounts of water during the dry
season. Many people do not like the present facilities and would prefer an improved sanitary
water supply system. Most of the households (100% in Kupang, Sumbawa and Lombok
Barat, and more than 80% in Lombok Timur) are willing to pay for water fees for an
improved water supply system. However, the amount of the WTP was slightly lower than the
result of CVM method. This is because the households were asked directly about WTP, “how

A5.4-6
much can you pay?” without informing them about all the important aspects such as the plan
of the water supply system, detailed explanations of the O&M fees and usages of expenses,
and importance of health and hygiene. Therefore households will be more willing to pay
water fees through a deepening understanding of the new water supply system, water fees,
importance of O&M activities and hygiene. According to the World Bank’s ‘rule of thumb’,
the cost of water should not exceed 3% of total household income or expenditure. The 3% of
household income and expenditure was estimated and shown in the table. Accordingly, the
PDAM tariffs and the O&M costs will be financially affordable by the households.

A5.4-7
Table B2-2 Baseline Survey Data Item Unit Kuranji Bajur Sumbung Duman
Upper Duman Lower Bagik
Papan Selaparang Labuhan
Mapin Tarus
No. of household Person 4.05 4.7 4.68 4.92 5.05 4.6 4.84 4.92 5.35 Children :Adult 48:52 39:61 35:65 45:55 39:61 47:53 45:55 47:53 51:49
Occupation Trading
Wage lab.
Trading Agri.rice
Wage lab Agri rice
Agriculture
Agri rice Trading
Agri lab Agri rice
Agriculture Rice
Fishery Trading Wage lab
Cattle % household 0 0 0 0 0 4 0 24 0 Goats / sheep % household 0 0 0 0 0 8 12 16 0 Poetry % household 50 30 88 64 50 56 32 32 55 Ave. hhd. Income Rupiah/month/hhd 320,855 537,628 358,640 410,105 381,679 813,536 1,019,669 440,896 410,150 Ave. hhd. Expenditure Rupiah/month/hhd 611,743 846,932 626,982 938,856 648,503 1,113,383 1,429,521 491,186 598,050 Water purchase % household 5%(1/20) 3%(1/30) 4%(1/25) 28%(7/25) 5%(1/20) 28%(7/25) 52%(13/25) 44%(11/25) 20%(4/20) Water fees Rupiah/month/hhd 10,000 15,000 13,333 3,214 20,000 7,714 31,038 37,568 80,000 Tobacco payment Rupiah/month/hhd 44,867 103,889 71,289 19,813 77,597 45,083 77,433 75,357 62,222
Possession rate of TV % 35 70 60 44 40 56 56 40 100
Ave no of collection times/day 6 5 6 6 5 4 5 11 9
Water source for Drinking
Well 65% HC 30%
Well 97% Parch.
3%
Well 76% Spring
20% PT 4%
PT 100% River user
Well 70% Spring 25%
Purch 5%
PT 100% HC 56% PT 44%
PT 48% HC 35%
Well 17%
Well 65% Purch 20% River 10%
HC 5%
Water source for washing
Well 100%
Well 100%
Spring 56%
PT 24% Well 20%
PT 56% River 44%
Well45% Spring40% River15%
River 100%
River 76% HC 12% PT 12%
PT 45% HC 41% Well 9%
River 5%
Well 42% River 37%
Ave. distance to water (rainy season) meter 14m 5m 5m 68m 68m 109m 2m 172m 195m Ave. distance to water (dry season) meter 18m 6m 195m 706m 243m 116m 24m 172m 195m Quantity of Water Satisfaction % 0% 0% 0% 36% 0% 0% 0% 37% 100%
Quality of Water Satisfaction % 95% 100% 100% 64% 83% PT 100% River 0%
PT 100% River 0%
PT 0% Well 0%
82%
Needs of improved facility Necessity % 90% 90% 88% 80% 80% 100% 100% 100% 100% Willingness to Pay % 80% 90% 84% 80% 78% 88% 96% 100% 100% Amount of WTP Rupiah/month/hhd 2,167 2,688 2,381 1,690 4,321 1,909 3,333 7,190 11,225 3% of estimated Income Rupiah/month/hhd 9,626 16,129 10,759 12,303 11,450 24,406 30,590 13,227 12,305 3% of estimated Expenditure Rupiah/month/hhd 18,352 25,408 18,809 28,166 19,455 33,401 42,886 14,736 17,942 Boil water before drinking Yes % 20% 60% 52% 35% 35% 72% 84% 56% 100%
PT:Public Tap HC:House Connection
A5.4-7

Appendix-5.5
Distribution Network Analysis

KURANJI(Hourly Maximum)
Q=2.71L=300φ100
(1)
(2)
(3)
(4)(5) (6) (7)
(8)
(9)
(10)
(11)
(12)
(13)
(14)
(15)
(16)
(17)
(18)(19)
(20)
(21)
(22)
(23)
0.15 l/s
0.17 l/s
0.21 l/s0.12 l/s
0.17 l/s
0.30 l/s
0.15 l/s
0.07 l/s
0.03 l/s
0.13 l/s
0.11 l/s
0.23 l/s
0.20 l/s
0.07 l/s
0.14 l/s
0.09 l/s
0.17 l/s
0.20 l/s
Q=2.50L=45φ100
Q=0.15L=80φ25
Q=0.44L=40φ30Q=0.17
L=140φ25
Q=0.32L=75φ30
Q=0.15L=40φ25
Q=0.17L=40φ25
GH+4.0(12.5)
GH+4.0(11.7)
GH+4.0(13.1)
GH+4.0(15.4)
Q=0.76L=75φ40
GH+4.0(14.1)
GH+4.0(15.3)
GH+4.0(13.1)
GH+4.0(12.8)
GH+4.0(12.7)
Q=1.74L=150φ75
Q=0.07L=80φ25
GH+3.5(15.1)
Q=1.37L=120φ75
Q=1.34L=230φ75
GH+4.0(14.8)
GH+5.0(13.5)
GH+5.0(12.5)
Q=0.13L=80φ25
GH+5.0(13.0)
Q=1.10L=190φ75
GH+5.5(12.2)
Q=0.17L=90φ30
Q=0.26L=70φ30
Q=0.40L=50φ40
Q=0.63L=120φ50
Q=0.43L=100φ40
Q=0.23L=70φ40
GH+5.0(11.3)
GH+5.5(11.2)
GH+6.0(11.3)
GH+5.5(12.1)
GH+5.5(11.6)
GH+5.0(11.5)
GH+5.0(11.4)
φ200 PDAM(Existing Pipe)P=1.5kgf/cm2
Q=1.03L=80φ75
Legend
:Supply Volume(l/s)
Elevation (m)Effective WaterHead (m)
Q:Discharge (l/s)
L:Length (m)
φ:Diameter (mm)

Project: RURAL WATER SUPPLY IN NUSA TENGGARA BARAT AND NUSA TENGGARA TIMURSite: NTB 1 KuranjiRoute: Distribution Pipeline HYDRAULIC CALCULATION Hazen-Williams' formulaCase: Hourly Maximum
d (mm) C q (L/s) Q (L/s) L (m) V (m/s) I(‰) ⊿h(m) H (m) h(m) he (m) NotePDAM Distribution Pipe 20.0 GL(5.0+1.5kg/cm
2)
1 - 2 100 120 0.21 2.71 300 0.345 2.0 0.6 19.4 4.0 15.42 - 3 100 120 0.00 2.50 45 0.318 1.7 0.1 19.3 4.0 15.33 - 4 75 120 0.30 1.74 150 0.394 3.6 0.5 18.8 4.0 14.84 - 5 75 120 0.03 1.37 120 0.310 2.3 0.3 18.5 5.0 13.55 - 6 75 120 0.11 1.34 230 0.303 2.2 0.5 18.0 5.0 13.06 - 7 75 120 0.07 1.10 190 0.249 1.5 0.3 17.7 5.5 12.27 - 8 75 120 0.00 1.03 80 0.233 1.4 0.1 17.6 5.5 12.18 - 9 50 120 0.20 0.63 120 0.321 3.9 0.5 17.1 5.5 11.69 - 10 40 120 0.20 0.43 100 0.342 5.8 0.6 16.5 5.0 11.5
10 11 40 120 0.23 0.23 70 0.183 1.8 0.1 16.4 5.0 11.4
8 - 12 40 120 0.14 0.40 50 0.318 5.1 0.3 17.3 6.0 11.312 - 13 30 120 0.09 0.26 70 0.368 9.2 0.6 16.7 5.5 11.213 - 14 30 120 0.17 0.17 90 0.241 4.2 0.4 16.3 5.0 11.3
6 - 15 25 120 0.13 0.13 80 0.265 6.2 0.5 17.5 5.0 12.5
4 - 16 25 120 0.07 0.07 80 0.143 2.0 0.2 18.6 3.5 15.1
3 - 17 40 120 0.00 0.76 75 0.605 16.6 1.2 18.1 4.0 14.117 - 18 30 120 0.00 0.32 75 0.453 13.6 1.0 17.1 4.0 13.118 19 25 120 0.17 0.17 40 0.346 10.2 0.4 16.7 4.0 12.7
18 - 20 25 120 0.15 0.15 250 0.306 8.1 2.0 15.1 4.0 11.1
17 - 21 30 120 0.12 0.44 40 0.622 24.5 1.0 17.1 4.0 13.121 - 22 25 120 0.15 0.15 80 0.306 8.1 0.6 16.5 4.0 12.5
21 - 23 25 120 0.17 0.17 140 0.346 10.2 1.4 15.7 4.0 11.7
Remarks:d : Pipe diameter I : Hydraulic gradientC : Flow velocity coefficient ⊿h : Loss headq : Discharge H : Dynamic water levelQ : Flow rate h : Ground elevationL : Length of pipeline he : Effective headV : Velocity
Node No.
(Hourly Maximum)
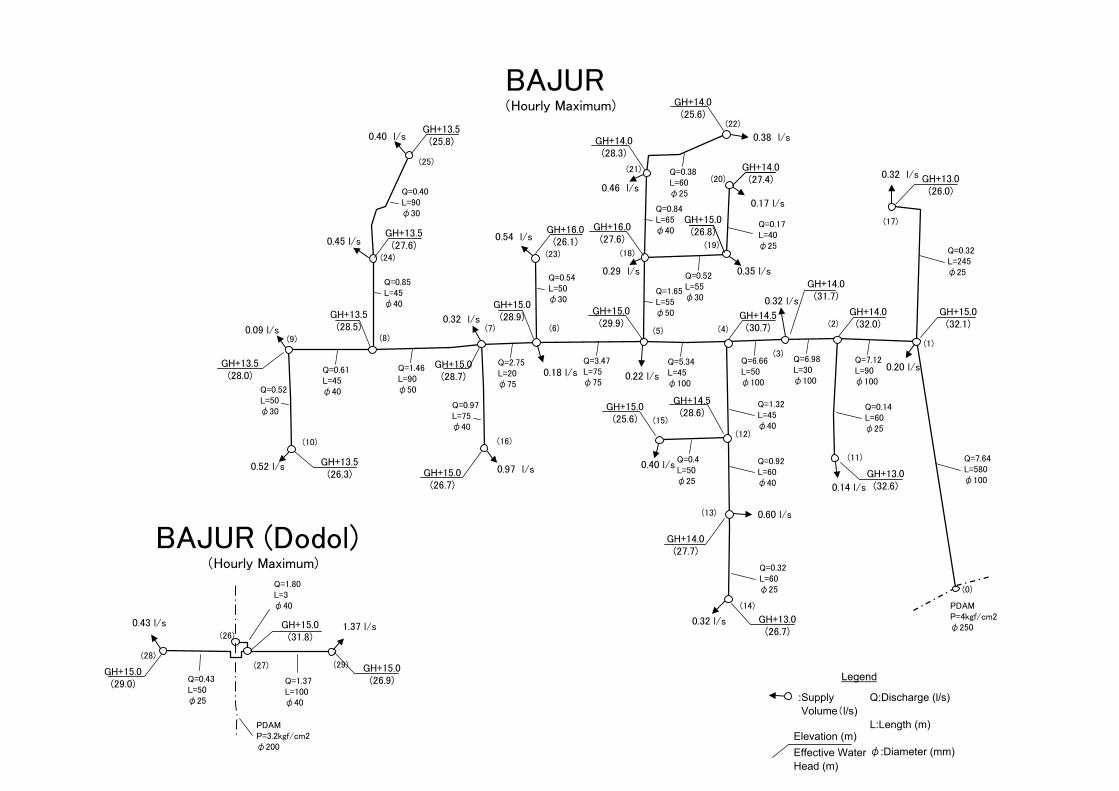
BAJUR (Hourly Maximum)
BAJUR (Dodol)
(1)
(2)
(11)
(10)
(3)
(4)
(12)
(13)
(5)
(14)
(15)
(6)(7)
(16)
(8)
(17)
(9)
(18)
(0)
(19)
(20)(21)
(22)
(23)(24)
(25)
(26)
(27)(28)
(29)
GH+15.0(28.7)
0.52 l/s
0.45 l/s
0.97 l/s
0.09 l/s0.32 l/s
0.54 l/s
0.18 l/s
0.40 l/s
0.29 l/s 0.35 l/s
0.17 l/s
0.38 l/s
0.46 l/s
0.32 l/s
0.20 l/s
0.32 l/s
0.32 l/s
0.60 l/s
0.14 l/s
0.40 l/s
1.37 l/s 0.43 l/s
Q=1.37L=100φ40
Q=0.43L=50φ25
Q=1.80L=3φ40
Q=7.64L=580φ100
PDAMP=4kgf/cm2φ250
GH+15.0(32.1)
GH+13.0(26.0)
GH+14.0(32.0)
Q=0.32L=245φ25
Q=0.14L=60φ25
Q=7.12L=90φ100
Q=6.98L=30φ100
Q=6.66L=50φ100
GH+14.0(31.7)
Q=1.32L=45φ40
Q=0.92L=60φ40
Q=0.32L=60φ25
Q=5.34L=45φ100
Q=2.75L=20φ75
Q=0.4L=50φ25
GH+13.0(32.6)
GH+13.0(26.7)
GH+14.0(27.7)
GH+14.5(28.6)
GH+15.0(25.6)
GH+14.5(30.7)
Q=0.17L=40φ25
Q=0.52L=55φ30
GH+14.0(27.4)
GH+15.0(26.8)GH+16.0
(27.6)
GH+14.0(28.3)
GH+15.0(29.9)
GH+14.0(25.6)
Q=0.38L=60φ25
Q=0.84L=65φ40
Q=1.65L=55φ50
Q=3.47L=75φ75
Q=0.54L=50φ30
GH+15.0(28.9)
GH+16.0(26.1)
Q=1.46L=90φ50
Q=0.97L=75φ40
GH+15.0(26.7)
GH+13.5(28.5)
Q=0.61L=45φ40Q=0.52
L=50φ30
GH+13.5(28.0)
GH+13.5(26.3)
Q=0.85L=45φ40
Q=0.40L=90φ30
GH+13.5(25.8)
GH+13.5(27.6)
PDAMP=3.2kgf/cm2φ200
GH+15.0(26.9)
GH+15.0(29.0)
GH+15.0(31.8)
0.22 l/s
Legend
:Supply Volume(l/s)
Elevation (m)Effective WaterHead (m)
Q:Discharge (l/s)
L:Length (m)
φ:Diameter (mm)

Project: RURAL WATER SUPPLY IN NUSA TENGGARA BARAT AND NUSA TENGGARA TIMURSite: NTB 2.1 BajurRoute: Distribution Pipeline HYDRAULIC CALCULATION Hazen-Williams' formulaCase: Hourly Maximum
d (mm) C q (L/s) Q (L/s) L (m) V (m/s) I(‰) ⊿h(m) H (m) h(m) he (m) NotePDAM Distribution Pipe 55.0 GL..15m+4.0kg/cm
2
0 - 1 100 120 0.20 7.64 580 0.973 13.7 7.9 47.1 15.0 32.11 - 2 100 120 0.00 7.12 90 0.907 12.0 1.1 46.0 14.0 32.02 - 3 100 120 0.32 6.98 30 0.889 11.6 0.3 45.7 14.0 31.73 - 4 100 120 0.00 6.66 50 0.848 10.6 0.5 45.2 14.5 30.74 - 5 100 120 0.22 5.34 45 0.680 7.0 0.3 44.9 15.0 29.95 - 6 75 120 0.18 3.47 75 0.785 12.9 1.0 43.9 15.0 28.96 - 7 75 120 0.32 2.75 20 0.622 8.4 0.2 43.7 15.0 28.77 - 8 50 120 0.00 1.46 90 0.744 18.7 1.7 42.0 13.5 28.58 - 9 40 120 0.09 0.61 45 0.485 11.0 0.5 41.5 13.5 28.09 - 10 30 120 0.52 0.52 50 0.736 33.3 1.7 39.8 13.5 26.3
2 11 25 120 0.14 0.14 60 0.285 7.1 0.4 45.6 13.0 32.6
4 - 12 40 120 0.00 1.32 45 1.050 46.0 2.1 43.1 14.5 28.612 - 13 40 120 0.60 0.92 60 0.732 23.6 1.4 41.7 14.0 27.713 - 14 25 120 0.32 0.32 60 0.652 33.0 2.0 39.7 13.0 26.7
12 - 15 25 120 0.40 0.40 50 0.815 49.8 2.5 40.6 15.0 25.6
7 - 16 40 120 0.97 0.97 75 0.772 26.0 2.0 41.7 15.0 26.7
1 - 17 25 120 0.32 0.32 245 0.652 33.0 8.1 39.0 13.0 26.0250
5 - 18 50 120 0.29 1.65 55 0.840 23.4 1.3 43.6 16.0 27.618 - 19 30 120 0.35 0.52 55 0.736 33.3 1.8 41.8 15.0 26.819 - 20 25 120 0.17 0.17 40 0.346 10.2 0.4 41.4 14.0 27.4
18 - 21 40 120 0.46 0.84 65 0.668 19.9 1.3 42.3 14.0 28.321 - 22 25 120 0.38 0.38 60 0.774 45.3 2.7 39.6 14.0 25.6
6 - 23 30 120 0.54 0.54 50 0.764 35.7 1.8 42.1 16.0 26.1
8 - 24 40 120 0.45 0.85 45 0.676 20.4 0.9 41.1 13.5 27.624 - 25 30 120 0.40 0.40 90 0.566 20.5 1.8 39.3 13.5 25.8
Remarks:d : Pipe diameter I : Hydraulic gradientC : Flow velocity coefficient ⊿h : Loss headq : Discharge H : Dynamic water levelQ : Flow rate h : Ground elevationL : Length of pipeline he : Effective headV : Velocity
Node No.

Project: RURAL WATER SUPPLY IN NUSA TENGGARA BARAT AND NUSA TENGGARA TIMURSite: NTB 2.2 Bajur(Dodol)Route: Distribution Pipeline HYDRAULIC CALCULATION Hazen-Williams' formulaCase: Hourly Maximum
d (mm) C q (L/s) Q (L/s) L (m) V (m/s) I(‰) ⊿h(m) H (m) h(m) he (m) NotePDAM Distribution Pipe 32.0 GL+3.2kg/cm
2
26 - 27 40 120 0.00 1.80 3 1.432 81.6 0.2 31.8 0.0 31.827 - 28 25 120 0.43 0.43 50 0.876 56.9 2.8 29.0 0.0 29.0
27 - 29 40 120 1.37 1.37 100 1.090 49.3 4.9 26.9 0.0 26.9
Remarks:d : Pipe diameter I : Hydraulic gradientC : Flow velocity coefficient ⊿h : Loss headq : Discharge H : Dynamic water levelQ : Flow rate h : Ground elevationL : Length of pipeline he : Effective headV : Velocity
Node No.

(1/6)
KUBUN BARU(Hourly Maximum) DUMAN UPPER
▽LWL=+400.0
(1)
(2)
(3)
(4)
GH+395(4.8)
GH+385(14.4)
GH+390(8.8)
0.19 l/s
0.19 l/s
0.20 l/s
Q=0.58L=50φ50
Q=0.39L=80φ40
Q=0.20L=110φ30
GH+398
Legend
:Supply Volume(l/s)
Elevation (m)Effective WaterHead (m)
Q:Discharge (l/s)
L:Length (m)
φ:Diameter (mm)

Project: RURAL WATER SUPPLY IN NUSA TENGGARA BARAT AND NUSA TENGGARA TIMURSite: NTB 4.1 Kubun BaruRoute: Distribution Pipeline HYDRAULIC CALCULATION Hazen-Williams' formulaCase: Hourly Maximum
d (mm) C q (L/s) Q (L/s) L (m) V (m/s) I(‰) ⊿h(m) H (m) h(m) he (m) Note400.0 398.0
1 - 2 50 120 0.19 0.58 50 0.295 3.4 0.2 399.8 395.0 4.82 - 3 40 120 0.19 0.39 80 0.310 4.8 0.4 399.4 385.0 14.43 - 4 30 120 0.20 0.20 110 0.283 5.7 0.6 398.8 390.0 8.8
Remarks:d : Pipe diameter I : Hydraulic gradientC : Flow velocity coefficient ⊿h : Loss headq : Discharge H : Dynamic water levelQ : Flow rate h : Ground elevationL : Length of pipeline he : 250V : Velocity
Node No.

(2/6)
AWANG MADYA(Hourly Maximum) DUMAN UPPER
▽
▽LWL=+363.0
(1)
(2)
(3)
(4)
(5)
(6)
(7)
(8)
(9)(10)(11)(12)
0.076 l/s
0.076 l/s
0.076 l/s
0.076 l/s
0.076 l/s
0.076 l/s
0.076 l/s0.076 l/s0.08 l/s 0.076 l/s
Q=0.84L=50φ40
Q=0.764L=120φ40
Q=0.688L=200φ30
Q=0.612L=120φ25
Q=0.612L=110φ40
Q=0.536L=210φ25
Q=0.384L=90φ25
Q=0.308L=45φ25
Q=0.232L=80φ25
Q=0.156L=140φ25
Q=0.08L=130φ25
B.P.T.
GH+355(7.0)
GH+341(19.0)
GH+330(18.8)
GH+320(15.7)
GH+310(8.8)
GH+290(10.8)
GH+277(19.6)
GH+282(13.2)
GH+278(15.7)
GH+270(22.5)
GH+265(27.2)
0.076 l/s
Legend
:Supply Volume(l/s)
Elevation (m)Effective WaterHead (m)
Q:Discharge (l/s)
L:Length (m)
φ:Diameter (mm)

Project: RURAL WATER SUPPLY IN NUSA TENGGARA BARAT AND NUSA TENGGARA TIMURSite: NTB 4.2 Awang MadyaRoute: Distribution Pipeline HYDRAULIC CALCULATION Hazen-Williams' formulaCase: Hourly Maximum
d (mm) C q (L/s) Q (L/s) L (m) V (m/s) I(‰) ⊿h(m) H (m) h(m) he (m) Note363.0 398.0
1 - 2 40 120 0.076 0.840 50 0.668 19.9 1.0 362.0 355.0 7.02 - 3 40 120 0.076 0.764 120 0.608 16.7 2.0 360.0 341.0 19.03 - 4 30 120 0.076 0.688 200 0.973 55.9 11.2 348.8 330.0 18.84 - 5 25 120 0.000 0.612 120 1.247 109.4 13.1 335.7 320.0 15.7 BPT
320.0 BPT5 - 6 40 120 0.076 0.612 110 0.487 11.1 1.2 318.8 310.0 8.86 - 7 25 120 0.152 0.536 210 1.092 85.6 18.0 300.8 290.0 10.87 - 8 25 120 0.076 0.384 90 0.782 46.2 4.2 296.6 277.0 19.68 - 9 25 120 0.076 0.308 45 0.627 30.7 1.4 295.2 282.0 13.29 - 10 25 120 0.076 0.232 80 0.473 18.2 1.5 293.7 278.0 15.7
10 - 11 25 120 0.076 0.156 140 0.318 8.7 1.2 292.5 270.0 22.511 - 12 25 120 0.080 0.080 130 0.163 2.5 0.3 292.2 265.0 27.2
Remarks:d : Pipe diameter I : Hydraulic gradientC : Flow velocity coefficient ⊿h : Loss headq : Discharge H : Dynamic water levelQ : Flow rate h : Ground elevationL : Length of pipeline he : Effective headV : Velocity
Node No.
(4/6)
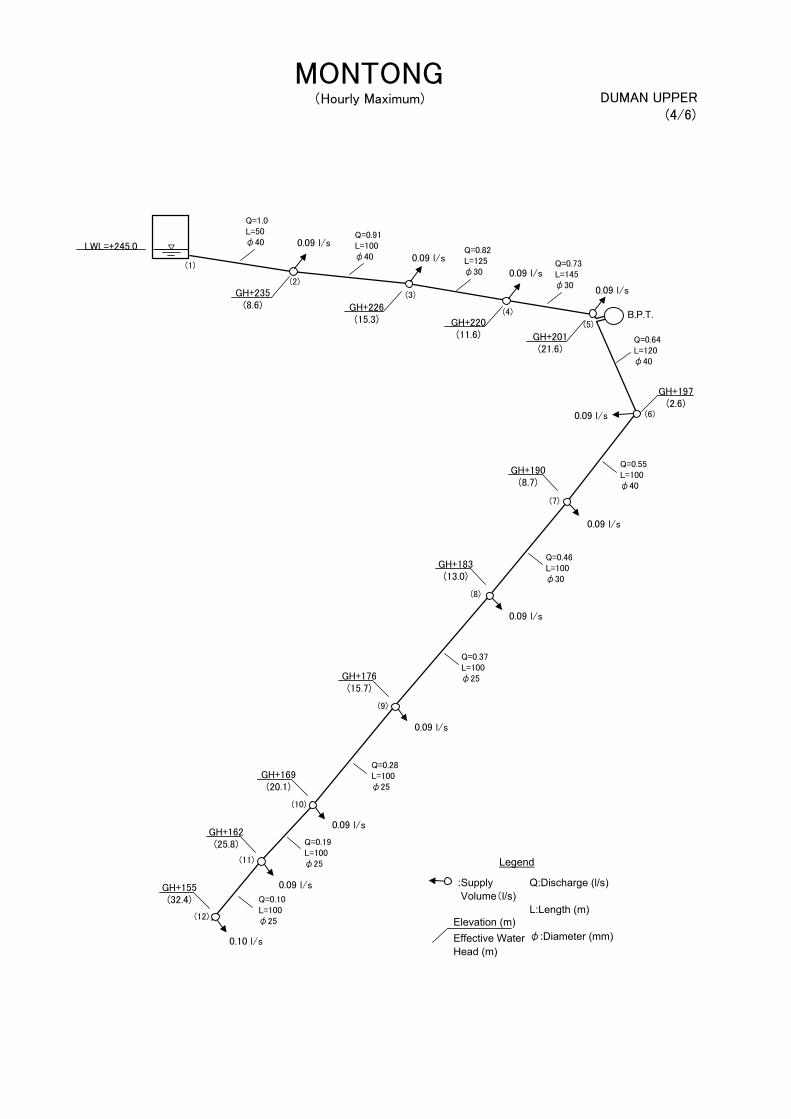
MONTONG(Hourly Maximum) DUMAN UPPER
▽LWL=+245.0
(1)
(2)
(3)
(4)
(5)
(6)
(7)
(8)
(9)
(10)
(11)
(12)
B.P.T.
0.09 l/s
0.09 l/s
0.09 l/s
0.09 l/s
0.09 l/s
0.09 l/s
0.09 l/s
0.09 l/s
0.09 l/s
0.10 l/s
Q=0.91L=100φ40
Q=1.0L=50φ40
Q=0.82L=125φ30
Q=0.73L=145φ30
Q=0.64L=120φ40
Q=0.55L=100φ40
Q=0.46L=100φ30
Q=0.37L=100φ25
Q=0.28L=100φ25
Q=0.19L=100φ25
Q=0.10L=100φ25
GH+226(15.3)
GH+235(8.6)
GH+220(11.6) GH+201
(21.6)
GH+197(2.6)
GH+190(8.7)
GH+183(13.0)
GH+176(15.7)
GH+169(20.1)
GH+162(25.8)
GH+155(32.4)
0.09 l/s
Legend
:Supply Volume(l/s)
Elevation (m)Effective WaterHead (m)
Q:Discharge (l/s)
L:Length (m)
φ:Diameter (mm)

Project: RURAL WATER SUPPLY IN NUSA TENGGARA BARAT AND NUSA TENGGARA TIMURSite: NTB 4.3 MontongRoute: Distribution Pipeline HYDRAULIC CALCULATION Hazen-Williams' formulaCase: Hourly Maximum
d (mm) C q (L/s) Q (L/s) L (m) V (m/s) I(‰) ⊿h(m) H (m) h(m) he (m) Note245.0 245.0
1 - 2 40 120 0.090 1.000 50 0.796 27.5 1.4 243.6 235.0 8.62 - 3 40 120 0.090 0.910 100 0.724 23.1 2.3 241.3 226.0 15.33 - 4 30 120 0.090 0.820 125 1.160 77.4 9.7 231.6 220.0 11.64 - 5 30 120 0.090 0.730 145 1.033 62.4 9.0 222.6 201.0 21.6 BPT
201.0 201.0 BPT5 - 6 40 120 0.090 0.640 120 0.509 12.0 1.4 199.6 197.0 2.66 - 7 40 120 0.090 0.550 100 0.438 9.1 0.9 198.7 190.0 8.77 - 8 30 120 0.090 0.460 100 0.651 26.5 2.7 196.0 183.0 13.08 - 9 25 120 0.090 0.370 100 0.754 43.1 4.3 191.7 176.0 15.79 - 10 25 120 0.090 0.280 100 0.570 25.8 2.6 189.1 169.0 20.1
10 - 11 25 120 0.090 0.190 100 0.387 12.6 1.3 187.8 162.0 25.811 - 12 25 120 0.100 0.100 100 0.204 3.8 0.4 187.4 155.0 32.4
Remarks:d : Pipe diameter I : Hydraulic gradientC : Flow velocity coefficient ⊿h : Loss headq : Discharge H : Dynamic water levelQ : Flow rate h : Ground elevationL : Length of pipeline he : Effective headV : Velocity
Node No.

(3/6)
LEONG(Hourly Maximum) DUMAN UPPER
▽LWL=+254.0
(1)
(2)
(3)
(4)
(5)
(6)
(7)(8)
(9)
(10)
(11)
(12)
B.P.T.
0.06 l/s
0.08 l/s
0.07 l/s
0.07 l/s
0.08 l/s
0.08 l/s
0.08 l/s
0.08 l/s
0.08 l/s0.08 l/s
0.08 l/s
Q=0.84L=230φ50
Q=0.78L=150φ40
Q=0.71L=150φ30
Q=0.64L=70φ40
Q=0.40L=90φ30
Q=0.32L=110φ25
Q=0.16L=50φ30
Q=0.08L=130φ25
Q=0.08L=100φ25
Q=0.16L=120φ25
Q=0.08L=130φ25
GH+245(7.5)
GH+236(13.9)
GH+223(18.0)
GH+217(5.2)
GH+217(5.0)
GH+204(17.7)
GH+203(17.4)
GH+198(18.8)
GH+198(17.7)
GH+196(19.4)
GH+197(19.5)
Legend
:Supply Volume(l/s)
Elevation (m)Effective WaterHead (m)
Q:Discharge (l/s)
L:Length (m)
φ:Diameter (mm)

Project: RURAL WATER SUPPLY IN NUSA TENGGARA BARAT AND NUSA TENGGARA TIMURSite: NTB 4.4 LeongRoute: Distribution Pipeline HYDRAULIC CALCULATION Hazen-Williams' formulaCase: Hourly Maximum
d (mm) C q (L/s) Q (L/s) L (m) V (m/s) I(‰) ⊿h(m) H (m) h(m) he (m) Note254.0 254.0
1 - 2 50 120 0.060 0.840 230 0.428 6.7 1.5 252.5 245.0 7.52 - 3 40 120 0.070 0.780 150 0.621 17.4 2.6 249.9 236.0 13.93 - 4 30 120 0.070 0.710 150 1.004 59.3 8.9 241.0 223.0 18.0 BPT
223.04 - 5 40 120 0.080 0.640 70 0.509 12.0 0.8 222.2 217.0 5.2 BPT5 - 6 30 120 0.080 0.400 90 0.566 20.5 1.8 220.4 203.0 17.46 - 7 25 120 0.080 0.320 110 0.652 33.0 3.6 216.8 198.0 18.87 - 8 25 120 0.080 0.160 120 0.326 9.1 1.1 215.7 198.0 17.78 - 9 25 120 0.080 0.080 100 0.163 2.5 0.3 215.4 196.0 19.45 - 10 30 120 0.080 0.160 50 0.226 3.8 0.2 222.0 217.0 5.0
10 - 11 25 120 0.080 0.080 130 0.163 2.5 0.3 221.7 204.0 17.77 - 12 25 120 0.080 0.080 130 0.163 2.5 0.3 216.5 197.0 19.5
Remarks:d : Pipe diameter I : Hydraulic gradientC : Flow velocity coefficient ⊿h : Loss headq : Discharge H : Dynamic water levelQ : Flow rate h : Ground elevationL : Length of pipeline he : Effective headV : Velocity
Node No.

(5/6)
DUMAN UTARA(Hourly Maximum) DUMAN UPPER
▽
0.08 l/s
0.10 l/s
0.10 l/s
0.10 l/s
0.10 l/s
0.10 l/s
LWL=+215.0
0.10 l/s0.10 l/s
(1)
(2)
(3)
(4)
(5)
(6)
(7)
(8)
(9)(10)
Q=0.78L=180φ40
Q=0.70L=125φ40
Q=0.60L=175φ30
Q=0.50L=115φ25
Q=0.40L=60φ25
Q=0.40L=45φ40
Q=0.30L=100φ40
Q=0.20L=350φ25
Q=0.10L=100φ25
B.P.T.
GH+204(7.9)
GH+200(10.1)
GH+180(22.5)
GH+180(13.8)
GH+175(15.8)
GH+170(4.8)
GH+165(9.5)
GH+134(35.7)
GH+133(36.3)
Legend
:Supply Volume(l/s)
Elevation (m)Effective WaterHead (m)
Q:Discharge (l/s)
L:Length (m)
φ:Diameter (mm)

Project: RURAL WATER SUPPLY IN NUSA TENGGARA BARAT AND NUSA TENGGARA TIMURSite: NTB 4.5 Duman UtaraRoute: Distribution Pipeline HYDRAULIC CALCULATION Hazen-Williams' formulaCase: Hourly Maximum
d (mm) C q (L/s) Q (L/s) L (m) V (m/s) I(‰) ⊿h(m) H (m) h(m) he (m) Note215.0 215.0
1 - 2 40 120 0.080 0.780 180 0.621 17.4 3.1 211.9 204.0 7.92 - 3 40 120 0.100 0.700 125 0.557 14.2 1.8 210.1 200.0 10.13 - 4 30 120 0.100 0.600 175 0.849 43.4 7.6 202.5 180.0 22.54 - 5 25 120 0.100 0.500 115 1.019 75.3 8.7 193.8 180.0 13.85 - 6 25 120 0.000 0.400 60 0.815 49.8 3.0 190.8 175.0 15.8 BPT
175.0 175.0 0.0 BPT6 - 7 40 120 0.100 0.400 45 0.318 5.1 0.2 174.8 170.0 4.87 - 8 40 120 0.100 0.300 100 0.239 3.0 0.3 174.5 165.0 9.58 - 9 25 120 0.100 0.200 350 0.407 13.8 4.8 169.7 134.0 35.75 - 10 25 120 0.100 0.100 100 0.204 3.8 0.4 169.3 133.0 36.3
Remarks:d : Pipe diameter I : Hydraulic gradientC : Flow velocity coefficient ⊿h : Loss headq : Discharge H : Dynamic water levelQ : Flow rate h : Ground elevationL : Length of pipeline he : Effective headV : Velocity
Node No.

(6/6)
DUMAN DASAN, SERAYA DUMAN(Hourly Maximum) DUMAN UPPER
▽
(1)
(2)
(3)
(4)
(5)
(6)
(7)
(8)
(9)
(10)
(11)
(12) (13)
LWL=+120.0
0.16 l/s
0.18 l/s
0.16 l/s
0.08 l/s
0.08 l/s0.16 l/s
0.08 l/s
0.08 l/s 0.08 l/s
0.08 l/s0.08 l/s
GH+97(17.4)
GH+100(15.6)
GH+108(7.5)
GH+101(13.0)
GH+95(16.4)GH+92
(19.9)
GH+86(22.6)
GH+86(22.4)
GH+86(22.1)
GH+84(24.4)
GH+74(35.9)
GH+81(29.2)
Q=1.22L=330φ50
Q=0.50L=40φ30
Q=0.32L=75φ25
Q=0.16L=190φ25
Q=0.08L=100φ25
Q=0.08L=90φ25
Q=0.24L=145φ25
Q=0.32L=80φ25
Q=0.56L=40φ50
Q=0.40L=300φ40
Q=0.16L=20φ25
Q=0.08L=100φ25
Legend
:Supply Volume(l/s)
Elevation (m)Effective WaterHead (m)
Q:Discharge (l/s)
L:Length (m)
φ:Diameter (mm)

Project: RURAL WATER SUPPLY IN NUSA TENGGARA BARAT AND NUSA TENGGARA TIMURSite: NTB 4.6Duman Dasan & Seraya DumanRoute: Distribution Pipeline HYDRAULIC CALCULATION Hazen-Williams' formulaCase: Hourly Maximum
d (mm) C q (L/s) Q (L/s) L (m) V (m/s) I(‰) ⊿h(m) H (m) h(m) he (m) Note120.0 120.0
1 - 2 50 120 0.160 1.220 330 0.621 13.4 4.4 115.6 100.0 15.62 - 3 30 120 0.180 0.500 40 0.707 31.0 1.2 114.4 97.0 17.43 - 4 25 120 0.160 0.320 75 0.652 33.0 2.5 111.9 92.0 19.94 - 5 25 120 0.080 0.160 190 0.326 9.1 1.7 110.2 81.0 29.25 - 6 25 120 0.080 0.080 100 0.163 2.5 0.3 109.9 74.0 35.92 - 7 50 120 0.160 0.560 40 0.285 3.2 0.1 115.5 108.0 7.57 - 8 40 120 0.080 0.400 300 0.318 5.1 1.5 114.0 101.0 13.08 - 9 25 120 0.080 0.320 80 0.652 33.0 2.6 111.4 95.0 16.49 - 10 25 120 0.000 0.240 145 0.489 19.4 2.8 108.6 86.0 22.6
10 - 11 25 120 0.080 0.080 90 0.163 2.5 0.2 108.4 84.0 24.410 - 12 25 120 0.080 0.160 20 0.326 9.1 0.2 108.4 86.0 22.412 - 13 25 120 0.080 0.080 100 0.163 2.5 0.3 108.1 86.0 22.1
Remarks:d : Pipe diameter I : Hydraulic gradientC : Flow velocity coefficient ⊿h : Loss headq : Discharge H : Dynamic water levelQ : Flow rate h : Ground elevationL : Length of pipeline he : Effective headV : Velocity
Node No.

DUMAN LOWER(Hourly Maximum)
(19)
(5)
(22)(20) (21)(6)
(23) (8)
(7)
(9) (10)
(4)
(17)
(18)
(3)
(16)
(2)
(14)(11)
(12)
(15)
(13)
0.03 l/s
0.05 l/s
0.03 l/s
0.08 l/s
0.03 l/s 0.07 l/s 0.03 l/s0.05 l/s
0.08 l/s 0.03 l/s
0.05 l/s
0.07 l/s
0.05 l/s
0.06 l/s
0.06 l/s
0.05 l/s
0.29 l/s
0.10 l/s
0.14 l/s 0.11 l/s
GH+61.0(10.8)
Q=0.03L=220φ25 GH+59.0
(12.9)
GH+58.5(13.2)
Q=0.03L=40φ25
Q=0.03L=40φ25
GH+58.0(13.3)
Q=0.45L=100φ50
GH+59.0(12.7)
GH+58.5(13.1)
Q=0.27L=50φ40
Q=0.22L=40φ30
Q=0.10L=90φ25
Q=0.03L=50φ25
GH+59.0(12.4)
GH+58.0(13.4)
GH+58.0(13.3)
GH+57.0(13.9)
GH+57.0(13.9)
Q=0.11L=90φ25
Q=0.03L=40φ25
GH+60.0(12.3)
GH+54.0(18.0)
GH+54.0(17.7)
Q=0.17L=80φ30
Q=0.48L=170φ50
Q=0.10L=90φ25
GH+61.0(11.2)
GH+60.0(12.3)
GH+59.0(13.1)
GH+57.0(14.4)
GH+57.0(13.4)
Q=0.05L=100φ25
Q=0.65L=50φ50
Q=1.46L=1800φ75
Q=0.70L=60φ75
Q=0.54L=80φ40
Q=0.29L=90φ30
Q=0.05L=80φ25
Q=0.11L=70φ25
GH+57.0(15.0)
GH+57.0(14.1)
BUG-BUGRESERVOIR
▽ WL+77
Legend
:Supply Volume(l/s)
Elevation (m)Effective WaterHead (m)
Q:Discharge (l/s)
L:Length (m)
φ:Diameter (mm)

Project: RURAL WATER SUPPLY IN NUSA TENGGARA BARAT AND NUSA TENGGARA TIMURSite: NTB 5 Duman LowerRoute: Distribution Pipeline HYDRAULIC CALCULATION Hazen-Williams' formulaCase: Hourly Maximum
d (mm) C q (L/s) Q (L/s) L (m) V (m/s) I(‰) ⊿h(m) H (m) h(m) he (m) NoteBug-Bug Reservoir Pressure Release Tank 77.0 74.0 3.0 H.W.L..
2 - 3 75 120 0.06 1.46 1800 0.330 2.6 4.7 72.3 60.0 12.33 - 4 75 120 0.05 0.70 60 0.158 0.7 0.0 72.3 60.0 12.34 - 5 50 120 0.00 0.48 170 0.244 2.4 0.4 71.9 59.0 12.95 - 6 50 120 0.05 0.45 100 0.229 2.1 0.2 71.7 59.0 12.76 - 7 40 120 0.05 0.27 50 0.215 2.4 0.1 71.6 58.5 13.17 - 8 30 120 0.08 0.22 40 0.311 6.8 0.3 71.3 58.0 13.38 - 9 25 120 0.08 0.11 90 0.224 4.6 0.4 70.9 57.0 13.99 - 10 25 120 0.03 0.03 40 0.061 0.4 0.0 70.9 57.0 13.9
3 - 11 50 120 0.06 0.65 50 0.331 4.2 0.2 72.1 59.0 13.111 - 12 40 120 0.14 0.54 80 0.430 8.8 0.7 71.4 57.0 14.412 - 13 30 120 0.29 0.29 90 0.410 11.3 1.0 70.4 57.0 13.4
3 - 16 25 120 0.05 0.05 100 0.102 1.1 0.1 72.2 61.0 11.2
4 - 17 30 120 0.07 0.17 80 0.241 4.2 0.3 72.0 54.0 18.017 - 18 25 120 0.10 0.10 90 0.204 3.8 0.3 71.7 54.0 17.7
5 - 19 25 120 0.03 0.03 220 0.061 0.4 0.1 71.8 61.0 10.8
6 - 20 25 120 0.03 0.03 40 0.061 0.4 0.0 71.7 58.5 13.2
6 - 21 25 120 0.07 0.10 250 0.204 3.8 1.0 70.7 59.0 11.721 - 22 25 120 0.03 0.03 50 0.061 0.4 0.0 70.7 58.0 12.7
8 - 23 25 120 0.03 0.03 40 0.061 0.4 0.0 71.3 58.0 13.3
11 - 14 25 120 0.05 0.05 80 0.102 1.1 0.1 72.0 57.0 15.0
12 - 15 25 120 0.11 0.11 70 0.224 4.6 0.3 71.1 57.0 14.1
Remarks:d : Pipe diameter I : Hydraulic gradientC : Flow velocity coefficient ⊿h : Loss headq : Discharge H : Dynamic water levelQ : Flow rate h : Ground elevationL : Length of pipeline he : Effective headV : Velocity
Node No.

(Hourly Maximum)
BAGIKPAPAN (1/2)
(1)
▽ +159.5▽
(2)
(3)
(4)
(5)
(6)
(7)
(8)
(9)
(16)
(17)
(18)
(19)
(20)
0.06 l/s
0.24 l/s
0.18 l/s
0.26 l/s 0.37 l/s
0.26 l/s
0.47 l/s0.22 l/s
0.17 l/s
0.26 l/s
0.05 l/s
Q=4.10L=20φ75
Q=4.04L=60φ75
Q=3.80L=90φ75
Q=3.62L=330φ75
Q=1.36L=650φ75
Q=1.10L=110φ50
Q=0.73L=50φ40
Q=0.47L=110φ30
Q=2.26L=65φ75
Q=2.04L=25φ75
Q=1.87L=60φ75
Q=0.17L=140φ25
Q=1.61L=390φ75
Q=1.56L=460φ75
GH+154(5.1)
GH+151(7.1)
GH+148(8.7)
GH+132(18.6)
GH+132(20.1)
GH+124(25.4)
GH+123(25.6)
GH+129(22.7) GH+121
(24.6)
GH+128(23.6)
GH+125(25.2)
GH+126(25.4)
GH+112(38.2)
Legend
:Supply Volume(l/s)
Elevation (m)Effective WaterHead (m)
Q:Discharge (l/s)
L:Length (m)
φ:Diameter (mm)

BAGIKPAPAN (2/2)(Hourly Maximum)
(9)
(10)
(11)
(12)
(13)
(14)
(15)
(21)
(22)
(23)
(24)
(25)
0.14 l/s
0.14l/s
0.21 l/s
0.12l/s
0.10 l/s0.08 l/s
0.29 l/s
0.14 l/s
0.11l/s
0.09l/s
0.14 l/s
Q=1.56L=460φ75
Q=0.14L=130φ25
Q=0.14L=100φ25
Q=1.13L=100φ50
Q=0.85L=25φ50
Q=0.52L=150φ40
Q=0.12L=130φ25
Q=0.10L=50φ25
Q=0.08L=120φ25
Q=0.14L=80φ25
GH+124(24.9)
GH+121(27.0)
GH+121(26.0)
GH+125(22.7)
GH+126(21.5)
GH+121(25.3)
GH+119(27.1)
GH+123(22.2)
GH+124(21.5)
GH+124.5(20.4)
GH+125(21.8)
Q=0.31L=60φ30
Legend
:Supply Volume(l/s)
Elevation (m)Effective WaterHead (m)
Q:Discharge (l/s)
L:Length (m)
φ:Diameter (mm)
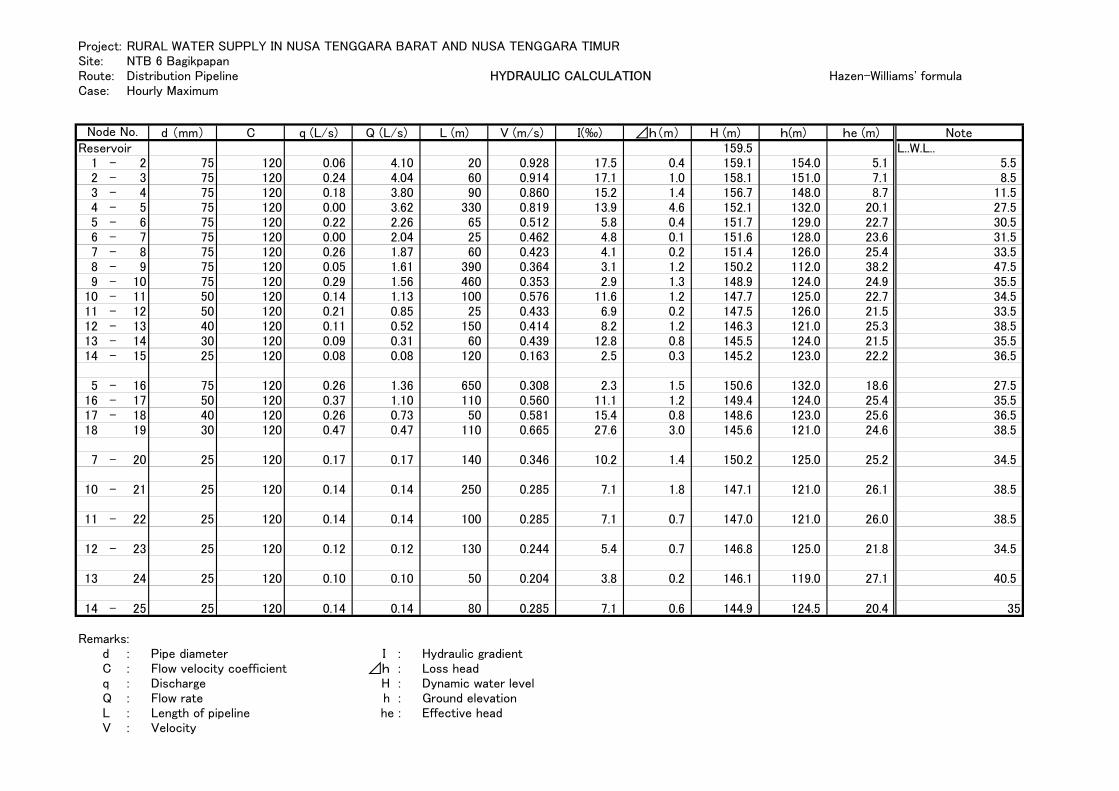
Project: RURAL WATER SUPPLY IN NUSA TENGGARA BARAT AND NUSA TENGGARA TIMURSite: NTB 6 BagikpapanRoute: Distribution Pipeline HYDRAULIC CALCULATION Hazen-Williams' formulaCase: Hourly Maximum
d (mm) C q (L/s) Q (L/s) L (m) V (m/s) I(‰) ⊿h(m) H (m) h(m) he (m) NoteReservoir 159.5 L..W.L..
1 - 2 75 120 0.06 4.10 20 0.928 17.5 0.4 159.1 154.0 5.1 5.52 - 3 75 120 0.24 4.04 60 0.914 17.1 1.0 158.1 151.0 7.1 8.53 - 4 75 120 0.18 3.80 90 0.860 15.2 1.4 156.7 148.0 8.7 11.54 - 5 75 120 0.00 3.62 330 0.819 13.9 4.6 152.1 132.0 20.1 27.55 - 6 75 120 0.22 2.26 65 0.512 5.8 0.4 151.7 129.0 22.7 30.56 - 7 75 120 0.00 2.04 25 0.462 4.8 0.1 151.6 128.0 23.6 31.57 - 8 75 120 0.26 1.87 60 0.423 4.1 0.2 151.4 126.0 25.4 33.58 - 9 75 120 0.05 1.61 390 0.364 3.1 1.2 150.2 112.0 38.2 47.59 - 10 75 120 0.29 1.56 460 0.353 2.9 1.3 148.9 124.0 24.9 35.5
10 - 11 50 120 0.14 1.13 100 0.576 11.6 1.2 147.7 125.0 22.7 34.511 - 12 50 120 0.21 0.85 25 0.433 6.9 0.2 147.5 126.0 21.5 33.512 - 13 40 120 0.11 0.52 150 0.414 8.2 1.2 146.3 121.0 25.3 38.513 - 14 30 120 0.09 0.31 60 0.439 12.8 0.8 145.5 124.0 21.5 35.514 - 15 25 120 0.08 0.08 120 0.163 2.5 0.3 145.2 123.0 22.2 36.5
5 - 16 75 120 0.26 1.36 650 0.308 2.3 1.5 150.6 132.0 18.6 27.516 - 17 50 120 0.37 1.10 110 0.560 11.1 1.2 149.4 124.0 25.4 35.517 - 18 40 120 0.26 0.73 50 0.581 15.4 0.8 148.6 123.0 25.6 36.518 19 30 120 0.47 0.47 110 0.665 27.6 3.0 145.6 121.0 24.6 38.5
7 - 20 25 120 0.17 0.17 140 0.346 10.2 1.4 150.2 125.0 25.2 34.5
10 - 21 25 120 0.14 0.14 250 0.285 7.1 1.8 147.1 121.0 26.1 38.5
11 - 22 25 120 0.14 0.14 100 0.285 7.1 0.7 147.0 121.0 26.0 38.5
12 - 23 25 120 0.12 0.12 130 0.244 5.4 0.7 146.8 125.0 21.8 34.5
13 24 25 120 0.10 0.10 50 0.204 3.8 0.2 146.1 119.0 27.1 40.5
14 - 25 25 120 0.14 0.14 80 0.285 7.1 0.6 144.9 124.5 20.4 35
Remarks:d : Pipe diameter I : Hydraulic gradientC : Flow velocity coefficient ⊿h : Loss headq : Discharge H : Dynamic water levelQ : Flow rate h : Ground elevationL : Length of pipeline he : Effective headV : Velocity
Node No.

Legend
:Supply Volume l/s)
Elevation (m)Effective WaterHead (m)
Q:Discharge (l/s)
L:Length (m)
:Diameter (mm)


Legend
:Supply Volume l/s)
Elevation (m)Effective WaterHead (m)
Q:Discharge (l/s)
L:Length (m)
:Diameter (mm)
