appendix 8 - findings of quanatitative assessment fileappendix 8 - findings of quanatitative...
TRANSCRIPT
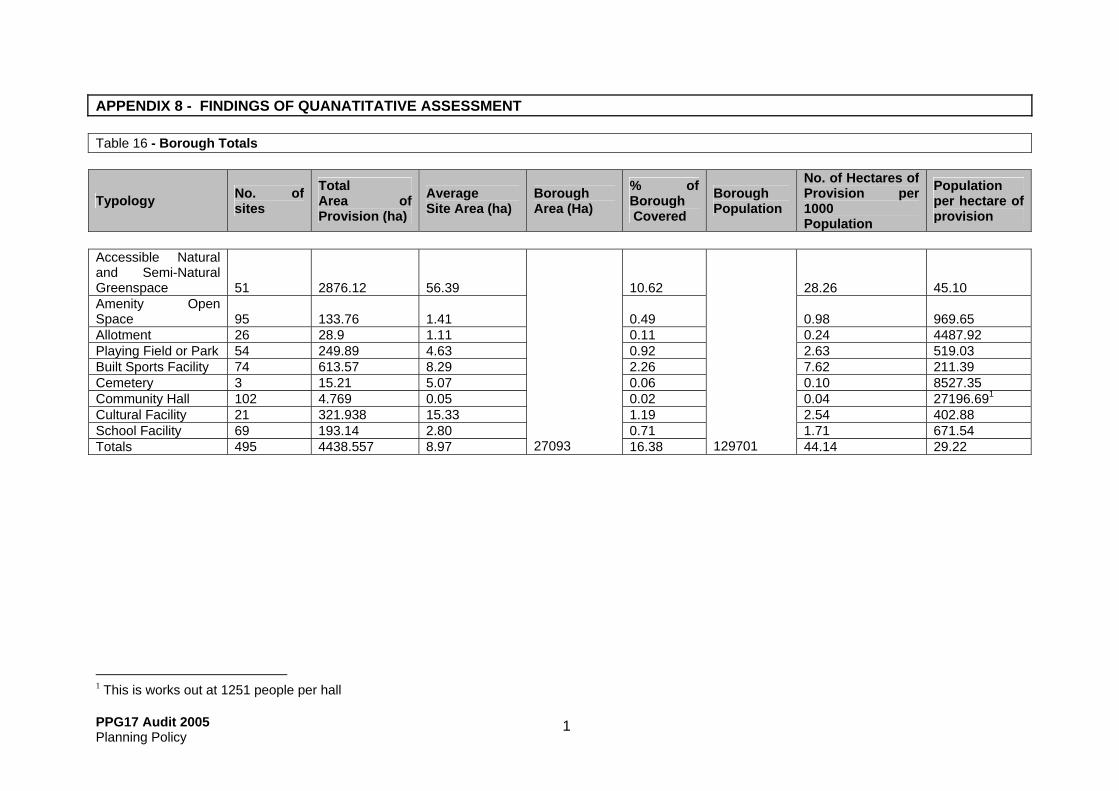
APPENDIX 8 - FINDINGS OF QUANATITATIVE ASSESSMENT Table 16 - Borough Totals
Typology No. of sites
Total Area of Provision (ha)
Average Site Area (ha)
Borough Area (Ha)
% of Borough Covered
Borough Population
No. of Hectares of Provision per 1000 Population
Population per hectare of provision
Accessible Natural and Semi-Natural Greenspace 51 2876.12 56.39 10.62 28.26 45.10Amenity Open Space 95 133.76 1.41 0.49 0.98 969.65Allotment 26 28.9 1.11 0.11 0.24 4487.92Playing Field or Park 54 249.89 4.63 0.92 2.63 519.03 Built Sports Facility 74 613.57 8.29 2.26 7.62 211.39 Cemetery 3 15.21 5.07 0.06 0.10 8527.35 Community Hall 102 4.769 0.05 0.02 0.04 27196.691
Cultural Facility 21 321.938 15.33 1.19 2.54 402.88School Facility 69 193.14 2.80 0.71 1.71 671.54 Totals 495 4438.557 8.97
27093 16.38 129701 44.14 29.22
1 This is works out at 1251 people per hall
PPG17 Audit 2005 Planning Policy
1
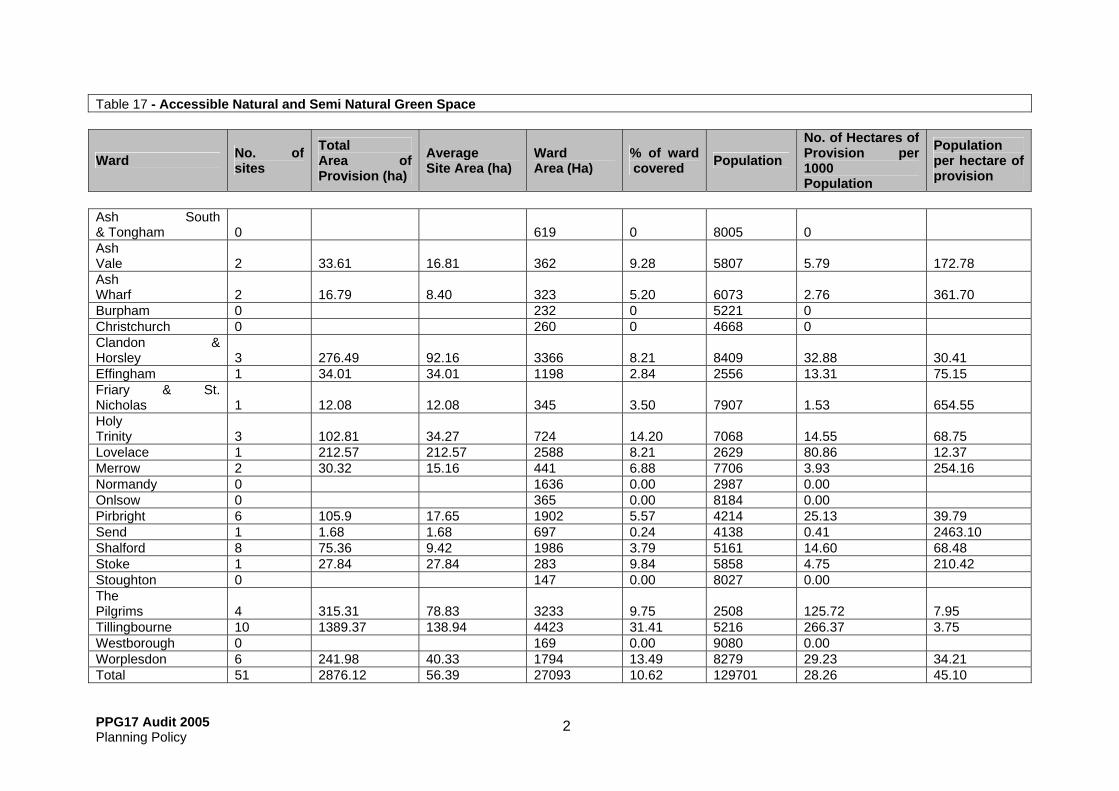
Table 17 - Accessible Natural and Semi Natural Green Space
Ward No. of sites
Total Area of Provision (ha)
Average Site Area (ha)
Ward Area (Ha)
% of ward covered Population
No. of Hectares of Provision per 1000 Population
Population per hectare of provision
Ash South & Tongham 0 619 0 8005 0 Ash Vale 2 33.61 16.81 362 9.28 5807 5.79 172.78Ash Wharf 2 16.79 8.40 323 5.20 6073 2.76 361.70Burpham 0 232 0 5221 0 Christchurch 0 260 0 4668 0 Clandon & Horsley 3 276.49 92.16 3366 8.21 8409 32.88 30.41Effingham 1 34.01 34.01 1198 2.84 2556 13.31 75.15Friary & St. Nicholas 1 12.08 12.08 345 3.50 7907 1.53 654.55Holy Trinity 3 102.81 34.27 724 14.20 7068 14.55 68.75Lovelace 1 212.57 212.57 2588 8.21 2629 80.86 12.37Merrow 2 30.32 15.16 441 6.88 7706 3.93 254.16Normandy 0 1636 0.00 2987 0.00 Onlsow 0 365 0.00 8184 0.00 Pirbright 6 105.9 17.65 1902 5.57 4214 25.13 39.79Send 1 1.68 1.68 697 0.24 4138 0.41 2463.10Shalford 8 75.36 9.42 1986 3.79 5161 14.60 68.48Stoke 1 27.84 27.84 283 9.84 5858 4.75 210.42Stoughton 0 147 0.00 8027 0.00 The Pilgrims 4 315.31 78.83 3233 9.75 2508 125.72 7.95Tillingbourne 10 1389.37 138.94 4423 31.41 5216 266.37 3.75Westborough 0 169 0.00 9080 0.00 Worplesdon 6 241.98 40.33 1794 13.49 8279 29.23 34.21Total 51 2876.12 56.39 27093 10.62 129701 28.26 45.10
PPG17 Audit 2005 Planning Policy
2
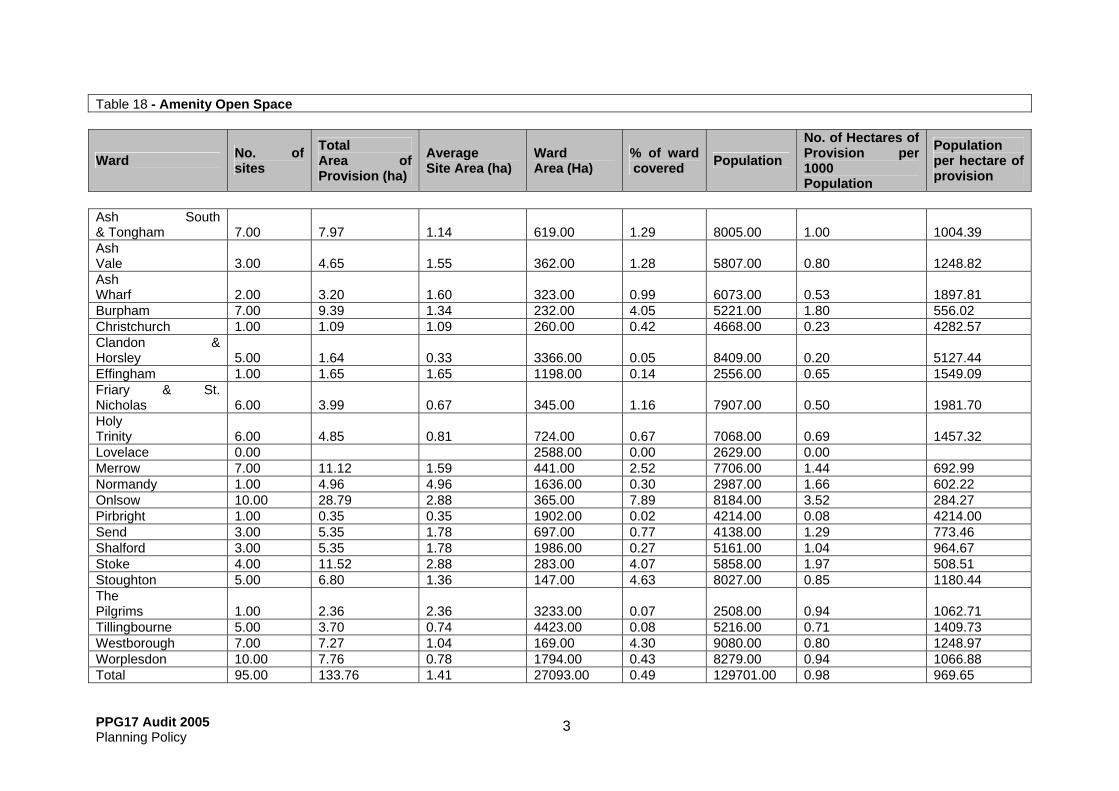
Table 18 - Amenity Open Space
Ward No. of sites
Total Area of Provision (ha)
Average Site Area (ha)
Ward Area (Ha)
% of ward covered Population
No. of Hectares of Provision per 1000 Population
Population per hectare of provision
Ash South & Tongham 7.00 7.97 1.14 619.00 1.29 8005.00 1.00 1004.39Ash Vale 3.00 4.65 1.55 362.00 1.28 5807.00 0.80 1248.82Ash Wharf 2.00 3.20 1.60 323.00 0.99 6073.00 0.53 1897.81Burpham 7.00 9.39 1.34 232.00 4.05 5221.00 1.80 556.02Christchurch 1.00 1.09 1.09 260.00 0.42 4668.00 0.23 4282.57Clandon & Horsley 5.00 1.64 0.33 3366.00 0.05 8409.00 0.20 5127.44Effingham 1.00 1.65 1.65 1198.00 0.14 2556.00 0.65 1549.09Friary & St. Nicholas 6.00 3.99 0.67 345.00 1.16 7907.00 0.50 1981.70Holy Trinity 6.00 4.85 0.81 724.00 0.67 7068.00 0.69 1457.32Lovelace 0.00 2588.00 0.00 2629.00 0.00 Merrow 7.00 11.12 1.59 441.00 2.52 7706.00 1.44 692.99Normandy 1.00 4.96 4.96 1636.00 0.30 2987.00 1.66 602.22Onlsow 10.00 28.79 2.88 365.00 7.89 8184.00 3.52 284.27Pirbright 1.00 0.35 0.35 1902.00 0.02 4214.00 0.08 4214.00Send 3.00 5.35 1.78 697.00 0.77 4138.00 1.29 773.46Shalford 3.00 5.35 1.78 1986.00 0.27 5161.00 1.04 964.67Stoke 4.00 11.52 2.88 283.00 4.07 5858.00 1.97 508.51Stoughton 5.00 6.80 1.36 147.00 4.63 8027.00 0.85 1180.44The Pilgrims 1.00 2.36 2.36 3233.00 0.07 2508.00 0.94 1062.71Tillingbourne 5.00 3.70 0.74 4423.00 0.08 5216.00 0.71 1409.73Westborough 7.00 7.27 1.04 169.00 4.30 9080.00 0.80 1248.97Worplesdon 10.00 7.76 0.78 1794.00 0.43 8279.00 0.94 1066.88Total 95.00 133.76 1.41 27093.00 0.49 129701.00 0.98 969.65
PPG17 Audit 2005 Planning Policy
3
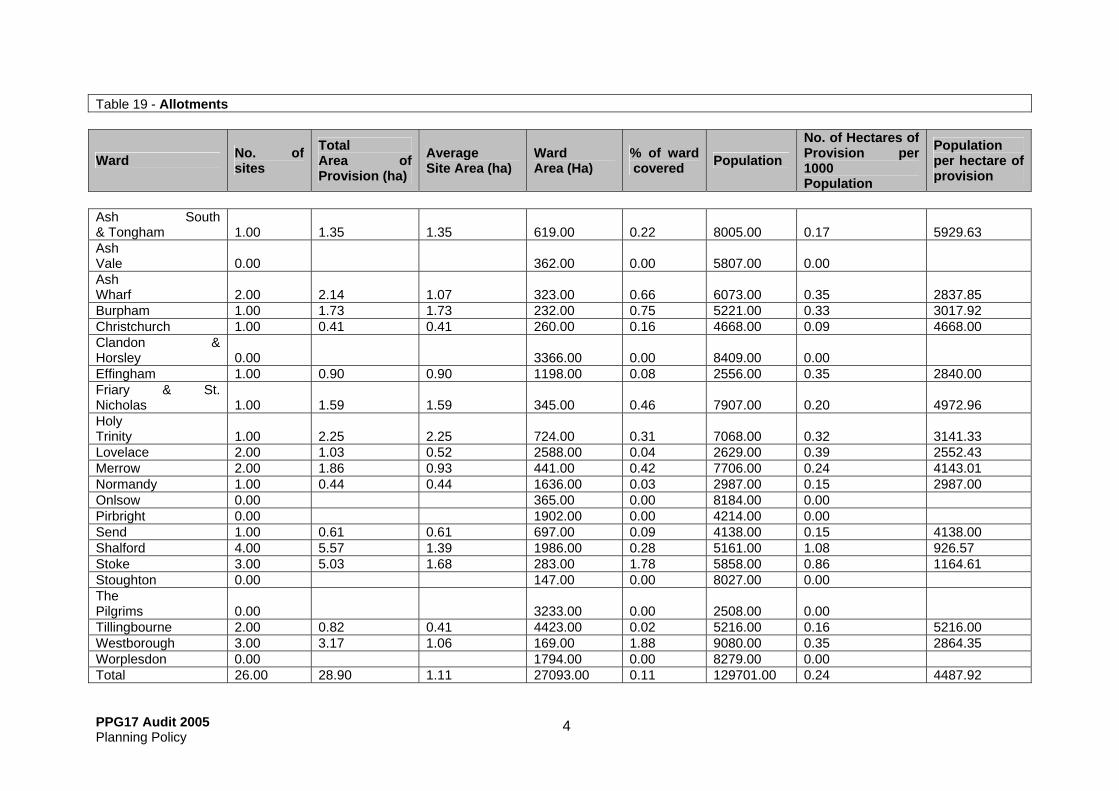
Table 19 - Allotments
Ward No. of sites
Total Area of Provision (ha)
Average Site Area (ha)
Ward Area (Ha)
% of ward covered Population
No. of Hectares of Provision per 1000 Population
Population per hectare of provision
Ash South & Tongham 1.00 1.35 1.35 619.00 0.22 8005.00 0.17 5929.63Ash Vale 0.00 362.00 0.00 5807.00 0.00 Ash Wharf 2.00 2.14 1.07 323.00 0.66 6073.00 0.35 2837.85Burpham 1.00 1.73 1.73 232.00 0.75 5221.00 0.33 3017.92Christchurch 1.00 0.41 0.41 260.00 0.16 4668.00 0.09 4668.00Clandon & Horsley 0.00 3366.00 0.00 8409.00 0.00 Effingham 1.00 0.90 0.90 1198.00 0.08 2556.00 0.35 2840.00Friary & St. Nicholas 1.00 1.59 1.59 345.00 0.46 7907.00 0.20 4972.96Holy Trinity 1.00 2.25 2.25 724.00 0.31 7068.00 0.32 3141.33Lovelace 2.00 1.03 0.52 2588.00 0.04 2629.00 0.39 2552.43Merrow 2.00 1.86 0.93 441.00 0.42 7706.00 0.24 4143.01Normandy 1.00 0.44 0.44 1636.00 0.03 2987.00 0.15 2987.00Onlsow 0.00 365.00 0.00 8184.00 0.00 Pirbright 0.00 1902.00 0.00 4214.00 0.00 Send 1.00 0.61 0.61 697.00 0.09 4138.00 0.15 4138.00Shalford 4.00 5.57 1.39 1986.00 0.28 5161.00 1.08 926.57Stoke 3.00 5.03 1.68 283.00 1.78 5858.00 0.86 1164.61Stoughton 0.00 147.00 0.00 8027.00 0.00 The Pilgrims 0.00 3233.00 0.00 2508.00 0.00 Tillingbourne 2.00 0.82 0.41 4423.00 0.02 5216.00 0.16 5216.00Westborough 3.00 3.17 1.06 169.00 1.88 9080.00 0.35 2864.35Worplesdon 0.00 1794.00 0.00 8279.00 0.00 Total 26.00 28.90 1.11 27093.00 0.11 129701.00 0.24 4487.92
PPG17 Audit 2005 Planning Policy
4
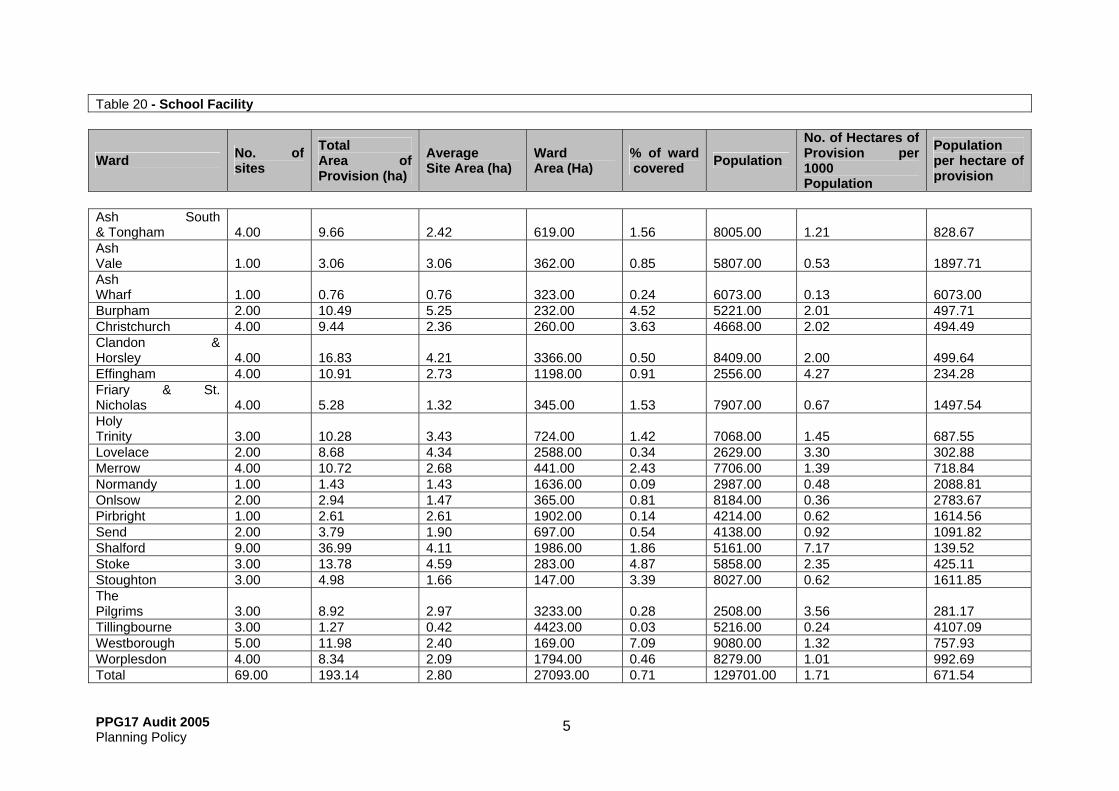
Table 20 - School Facility
Ward No. of sites
Total Area of Provision (ha)
Average Site Area (ha)
Ward Area (Ha)
% of ward covered Population
No. of Hectares of Provision per 1000 Population
Population per hectare of provision
Ash South & Tongham 4.00 9.66 2.42 619.00 1.56 8005.00 1.21 828.67Ash Vale 1.00 3.06 3.06 362.00 0.85 5807.00 0.53 1897.71Ash Wharf 1.00 0.76 0.76 323.00 0.24 6073.00 0.13 6073.00Burpham 2.00 10.49 5.25 232.00 4.52 5221.00 2.01 497.71Christchurch 4.00 9.44 2.36 260.00 3.63 4668.00 2.02 494.49Clandon & Horsley 4.00 16.83 4.21 3366.00 0.50 8409.00 2.00 499.64Effingham 4.00 10.91 2.73 1198.00 0.91 2556.00 4.27 234.28Friary & St. Nicholas 4.00 5.28 1.32 345.00 1.53 7907.00 0.67 1497.54Holy Trinity 3.00 10.28 3.43 724.00 1.42 7068.00 1.45 687.55Lovelace 2.00 8.68 4.34 2588.00 0.34 2629.00 3.30 302.88Merrow 4.00 10.72 2.68 441.00 2.43 7706.00 1.39 718.84Normandy 1.00 1.43 1.43 1636.00 0.09 2987.00 0.48 2088.81Onlsow 2.00 2.94 1.47 365.00 0.81 8184.00 0.36 2783.67Pirbright 1.00 2.61 2.61 1902.00 0.14 4214.00 0.62 1614.56Send 2.00 3.79 1.90 697.00 0.54 4138.00 0.92 1091.82Shalford 9.00 36.99 4.11 1986.00 1.86 5161.00 7.17 139.52Stoke 3.00 13.78 4.59 283.00 4.87 5858.00 2.35 425.11Stoughton 3.00 4.98 1.66 147.00 3.39 8027.00 0.62 1611.85The Pilgrims 3.00 8.92 2.97 3233.00 0.28 2508.00 3.56 281.17Tillingbourne 3.00 1.27 0.42 4423.00 0.03 5216.00 0.24 4107.09Westborough 5.00 11.98 2.40 169.00 7.09 9080.00 1.32 757.93Worplesdon 4.00 8.34 2.09 1794.00 0.46 8279.00 1.01 992.69Total 69.00 193.14 2.80 27093.00 0.71 129701.00 1.71 671.54
PPG17 Audit 2005 Planning Policy
5
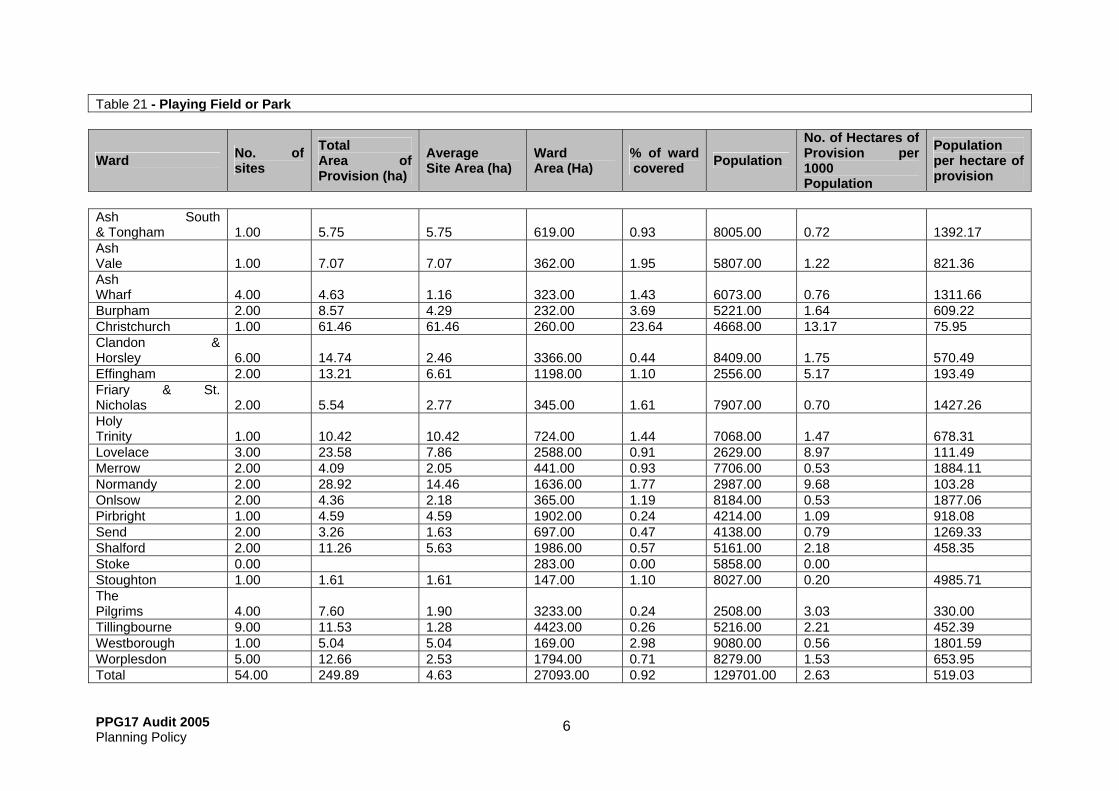
Table 21 - Playing Field or Park
Ward No. of sites
Total Area of Provision (ha)
Average Site Area (ha)
Ward Area (Ha)
% of ward covered Population
No. of Hectares of Provision per 1000 Population
Population per hectare of provision
Ash South & Tongham 1.00 5.75 5.75 619.00 0.93 8005.00 0.72 1392.17Ash Vale 1.00 7.07 7.07 362.00 1.95 5807.00 1.22 821.36Ash Wharf 4.00 4.63 1.16 323.00 1.43 6073.00 0.76 1311.66Burpham 2.00 8.57 4.29 232.00 3.69 5221.00 1.64 609.22Christchurch 1.00 61.46 61.46 260.00 23.64 4668.00 13.17 75.95Clandon & Horsley 6.00 14.74 2.46 3366.00 0.44 8409.00 1.75 570.49Effingham 2.00 13.21 6.61 1198.00 1.10 2556.00 5.17 193.49Friary & St. Nicholas 2.00 5.54 2.77 345.00 1.61 7907.00 0.70 1427.26Holy Trinity 1.00 10.42 10.42 724.00 1.44 7068.00 1.47 678.31Lovelace 3.00 23.58 7.86 2588.00 0.91 2629.00 8.97 111.49Merrow 2.00 4.09 2.05 441.00 0.93 7706.00 0.53 1884.11Normandy 2.00 28.92 14.46 1636.00 1.77 2987.00 9.68 103.28Onlsow 2.00 4.36 2.18 365.00 1.19 8184.00 0.53 1877.06Pirbright 1.00 4.59 4.59 1902.00 0.24 4214.00 1.09 918.08Send 2.00 3.26 1.63 697.00 0.47 4138.00 0.79 1269.33Shalford 2.00 11.26 5.63 1986.00 0.57 5161.00 2.18 458.35Stoke 0.00 283.00 0.00 5858.00 0.00 Stoughton 1.00 1.61 1.61 147.00 1.10 8027.00 0.20 4985.71The Pilgrims 4.00 7.60 1.90 3233.00 0.24 2508.00 3.03 330.00Tillingbourne 9.00 11.53 1.28 4423.00 0.26 5216.00 2.21 452.39Westborough 1.00 5.04 5.04 169.00 2.98 9080.00 0.56 1801.59Worplesdon 5.00 12.66 2.53 1794.00 0.71 8279.00 1.53 653.95Total 54.00 249.89 4.63 27093.00 0.92 129701.00 2.63 519.03
PPG17 Audit 2005 Planning Policy
6

Table 22 - Built Sports Facilities
Ward No. of sites
Total Area of Provision (ha)
Average Site Area (ha)
Ward Area (Ha)
% of ward covered Population
No. of Hectares of Provision per 1000 Population
Population per hectare of provision
Ash South & Tongham 3.00 5.11 1.70 619.00 0.83 8005.00 0.64 1566.54Ash Vale 3.00 8.79 2.93 362.00 2.43 5807.00 1.51 660.64Ash Wharf 1.00 0.33 0.33 323.00 0.10 6073.00 0.05 6073.00Burpham 2.00 0.37 0.19 232.00 0.16 5221.00 0.07 5221.00Christchurch 7.00 6.29 0.90 260.00 2.42 4668.00 1.35 742.13Clandon & Horsley 7.00 58.03 8.29 3366.00 1.72 8409.00 6.90 144.91Effingham 4.00 112.60 28.15 1198.00 9.40 2556.00 44.05 22.70Friary & St. Nicholas 0.00 345.00 0.00 7907.00 0.00 Holy Trinity 4.00 0.84 0.21 724.00 0.12 7068.00 0.12 7068.00Lovelace 2.00 80.41 40.21 2588.00 3.11 2629.00 30.59 32.69Merrow 3.00 44.95 14.98 441.00 10.19 7706.00 5.83 171.43Normandy 2.00 2.59 1.30 1636.00 0.16 2987.00 0.87 1153.28Onlsow 4.00 12.94 3.24 365.00 3.55 8184.00 1.58 632.46Pirbright 4.00 8.46 2.12 1902.00 0.44 4214.00 2.01 498.11Send 3.00 13.67 4.56 697.00 1.96 4138.00 3.30 302.71Shalford 6.00 1.94 0.32 1986.00 0.10 5161.00 0.38 2660.31Stoke 1.00 0.08 0.08 283.00 0.03 5858.00 0.01 5858.00Stoughton 0.00 147.00 0.00 8027.00 0.00 The Pilgrims 4.00 131.83 32.96 3233.00 4.08 2508.00 52.56 19.02Tillingbourne 8.00 12.16 1.52 4423.00 0.27 5216.00 2.33 428.95Westborough 2.00 0.34 0.17 169.00 0.20 9080.00 0.04 26705.88Worplesdon 4.00 111.84 27.96 1794.00 6.23 8279.00 13.51 74.03 Total 74.00 613.57 8.29 27093.00 2.26 129701.00 7.62 211.39
PPG17 Audit 2005 Planning Policy
7
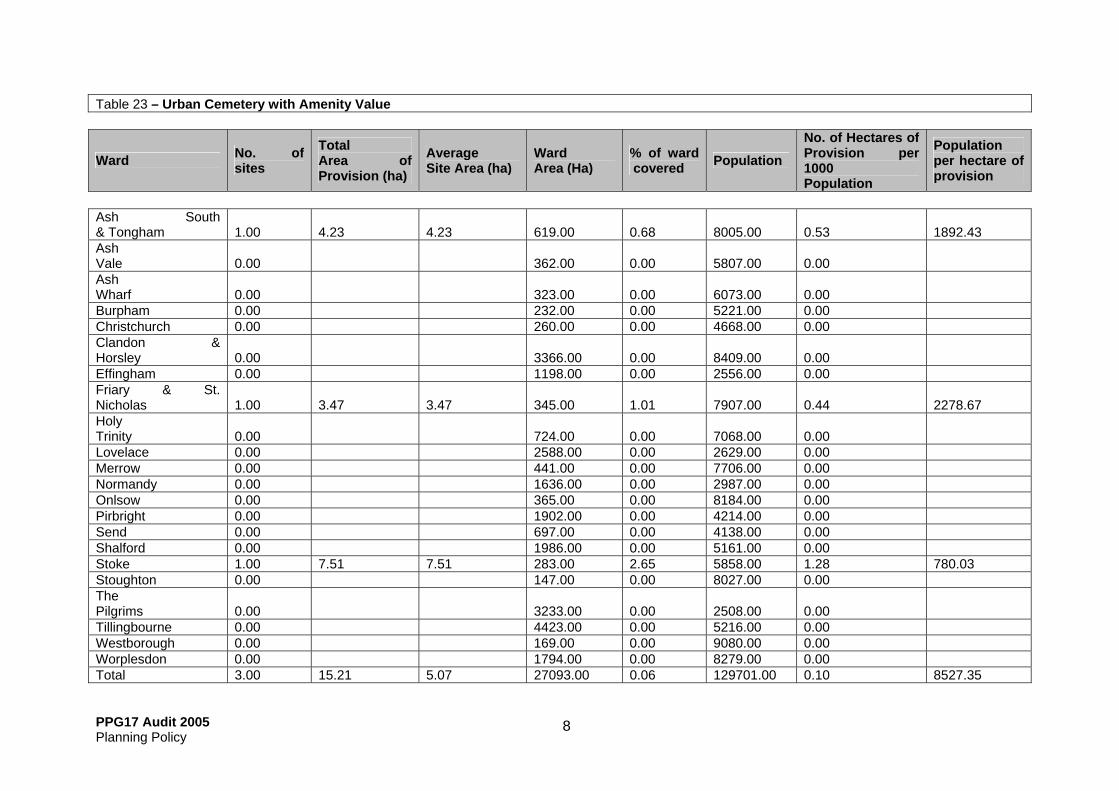
Table 23 – Urban Cemetery with Amenity Value
Ward No. of sites
Total Area of Provision (ha)
Average Site Area (ha)
Ward Area (Ha)
% of ward covered Population
No. of Hectares of Provision per 1000 Population
Population per hectare of provision
Ash South & Tongham 1.00 4.23 4.23 619.00 0.68 8005.00 0.53 1892.43Ash Vale 0.00 362.00 0.00 5807.00 0.00 Ash Wharf 0.00 323.00 0.00 6073.00 0.00 Burpham 0.00 232.00 0.00 5221.00 0.00 Christchurch 0.00 260.00 0.00 4668.00 0.00 Clandon & Horsley 0.00 3366.00 0.00 8409.00 0.00 Effingham 0.00 1198.00 0.00 2556.00 0.00 Friary & St. Nicholas 1.00 3.47 3.47 345.00 1.01 7907.00 0.44 2278.67Holy Trinity 0.00 724.00 0.00 7068.00 0.00 Lovelace 0.00 2588.00 0.00 2629.00 0.00 Merrow 0.00 441.00 0.00 7706.00 0.00 Normandy 0.00 1636.00 0.00 2987.00 0.00 Onlsow 0.00 365.00 0.00 8184.00 0.00 Pirbright 0.00 1902.00 0.00 4214.00 0.00 Send 0.00 697.00 0.00 4138.00 0.00 Shalford 0.00 1986.00 0.00 5161.00 0.00 Stoke 1.00 7.51 7.51 283.00 2.65 5858.00 1.28 780.03Stoughton 0.00 147.00 0.00 8027.00 0.00 The Pilgrims 0.00 3233.00 0.00 2508.00 0.00 Tillingbourne 0.00 4423.00 0.00 5216.00 0.00 Westborough 0.00 169.00 0.00 9080.00 0.00 Worplesdon 0.00 1794.00 0.00 8279.00 0.00 Total 3.00 15.21 5.07 27093.00 0.06 129701.00 0.10 8527.35
PPG17 Audit 2005 Planning Policy
8
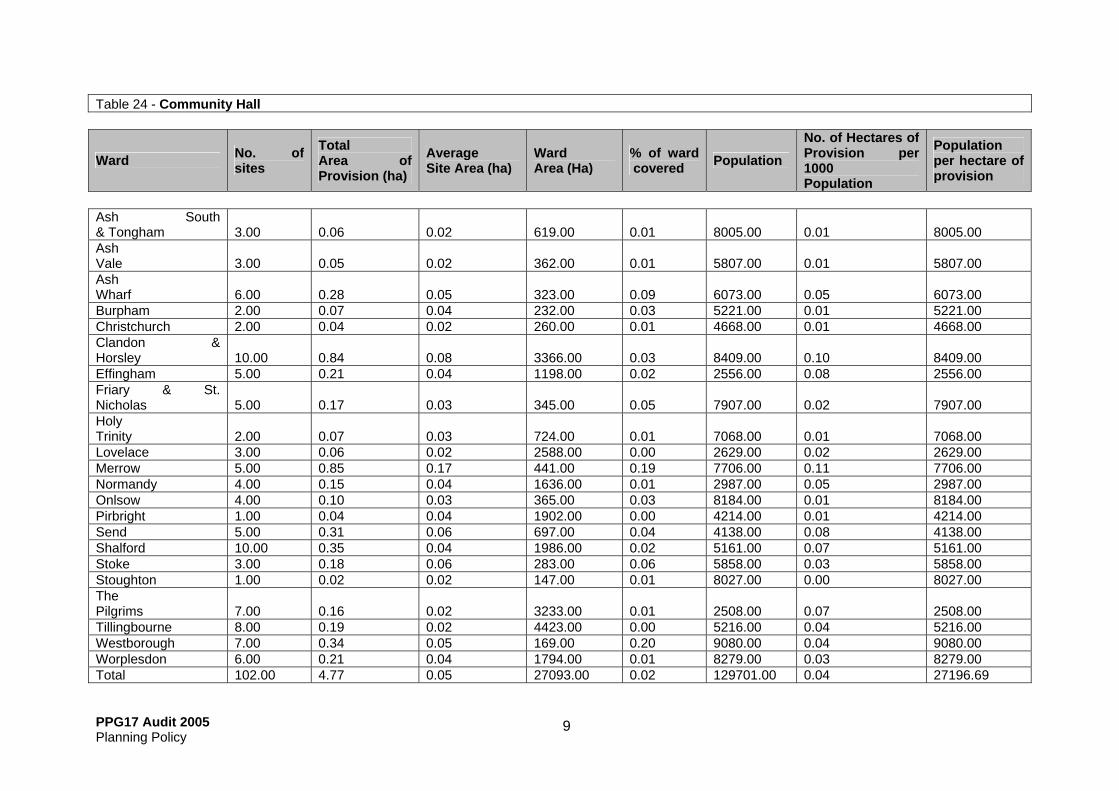
Table 24 - Community Hall
Ward No. of sites
Total Area of Provision (ha)
Average Site Area (ha)
Ward Area (Ha)
% of ward covered Population
No. of Hectares of Provision per 1000 Population
Population per hectare of provision
Ash South & Tongham 3.00 0.06 0.02 619.00 0.01 8005.00 0.01 8005.00Ash Vale 3.00 0.05 0.02 362.00 0.01 5807.00 0.01 5807.00Ash Wharf 6.00 0.28 0.05 323.00 0.09 6073.00 0.05 6073.00Burpham 2.00 0.07 0.04 232.00 0.03 5221.00 0.01 5221.00Christchurch 2.00 0.04 0.02 260.00 0.01 4668.00 0.01 4668.00Clandon & Horsley 10.00 0.84 0.08 3366.00 0.03 8409.00 0.10 8409.00Effingham 5.00 0.21 0.04 1198.00 0.02 2556.00 0.08 2556.00Friary & St. Nicholas 5.00 0.17 0.03 345.00 0.05 7907.00 0.02 7907.00Holy Trinity 2.00 0.07 0.03 724.00 0.01 7068.00 0.01 7068.00Lovelace 3.00 0.06 0.02 2588.00 0.00 2629.00 0.02 2629.00Merrow 5.00 0.85 0.17 441.00 0.19 7706.00 0.11 7706.00Normandy 4.00 0.15 0.04 1636.00 0.01 2987.00 0.05 2987.00Onlsow 4.00 0.10 0.03 365.00 0.03 8184.00 0.01 8184.00Pirbright 1.00 0.04 0.04 1902.00 0.00 4214.00 0.01 4214.00Send 5.00 0.31 0.06 697.00 0.04 4138.00 0.08 4138.00Shalford 10.00 0.35 0.04 1986.00 0.02 5161.00 0.07 5161.00Stoke 3.00 0.18 0.06 283.00 0.06 5858.00 0.03 5858.00Stoughton 1.00 0.02 0.02 147.00 0.01 8027.00 0.00 8027.00The Pilgrims 7.00 0.16 0.02 3233.00 0.01 2508.00 0.07 2508.00Tillingbourne 8.00 0.19 0.02 4423.00 0.00 5216.00 0.04 5216.00Westborough 7.00 0.34 0.05 169.00 0.20 9080.00 0.04 9080.00Worplesdon 6.00 0.21 0.04 1794.00 0.01 8279.00 0.03 8279.00Total 102.00 4.77 0.05 27093.00 0.02 129701.00 0.04 27196.69
PPG17 Audit 2005 Planning Policy
9
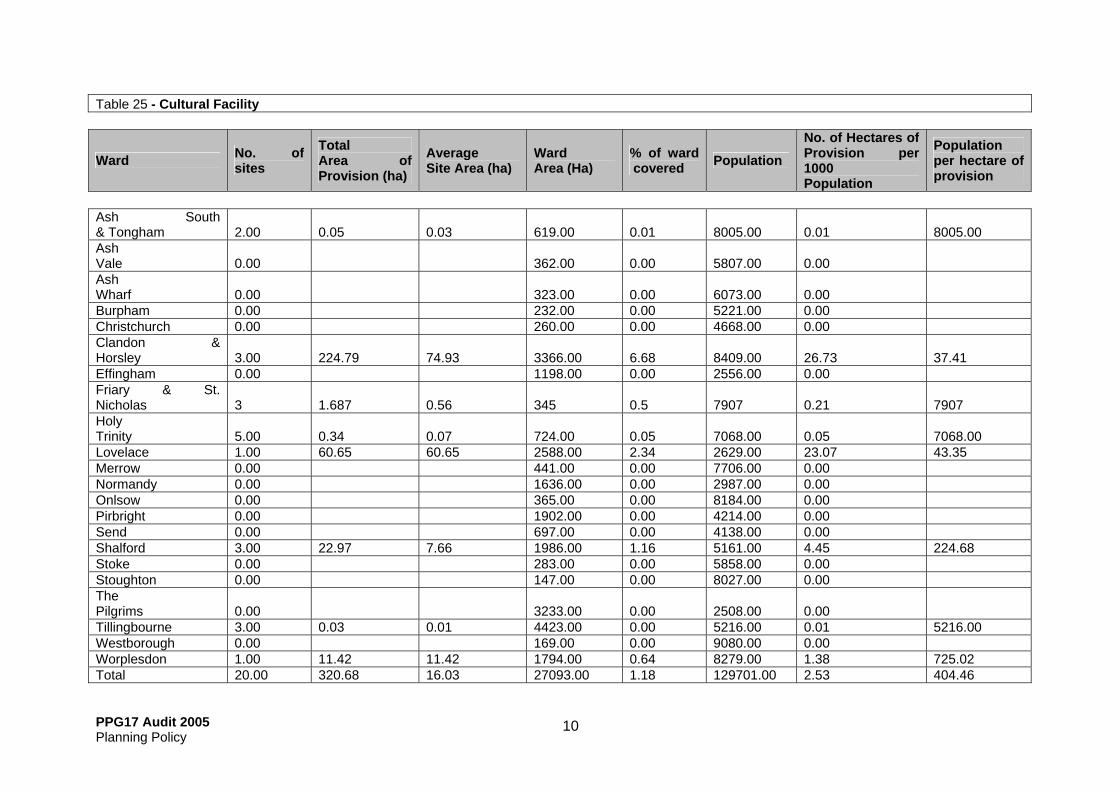
Table 25 - Cultural Facility
Ward No. of sites
Total Area of Provision (ha)
Average Site Area (ha)
Ward Area (Ha)
% of ward covered Population
No. of Hectares of Provision per 1000 Population
Population per hectare of provision
Ash South & Tongham 2.00 0.05 0.03 619.00 0.01 8005.00 0.01 8005.00Ash Vale 0.00 362.00 0.00 5807.00 0.00 Ash Wharf 0.00 323.00 0.00 6073.00 0.00 Burpham 0.00 232.00 0.00 5221.00 0.00 Christchurch 0.00 260.00 0.00 4668.00 0.00 Clandon & Horsley 3.00 224.79 74.93 3366.00 6.68 8409.00 26.73 37.41Effingham 0.00 1198.00 0.00 2556.00 0.00 Friary & St. Nicholas 3 1.687 0.56 345 0.5 7907 0.21 7907Holy Trinity 5.00 0.34 0.07 724.00 0.05 7068.00 0.05 7068.00Lovelace 1.00 60.65 60.65 2588.00 2.34 2629.00 23.07 43.35Merrow 0.00 441.00 0.00 7706.00 0.00 Normandy 0.00 1636.00 0.00 2987.00 0.00 Onlsow 0.00 365.00 0.00 8184.00 0.00 Pirbright 0.00 1902.00 0.00 4214.00 0.00 Send 0.00 697.00 0.00 4138.00 0.00 Shalford 3.00 22.97 7.66 1986.00 1.16 5161.00 4.45 224.68Stoke 0.00 283.00 0.00 5858.00 0.00 Stoughton 0.00 147.00 0.00 8027.00 0.00 The Pilgrims 0.00 3233.00 0.00 2508.00 0.00 Tillingbourne 3.00 0.03 0.01 4423.00 0.00 5216.00 0.01 5216.00Westborough 0.00 169.00 0.00 9080.00 0.00 Worplesdon 1.00 11.42 11.42 1794.00 0.64 8279.00 1.38 725.02Total 20.00 320.68 16.03 27093.00 1.18 129701.00 2.53 404.46
PPG17 Audit 2005 Planning Policy
10
A8.1 Other Quantitative Findings and Sites 54 sites had fixed play equipment – the provision and location of fixed play equipment is comprehensively covered in the Fixed Equipment Playground Strategy 2003. However it must be noted that 54 sites is only 9% of those sites audited. The Fixed Equipment Playground Strategy also assessed children’s play spaces. The study identified that there is a huge shortage in Local Areas of Play (LAP), which cater specifically for 4-6 year olds, when required numbers based on NPFA standards are assessed against actual numbers. For LAP’s there should be 1767 sites but are there are only 7, for Local Equipped Areas of Play (LEAP) there should be 247 but there is only 50, for Neighbourhood Equipped Areas of Play there should be 13 but there are only 2 and 1 Premier Equipped Area of Play when there aspiration is 3. When assessed against provision per 1000 children under 12 years old provision (1.6 sites per 1000 children) is less than the Surrey average of 2.2 sites per 1000 children. But when the rural areas are also considered then this rises to 3.33 sites per 1000 children, above the Surrey average. The shortage can be explained because small parcels of land cannot always be adopted by GBC as they are un economic to maintain. 381 sites had a cost to enter or use the site – this is 77% of sites audited. This is about what was expected as Accessible Natural and Sami Natural Greenspace and Amenity Open Space are approximately 25% of site audited, these typologies are normally free to enter. A8.2 Sites not Audited The auditors were unable to audit a few of the sites as access could not be arranged, this is recorded on the database. As much quantitative data was gathered from desk based assessments as possible. No qualitative data exists for theses sites. The qualitative results have been adjusted to reflect this. Other sites that were not audited are Linear features mainly Rights of Way, the Basingstoke Canal, the River Wey, the Tongham disused railway line, and the North Downs Way Sites of Nature Conservation Importance were generally not audited, as there was often no access, e.g. the area of open space by the River Wey to the South of Stoke ward Site ST21 in the 1997 Open Space Survey. A8.3 Current Open Space The 1997 Open Space Survey identified a number of sites that should be protected open space. All of these sites were re audited. All existing protected open spaces should remain designated as they have either recreational, amenity or wildlife value.
PPG17 Audit 2005 Planning Policy
11

Table 26 - Location of public sports provision by ward - The numbers in brackets are the site reference numbers given to each site audited Ash
South and Tongham
Ash Vale
Ash Wharf Burpham Christchurch Clandon
and Horsley Effingham Friary & St Nicolas
Holy Trinity
Athletics Tracks 1 (533) . 1 (16)
All Weather Sports Pitch 1 (554)
Archery Field Badminton Courts 4 (554) 10 (533) 1 (462)
Basketball 1 (331) 1 (306) 2 (310,316) 1 (394) 1 (137)
Bowls Indoor/ Outdoor 1 (341) 1 (561) 1 (421) 1 (21) 2 (547,548)
Cricket Pitches 1 (331) 1 (394) 2 (421) 1 (71) 2 (16,138) 2 (389,427)
Football Pitches 1 (331) 1 (305) 2
(522,320) 2 (394,399) 3 (421,533) 5 (73,84,176) 2 (16) 1 (389) 2 (429)
Fishing Sites 1 (304) 1 (311) 1 (22) Golf (18 Holes) 1 (83) 1(10)Golf (9 holes) Hockey Pitch 1 (427)Ice Rink 1 (533) Netball Courts 1 (554) 1 (421) Rugby Pitch 2 (421) 3 (16,52) Shooting Sites 1 (65) Squash Court 3 (533) Ski Slope Swimming Pools 4 (467,533)
Tennis Courts 3 (332) 2 (307) 3 (521) 3 (563) 14 (391,392,568)
11(70,74,95.98,177)
4 (10,136) 2 (549)
Ward Total 13 5 8 8 42 19 16 4 7
PPG17 Audit 2005 Planning Policy
12

Lovelace Merrow Normandy Onslow Pirbright Send Shalford Stoke
Stoughton
Athletics Tracks All Weather Sports Pitch 1 (534)
Archery Field 1 (27) 1 (534)
Badminton Courts 1 (408) 1 (25) 4 (534) 1 (230)
Basketball 1 (184) 1 (195)Bowls Indoor/ Outdoor 1 (556) 1 (25) 1 (580) 3
(482,540,545)
Cricket Pitches 2 (126,131) 1 (441) 2 (583) 1 (534) 1 (36) 1 (100) 1 (216)
Football Pitches
3 (118,126,131)
1 (398) 1 (28) 1 (346) 1 (101) 2 (195,216) 1 (377)
Fishing Sites 1 (113) 1 (102) Golf (18 Holes) 1 (129) 1 (438) Golf (9 holes) 1 (37) Hockey Pitch 2 (534) Ice Rink Netball Courts Rugby Pitch 5 (290)
Shooting Sites 2 (444,267)
Squash Court 5 (534) 1 (290)
Ski Slope 3 (555)Swimming Pools
Tennis Courts 6 (407) 1 (7) 13 (382,581) 2 (38) 1 (108) 4(232,223,225)
Ward Total 7 11 7 29 6 5 18 3 1
PPG17 Audit 2005 Planning Policy
13

The Pilgrims
Tillingbourne Westborough Worplesdon Total (all
wards) Population per Facility
Facility per 1000 Population
Athletics Tracks 2 64850.5 0.015 All Weather Sports Pitch 2 64850.5 0.015
Archery Field 2 64850.5 0.015Badminton Courts 3 (162, 169,
170) 1 (465) 1 (43) 27 4803.74 0.208
Basketball 1 (148) 1 (272) 10 12970.1 0.077 Bowls Indoor/ Outdoor 1 (257) 2 (114,150) 1 (385) 16 8106.3 0.123
Cricket Pitches 1 (536) 3 (152,161,163) 3 (45,47,272) 25 5188.0 0.192
Football Pitches 1 (244)
5 (148,155,159,160,163)
2 (375) 5 (279,45, 241) 42 3088.1 0.323
Fishing Sites 3 (166,278,284) 2 (49,269) 10 12970.1 0.077
Golf (18 Holes) 3 (239, 248, 249) 1 (48) 8 16212.6 0.061
Golf (9 holes) 1 (46) 2 64850.5 0.015Hockey Pitch 3 43233.6 0.023Ice Rink 1 129701 0.007Netball Courts 2 64850.5 0.015Rugby Pitch 10 12970.1 0.077Shooting Sites 3 43233.6 0.023Ski Slope 3
Squash Court 9 14411.2 0.069Swimming Pools 1 (158) 5 25940.2 0.038Tennis Courts 2 (151) 5 (586) 4 (64)
79 1641.785 0.60
Ward Total 6 20 9 18 Borough Totals 261 496.93 2.01
PPG17 Audit 2005 Planning Policy
14

A8.4 Other Sports Facilities in the Borough Two BMX tracks Four five a side football pitches One skate-park Three ski slopes One ice rink Three shooting facilities One rowing centre One sub aqua, kayaking and canoeing centre One ten pin-bowling centre One croquet lawn One climbing wall One boxing club 34 Health and Fitness Centres within 8 Miles of Guildford. The audit identified 102 community halls, 89 of which had a floor space that would provide a badminton court with a 2m buffer around it. These halls would also be big enough for other indoor activities and sports such as martial arts, yoga and dance classes. Sports, which often do not have specialist facilities, but tend to use generic facilities such as sports halls and community halls. A8.5 Sports England Active Places http://www.activeplaces.com/Index.asp?Authorise=true There are many facilities used by residents of the borough that are not always in the borough. Sports England has identified sporting facilities around the country as part of their ‘Active Places’ project and has developed an on line database. This allows one to choose a sport and identify all facilities within a specified distance of a postcode. Within 8 miles of Millmead House there are 134 sporting facilities listed on the Active Places database. This includes 2 Athletics tracks, 28 golf facilities, 64 grass sports pitches accommodating around 20 different pitch sports including cricket (11) full football pitches (50), junior football (18) hockey (2) and senior rugby (13), 1 ice rink, 1 indoor bowls, 4 indoor tennis facilities, 2 ski slopes, 22 sports halls, 24 swimming pools, and 10 all weather pitches. Although there are some gaps in the data, it is a very useful way of seeing sports provision spatially, with no arbitrary boundaries such as the borough boundary. Figure 4 – Example of Active Places
PPG17 Audit 2005 Planning Policy
16
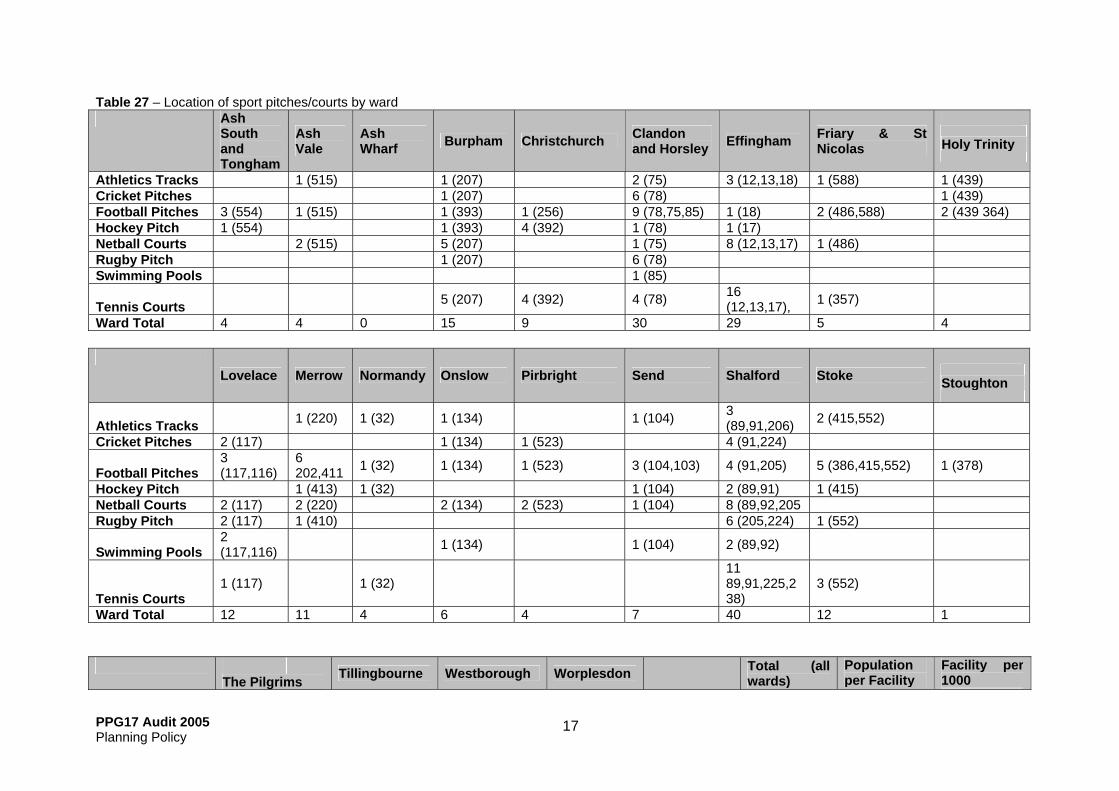
Table 27 – Location of sport pitches/courts by ward Ash
South and Tongham
Ash Vale
Ash Wharf Burpham Christchurch Clandon
and Horsley Effingham Friary & St Nicolas
Holy Trinity
Athletics Tracks 1 (515) 1 (207) 2 (75) 3 (12,13,18) 1 (588) 1 (439) Cricket Pitches 1 (207) 6 (78) 1 (439) Football Pitches 3 (554) 1 (515) 1 (393) 1 (256) 9 (78,75,85) 1 (18) 2 (486,588) 2 (439 364) Hockey Pitch 1 (554) 1 (393) 4 (392) 1 (78) 1 (17) Netball Courts 2 (515) 5 (207) 1 (75) 8 (12,13,17) 1 (486) Rugby Pitch 1 (207) 6 (78) Swimming Pools 1 (85)
Tennis Courts 5 (207) 4 (392) 4 (78) 16 (12,13,17), 1 (357)
Ward Total 4 4 0 15 9 30 29 5 4
Lovelace Merrow Normandy Onslow Pirbright Send Shalford Stoke
Stoughton
Athletics Tracks 1 (220) 1 (32) 1 (134) 1 (104) 3 (89,91,206) 2 (415,552)
Cricket Pitches 2 (117) 1 (134) 1 (523) 4 (91,224)
Football Pitches 3 (117,116)
6 202,411 1 (32) 1 (134) 1 (523) 3 (104,103) 4 (91,205) 5 (386,415,552) 1 (378)
Hockey Pitch 1 (413) 1 (32) 1 (104) 2 (89,91) 1 (415) Netball Courts 2 (117) 2 (220) 2 (134) 2 (523) 1 (104) 8 (89,92,205 Rugby Pitch 2 (117) 1 (410) 6 (205,224) 1 (552)
Swimming Pools 2 (117,116) 1 (134) 1 (104) 2 (89,92)
Tennis Courts 1 (117) 1 (32)
11 89,91,225,238)
3 (552)
Ward Total 12 11 4 6 4 7 40 12 1
The Pilgrims Tillingbourne Westborough Worplesdon Total (all wards)
Population per Facility
Facility per 1000
PPG17 Audit 2005 Planning Policy
17

Population
Athletics Tracks 2 (586, 488) 20 6485.05 0.154
Cricket Pitches 2 (250) 1 (586) 1 (58) 20 6485.05 0.154
Football Pitches 1 (99) 2 (586,368) 6 (58,241) 54 2401.87 0.416
Hockey Pitch 1 (250) 1 (586) 16 8106.37 0.123
Netball Courts 1 (586) 3 (58,59)) 38 3413.184 0.292
Rugby Pitch 5 (250) 22 5895.50 0.169
Swimming Pools 2 (99,250) 1 (144) 10 12970.10 0.771 Tennis Courts 5 (586) 2 (59) 53 2447.18 0.408 Ward Total 11 1 12 12
233 556.650 1.790 A8.6 Other School Facilities All of the schools contacted had a hall(s) where various sports such as basketball, volleyball, gymnastics and badminton could be undertaken. Table 28 – Schools with facilities available for public use
PPG17 Audit 2005 Planning Policy
18
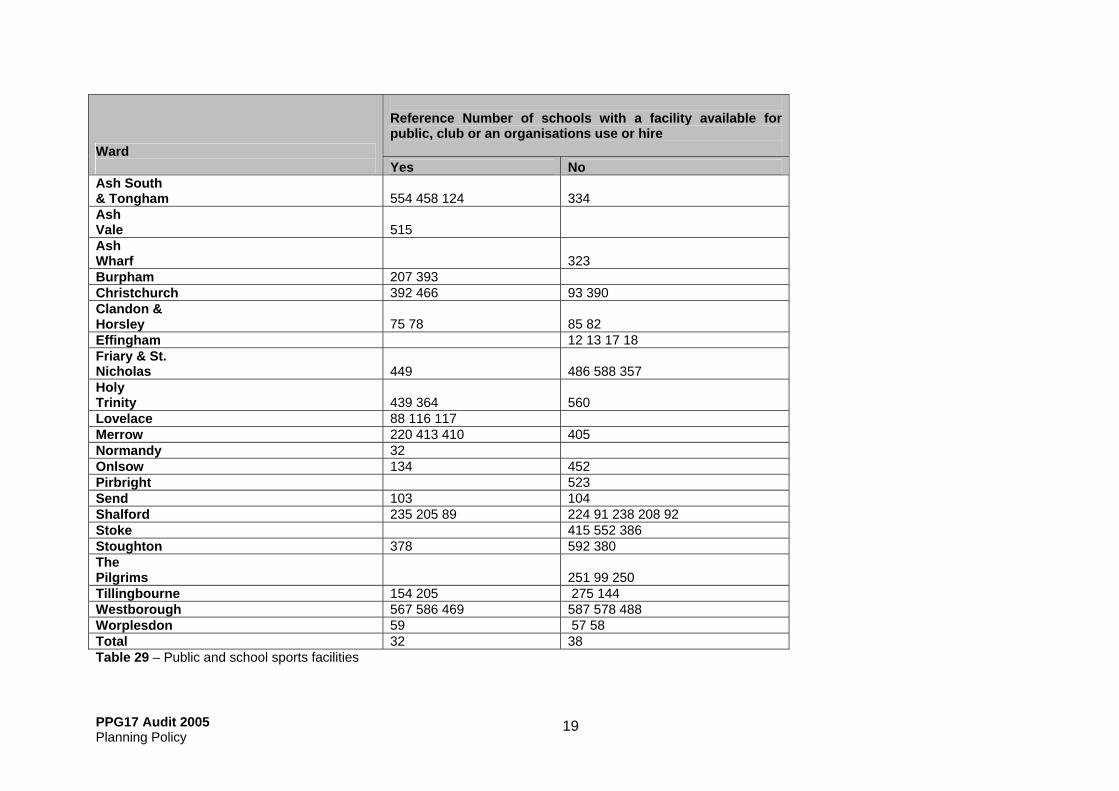
Reference Number of schools with a facility available for public, club or an organisations use or hire Ward
Yes No Ash South & Tongham 554 458 124 334 Ash Vale 515 Ash Wharf 323Burpham 207 393 Christchurch 392 466 93 390 Clandon & Horsley 75 78 85 82 Effingham 12 13 17 18 Friary & St. Nicholas 449 486 588 357 Holy Trinity 439 364 560 Lovelace 88 116 117 Merrow 220 413 410 405 Normandy 32 Onlsow 134 452Pirbright 523Send 103 104 Shalford 235 205 89 224 91 238 208 92 Stoke 415 552 386 Stoughton 378 592 380The Pilgrims 251 99 250 Tillingbourne 154 205 275 144 Westborough 567 586 469 587 578 488 Worplesdon 59 57 58 Total 32 38Table 29 – Public and school sports facilities
PPG17 Audit 2005 Planning Policy
19
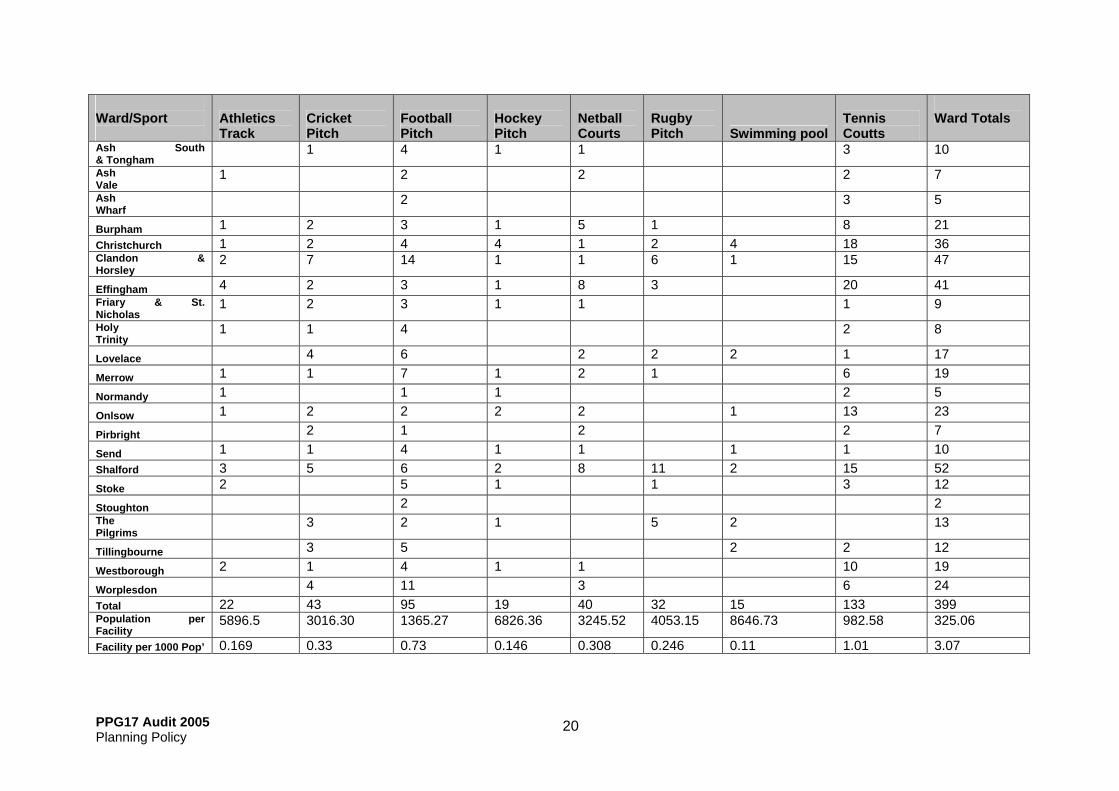
Ward/Sport
Athletics Track
Cricket Pitch
Football Pitch
Hockey Pitch
Netball Courts
Rugby Pitch Swimming pool
Tennis Coutts
Ward Totals
Ash South & Tongham
1 4 1 1 3 10
Ash Vale
1 2 2 2 7
Ash Wharf 2 3 5
Burpham 1 2 3 1 5 1 8 21Christchurch 1 2 4 4 1 2 4 18 36Clandon & Horsley
2 7 14 1 1 6 1 15 47
Effingham 4 2 3 1 8 3 20 41Friary & St. Nicholas
1 2 3 1 1 1 9
Holy Trinity
1 1 4 2 8
Lovelace 4 6 2 2 2 1 17
Merrow 1 1 7 1 2 1 6 19
Normandy 1 1 1 2 5
Onlsow 1 2 2 2 2 1 13 23
Pirbright 2 1 2 2 7
Send 1 1 4 1 1 1 1 10Shalford 3 5 6 2 8 11 2 15 52Stoke 2 5 1 1 3 12
Stoughton 2 2 The Pilgrims 3 2 1 5 2 13
Tillingbourne 3 5 2 2 12
Westborough 2 1 4 1 1 10 19
Worplesdon 4 11 3 6 24Total 22 43 95 19 40 32 15 133 399Population perFacility
5896.5 3016.30 1365.27 6826.36 3245.52 4053.15 8646.73 982.58 325.06
Facility per 1000 Pop’ 0.169 0.33 0.73 0.146 0.308 0.246 0.11 1.01 3.07
PPG17 Audit 2005 Planning Policy
20