appendix a cost equations and curves for the capcost program
TRANSCRIPT

Appendix A Cost Equations and Curves for the CAPCOST Program
The purpose of this appendix is to present the equations and figures that describe the relationships used inthe capital equipment-costing program CAPCOST introduced in Chapter 7 and used throughout the text.The program is based on the module factor approach to costing that was originally introduced by Guthrie[1, 2] and modified by Ulrich [3].
A.1 Purchased Equipment Costs
All the data for the purchased cost of equipment for the second edition of this book were obtained from asurvey of equipment manufacturers during the period May to September of 2001, so an average value ofthe CEPCI of 397 over this period should be used when accounting for inflation.
Additional process equipment has been added to the third edition and is listed below:• Conveyors• Crystallizers• Dryers• Dust Collectors• Filters• Mixers• Reactors• Screens
The purchased costs for these types of equipment were obtained in 2003 but the costs given here havebeen normalized to 2001. For this new equipment, bare module factors were not available, nor werepressure factors or materials of construction factors. In general, these units are generally bought as apackage, and installation in the plant is not expensive. The bare module factors for these units are taken tobe the field installation factors given by Guthrie [1, 2].
Data for the purchased cost of the equipment, at ambient operating pressure and using carbon steelconstruction, , were fitted to the following equation:
(A.1)
where A is the capacity or size parameter for the equipment. The data for K1, K2, and K3, along with themaximum and minimum values used in the correlation, are given in Table A.1. These data are alsopresented in the form of graphs in Figures A.1–A.17. It should be noted that in these figures, the data areplotted as as a function of size attribute, A. This form of the graph clearly illustrates the decreasing

cost per unit of capacity as the size of the equipment increases.
Table A.1 Equipment Cost Data to Be Used with Equation A.1

Figure A.1 Purchased Costs for Compressors and Drives (Cost Data for Compressors and Drives Takenfrom R-Books Software by Richardson Engineering Services, Inc. [4])

Figure A.2 Purchased Costs for Evaporators and Vaporizers

Figure A.3 Purchased Costs for Fans, Pumps, and Power Recovery Equipment (Cost Data for Fans Takenfrom R-Books Software by Richardson Engineering services [4])

Figure A.4 Purchased Costs for Fired Heaters and Furnaces

Figure A.5 Purchased Costs for Heat Exchangers

Figure A.6 Purchased Costs for Packing, Trays, and Demisters
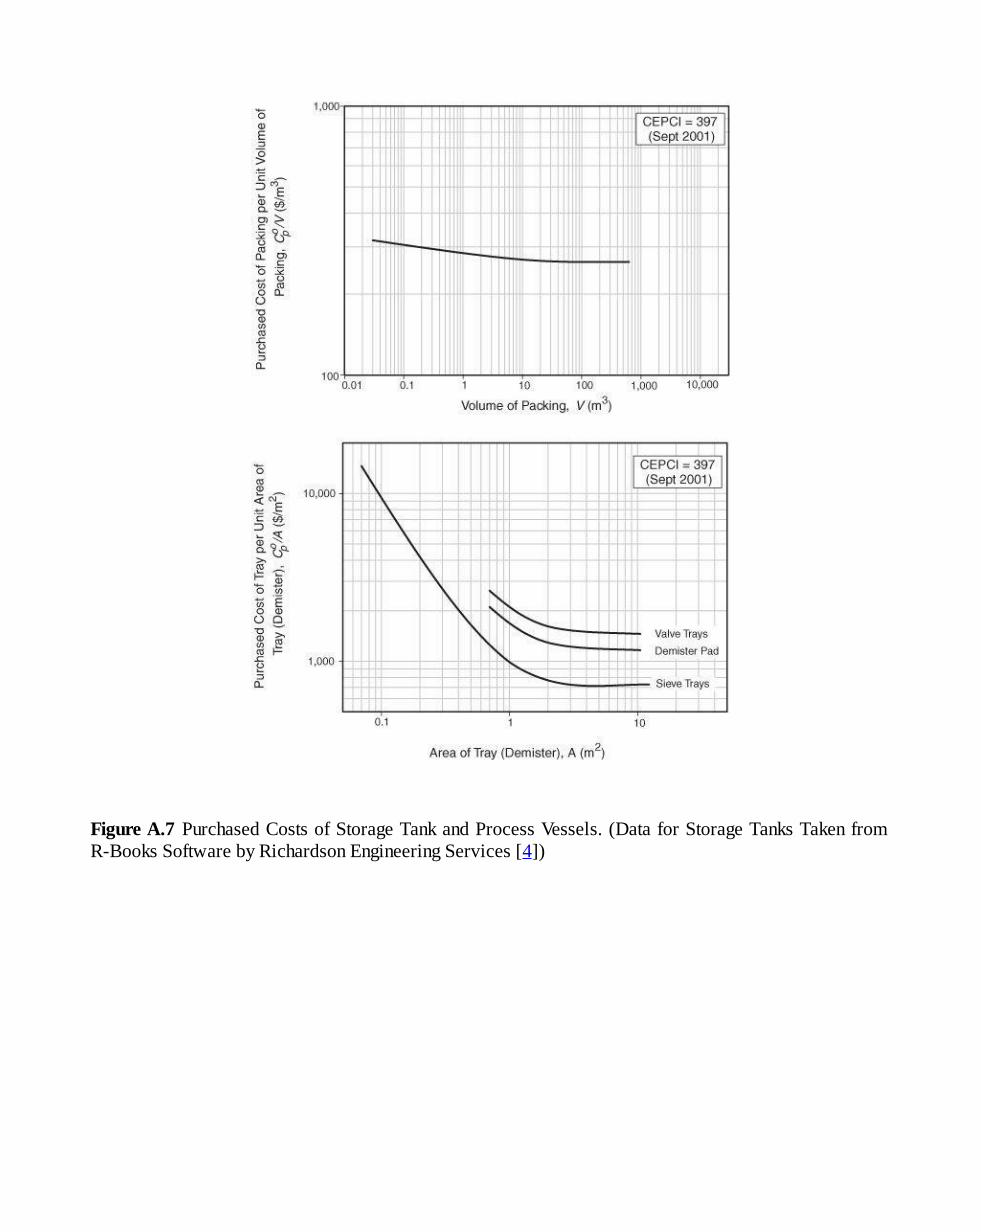
Figure A.7 Purchased Costs of Storage Tank and Process Vessels. (Data for Storage Tanks Taken fromR-Books Software by Richardson Engineering Services [4])

Figure A.8 Purchased Costs for Blenders

Figure A.9 Purchased Costs of Centrifuges
Figure A.10 Purchased Costs for Conveyors
Figure A.11 Purchased Costs for Crystallizers
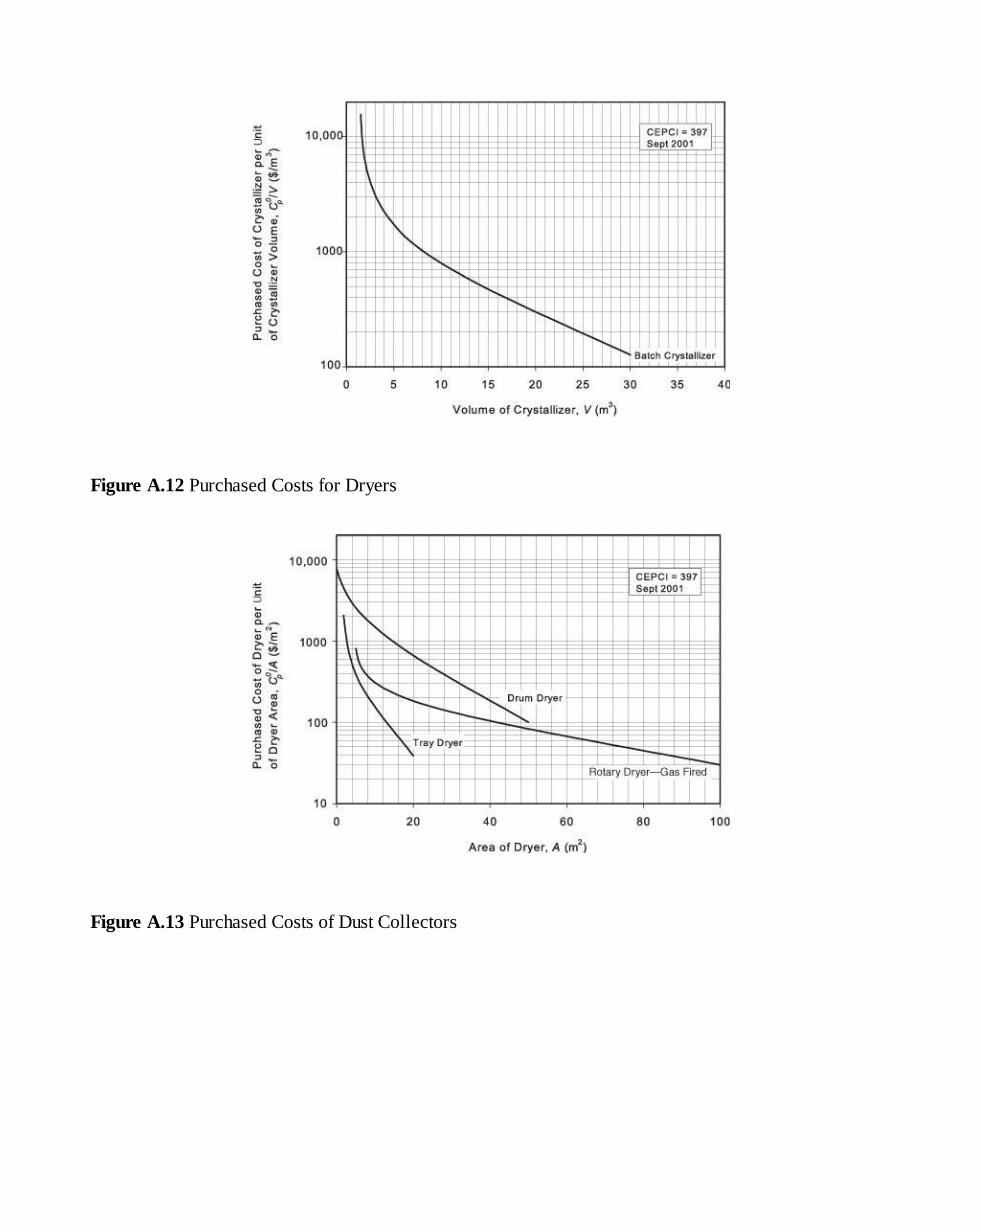
Figure A.12 Purchased Costs for Dryers
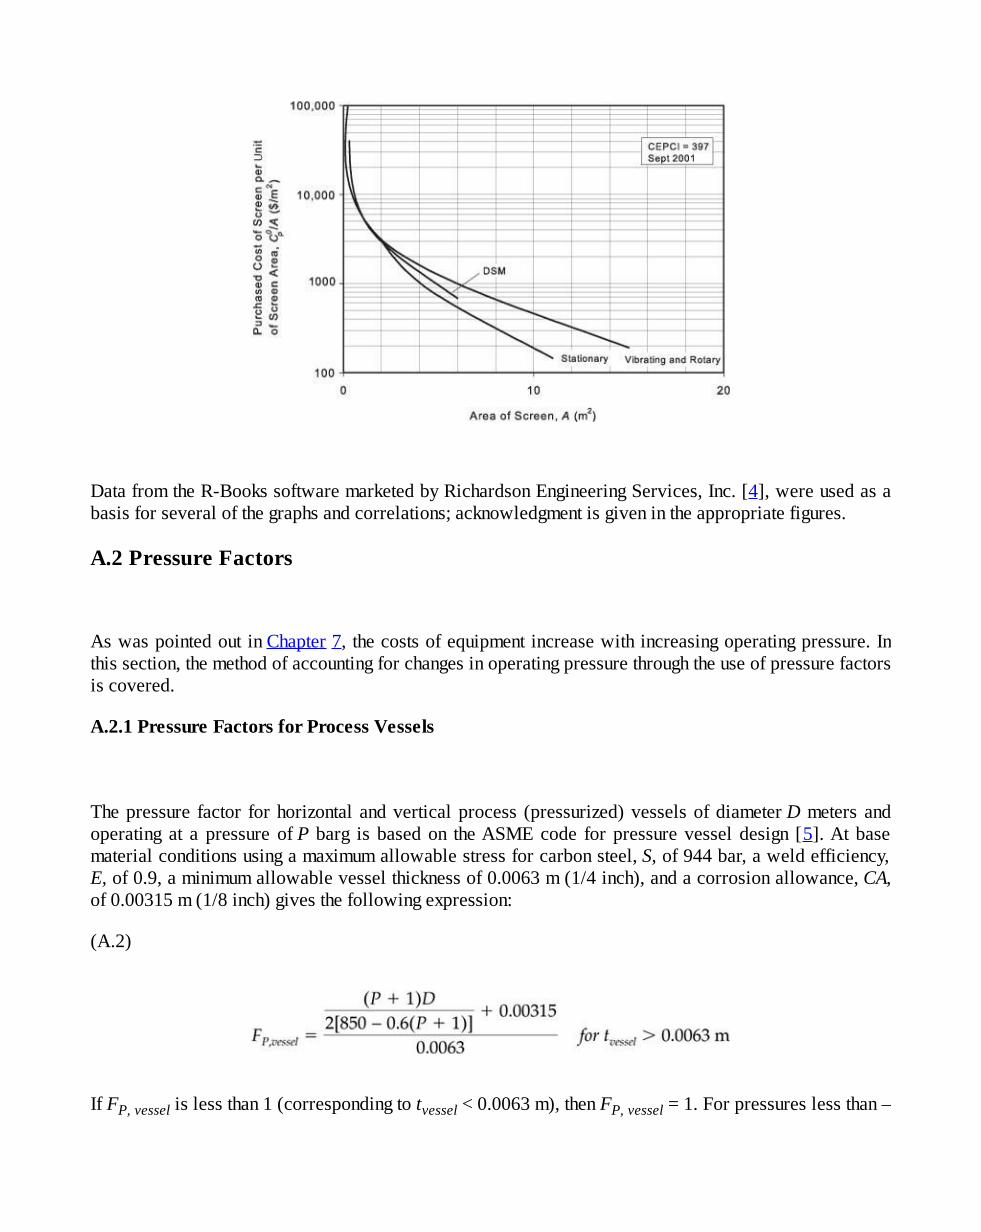
Figure A.13 Purchased Costs of Dust Collectors

Figure A.14 Purchased Costs of Filters
Figure A.15 Purchased Costs of Mixers

Figure A.16 Purchased Costs of Reactors
Figure A.17 Purchased Costs of Screens
Data from the R-Books software marketed by Richardson Engineering Services, Inc. [4], were used as abasis for several of the graphs and correlations; acknowledgment is given in the appropriate figures.
A.2 Pressure Factors
As was pointed out in Chapter 7, the costs of equipment increase with increasing operating pressure. Inthis section, the method of accounting for changes in operating pressure through the use of pressure factorsis covered.
A.2.1 Pressure Factors for Process Vessels
The pressure factor for horizontal and vertical process (pressurized) vessels of diameter D meters andoperating at a pressure of P barg is based on the ASME code for pressure vessel design [5]. At basematerial conditions using a maximum allowable stress for carbon steel, S, of 944 bar, a weld efficiency,E, of 0.9, a minimum allowable vessel thickness of 0.0063 m (1/4 inch), and a corrosion allowance, CA,of 0.00315 m (1/8 inch) gives the following expression:
(A.2)
If FP, vessel is less than 1 (corresponding to tvessel < 0.0063 m), then FP, vessel = 1. For pressures less than –
0.5 barg, FP, vessel =1.25. It should be noted that Equation (A.2) is strictly true for the case when thethickness of the vessel wall is less than ¼ D; for vessels in the range D = 0.3 to 4.0 m, this occurs atpressures of approximately 320 barg.
A.2.2 Pressure Factors for Other Process Equipment
The pressure factors, FP, for the remaining process equipment are given by the following general form:
(A.3)
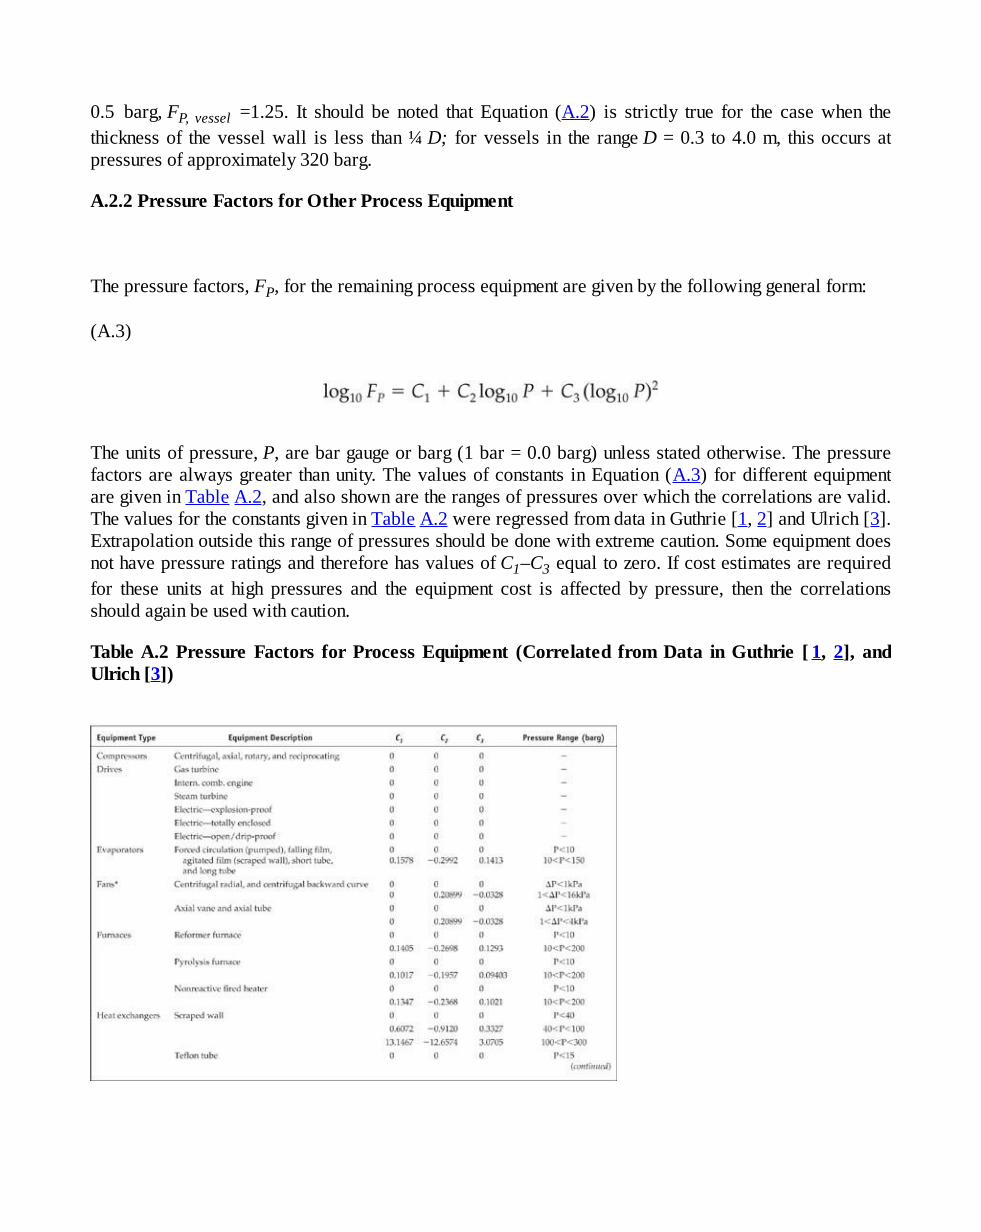
The units of pressure, P, are bar gauge or barg (1 bar = 0.0 barg) unless stated otherwise. The pressurefactors are always greater than unity. The values of constants in Equation (A.3) for different equipmentare given in Table A.2, and also shown are the ranges of pressures over which the correlations are valid.The values for the constants given in Table A.2 were regressed from data in Guthrie [1, 2] and Ulrich [3].Extrapolation outside this range of pressures should be done with extreme caution. Some equipment doesnot have pressure ratings and therefore has values of C1–C3 equal to zero. If cost estimates are requiredfor these units at high pressures and the equipment cost is affected by pressure, then the correlationsshould again be used with caution.
Table A.2 Pressure Factors for Process Equipment (Correlated from Data in Guthrie [ 1, 2], andUlrich [3])

A.3 Material Factors and Bare Module Factors
As was pointed out in Chapter 7, the costs of equipment change with changes in the material ofconstruction. In this section, the method of accounting for different materials of construction is covered.
A.3.1 Bare Module and Material Factors for Heat Exchangers, Process Vessels, and Pumps
The material factors, FM, for heat exchangers, process vessels, and pumps are given in Figure A.18, withthe appropriate identification number listed in Table A.3. The bare module factors for this equipment aregiven by the following equation:
(A.4)

Figure A.18 Material Factors for Equipment in Table A.3 (Averaged Data from References [1, 2, 3, 6, 7,and 8])
Table A.3 Identification Numbers for Material Factors for Heat Exchangers, Process Vessels, andPumps to Be Used with Figure A.18

The values of the constants B1 and B2 are given in Table A.4. The bare module cost for ambient pressureand carbon steel construction, , and the bare module factor for the equipment at these conditions, ,are found by setting FM and FP equal to unity. The data given in Tables A.3 and A.4 and Figure A.18 areaverage values from the following references: Guthrie [1, 2], Ulrich [3], Navarrete [6], Perry et al. [7],and Peters and Timmerhaus [8].
Table A.4 Constants for Bare Module Factor to Be Used in Equation A.4 (Correlated from Data inGuthrie [1, 2] and Ulrich [3])
A.3.2 Bare Module and Material Factors for the Remaining Process Equipment
For the remaining equipment, the bare module costs are related to the material and pressure factors byequations different from Equation (A.4). The form of these equations is given in Table A.5. The baremodule factors that correspond to the equations in Table A.5 are given in Figure A.19 using theidentification numbers listed in Table A.6. Again, the data used to construct Figure A.19 are compiledfrom average values taken from Guthrie [1, 2], Ulrich [3], Navarrete [6], Perry et al. [7], and Peters andTimmerhaus [8]. In addition, bare module factors for the equipment added to the third edition of the book(conveyors, crystallizers, dryers, dust collectors, filters, mixers, reactors, and screens) are givenseparately in Table A.7.
Table A.5 Equations for Bare Module Cost for Equipment Not Covered by Tables A.3 and A.4

Figure A.19 Bare Module Factors for Equipment in Table A.6 (Average Data from References [1, 2, 3, 6,7, and 8])
Table A.6 Identification of Material Factors for Equipment Listed in Table A.5 to Be Used withFigure A.19


Figure A.7 Bare Module Factors for Conveyors, Crystallizers, Dryers, Dust Collectors, Filters, Mixers,Reactors, and Screens

References
1. Guthrie, K. M., “Data and Techniques for Preliminary Capital Cost Estimating,” Chem.Eng., March 24, 1969, 114–142.
2. Guthrie, K. M., Process Plant Estimating Evaluation and Control (Solana Beach, CA:Craftsman Book Co., 1974).
3. Ulrich, G. D., A Guide to Chemical Engineering Process Design and Economics (NewYork: Wiley, 1984).
4. R-Books software marketed by Richardson Engineering Services, Inc., January 2001.
5. Section VIII, ASME Boiler and Pressure Vessel Code , ASME Boiler and Pressure Vessel

Committee, ASME, New York, 2000.
6. Navarrete, P. F., Planning, Estimating, and Control of Chemical Construction Projects(New York: Marcel Dekker, Inc., 1995).
7. Perry, R. H., D. W. Green, and J. O. Maloney, eds., Perry’s Chemical EngineeringHandbook, 7th ed. (New York: McGraw-Hill, 1997).
8. Peters, M. S., and K. D. Timmerhaus, Plant Design and Economics for ChemicalEngineers, 4th ed. (New York: McGraw-Hill, 1991).