appendix a european commerce and the 50 u.s. states: a
TRANSCRIPT

85 - THE TRANSATLANTIC ECONOMY 202085 - THE TRANSATLANTIC ECONOMY 2021
Appendix A
European Commerce and the 50 U.S. States:
A State-by-State Comparison

86 - THE TRANSATLANTIC ECONOMY 2021
Appendix A - European Commerce and the 50 U.S. States: A State-by-State Comparison
Alabama and Europe
On a country basis, U.K. companies operating in Alabama represented 14% of total foreign affiliate employment in Alabama, with U.K. multinationals supporting approximately 4,800 more jobs in 2018 than in 2010.
Sources: Bureau of Economic Analysis; U.S. Census Bureau; U.S. Department of Commerce; SelectUSA.
Jobs directly supported by European investment. Total European-related jobs are likely to be higher, because these figures do not include jobs created by trade flows, indirect employment effects through distributors or suppliers, or via non-equity arrangements such as strategic alliances, joint ventures, or other deals.
61,500Country Employment
Japan 22,200
United Kingdom 16,400
Germany 15,700
Canada 14,000
France 9,600
Employment within Alabama, 2018
Top Ten Exports to Europe, 2019 ($ millions) Top Ten Imports from Europe, 2019 ($ millions)
Country Exports ($ millions)
Germany 3,140
Belgium 565
France 499
Netherlands 460
Austria 381
Country Imports ($ millions)
Germany 3,106
France 1,460
United Kingdom 588
Italy 235
Hungary 172
Top European Export Markets, 2019 Top European Import Markets, 2019
$6.6 bn
Alabama Goods Exports to Europe, 2019
$7.2 bn
Alabama Goods Imports from Europe, 2019
65% of total exports from Alabama to Europe were transportation equipment, reflecting the state's linkages with European auto manufacturers.
Transportation equipment and machinery manufactures were the top product imports from Europe.
Transportation Equipment
Mining
Chemical Manufactures
Paper Products
Computers & Electronic Prod.
Machinery Manufactures
Wood Products
Fabricated Metal Products
Waste & Scrap
Plastic & Rubber Products
Transportation Equipment
Machinery Manufactures
Computers & Electronic Prod.
Chemical Manufactures
Elec. Equip., Appliances & Parts
Primary Metal Manufactures
Fabricated Metal Products
Plastic & Rubber Products
Misc. Manufactures
Processed Foods
European companies account for
51% of foreign affiliate jobs
Number of projects does not directly translate to value of projects or jobs added. Greenfield FDI is investment in new assets.
Sources of Greenfield Foreign Direct Investment (FDI)
Number of Greenfield Projects
GermanyJapan
South KoreaCanadaFrance
278Greenfield Projects (October 2010 - September 2020)
Since 2006: +19,400(+46.1%)
0 10 20 30 40 50 60 70 80
7%
22% of the total22% of the total22% of the total
16%16%
15%
8%
3,5743,574
1,105
534534
483483
350350
308308
300300
130
5050
4242
4,2714,271
828
378378
261261
162
127
106
94
79
69
2006 2018
Jobs
Trade
Investment
0 1 10 100 1,000 10,000 0 1 10 100 1,000 10,000

87 - THE TRANSATLANTIC ECONOMY 2021
Appendix A - European Commerce and the 50 U.S. States: A State-by-State Comparison
Alaska and Europe
On a country basis, U.K. companies operating in Alaska represented 22% of total foreign affiliate employment in Alaska, with U.K. multinationals supporting approximately 500 fewer jobs in 2018 than in 2010.
Sources: Bureau of Economic Analysis; U.S. Census Bureau; U.S. Department of Commerce; SelectUSA.
6,300Country Employment
Canada 5,200
United Kingdom 3,800
Japan 2,300
France 700
Germany 300
Employment within Alaska, 2018
Top Ten Exports to Europe, 2019 ($ millions) Top Ten Imports from Europe, 2019 ($ millions)
Country Exports ($ millions)
Netherlands 350
Germany 219
Spain 154
Belgium 124
France 77
Country Imports ($ millions)
Russia 38
United Kingdom 32
Finland 26
Germany 19
Italy 8
Top European Export Markets, 2019 Top European Import Markets, 2019
$1.2 bn
Alaska Goods Exports to Europe, 2019
$172.8 m
Alaska Goods Imports from Europe, 2019
The bulk of the state's exports consist of primary commodities.
Machinery made up about 23% of total Alaskan imports from Europe. Other large import categories from Europe include oil & gas, transportation equipment and computer & electronic products.
Fish & Marine Products
Mining
Primary Metal Manufactures
Transportation Equipment
Processed Foods
Machinery Manufactures
Computers & Electronic Prod.
Waste & Scrap
Fabricated Metal Products
Elec. Equip., Appliances & Parts
Machinery Manufactures
Oil & Gas Extraction
Transportation Equipment
Computers & Electronic Prod.
Fabricated Metal Products
Elec. Equip., Appliances & Parts
Chemical Manufactures
Paper Products
Misc. Manufactures
Plastic & Rubber Products
2006 2018
European companies account for
37% of foreign affiliate jobs
Number of projects does not directly translate to value of projects or jobs added. Greenfield FDI is investment in new assets.
Sources of Greenfield Foreign Direct Investment (FDI)
Number of Greenfield Projects
U.K.Norway
SpainAustralia
UAE
8Greenfield Projects (October 2010 - September 2020)
Since 2006: +1,300(+26.0%)
0 1 2 3 4
13%
38% of the total 38% of the total
25%
13%
13%
3939
3333
3232
21
14
10
66
3
2
2
595595
534534
25
7
77
3
1
1
0.9
0.8
Jobs directly supported by European investment. Total European-related jobs are likely to be higher, because these figures do not include jobs created by trade flows, indirect employment effects through distributors or suppliers, or via non-equity arrangements such as strategic alliances, joint ventures, or other deals.
Jobs
Trade
Investment
0 1 10 100 1,000 10,000 0 1 10 100 1,000 10,000
88 - THE TRANSATLANTIC ECONOMY 2021
Appendix A - European Commerce and the 50 U.S. States: A State-by-State Comparison
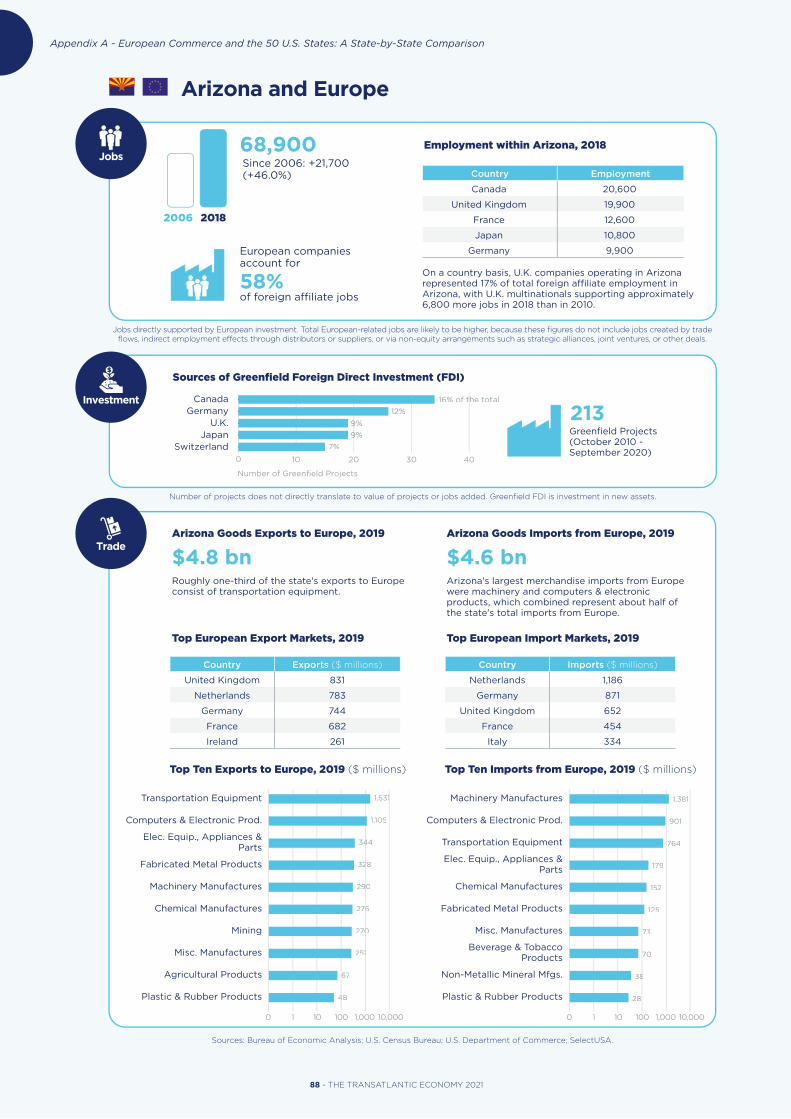
Arizona and Europe
On a country basis, U.K. companies operating in Arizona represented 17% of total foreign affiliate employment in Arizona, with U.K. multinationals supporting approximately 6,800 more jobs in 2018 than in 2010.
Sources: Bureau of Economic Analysis; U.S. Census Bureau; U.S. Department of Commerce; SelectUSA.
68,900Country Employment
Canada 20,600
United Kingdom 19,900
France 12,600
Japan 10,800
Germany 9,900
Employment within Arizona, 2018
Top Ten Exports to Europe, 2019 ($ millions) Top Ten Imports from Europe, 2019 ($ millions)
Country Exports ($ millions)
United Kingdom 831
Netherlands 783
Germany 744
France 682
Ireland 261
Country Imports ($ millions)
Netherlands 1,186
Germany 871
United Kingdom 652
France 454
Italy 334
Top European Export Markets, 2019 Top European Import Markets, 2019
$4.8 bnArizona Goods Exports to Europe, 2019
$4.6 bnArizona Goods Imports from Europe, 2019
Roughly one-third of the state's exports to Europe consist of transportation equipment.
Arizona's largest merchandise imports from Europe were machinery and computers & electronic products, which combined represent about half of the state's total imports from Europe.
Transportation Equipment
Computers & Electronic Prod.
Elec. Equip., Appliances & Parts
Fabricated Metal Products
Machinery Manufactures
Chemical Manufactures
Mining
Misc. Manufactures
Agricultural Products
Plastic & Rubber Products
Machinery Manufactures
Computers & Electronic Prod.
Transportation Equipment
Elec. Equip., Appliances & Parts
Chemical Manufactures
Fabricated Metal Products
Misc. Manufactures
Beverage & Tobacco Products
Non-Metallic Mineral Mfgs.
Plastic & Rubber Products
2006 2018
European companies account for
58% of foreign affiliate jobs
Number of projects does not directly translate to value of projects or jobs added. Greenfield FDI is investment in new assets.
Sources of Greenfield Foreign Direct Investment (FDI)
Number of Greenfield Projects
CanadaGermany
U.K.Japan
Switzerland
213Greenfield Projects (October 2010 - September 2020)
Since 2006: +21,700(+46.0%)
0 10 20 30 40
7%
16% of the total16% of the total
12%
9%9%
9%9%
1,381
901
764
179
152
125
73
70
3838
28
1,5311,531
1,105
344344
328328
290290
276276
270270
251251
67
4848
Jobs directly supported by European investment. Total European-related jobs are likely to be higher, because these figures do not include jobs created by trade flows, indirect employment effects through distributors or suppliers, or via non-equity arrangements such as strategic alliances, joint ventures, or other deals.
Jobs
Trade
Investment
0 1 10 100 1,000 10,000 0 1 10 100 1,000 10,000

89 - THE TRANSATLANTIC ECONOMY 2021
Appendix A - European Commerce and the 50 U.S. States: A State-by-State Comparison
Arkansas and Europe
On a country basis, U.K. companies operating in Arkansas represented 13% of total foreign affiliate employment in Arkansas, with U.K. multinationals supporting approximately 2,700 more jobs in 2018 than in 2010.
Sources: Bureau of Economic Analysis; U.S. Census Bureau; U.S. Department of Commerce; SelectUSA.
28,900Country Employment
Japan 6,500
United Kingdom 6,400
France 6,100
Switzerland 4,800
Canada 4,100
Employment within Arkansas, 2018
Top Ten Exports to Europe, 2019 ($ millions) Top Ten Imports from Europe, 2019 ($ millions)
Country Exports ($ millions)
France 711
Belgium 152
United Kingdom 140
Germany 100
Netherlands 97
Country Imports ($ millions)
France 1,395
Germany 369
United Kingdom 145
Italy 129
Spain 54
Top European Export Markets, 2019 Top European Import Markets, 2019
$1.6 bn
Arkansas Goods Exports to Europe, 2019
$2.4 bn
Arkansas Goods Imports from Europe, 2019
Transportation equipment made up 53% of exports to Europe in 2019.
Transportation equipment is the top imported product from Europe, representing 63% of total imports.
Transportation Equipment
Chemical Manufactures
Paper Products
Plastic & Rubber Products
Machinery Manufactures
Processed Foods
Elec. Equip., Appliances & Parts
Fabricated Metal Products
Computers & Electronic Prod.
Beverage & Tobacco Products
Transportation Equipment
Machinery Manufactures
Fabricated Metal Products
Primary Metal Manufactures
Elec. Equip., Appliances & Parts
Chemical Manufactures
Computers & Electronic Prod.
Misc. Manufactures
Beverage & Tobacco Products
Plastic & Rubber Products
European companies account for
60% of foreign affiliate jobs
Number of projects does not directly translate to value of projects or jobs added. Greenfield FDI is investment in new assets.
Sources of Greenfield Foreign Direct Investment (FDI)
Number of Greenfield Projects
GermanyChinaJapan
FranceIndia
59Greenfield Projects (October 2010 - September 2020)
Since 2006: +5,200(+21.9%)
0 2 4 6 8 10 12 14
5%
22% of the total22% of the total
10%
10%
10%
1,5491,549
225225
125
109
109
6363
4848
20
20
19
873
199
168
97
74
5959
3333
25
22
20
Jobs directly supported by European investment. Total European-related jobs are likely to be higher, because these figures do not include jobs created by trade flows, indirect employment effects through distributors or suppliers, or via non-equity arrangements such as strategic alliances, joint ventures, or other deals.
2006 2018
Jobs
Trade
Investment
0 1 10 100 1,000 10,000 0 1 10 100 1,000 10,000

90 - THE TRANSATLANTIC ECONOMY 2021
Appendix A - European Commerce and the 50 U.S. States: A State-by-State Comparison
California and Europe
On a country basis, U.K. companies operating in California represented 15% of total foreign affiliate employment in California, with U.K. multinationals supporting approximately 41,900 more jobs in 2018 than in 2010.
Sources: Bureau of Economic Analysis; U.S. Census Bureau; U.S. Department of Commerce; SelectUSA.
490,700Country Employment
United Kingdom 126,400
Japan 115,200
France 97,300
Germany 85,600
Canada 75,000
Employment within California, 2018
Top Ten Exports to Europe, 2019 ($ millions) Top Ten Imports from Europe, 2019 ($ millions)
Country Exports ($ millions)
Germany 6,439
Netherlands 6,409
Belgium 6,341
United Kingdom 5,263
France 2,947
Country Imports ($ millions)
Germany 11,309
United Kingdom 6,259
France 4,819
Italy 4,155
Switzerland 2,506
Top European Export Markets, 2019 Top European Import Markets, 2019
$38.9 bn
California Goods Exports to Europe, 2019
$45.3 bn
California Goods Imports from Europe, 2019
20% of California's exports to Europe in 2019 consisted of high-tech goods (computers & electronic products).
Transportation equipment was the top product import, representing 32% of the state's total imports from Europe.
2006 2018
European companies account for
58% of foreign affiliate jobs
Number of projects does not directly translate to value of projects or jobs added. Greenfield FDI is investment in new assets.
Sources of Greenfield Foreign Direct Investment (FDI)
Number of Greenfield Projects
U.K.Germany
CanadaJapanChina
2,532Greenfield Projects (October 2010 - September 2020)
Since 2006: +145,200(+42.0%)
0 100 200 300 400 500 600
7%7%
20% of the total20% of the total
9%
8%
7%7%
Computers & Electronic Prod.
Transportation Equipment
Chemical Manufactures
Agricultural Products
Misc. Manufactures
Machinery Manufactures
Used Merchandise
Elec. Equip., Appliances & Parts
Fabricated Metal Products
Primary Metal Manufactures
Transportation Equipment
Computers & Electronic Prod.
Machinery Manufactures
Chemical Manufactures
Beverage & Tobacco Products
Misc. Manufactures
Processed Foods
Petroleum & Coal Products
Used Merchandise
Primary Metal Manufactures
14,41914,419
3,7733,773
3,3213,321
2,9742,974
2,5662,566
2,1522,152
1,7521,752
1,6881,688
1,4291,429
1,3941,394
7,9077,907
7,6347,634
5,1055,105
3,7583,758
3,7283,728
2,4462,446
1,7521,752
1,7141,714
907
663663
Jobs directly supported by European investment. Total European-related jobs are likely to be higher, because these figures do not include jobs created by trade flows, indirect employment effects through distributors or suppliers, or via non-equity arrangements such as strategic alliances, joint ventures, or other deals.
0 1 10 100 1,000 10,000 100,0000 1 10 100 1,000 10,000 100,000
Jobs
Trade
Investment

91 - THE TRANSATLANTIC ECONOMY 2021
Appendix A - European Commerce and the 50 U.S. States: A State-by-State Comparison
Colorado and Europe
On a country basis, U.K. companies operating in Colorado represented 17% of total foreign affiliate employment in Colorado, with U.K. multinationals supporting approximately 7,700 more jobs in 2018 than in 2010.
Sources: Bureau of Economic Analysis; U.S. Census Bureau; U.S. Department of Commerce; SelectUSA.
72,900Country Employment
United Kingdom 20,900
Canada 19,500
France 10,300
Germany 7,800
Japan 7,800
Employment within Colorado, 2018
Top Ten Exports to Europe, 2019 ($ millions) Top Ten Imports from Europe, 2019 ($ millions)
Country Exports ($ millions)
Netherlands 331
Germany 280
United Kingdom 243
Switzerland 201
France 170
Country Imports ($ millions)
Switzerland 924
Germany 609
United Kingdom 256
Italy 231
France 227
Top European Export Markets, 2019 Top European Import Markets, 2019
$1.8 bn
Colorado Goods Exports to Europe, 2019
$3.5 bn
Colorado Goods Imports from Europe, 2019
About 22% of the state's exports to Europe consisted of high-tech goods (computers & electronic products) in 2019.
Colorado's largest imports from Europe were machinery and transportation equipment.
Computers & Electronic Prod.
Misc. Manufactures
Machinery Manufactures
Chemical Manufactures
Transportation Equipment
Mining
Fabricated Metal Products
Elec. Equip., Appliances & Parts
Oil & Gas Extraction
Plastic & Rubber Products
Machinery Manufactures
Transportation Equipment
Misc. Manufactures
Computers & Electronic Prod.
Chemical Manufactures
Fabricated Metal Products
Elec. Equip., Appliances & Parts
Beverage & Tobacco Products
Plastic & Rubber Products
Processed Foods
2006 2018
European companies account for
60% of foreign affiliate jobs
Number of projects does not directly translate to value of projects or jobs added. Greenfield FDI is investment in new assets.
Sources of Greenfield Foreign Direct Investment (FDI)
Number of Greenfield Projects
U.K.Canada
GermanySwitzerland
Australia
229Greenfield Projects (October 2010 - September 2020)
Since 2006: +25,800(+54.8%)
0 10 20 30 40 50
8%8%
15% of the total15% of the total
14%
9%
9%
744
627627
540540
469469
224224
157
138
108
6262
4545
396396
250250
240240
213
181
142
91
82
4848
33
Jobs directly supported by European investment. Total European-related jobs are likely to be higher, because these figures do not include jobs created by trade flows, indirect employment effects through distributors or suppliers, or via non-equity arrangements such as strategic alliances, joint ventures, or other deals.
Jobs
Trade
Investment
0 1 10 100 1,000 10,000 0 1 10 100 1,000 10,000

92 - THE TRANSATLANTIC ECONOMY 2021
Appendix A - European Commerce and the 50 U.S. States: A State-by-State Comparison
Connecticut and Europe
On a country basis, U.K. companies operating in Connecticut represented 19% of total foreign affiliate employment in Connecticut, with U.K. multinationals supporting approximately 3,600 more jobs in 2018 than in 2010.
Sources: Bureau of Economic Analysis; U.S. Census Bureau; U.S. Department of Commerce; SelectUSA.
87,900Country Employment
United Kingdom 22,100
Netherlands 18,100
Germany 13,000
Japan 8,000
Switzerland 7,800
Employment within Connecticut, 2018
Top Ten Exports to Europe, 2019 ($ millions) Top Ten Imports from Europe, 2019 ($ millions)
Country Exports ($ millions)
Germany 2,542
France 1,860
United Kingdom 1,452
Netherlands 775
Poland 228
Country Imports ($ millions)
Germany 1,327
United Kingdom 1,216
France 838
Netherlands 792
Italy 490
Top European Export Markets, 2019 Top European Import Markets, 2019
$8.2 bn
Connecticut Goods Exports to Europe, 2019
$7.0 bn
Connecticut Goods Imports from Europe, 2019
Exports are heavily skewed towards transportation equipment, which represent 58% of the state's total exports to Europe.
Machinery was Connecticut's main import from Europe, representing 17% of the state's total merchandise imports from Europe.
Transportation Equipment
Machinery Manufactures
Computers & Electronic Prod.
Chemical Manufactures
Fabricated Metal Products
Elec. Equip., Appliances & Parts
Misc. Manufactures
Plastic & Rubber Products
Waste & Scrap
Used Merchandise
Machinery Manufactures
Petroleum & Coal Products
Transportation Equipment
Chemical Manufactures
Computers & Electronic Prod.
Misc. Manufactures
Fabricated Metal Products
Elec. Equip., Appliances & Parts
Primary Metal Manufactures
Beverage & Tobacco Products
European companies account for
76% of foreign affiliate jobs
Number of projects does not directly translate to value of projects or jobs added. Greenfield FDI is investment in new assets.
Sources of Greenfield Foreign Direct Investment (FDI)
Number of Greenfield Projects
UKGermany
CanadaItaly
France
106Greenfield Projects (October 2010 - September 2020)
Since 2006: +10,600(+13.7%)
0 5 10 15 20 25
6%
17% of the total17% of the total
17%
14%
6%
1,163
883
716
659659
476476
472472
464464
277277
258258
224224
4,7144,714
1,154
417417
353353
331331
260260
137
119
84
81
Jobs directly supported by European investment. Total European-related jobs are likely to be higher, because these figures do not include jobs created by trade flows, indirect employment effects through distributors or suppliers, or via non-equity arrangements such as strategic alliances, joint ventures, or other deals.
2006 2018
Jobs
Trade
Investment
0 1 10 100 1,000 10,000 0 1 10 100 1,000 10,000

93 - THE TRANSATLANTIC ECONOMY 2021
Appendix A - European Commerce and the 50 U.S. States: A State-by-State Comparison
Delaware and Europe
On a country basis, U.K. companies operating in Delaware represented 31% of total foreign affiliate employment in Delaware, with U.K. multinationals supporting approximately 1,800 fewer jobs in 2018 than in 2010.
Sources: Bureau of Economic Analysis; U.S. Census Bureau; U.S. Department of Commerce; SelectUSA.
18,300Country Employment
United Kingdom 7,600
Germany 3,200
Canada 2,400
Netherlands 2,300
France 1,600
Employment within Delaware, 2018
Top Ten Exports to Europe, 2019 ($ millions) Top Ten Imports from Europe, 2019 ($ millions)
Country Exports ($ millions)
United Kingdom 542
Germany 224
Belgium 171
Switzerland 141
France 137
Country Imports ($ millions)
Switzerland 946
Russia 854
United Kingdom 596
France 451
Kazakhstan 334
Top European Export Markets, 2019 Top European Import Markets, 2019
$1.4 bn
Delaware Goods Exports to Europe, 2019
$5.0 bn
Delaware Goods Imports from Europe, 2019
Chemicals are Delaware's primary export to Europe, representing half of the state's total exports.
Chemicals are also Delaware's top import, also accounting for half of the state's total imports from Europe.
Chemical Manufactures
Transportation Equipment
Computers & Electronic Prod.
Primary Metal Manufactures
Machinery Manufactures
Misc. Manufactures
Petroleum & Coal Products
Used Merchandise
Plastic & Rubber Products
Processed Foods
Chemical Manufactures
Oil & Gas Extraction
Petroleum & Coal Products
Elec. Equip., Appliances & Parts
Machinery Manufactures
Used Merchandise
Transportation Equipment
Computers & Electronic Prod.
Processed Foods
Primary Metal Manufactures
European companies account for
74% of foreign affiliate jobs
Number of projects does not directly translate to value of projects or jobs added. Greenfield FDI is investment in new assets.
Sources of Greenfield Foreign Direct Investment (FDI)
Number of Greenfield Projects
GermanyU.K.
SwitzerlandIndia
Japan
52Greenfield Projects (October 2010 - September 2020)
Since 2006: -400(-2.1%)
0 2 4 6 8 10 12
6%
17% of the total17% of the total17% of the total
11%
8%
8%
2,4312,431
1,3961,396
255255
107
106
89
82
67
6060
6060
715
163
143
127
6767
5252
4848
4646
3838
15
Jobs directly supported by European investment. Total European-related jobs are likely to be higher, because these figures do not include jobs created by trade flows, indirect employment effects through distributors or suppliers, or via non-equity arrangements such as strategic alliances, joint ventures, or other deals.
2006 2018
Jobs
Trade
Investment
0 1 10 100 1,000 10,000 0 1 10 100 1,000 10,000

94 - THE TRANSATLANTIC ECONOMY 2021
Appendix A - European Commerce and the 50 U.S. States: A State-by-State Comparison
Florida and Europe
On a country basis, U.K. companies operating in Florida represented 19% of total foreign affiliate employment in Florida, with U.K. multinationals supporting approximately 26,200 more jobs in 2018 than in 2010.
Sources: Bureau of Economic Analysis; U.S. Census Bureau; U.S. Department of Commerce; SelectUSA.
229,500Country Employment
United Kingdom 67,800
Canada 53,500
Germany 39,700
France 37,600
Switzerland 29,100
Employment within Florida, 2018
Top Ten Exports to Europe, 2019 ($ millions) Top Ten Imports from Europe, 2019 ($ millions)
Country Exports ($ millions)
United Kingdom 1,894
Germany 1,830
Italy 1,280
Netherlands 1,016
France 843
Country Imports ($ millions)
Germany 4,022
France 3,896
United Kingdom 2,770
Italy 2,355
Spain 1,482
Top European Export Markets, 2019 Top European Import Markets, 2019
$10.4 bn
Florida Goods Exports to Europe, 2019
$22.7 bn
Florida Goods Imports from Europe, 2019
Transportation Equipment accounts for about 29% of Florida's total exports to Europe.
Florida's imports from Europe are concentrated in transportation equipment, representing a 24% share of the state's total imports from Europe in 2019.
Transportation Equipment
Computers & Electronic Prod.
Misc. Manufactures
Chemical Manufactures
Machinery Manufactures
Primary Metal Manufactures
Used Merchandise
Elec. Equip., Appliances & Parts
Fabricated Metal Products
Wood Products
Transportation Equipment
Chemical Manufactures
Machinery Manufactures
Beverage & Tobacco Products
Computers & Electronic Prod.
Petroleum & Coal Products
Elec. Equip., Appliances & Parts
Non-Metallic Mineral Mfgs.
Misc. Manufactures
Processed Foods
European companies account for
64% of foreign affiliate jobs
Number of projects does not directly translate to value of projects or jobs added. Greenfield FDI is investment in new assets.
Sources of Greenfield Foreign Direct Investment (FDI)
Number of Greenfield Projects
U.K.Spain
GermanyCanadaFrance
809Greenfield Projects (October 2010 - September 2020)
Since 2006: +69,200(+43.2%)
0 20 40 60 80 100 120 140 160
6%
19% of the total19% of the total
11%
10%
8%
5,5445,544
2,8222,822
1,8501,850
1,6601,660
1,6361,636
871
828
793
779
732
3,0633,063
1,331
885
843
701701
686686
556556
408408
381381
330330
Jobs directly supported by European investment. Total European-related jobs are likely to be higher, because these figures do not include jobs created by trade flows, indirect employment effects through distributors or suppliers, or via non-equity arrangements such as strategic alliances, joint ventures, or other deals.
2006 2018
Jobs
Trade
Investment
0 1 10 100 1,000 10,000 0 1 10 100 1,000 10,000

95 - THE TRANSATLANTIC ECONOMY 2021
Appendix A - European Commerce and the 50 U.S. States: A State-by-State Comparison
Georgia and Europe
On a country basis, U.K. companies operating in Georgia represented 13% of total foreign affiliate employment in Georgia, with U.K. multinationals supporting approximately 14,300 more jobs in 2018 than in 2010.
Sources: Bureau of Economic Analysis; U.S. Census Bureau; U.S. Department of Commerce; SelectUSA.
162,300Country Employment
Japan 37,900
United Kingdom 37,600
Canada 35,200
Germany 33,400
France 23,300
Employment within Georgia, 2018
Top Ten Exports to Europe, 2019 ($ millions) Top Ten Imports from Europe, 2019 ($ millions)
Country Exports ($ millions)
Germany 2,776
United Kingdom 1,540
Netherlands 1,332
Belgium 789
France 691
Country Imports ($ millions)
Germany 9,500
United Kingdom 5,495
France 2,684
Italy 2,091
Ireland 1,218
Top European Export Markets, 2019 Top European Import Markets, 2019
$11.3 bn
Georgia Goods Exports to Europe, 2019
$29.5 bn
Georgia Goods Imports from Europe, 2019
Over 37% of Georgia's exports to Europe consist of transportation equipment.
Transportation equipment, chemicals and machinery manufactures were the top product imports from Europe.
Transportation Equipment
Machinery Manufactures
Computers & Electronic Prod.
Misc. Manufactures
Chemical Manufactures
Paper Products
Elec. Equip., Appliances & Parts
Used Merchandise
Fabricated Metal Products
Wood Products
Transportation Equipment
Chemical Manufactures
Machinery Manufactures
Computers & Electronic Prod.
Misc. Manufactures
Fabricated Metal Products
Elec. Equip., Appliances & Parts
Beverage & Tobacco Products
Plastic & Rubber Products
Primary Metal Manufactures
2006 2018
European companies account for
58% of foreign affiliate jobs
Number of projects does not directly translate to value of projects or jobs added. Greenfield FDI is investment in new assets.
Sources of Greenfield Foreign Direct Investment (FDI)
Number of Greenfield Projects
GermanyJapan
U.K.Canada
South Korea
615Greenfield Projects (October 2010 - September 2020)
Since 2006: +50,100(+44.7%)
0 20 40 60 80 100 120 140
6%6%
17% of the total17% of the total17% of the total
13%
10%
7%
0 1 10 100 1,000 10,000 100,000
10,541 10,541
5,031 5,031
3,642 3,642
1,520 1,520
1,308 1,308
1,118 1,118
662 662
527 527
515 515
485 485
0 1 10 100 1,000 10,000 100,000
4,204 4,204
1,290 1,290
1,002 1,002
875
850
714
353 353
345 345
310 310
266 266
Jobs directly supported by European investment. Total European-related jobs are likely to be higher, because these figures do not include jobs created by trade flows, indirect employment effects through distributors or suppliers, or via non-equity arrangements such as strategic alliances, joint ventures, or other deals.
Trade
Investment
Jobs

96 - THE TRANSATLANTIC ECONOMY 2021
Appendix A - European Commerce and the 50 U.S. States: A State-by-State Comparison
Hawaii and Europe
On a country basis, French companies operating in Hawaii represented 10% of total foreign affiliate employment in Hawaii, with French multinationals supporting approximately 600 fewer jobs in 2018 than in 2010.
Sources: Bureau of Economic Analysis; U.S. Census Bureau; U.S. Department of Commerce; SelectUSA.
13,800Country Employment
Japan 19,400
France 3,800
United Kingdom 2,900
Germany 1,600
Canada 1,400
Employment within Hawaii, 2018
Top Ten Exports to Europe, 2019 ($ millions) Top Ten Imports from Europe, 2019 ($ millions)
Country Exports ($ millions)
United Kingdom 10
Germany 3
Switzerland 2
Netherlands 2
France 2
Country Imports ($ millions)
Russia 580
France 183
Italy 51
Germany 43
Switzerland 25
Top European Export Markets, 2019 Top European Import Markets, 2019
$24.6 m
Hawaii Goods Exports to Europe, 2019
$971.3 m
Hawaii Goods Imports from Europe, 2019
Transportation equipment and computer & electronic products led the way as top export categories.
Hawaii's top European import category was oil & gas, which made up 60% of total imports in 2019, followed by transportation equipment.
Transportation Equipment
Computers & Electronic Prod.
Misc. Manufactures
Fish & Marine Products
Leather & Related Goods
Used Merchandise
Beverage & Tobacco Products
Animal Production
Elec. Equip., Appliances & Parts
Machinery Manufactures
Oil & Gas Extraction
Transportation Equipment
Computers & Electronic Prod.
Machinery Manufactures
Misc. Manufactures
Beverage & Tobacco Products
Leather & Related Goods
Elec. Equip., Appliances & Parts
Furniture & Related Products
Fabricated Metal Products
European companies account for
35% of foreign affiliate jobs
Number of projects does not directly translate to value of projects or jobs added. Greenfield FDI is investment in new assets.
Sources of Greenfield Foreign Direct Investment (FDI)
Number of Greenfield Projects
AustraliaJapan
FranceCanada
U.K.
22Greenfield Projects (October 2010 - September 2020)
Since 2006: +5,300(+62.4%)
0 2 4 6 8
9%
32% of the total32% of the total
18%
14%
9%
585 585
178 178
31 31
27 27
26 26
21
18
16
10
8
10
6 6
2 2
1 1 1
0.9 0.9 0.9
0.8 0.8 0.8
0.6 0.6 0.6
0.5 0.5 0.5
0.5 0.5 0.5
0.4 0.4 0.4
Jobs directly supported by European investment. Total European-related jobs are likely to be higher, because these figures do not include jobs created by trade flows, indirect employment effects through distributors or suppliers, or via non-equity arrangements such as strategic alliances, joint ventures, or other deals.
2006 2018
Jobs
Trade
Investment
0 1 10 100 1,000 10,000 0 1 10 100 1,000 10,000

97 - THE TRANSATLANTIC ECONOMY 2021
Appendix A - European Commerce and the 50 U.S. States: A State-by-State Comparison
Idaho and Europe
On a country basis, French companies operating in Idaho represented 16% of total foreign affiliate employment in Idaho, with French multinationals supporting approximately 100 more jobs in 2018 than in 2010.
Sources: Bureau of Economic Analysis; U.S. Census Bureau; U.S. Department of Commerce; SelectUSA.
12,500Country Employment
Canada 3,200
France 2,800
Germany 2,500
United Kingdom 2,200
Switzerland 1,000
Employment within Idaho, 2018
Top Ten Exports to Europe, 2019 ($ millions) Top Ten Imports from Europe, 2019 ($ millions)
Country Exports ($ millions)
United Kingdom 111
Netherlands 91
Germany 49
Spain 26
France 20
Country Imports ($ millions)
Germany 75
Italy 46
Greece 42
United Kingdom 34
Netherlands 34
Top European Export Markets, 2019 Top European Import Markets, 2019
$409.3 m
Idaho Goods Exports to Europe, 2019
$394.7 m
Idaho Goods Imports from Europe, 2019
Computers & electronic products made up almost one-third of total exports to Europe.
Computers & electronic products represented 37% of the state's total imports from Europe.
Computers & Electronic Prod.
Agricultural Products
Machinery Manufactures
Processed Foods
Transportation Equipment
Chemical Manufactures
Misc. Manufactures
Fabricated Metal Products
Elec. Equip., Appliances & Parts
Beverage & Tobacco Products
Computers & Electronic Prod.
Machinery Manufactures
Elec. Equip., Appliances & Parts
Agricultural Products
Fabricated Metal Products
Transportation Equipment
Chemical Manufactures
Misc. Manufactures
Plastic & Rubber Products
Processed Foods
2006 2018
European companies account for
71% of foreign affiliate jobs
Number of projects does not directly translate to value of projects or jobs added. Greenfield FDI is investment in new assets.
Sources of Greenfield Foreign Direct Investment (FDI)
Number of Greenfield Projects
CanadaGermany
FranceNetherlands
Japan
40Greenfield Projects (October 2010 - September 2020)
Since 2006: +1,800(+16.8%)
0 2 4 6 8 10
15% of the total15% of the total
12%
10%
10%
10%
145
104
25 25
18
17
16
12
10
6 6
5 5
131
60 60
49 49
37 37
29 29
27
23
12
12
4
Jobs directly supported by European investment. Total European-related jobs are likely to be higher, because these figures do not include jobs created by trade flows, indirect employment effects through distributors or suppliers, or via non-equity arrangements such as strategic alliances, joint ventures, or other deals.
Trade
Investment
Jobs
0 1 10 100 1,000 10,000 0 1 10 100 1,000 10,000

98 - THE TRANSATLANTIC ECONOMY 2021
Appendix A - European Commerce and the 50 U.S. States: A State-by-State Comparison
Illinois and Europe
On a country basis, U.K. companies operating in Illinois represented 20% of total foreign affiliate employment in Illinois, with U.K. multinationals supporting approximately 24,600 more jobs in 2018 than in 2010.
Sources: Bureau of Economic Analysis; U.S. Census Bureau; U.S. Department of Commerce; SelectUSA.
240,300Country Employment
United Kingdom 75,500
Germany 47,600
Japan 45,100
Canada 37,800
France 33,700
Employment within Illinois, 2018
Top Ten Exports to Europe, 2019 ($ millions) Top Ten Imports from Europe, 2019 ($ millions)
Country Exports ($ millions)
Germany 3,309
United Kingdom 1,632
Netherlands 1,199
Belgium 1,104
France 1,006
Country Imports ($ millions)
Germany 8,246
Netherlands 5,518
France 3,872
Italy 3,659
United Kingdom 3,047
Top European Export Markets, 2019 Top European Import Markets, 2019
$11.5 bn
Illinois Goods Exports to Europe, 2019
$33.5 bn
Illinois Goods Imports from Europe, 2019
Chemicals and machinery are top exports, followed by computers & electronic products and transportation equipment.
Chemicals, transportation equipment, machinery and computers are also the state's top imports from Europe.
Chemical Manufactures
Machinery Manufactures
Computers & Electronic Prod.
Transportation Equipment
Elec. Equip., Appliances & Parts
Fabricated Metal Products
Misc. Manufactures
Waste & Scrap
Used Merchandise
Processed Foods
Chemical Manufactures
Transportation Equipment
Machinery Manufactures
Computers & Electronic Prod.
Primary Metal Manufactures
Elec. Equip., Appliances & Parts
Fabricated Metal Products
Processed Foods
Plastic & Rubber Products
Beverage & Tobacco Products
2006 2018
European companies account for
64% of foreign affiliate jobs
Number of projects does not directly translate to value of projects or jobs added. Greenfield FDI is investment in new assets.
Sources of Greenfield Foreign Direct Investment (FDI)
Number of Greenfield Projects
U.K.Germany
JapanCanadaFrance
632Greenfield Projects (October 2010 - September 2020)
Since 2006: +69,000(+40.3%)
0 20 40 60 80 100 120 140
6%
20% of the total20% of the total
13%
9%
8%8%
Jobs directly supported by European investment. Total European-related jobs are likely to be higher, because these figures do not include jobs created by trade flows, indirect employment effects through distributors or suppliers, or via non-equity arrangements such as strategic alliances, joint ventures, or other deals.
0 1 10 100 1,000 10,000 100,0000 1 10 100 1,000 10,000 100,000
7,696 7,696
4,777 4,777
4,538 4,538
1,832 1,832
1,488 1,488
1,276 1,276
1,163 1,163
1,020 1,020
739
546 546
3,215 3,215
1,896 1,896
1,648 1,648
1,159 1,159
818
686
363 363
297 297
275 275
253 253
Jobs
Trade
Investment

99 - THE TRANSATLANTIC ECONOMY 2021
Appendix A - European Commerce and the 50 U.S. States: A State-by-State Comparison
Indiana and Europe
On a country basis, U.K. companies operating in Indiana represented 17% of total foreign affiliate employment in Indiana, with U.K. multinationals supporting approximately 5,900 more jobs in 2018 than in 2010.
Sources: Bureau of Economic Analysis; U.S. Census Bureau; U.S. Department of Commerce; SelectUSA.
126,400Country Employment
Japan 57,500
United Kingdom 37,500
France 30,700
Germany 18,000
Canada 17,500
Employment within Indiana, 2018
Top Ten Exports to Europe, 2019 ($ millions) Top Ten Imports from Europe, 2019 ($ millions)
Country Exports ($ millions)
Germany 1,406
Netherlands 1,397
France 1,387
Italy 1,260
Belgium 1,129
Country Imports ($ millions)
Ireland 9,175
Denmark 5,934
Germany 4,137
France 2,853
Switzerland 2,213
Top European Export Markets, 2019 Top European Import Markets, 2019
$9.6 bn
Indiana Goods Exports to Europe, 2019
$29.2 bn
Indiana Goods Imports from Europe, 2019
Trade in chemicals represented 43% of total exports. Chemicals were also the state's largest import from Europe, representing 63% of total imports.
European companies account for
59% of foreign affiliate jobs
Number of projects does not directly translate to value of projects or jobs added. Greenfield FDI is investment in new assets.
Sources of Greenfield Foreign Direct Investment (FDI)
Number of Greenfield Projects
U.K.Germany
JapanCanadaFrance
414Greenfield Projects (October 2010 - September 2020)
Since 2006: +28,500(+29.1%)
0 20 40 60 80 100 120 140
5%
29% of the total29% of the total
14%
8%8%
7%
Chemical Manufactures
Transportation Equipment
Misc. Manufactures
Machinery Manufactures
Computers & Electronic Prod.
Plastic & Rubber Products
Elec. Equip., Appliances & Parts
Primary Metal Manufactures
Processed Foods
Fabricated Metal Products
Chemical Manufactures
Transportation Equipment
Misc. Manufactures
Machinery Manufactures
Computers & Electronic Prod.
Plastic & Rubber Products
Primary Metal Manufactures
Fabricated Metal Products
Elec. Equip., Appliances & Parts
Processed Foods
0 1 10 100 1,000 10,000 100,0000 1 10 100 1,000 10,000 100,000
18,320 18,320
2,111 2,111
2,020 2,020
1,523 1,523
1,210 1,210
492 492
410 410
309 309
277 277
113
4,098 4,098
1,740 1,740
1,302 1,302
658 658
499 499
287 287
274 274
167 167
153 153
134 134
Jobs directly supported by European investment. Total European-related jobs are likely to be higher, because these figures do not include jobs created by trade flows, indirect employment effects through distributors or suppliers, or via non-equity arrangements such as strategic alliances, joint ventures, or other deals.
Trade
Investment
Jobs
2006 2018
100 - THE TRANSATLANTIC ECONOMY 2021
Appendix A - European Commerce and the 50 U.S. States: A State-by-State Comparison
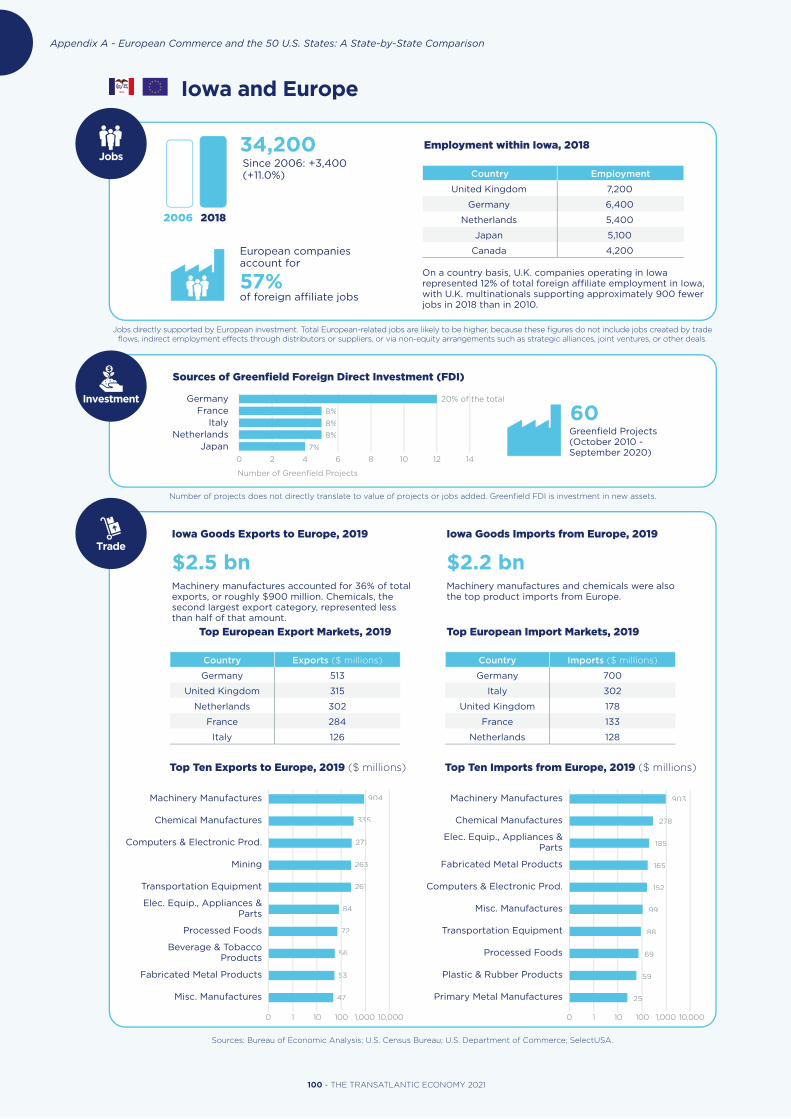
Iowa and Europe
On a country basis, U.K. companies operating in Iowa represented 12% of total foreign affiliate employment in Iowa, with U.K. multinationals supporting approximately 900 fewer jobs in 2018 than in 2010.
Sources: Bureau of Economic Analysis; U.S. Census Bureau; U.S. Department of Commerce; SelectUSA.
34,200Country Employment
United Kingdom 7,200
Germany 6,400
Netherlands 5,400
Japan 5,100
Canada 4,200
Employment within Iowa, 2018
Top Ten Exports to Europe, 2019 ($ millions) Top Ten Imports from Europe, 2019 ($ millions)
Country Exports ($ millions)
Germany 513
United Kingdom 315
Netherlands 302
France 284
Italy 126
Country Imports ($ millions)
Germany 700
Italy 302
United Kingdom 178
France 133
Netherlands 128
Top European Export Markets, 2019 Top European Import Markets, 2019
$2.5 bn
Iowa Goods Exports to Europe, 2019
$2.2 bn
Iowa Goods Imports from Europe, 2019
Machinery manufactures accounted for 36% of total exports, or roughly $900 million. Chemicals, the second largest export category, represented less than half of that amount.
Machinery manufactures and chemicals were also the top product imports from Europe.
Machinery Manufactures
Chemical Manufactures
Computers & Electronic Prod.
Mining
Transportation Equipment
Elec. Equip., Appliances & Parts
Processed Foods
Beverage & Tobacco Products
Fabricated Metal Products
Misc. Manufactures
Machinery Manufactures
Chemical Manufactures
Elec. Equip., Appliances & Parts
Fabricated Metal Products
Computers & Electronic Prod.
Misc. Manufactures
Transportation Equipment
Processed Foods
Plastic & Rubber Products
Primary Metal Manufactures
European companies account for
57% of foreign affiliate jobs
Number of projects does not directly translate to value of projects or jobs added. Greenfield FDI is investment in new assets.
Sources of Greenfield Foreign Direct Investment (FDI)
Number of Greenfield Projects
GermanyFrance
ItalyNetherlands
Japan
60Greenfield Projects (October 2010 - September 2020)
Since 2006: +3,400(+11.0%)
0 2 4 6 8 10 12 14
7%
20% of the total20% of the total
8%
8%
8%
903
278 278
185 185
165
152
99
88
69 69
59 59
25 25
904
335 335
271 271
263 263
261 261
84
72
56 56
53 53
47 47
Jobs directly supported by European investment. Total European-related jobs are likely to be higher, because these figures do not include jobs created by trade flows, indirect employment effects through distributors or suppliers, or via non-equity arrangements such as strategic alliances, joint ventures, or other deals.
2006 2018
Jobs
Trade
Investment
0 1 10 100 1,000 10,000 0 1 10 100 1,000 10,000

101 - THE TRANSATLANTIC ECONOMY 2021
Appendix A - European Commerce and the 50 U.S. States: A State-by-State Comparison
Kansas and Europe
On a country basis, U.K. companies operating in Kansas represented 12% of total foreign affiliate employment in Kansas, with U.K. multinationals supporting approximately 2,800 more jobs in 2018 than in 2010.
Sources: Bureau of Economic Analysis; U.S. Census Bureau; U.S. Department of Commerce; SelectUSA.
37,200Country Employment
Japan 11,500
Canada 9,300
United Kingdom 8,600
Switzerland 7,100
Germany 6,700
Employment within Kansas, 2018
Top Ten Exports to Europe, 2019 ($ millions) Top Ten Imports from Europe, 2019 ($ millions)
Country Exports ($ millions)
Germany 508
United Kingdom 463
France 234
Austria 154
Spain 152
Country Imports ($ millions)
Germany 927
United Kingdom 513
Italy 326
France 296
Turkey 133
Top European Export Markets, 2019 Top European Import Markets, 2019
$2.6 bnKansas Goods Exports to Europe, 2019
$3.1 bnKansas Goods Imports from Europe, 2019
Almost 75% of Kansas's exports to Europe was concentrated in four main export categories: transportation equipment, computer & electronic products, chemicals and machinery.
Transportation equipment represented 28% of the state's total imports from Europe.
Transportation Equipment
Computers & Electronic Prod.
Chemical Manufactures
Machinery Manufactures
Elec. Equip., Appliances & Parts
Agricultural Products
Processed Foods
Fabricated Metal Products
Primary Metal Manufactures
Misc. Manufactures
Transportation Equipment
Machinery Manufactures
Chemical Manufactures
Computers & Electronic Prod.
Fabricated Metal Products
Elec. Equip., Appliances & Parts
Wood Products
Processed Foods
Misc. Manufactures
Plastic & Rubber Products
European companies account for
54% of foreign affiliate jobs
Number of projects does not directly translate to value of projects or jobs added. Greenfield FDI is investment in new assets.
Sources of Greenfield Foreign Direct Investment (FDI)
Number of Greenfield Projects
GermanyCanada
JapanU.K.
France
89Greenfield Projects (October 2010 - September 2020)
Since 2006: +8,500(+29.6%)
0 2 4 6 8 10 12 14 16 18
8%8%
16% of the total16% of the total16% of the total
10%10%
9%
8%8%
880
622 622
315 315
232 232
178
111
52 52
44 44
43 43
28 28
916
405 405
320 320
270 270
86
79
79
69
64 64
63 63
Jobs directly supported by European investment. Total European-related jobs are likely to be higher, because these figures do not include jobs created by trade flows, indirect employment effects through distributors or suppliers, or via non-equity arrangements such as strategic alliances, joint ventures, or other deals.
2006 2018
Trade
Investment
Jobs
0 1 10 100 1,000 10,000 0 1 10 100 1,000 10,000
102 - THE TRANSATLANTIC ECONOMY 2021
Appendix A - European Commerce and the 50 U.S. States: A State-by-State Comparison
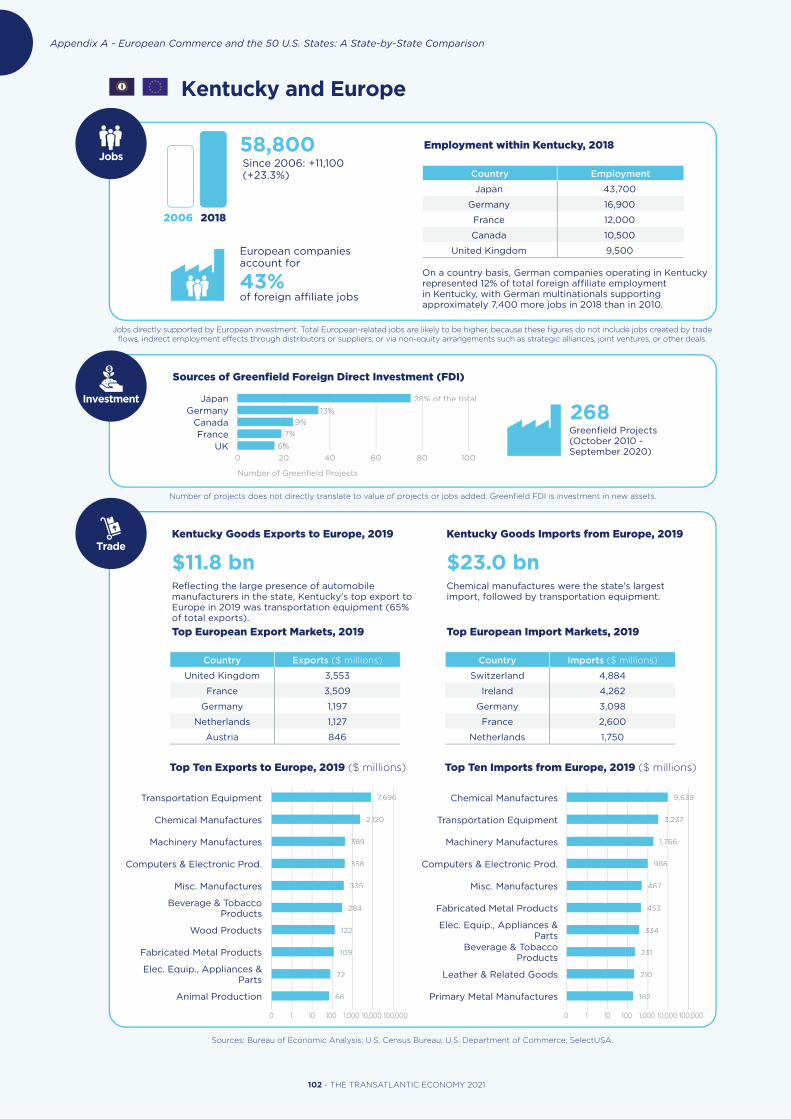
Kentucky and Europe
On a country basis, German companies operating in Kentucky represented 12% of total foreign affiliate employment in Kentucky, with German multinationals supporting approximately 7,400 more jobs in 2018 than in 2010.
Sources: Bureau of Economic Analysis; U.S. Census Bureau; U.S. Department of Commerce; SelectUSA.
58,800Country Employment
Japan 43,700
Germany 16,900
France 12,000
Canada 10,500
United Kingdom 9,500
Employment within Kentucky, 2018
Top Ten Exports to Europe, 2019 ($ millions) Top Ten Imports from Europe, 2019 ($ millions)
Country Exports ($ millions)
United Kingdom 3,553
France 3,509
Germany 1,197
Netherlands 1,127
Austria 846
Country Imports ($ millions)
Switzerland 4,884
Ireland 4,262
Germany 3,098
France 2,600
Netherlands 1,750
Top European Export Markets, 2019 Top European Import Markets, 2019
$11.8 bn
Kentucky Goods Exports to Europe, 2019
$23.0 bn
Kentucky Goods Imports from Europe, 2019
Reflecting the large presence of automobile manufacturers in the state, Kentucky's top export to Europe in 2019 was transportation equipment (65% of total exports).
Chemical manufactures were the state's largest import, followed by transportation equipment.
2006 2018
European companies account for
43% of foreign affiliate jobs
Number of projects does not directly translate to value of projects or jobs added. Greenfield FDI is investment in new assets.
Sources of Greenfield Foreign Direct Investment (FDI)
Number of Greenfield Projects
JapanGermany
CanadaFrance
UK
268Greenfield Projects (October 2010 - September 2020)
Since 2006: +11,100(+23.3%)
0 20 40 60 80 100
6%6%
28% of the total28% of the total28% of the total
13%13%
9%
7%
Jobs directly supported by European investment. Total European-related jobs are likely to be higher, because these figures do not include jobs created by trade flows, indirect employment effects through distributors or suppliers, or via non-equity arrangements such as strategic alliances, joint ventures, or other deals.
Transportation Equipment
Chemical Manufactures
Machinery Manufactures
Computers & Electronic Prod.
Misc. Manufactures
Beverage & Tobacco Products
Wood Products
Fabricated Metal Products
Elec. Equip., Appliances & Parts
Animal Production
Chemical Manufactures
Transportation Equipment
Machinery Manufactures
Computers & Electronic Prod.
Misc. Manufactures
Fabricated Metal Products
Elec. Equip., Appliances & Parts
Beverage & Tobacco Products
Leather & Related Goods
Primary Metal Manufactures
0 1 10 100 1,000 10,000 100,0000 1 10 100 1,000 10,000 100,000
9,639 9,639
3,237 3,237
1,766 1,766
988 988
467 467
453 453
334 334
231 231
210 210
182 182
7,696 7,696
2,120 2,120
389 389
358 358
335 335
284 284
122
109 109
72
66
Jobs
Trade
Investment

103 - THE TRANSATLANTIC ECONOMY 2021
Appendix A - European Commerce and the 50 U.S. States: A State-by-State Comparison
Louisiana and Europe
On a country basis, U.K. companies operating in Louisiana represented 22% of total foreign affiliate employment in Louisiana, with U.K. multinationals supporting approximately 5,400 more jobs in 2018 than in 2010.
Sources: Bureau of Economic Analysis; U.S. Census Bureau; U.S. Department of Commerce; SelectUSA.
48,400Country Employment
United Kingdom 17,000
Canada 12,600
France 12,200
Germany 6,800
Netherlands 4,300
Employment within Louisiana, 2018
Top Ten Exports to Europe, 2019 ($ millions) Top Ten Imports from Europe, 2019 ($ millions)
Country Exports ($ millions)
Netherlands 2,999
United Kingdom 1,928
Spain 1,783
Belgium 1,210
France 1,011
Country Imports ($ millions)
Russia 3,955
United Kingdom 600
Germany 599
Belgium 466
Norway 417
Top European Export Markets, 2019 Top European Import Markets, 2019
$12.3 bn
Louisiana Goods Exports to Europe, 2019
$8.1 bn
Louisiana Goods Imports from Europe, 2019
The majority of the state's exports consist of a mix of energy, agricultural and chemical products.
Petroleum & coal products were Louisiana's top imported good from Europe.
Petroleum & Coal Products
Oil & Gas Extraction
Chemical Manufactures
Agricultural Products
Processed Foods
Mining
Wood Products
Machinery Manufactures
Fish & Marine Products
Beverage & Tobacco Products
Petroleum & Coal Products
Chemical Manufactures
Oil & Gas Extraction
Machinery Manufactures
Primary Metal Manufactures
Computers & Electronic Prod.
Fabricated Metal Products
Mining
Beverage & Tobacco Products
Transportation Equipment
European companies account for
63% of foreign affiliate jobs
Number of projects does not directly translate to value of projects or jobs added. Greenfield FDI is investment in new assets.
Sources of Greenfield Foreign Direct Investment (FDI)
Number of Greenfield Projects
U.K.Canada
GermanyFranceJapan
137Greenfield Projects (October 2010 - September 2020)
Since 2006: +16,800(+53.2%)
0 5 10 15 20 25 30 35 40
7%
24% of the total24% of the total24% of the total
10%10%
10%10%
7%
3,857 3,857
1,568 1,568
698 698
491 491
459 459
180 180
144
90
87
81
3,809 3,809
2,761 2,761
2,370 2,370
1,837 1,837
426 426
191
175
143
99
89
Jobs directly supported by European investment. Total European-related jobs are likely to be higher, because these figures do not include jobs created by trade flows, indirect employment effects through distributors or suppliers, or via non-equity arrangements such as strategic alliances, joint ventures, or other deals.
2006 2018
Trade
Investment
Jobs
0 1 10 100 1,000 10,000 0 1 10 100 1,000 10,000

104 - THE TRANSATLANTIC ECONOMY 2021
Appendix A - European Commerce and the 50 U.S. States: A State-by-State Comparison
Maine and Europe
On a country basis, Dutch companies operating in Maine represented 48% of total foreign affiliate employment in Maine, with Dutch multinationals supporting approximately 17,400 more jobs in 2018 than in 2010.
Sources: Bureau of Economic Analysis; U.S. Census Bureau; U.S. Department of Commerce; SelectUSA.
23,400Country Employment
Netherlands 17,500*
Canada 9,400
United Kingdom 2,600
Switzerland 2,500
Germany 1,700
Employment within Maine, 2018
Top Ten Exports to Europe, 2019 ($ millions) Top Ten Imports from Europe, 2019 ($ millions)
Country Exports ($ millions)
Italy 86
Netherlands 67
United Kingdom 64
Germany 58
Belgium 40
Country Imports ($ millions)
Germany 177
United Kingdom 91
Italy 58
Netherlands 52
France 51
Top European Export Markets, 2019 Top European Import Markets, 2019
$445.8 m
Maine Goods Exports to Europe, 2019
$720.1 m
Maine Goods Imports from Europe, 2019
Paper products and transportation equipment are the state's top exports to Europe.
Machinery manufactures represent 20% of Maine's total imports from Europe, followed by transportation equipment and petroleum & coal.
Paper Products
Transportation Equipment
Computers & Electronic Prod.
Chemical Manufactures
Machinery Manufactures
Fish & Marine Products
Processed Foods
Elec. Equip., Appliances & Parts
Plastic & Rubber Products
Fabricated Metal Products
Machinery Manufactures
Transportation Equipment
Petroleum & Coal Products
Chemical Manufactures
Computers & Electronic Prod.
Non-Apparel Textile Products
Fabricated Metal Products
Primary Metal Manufactures
Processed Foods
Plastic & Rubber Products
European companies account for
64% of foreign affiliate jobs
Number of projects does not directly translate to value of projects or jobs added. Greenfield FDI is investment in new assets.
Sources of Greenfield Foreign Direct Investment (FDI)
Number of Greenfield Projects
CanadaU.K.
GermanySwitzerland
Australia
31Greenfield Projects (October 2010 - September 2020)
Since 2006: +4,400(+23.2%)
0 2 4 6 8 10 12 14
6%
39% of the total39% of the total
16%16%
10%10%
6%
143
110
96
57 57
57 57
26 26
22
20
15
11
83
63 63
57 57
42 42
28
19
16
15
14
11
Jobs directly supported by European investment. Total European-related jobs are likely to be higher, because these figures do not include jobs created by trade flows, indirect employment effects through distributors or suppliers, or via non-equity arrangements such as strategic alliances, joint ventures, or other deals.
2006 2018
*Netherlands employment data suppressed to avoid disclosure of individual company data. Range of 10,000 - 24,999 employees given.
Jobs
Trade
Investment
0 1 10 100 1,000 10,000 0 1 10 100 1,000 10,000

105 - THE TRANSATLANTIC ECONOMY 2021
Appendix A - European Commerce and the 50 U.S. States: A State-by-State Comparison
Maryland and Europe
On a country basis, U.K. companies operating in Maryland represented 23% of total foreign affiliate employment in Maryland, with U.K. multinationals supporting approximately 8,400 more jobs in 2018 than in 2010.
Sources: Bureau of Economic Analysis; U.S. Census Bureau; U.S. Department of Commerce; SelectUSA.
88,700Country Employment
United Kingdom 26,300
Netherlands 22,600
Canada 13,500
France 10,700
Germany 9,200
Employment within Maryland, 2018
Top Ten Exports to Europe, 2019 ($ millions) Top Ten Imports from Europe, 2019 ($ millions)
Country Exports ($ millions)
France 1,943
Netherlands 707
United Kingdom 550
Belgium 420
Germany 331
Country Imports ($ millions)
United Kingdom 4,402
Germany 4,372
Sweden 860
Italy 826
Finland 665
Top European Export Markets, 2019 Top European Import Markets, 2019
$4.9 bn
Maryland Goods Exports to Europe, 2019
$15.6 bn
Maryland Goods Imports from Europe, 2019
The state's top exports are transportation equipment, chemicals, and metal products.
Transportation equipment and machinery manufactures were the top product imports.
Transportation Equipment
Chemical Manufactures
Fabricated Metal Products
Computers & Electronic Prod.
Oil & Gas Extraction
Mining
Elec. Equip., Appliances & Parts
Primary Metal Manufactures
Machinery Manufactures
Waste & Scrap
Transportation Equipment
Machinery Manufactures
Chemical Manufactures
Primary Metal Manufactures
Computers & Electronic Prod.
Paper Products
Beverage & Tobacco Products
Processed Foods
Fabricated Metal Products
Furniture & Related Products
European companies account for
76% of foreign affiliate jobs
Number of projects does not directly translate to value of projects or jobs added. Greenfield FDI is investment in new assets.
Sources of Greenfield Foreign Direct Investment (FDI)
Number of Greenfield Projects
U.K.Switzerland
GermanyIsrael
France
157Greenfield Projects (October 2010 - September 2020)
Since 2006: +2,100(+2.4%)
0 5 10 15 20 25 30 35 40 45
7%
24% of the total24% of the total24% of the total
9%9%
9%9%
8%8%
8,636
1,796 1,796
1,075 1,075
1,052 1,052
503 503
441 441
308 308
261 261
230 230
219 219
1,355 1,355
734
587 587
454 454
445 445
217
205 205
150
142
139
Jobs directly supported by European investment. Total European-related jobs are likely to be higher, because these figures do not include jobs created by trade flows, indirect employment effects through distributors or suppliers, or via non-equity arrangements such as strategic alliances, joint ventures, or other deals.
2006 2018
Trade
Investment
Jobs
0 1 10 100 1,000 10,000 0 1 10 100 1,000 10,000

106 - THE TRANSATLANTIC ECONOMY 2021
Appendix A - European Commerce and the 50 U.S. States: A State-by-State Comparison
Massachusetts and Europe
On a country basis, U.K. companies operating in Massachusetts represented 18% of total foreign affiliate employment in Massachusetts, with U.K. multinationals supporting approximately 3,600 more jobs in 2018 than in 2010.
Sources: Bureau of Economic Analysis; U.S. Census Bureau; U.S. Department of Commerce; SelectUSA.
167,000Country Employment
United Kingdom 41,900
Netherlands 36,800
France 25,500
Canada 22,700
Germany 21,300
Employment within Massachusetts, 2018
Top Ten Exports to Europe, 2019 ($ millions) Top Ten Imports from Europe, 2019 ($ millions)
Country Exports ($ millions)
United Kingdom 2,743
Germany 1,834
Netherlands 1,329
Switzerland 1,092
Ireland 710
Country Imports ($ millions)
Ireland 2,233
Germany 1,958
Italy 1,898
United Kingdom 1,828
Switzerland 991
Top European Export Markets, 2019 Top European Import Markets, 2019
$10.9 bn
Massachusetts Goods Exports to Europe, 2019
$12.5 bn
Massachusetts Goods Imports from Europe, 2019
Primary metal manufactures were the top export to Europe, followed by computers & electronic products and chemicals.
Key imports from Europe include miscellaneous manufactured products, chemicals, and computer & electronic products.
Primary Metal Manufactures
Computers & Electronic Prod.
Chemical Manufactures
Misc. Manufactures
Machinery Manufactures
Elec. Equip., Appliances & Parts
Transportation Equipment
Waste & Scrap
Plastic & Rubber Products
Fabricated Metal Products
Misc. Manufactures
Chemical Manufactures
Computers & Electronic Prod.
Machinery Manufactures
Petroleum & Coal Products
Beverage & Tobacco Products
Elec. Equip., Appliances & Parts
Fish & Marine Products
Transportation Equipment
Primary Metal Manufactures
European companies account for
73% of foreign affiliate jobs
Number of projects does not directly translate to value of projects or jobs added. Greenfield FDI is investment in new assets.
Sources of Greenfield Foreign Direct Investment (FDI)
Number of Greenfield Projects
U.K.France
GermanyCanada
Japan
668Greenfield Projects (October 2010 - September 2020)
Since 2006: +47,700(+40.0%)
0 20 40 60 80 100 120 140 160
5%5%
22% of the total22% of the total
13%13%
11%11%
6%
2,554 2,554
2,371 2,371
1,540 1,540
1,357 1,357
898
369 369
341 341
325 325
325 325
215 215
2,472 2,472
2,043 2,043
1,636 1,636
1,588 1,588
1,186
384 384
383 383
232 232
180
143
Jobs directly supported by European investment. Total European-related jobs are likely to be higher, because these figures do not include jobs created by trade flows, indirect employment effects through distributors or suppliers, or via non-equity arrangements such as strategic alliances, joint ventures, or other deals.
2006 2018
Jobs
Trade
Investment
0 1 10 100 1,000 10,000 0 1 10 100 1,000 10,000

107 - THE TRANSATLANTIC ECONOMY 2021
Appendix A - European Commerce and the 50 U.S. States: A State-by-State Comparison
Michigan and Europe
Trade
On a country basis, German companies operating in Michigan represented 17% of total foreign affiliate employment in Michigan, with German multinationals supporting approximately 27,500 more jobs in 2018 than in 2010. *Netherlands employment data suppressed to avoid disclosure of individual company data. Range of 25,000 - 49,999 employees given.
Sources: Bureau of Economic Analysis; U.S. Census Bureau; U.S. Department of Commerce; SelectUSA.
203,300Country Employment
Germany 53,400
United Kingdom 39,500
Netherlands 37,500*
Japan 34,000
Canada 31,800
Employment within Michigan, 2018
Top Ten Exports to Europe, 2019 ($ millions) Top Ten Imports from Europe, 2019 ($ millions)
Country Exports ($ millions)
Germany 2,047
Italy 1,173
Belgium 928
United Kingdom 904
Spain 637
Country Imports ($ millions)
Germany 4,539
Italy 2,662
Spain 1,220
France 743
United Kingdom 686
Top European Export Markets, 2019 Top European Import Markets, 2019
$8.3 bn
Michigan Goods Exports to Europe, 2019
$13.3 bn
Michigan Goods Imports from Europe, 2019
Not surprisingly, transportation equipment is the largest exported product, representing 36% of the state's total exports to Europe.
Imports from Europe mainly consist of transportation equipment and machinery.
Transportation Equipment
Chemical Manufactures
Non-Metallic Mineral Mfgs.
Machinery Manufactures
Computers & Electronic Prod.
Elec. Equip., Appliances & Parts
Primary Metal Manufactures
Fabricated Metal Products
Plastic & Rubber Products
Misc. Manufactures
Transportation Equipment
Machinery Manufactures
Computers & Electronic Prod.
Chemical Manufactures
Fabricated Metal Products
Elec. Equip., Appliances & Parts
Primary Metal Manufactures
Beverage & Tobacco Products
Misc. Manufactures
Plastic & Rubber Products
European companies account for
65% of foreign affiliate jobs
Number of projects does not directly translate to value of projects or jobs added. Greenfield FDI is investment in new assets.
Sources of Greenfield Foreign Direct Investment (FDI)
Number of Greenfield Projects
GermanyJapan
U.K.China
Canada
527Greenfield Projects (October 2010 - September 2020)
Since 2006: +62,400(+44.3%)
0 20 40 60 80 100 120 140
8%
21% of the total21% of the total21% of the total
14%14%
10%10%
9%
4,530 4,530
2,624 2,624
1,235 1,235
1,029 1,029
840
681
501 501
252 252
221 221
216 216
3,023 3,023
1,724 1,724
686
659 659
452 452
365 365
282 282
263 263
188
166
Jobs directly supported by European investment. Total European-related jobs are likely to be higher, because these figures do not include jobs created by trade flows, indirect employment effects through distributors or suppliers, or via non-equity arrangements such as strategic alliances, joint ventures, or other deals.
2006 2018
Trade
Investment
Jobs
0 1 10 100 1,000 10,000 0 1 10 100 1,000 10,000

108 - THE TRANSATLANTIC ECONOMY 2021
Appendix A - European Commerce and the 50 U.S. States: A State-by-State Comparison
Minnesota and Europe
On a country basis, German companies operating in Minnesota represented 15% of total foreign affiliate employment in Minnesota, with German multinationals supporting approximately 12,000 more jobs in 2018 than in 2010.
Sources: Bureau of Economic Analysis; U.S. Census Bureau; U.S. Department of Commerce; SelectUSA.
94,600Country Employment
Canada 25,400
Germany 21,400
United Kingdom 21,200
Japan 10,500
Switzerland 8,500
Employment within Minnesota, 2018
Top Ten Exports to Europe, 2019 ($ millions) Top Ten Imports from Europe, 2019 ($ millions)
Country Exports ($ millions)
Germany 1,126
Belgium 609
United Kingdom 556
Ireland 482
France 454
Country Imports ($ millions)
Germany 1,050
Ireland 1,013
Italy 452
United Kingdom 439
France 241
Top European Export Markets, 2019 Top European Import Markets, 2019
$5.1 bn
Minnesota Goods Exports to Europe, 2019
$4.4 bn
Minnesota Goods Imports from Europe, 2019
Computers & electronic products account for roughly one-quarter of Minnesota's exports to Europe.
Computers & electronic products were also the state's top import category from Europe.
Computers & Electronic Prod.
Misc. Manufactures
Machinery Manufactures
Chemical Manufactures
Transportation Equipment
Elec. Equip., Appliances & Parts
Paper Products
Non-Metallic Mineral Mfgs.
Plastic & Rubber Products
Fabricated Metal Products
Computers & Electronic Prod.
Machinery Manufactures
Misc. Manufactures
Elec. Equip., Appliances & Parts
Chemical Manufactures
Fabricated Metal Products
Transportation Equipment
Beverage & Tobacco Products
Processed Foods
Plastic & Rubber Products
2006 2018
European companies account for
64% of foreign affiliate jobs
Number of projects does not directly translate to value of projects or jobs added. Greenfield FDI is investment in new assets.
Sources of Greenfield Foreign Direct Investment (FDI)
Number of Greenfield Projects
CanadaGermany
U.K.India
Japan
135Greenfield Projects (October 2010 - September 2020)
Since 2006: +43,900(+86.6%)
0 5 10 15 20 25 30
6%6%
14% of the total14% of the total14% of the total
13%13%
13%13%
6%6%
1,297 1,297
964
402 402
301 301
262 262
223 223
200 200
173
76
73 73
1,191
972
713
462 462
399 399
303 303
186
183
162
132
Jobs directly supported by European investment. Total European-related jobs are likely to be higher, because these figures do not include jobs created by trade flows, indirect employment effects through distributors or suppliers, or via non-equity arrangements such as strategic alliances, joint ventures, or other deals.
Jobs
Trade
Investment
0 1 10 100 1,000 10,000 0 1 10 100 1,000 10,000

109 - THE TRANSATLANTIC ECONOMY 2021
Appendix A - European Commerce and the 50 U.S. States: A State-by-State Comparison
Mississippi and Europe
On a country basis, French companies operating in Mississippi represented 12% of total foreign affiliate employment in Mississippi, with French multinationals supporting approximately 2,800 more jobs in 2018 than in 2010.
Sources: Bureau of Economic Analysis; U.S. Census Bureau; U.S. Department of Commerce; SelectUSA.
20,100Country Employment
Japan 10,300
France 4,900
United Kingdom 4,600
Germany 4,000
Canada 3,700
Employment within Mississippi, 2018
Top Ten Exports to Europe, 2019 ($ millions) Top Ten Imports from Europe, 2019 ($ millions)
Country Exports ($ millions)
Netherlands 531
Belgium 451
Germany 219
United Kingdom 159
Turkey 117
Country Imports ($ millions)
Germany 676
Belgium 566
Ireland 522
Russia 451
United Kingdom 372
Top European Export Markets, 2019 Top European Import Markets, 2019
$2.1 bn
Mississippi Goods Exports to Europe, 2019
$3.9 bn
Mississippi Goods Imports from Europe, 2019
Miscellaneous manufactures represented about 24% of Mississippi's total exports to Europe in 2019. The next largest export category was petroleum & coal, also accounting for 24% of total exports.
Imports from Europe were relatively diverse, with seven different product categories each accounting for over $200 million worth of European imports in 2019.
Misc. Manufactures
Petroleum & Coal Products
Computers & Electronic Prod.
Chemical Manufactures
Paper Products
Transportation Equipment
Machinery Manufactures
Agricultural Products
Fabricated Metal Products
Elec. Equip., Appliances & Parts
Petroleum & Coal Products
Misc. Manufactures
Machinery Manufactures
Chemical Manufactures
Elec. Equip., Appliances & Parts
Transportation Equipment
Primary Metal Manufactures
Oil & Gas Extraction
Computers & Electronic Prod.
Fabricated Metal Products
European companies account for
51% of foreign affiliate jobs
Number of projects does not directly translate to value of projects or jobs added. Greenfield FDI is investment in new assets.
Sources of Greenfield Foreign Direct Investment (FDI)
Number of Greenfield Projects
JapanGermany
IsraelFrance
U.K.
89Greenfield Projects (October 2010 - September 2020)
Since 2006: +7,600(+60.8%)
0 2 4 6 8 10 12 14 16 18 20
7%
19% of the total19% of the total19% of the total
9%
7%
7%
919
791
373 373
321 321
269 269
266 266
260 260
193 193
161
115
498 498
495 495
206 206
187
166
140
124
88
56 56
33 33
Jobs directly supported by European investment. Total European-related jobs are likely to be higher, because these figures do not include jobs created by trade flows, indirect employment effects through distributors or suppliers, or via non-equity arrangements such as strategic alliances, joint ventures, or other deals.
2006 2018
Trade
Investment
Jobs
0 1 10 100 1,000 10,000 0 1 10 100 1,000 10,000

110 - THE TRANSATLANTIC ECONOMY 2021
Appendix A - European Commerce and the 50 U.S. States: A State-by-State Comparison
Missouri and Europe
On a country basis, U.K. companies operating in Missouri represented 15% of total foreign affiliate employment in Missouri, with U.K. multinationals supporting approximately 4,200 more jobs in 2018 than in 2010.
Sources: Bureau of Economic Analysis; U.S. Census Bureau; U.S. Department of Commerce; SelectUSA.
89,600Country Employment
United Kingdom 21,600
Germany 19,600
Japan 17,200
Canada 16,600
France 11,800
Employment within Missouri, 2018
Top Ten Exports to Europe, 2019 ($ millions) Top Ten Imports from Europe, 2019 ($ millions)
Country Exports ($ millions)
Germany 475
Belgium 345
United Kingdom 331
France 294
Netherlands 231
Country Imports ($ millions)
Germany 1,427
Belgium 391
Italy 361
United Kingdom 277
France 265
Top European Export Markets, 2019 Top European Import Markets, 2019
$2.4 bn
Missouri Goods Exports to Europe, 2019
$4.1 bn
Missouri Goods Imports from Europe, 2019
The top exports to Europe from Missouri in 2019 were chemicals, machinery and computers & electronic products.
Chemicals, machinery, and beverage & tobacco products were the top imported goods from Europe.
Chemical Manufactures
Machinery Manufactures
Computers & Electronic Prod.
Transportation Equipment
Elec. Equip., Appliances & Parts
Misc. Manufactures
Fabricated Metal Products
Leather & Related Goods
Plastic & Rubber Products
Used Merchandise
Chemical Manufactures
Machinery Manufactures
Beverage & Tobacco Products
Transportation Equipment
Fabricated Metal Products
Computers & Electronic Prod.
Misc. Manufactures
Elec. Equip., Appliances & Parts
Processed Foods
Plastic & Rubber Products
2006 2018
European companies account for
62% of foreign affiliate jobs
Number of projects does not directly translate to value of projects or jobs added. Greenfield FDI is investment in new assets.
Sources of Greenfield Foreign Direct Investment (FDI)
Number of Greenfield Projects
CanadaU.K.
GermanyFranceIreland
142Greenfield Projects (October 2010 - September 2020)
Since 2006: +27,900(+45.2%)
0 5 10 15 20 25
5%
14% of the total14% of the total
12%
11%
7%
1,303 1,303
655 655
418 418
398 398
244 244
175
158
155
100
78
1,046 1,046
246 246
194
149
113
85
73
72
64 64
62 62
Jobs directly supported by European investment. Total European-related jobs are likely to be higher, because these figures do not include jobs created by trade flows, indirect employment effects through distributors or suppliers, or via non-equity arrangements such as strategic alliances, joint ventures, or other deals.
Jobs
Trade
Investment
0 1 10 100 1,000 10,000 0 1 10 100 1,000 10,000

111 - THE TRANSATLANTIC ECONOMY 2021
Appendix A - European Commerce and the 50 U.S. States: A State-by-State Comparison
Montana and Europe
On a country basis, U.K. companies operating in Montana represented 18% of total foreign affiliate employment in Montana, with U.K. multinationals supporting approximately 500 more jobs in 2018 than in 2010.
Sources: Bureau of Economic Analysis; U.S. Census Bureau; U.S. Department of Commerce; SelectUSA.
4,200Country Employment
United Kingdom 1,600
Canada 1,500
France 900
Japan 400
Germany 200
Employment within Montana, 2018
Top Ten Exports to Europe, 2019 ($ millions) Top Ten Imports from Europe, 2019 ($ millions)
Country Exports ($ millions)
Belgium 110
United Kingdom 41
Germany 33
France 19
Netherlands 16
Country Imports ($ millions)
Germany 213
Switzerland 19
Italy 18
United Kingdom 11
France 10
Top European Export Markets, 2019 Top European Import Markets, 2019
$279.9 m
Montana Goods Exports to Europe, 2019
$304.7 m
Montana Goods Imports from Europe, 2019
Exports are relatively small and skewed towards chemicals, machinery and waste & scrap.
Montana's imports from Europe are also small and heavily concentrated in waste & scrap.
Chemical Manufactures
Machinery Manufactures
Waste & Scrap
Elec. Equip., Appliances & Parts
Mining
Computers & Electronic Prod.
Agricultural Products
Misc. Manufactures
Transportation Equipment
Used Merchandise
Waste & Scrap
Machinery Manufactures
Computers & Electronic Prod.
Transportation Equipment
Used Merchandise
Elec. Equip., Appliances & Parts
Fabricated Metal Products
Chemical Manufactures
Leather & Related Goods
Misc. Manufactures
2006 2018
European companies account for
46% of foreign affiliate jobs
Number of projects does not directly translate to value of projects or jobs added. Greenfield FDI is investment in new assets.
Sources of Greenfield Foreign Direct Investment (FDI)
Number of Greenfield Projects
CanadaUK
South KoreaJapanIndia
13Greenfield Projects (October 2010 - September 2020)
Since 2006: -1,400(-25.0%)
0 1 2 3 4 5 6 7
38% of the total38% of the total
23%
15%
8%
8%
179 179
24 24
24 24
17
15
7 7
5 5
5 5
4 4
4 4
102
35 35
34 34
21
20
17
13
13
10
4
Jobs directly supported by European investment. Total European-related jobs are likely to be higher, because these figures do not include jobs created by trade flows, indirect employment effects through distributors or suppliers, or via non-equity arrangements such as strategic alliances, joint ventures, or other deals.
Trade
Investment
Jobs
0 1 10 100 1,000 10,000 0 1 10 100 1,000 10,000

112 - THE TRANSATLANTIC ECONOMY 2021
Appendix A - European Commerce and the 50 U.S. States: A State-by-State Comparison
Nebraska and Europe
On a country basis, U.K. companies operating in Nebraska represented 12% of total foreign affiliate employment in Nebraska, with U.K. multinationals supporting approximately 1,500 more jobs in 2018 than in 2010.
Sources: Bureau of Economic Analysis; U.S. Census Bureau; U.S. Department of Commerce; SelectUSA.
17,100Country Employment
Japan 5,800
United Kingdom 4,100
France 3,600
Germany 2,800
Canada 2,100
Employment within Nebraska, 2018
Top Ten Exports to Europe, 2019 ($ millions) Top Ten Imports from Europe, 2019 ($ millions)
Country Exports ($ millions)
Germany 158
France 138
Netherlands 122
Belgium 85
United Kingdom 66
Country Imports ($ millions)
Switzerland 355
Germany 252
United Kingdom 159
France 82
Italy 56
Top European Export Markets, 2019 Top European Import Markets, 2019
$0.9 bn
Nebraska Goods Exports to Europe, 2019
$1.1 bn
Nebraska Goods Imports from Europe, 2019
The top exports to Europe consist of chemicals, machinery, and miscellaneous manufactures.
Chemicals represented over half of Nebraska's total imports from Europe in 2019.
Chemical Manufactures
Machinery Manufactures
Misc. Manufactures
Processed Foods
Transportation Equipment
Computers & Electronic Prod.
Elec. Equip., Appliances & Parts
Fabricated Metal Products
Plastic & Rubber Products
Leather & Related Goods
Chemical Manufactures
Machinery Manufactures
Computers & Electronic Prod.
Plastic & Rubber Products
Elec. Equip., Appliances & Parts
Transportation Equipment
Misc. Manufactures
Fabricated Metal Products
Primary Metal Manufactures
Beverage & Tobacco Products
European companies account for
49% of foreign affiliate jobs
Number of projects does not directly translate to value of projects or jobs added. Greenfield FDI is investment in new assets.
Sources of Greenfield Foreign Direct Investment (FDI)
Number of Greenfield Projects
GermanyJapanBrazil
DenmarkItaly
33Greenfield Projects (October 2010 - September 2020)
Since 2006: +6,000(+54.1%)
0 2 4 6 8 10 12
6%
24% of the total24% of the total
15%
6%
6%
577 577
262 262
92
46 46
26 26
22
18
17
10
8
191
174
168
122
79
67
35 35
27
18
16
Jobs directly supported by European investment. Total European-related jobs are likely to be higher, because these figures do not include jobs created by trade flows, indirect employment effects through distributors or suppliers, or via non-equity arrangements such as strategic alliances, joint ventures, or other deals.
2006 2018
Jobs
Trade
Investment
0 1 10 100 1,000 10,000 0 1 10 100 1,000 10,000
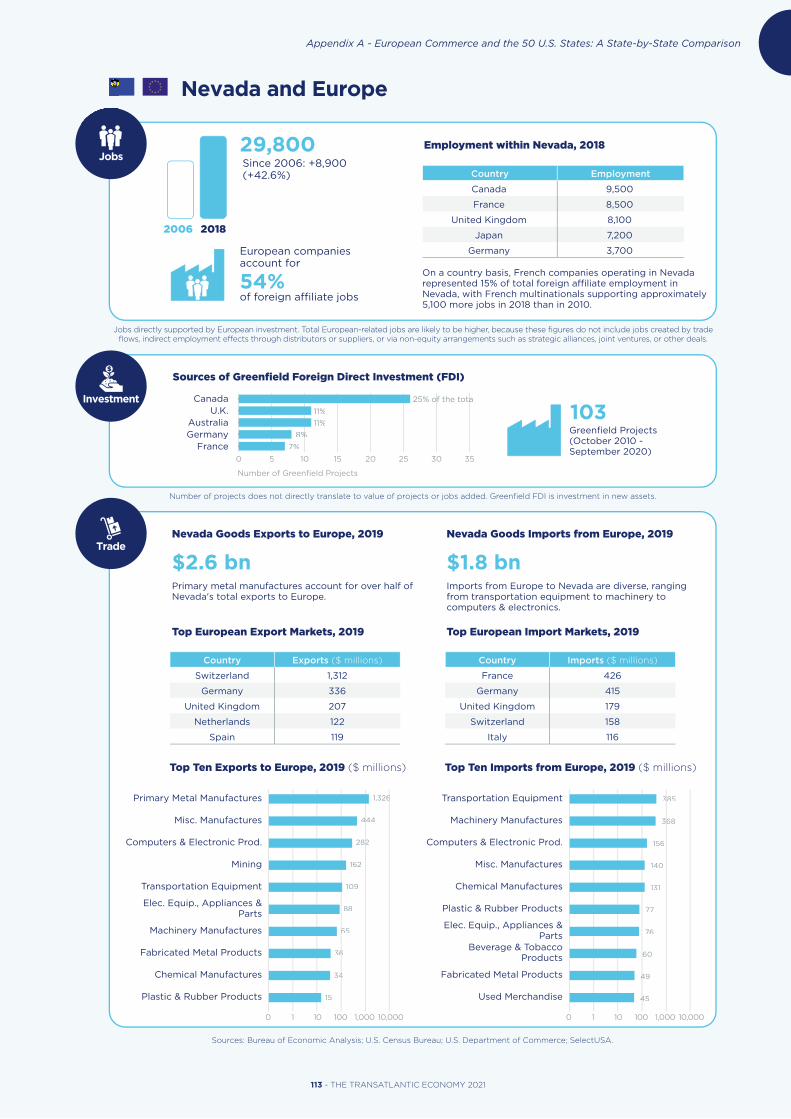
113 - THE TRANSATLANTIC ECONOMY 2021
Appendix A - European Commerce and the 50 U.S. States: A State-by-State Comparison
Nevada and Europe
On a country basis, French companies operating in Nevada represented 15% of total foreign affiliate employment in Nevada, with French multinationals supporting approximately 5,100 more jobs in 2018 than in 2010.
Sources: Bureau of Economic Analysis; U.S. Census Bureau; U.S. Department of Commerce; SelectUSA.
29,800Country Employment
Canada 9,500
France 8,500
United Kingdom 8,100
Japan 7,200
Germany 3,700
Employment within Nevada, 2018
Top Ten Exports to Europe, 2019 ($ millions) Top Ten Imports from Europe, 2019 ($ millions)
Country Exports ($ millions)
Switzerland 1,312
Germany 336
United Kingdom 207
Netherlands 122
Spain 119
Country Imports ($ millions)
France 426
Germany 415
United Kingdom 179
Switzerland 158
Italy 116
Top European Export Markets, 2019 Top European Import Markets, 2019
$2.6 bn
Nevada Goods Exports to Europe, 2019
$1.8 bn
Nevada Goods Imports from Europe, 2019
Primary metal manufactures account for over half of Nevada's total exports to Europe.
Imports from Europe to Nevada are diverse, ranging from transportation equipment to machinery to computers & electronics.
Primary Metal Manufactures
Misc. Manufactures
Computers & Electronic Prod.
Mining
Transportation Equipment
Elec. Equip., Appliances & Parts
Machinery Manufactures
Fabricated Metal Products
Chemical Manufactures
Plastic & Rubber Products
Transportation Equipment
Machinery Manufactures
Computers & Electronic Prod.
Misc. Manufactures
Chemical Manufactures
Plastic & Rubber Products
Elec. Equip., Appliances & Parts
Beverage & Tobacco Products
Fabricated Metal Products
Used Merchandise
European companies account for
54% of foreign affiliate jobs
Number of projects does not directly translate to value of projects or jobs added. Greenfield FDI is investment in new assets.
Sources of Greenfield Foreign Direct Investment (FDI)
Number of Greenfield Projects
CanadaU.K.
AustraliaGermany
France
103Greenfield Projects (October 2010 - September 2020)
Since 2006: +8,900(+42.6%)
0 5 10 15 20 25 30 35
25% of the total25% of the total25% of the total
11%
11%
8%8%
7%
385 385
368 368
156
140
131
77
76
60 60
49 49
45 45
1,326 1,326
444 444
282 282
162
109
88
65 65
36 36
34 34
15
Jobs directly supported by European investment. Total European-related jobs are likely to be higher, because these figures do not include jobs created by trade flows, indirect employment effects through distributors or suppliers, or via non-equity arrangements such as strategic alliances, joint ventures, or other deals.
2006 2018
Trade
Investment
Jobs
0 1 10 100 1,000 10,000 0 1 10 100 1,000 10,000

114 - THE TRANSATLANTIC ECONOMY 2021
Appendix A - European Commerce and the 50 U.S. States: A State-by-State Comparison
New Hampshire and Europe
On a country basis, U.K. companies operating in New Hampshire represented 25% of total foreign affiliate employment in New Hampshire, with U.K. multinationals supporting approximately 1,600 more jobs in 2018 than in 2010.
*Netherlands employment data suppressed to avoid disclosure of individual company data. Range of 5,000 to 9,999 employees given.
Sources: Bureau of Economic Analysis; U.S. Census Bureau; U.S. Department of Commerce; SelectUSA.
33,000Country Employment
United Kingdom 11,900
Netherlands 7,500*
Canada 6,300
Japan 5,200
Switzerland 3,900
Employment within New Hampshire, 2018
Top Ten Exports to Europe, 2019 ($ millions) Top Ten Imports from Europe, 2019 ($ millions)
Country Exports ($ millions)
Germany 992
Ireland 484
Netherlands 211
France 211
United Kingdom 159
Country Imports ($ millions)
Poland 736
Germany 701
United Kingdom 277
Italy 255
Ireland 178
Top European Export Markets, 2019 Top European Import Markets, 2019
$2.6 bn
New Hampshire Goods Exports to Europe, 2019
$3.1 bn
New Hampshire Goods Imports from Europe, 2019
Transportation equipment and chemicals were the top two exports to Europe from New Hampshire in 2019. Combined these two exports made up almost 60% of the state's total exports to Europe.
Transportation equipment represented 40% of the state's total imports from Europe.
Transportation Equipment
Chemical Manufactures
Computers & Electronic Prod.
Machinery Manufactures
Fabricated Metal Products
Elec. Equip., Appliances & Parts
Waste & Scrap
Plastic & Rubber Products
Printing & Related Products
Misc. Manufactures
Transportation Equipment
Machinery Manufactures
Plastic & Rubber Products
Computers & Electronic Prod.
Chemical Manufactures
Fabricated Metal Products
Misc. Manufactures
Elec. Equip., Appliances & Parts
Leather & Related Goods
Processed Foods
European companies account for
70% of foreign affiliate jobs
Number of projects does not directly translate to value of projects or jobs added. Greenfield FDI is investment in new assets.
Sources of Greenfield Foreign Direct Investment (FDI)
Number of Greenfield Projects
U.K.Canada
GermanySwitzerland
Sweden
43Greenfield Projects (October 2010 - September 2020)
Since 2006: +3,800(+13.0%)
0 2 4 6 8 10 12
7%
21% of the total21% of the total21% of the total
16%
14%
12%
1,234 1,234
603 603
287 287
234 234
107
105
95
89
50 50
38 38
1,034
492 492
355 355
287 287
102
97
56 56
38 38
38 38
37 37
Jobs directly supported by European investment. Total European-related jobs are likely to be higher, because these figures do not include jobs created by trade flows, indirect employment effects through distributors or suppliers, or via non-equity arrangements such as strategic alliances, joint ventures, or other deals.
2006 2018
Jobs
Trade
Investment
0 1 10 100 1,000 10,000 0 1 10 100 1,000 10,000

115 - THE TRANSATLANTIC ECONOMY 2021
Appendix A - European Commerce and the 50 U.S. States: A State-by-State Comparison
New Jersey and Europe
On a country basis, French companies operating in New Jersey represented 16% of total foreign affiliate employment in New Jersey, with French multinationals supporting approximately 16,600 more jobs in 2018 than in 2010.
Sources: Bureau of Economic Analysis; U.S. Census Bureau; U.S. Department of Commerce; SelectUSA.
204,500Country Employment
France 46,200
United Kingdom 40,700
Switzerland 31,300
Germany 30,300
Canada 28,200
Employment within New Jersey, 2018
Top Ten Exports to Europe, 2019 ($ millions) Top Ten Imports from Europe, 2019 ($ millions)
Country Exports ($ millions)
United Kingdom 2,543
Germany 1,547
Netherlands 1,350
France 1,049
Belgium 838
Country Imports ($ millions)
Germany 8,544
Italy 7,299
Switzerland 6,838
United Kingdom 5,007
France 4,341
Top European Export Markets, 2019 Top European Import Markets, 2019
$11.3 bn
New Jersey Goods Exports to Europe, 2019
$55.3 bn
New Jersey Goods Imports from Europe, 2019
Top exports consist of chemical manufactures and computers & electronic products.
About one-third of New Jersey's imports from Europe in 2019 was related to the chemicals industry.
Chemical Manufactures
Computers & Electronic Prod.
Waste & Scrap
Primary Metal Manufactures
Transportation Equipment
Used Merchandise
Misc. Manufactures
Machinery Manufactures
Petroleum & Coal Products
Printing & Related Products
Chemical Manufactures
Petroleum & Coal Products
Transportation Equipment
Processed Foods
Misc. Manufactures
Primary Metal Manufactures
Beverage & Tobacco Products
Computers & Electronic Prod.
Machinery Manufactures
Leather & Related Goods
European companies account for
70% of foreign affiliate jobs
Number of projects does not directly translate to value of projects or jobs added. Greenfield FDI is investment in new assets.
Sources of Greenfield Foreign Direct Investment (FDI)
Number of Greenfield Projects
U.K.Japan
GermanyFrance
India
322Greenfield Projects (October 2010 - September 2020)
Since 2006: +33,700(+19.7%)
0 10 20 30 40 50
14% of the total14% of the total
10%
9%9%
7%
7%
0 1 10 100 1,000 10,000 100,000
18,622 18,622
7,025 7,025 7,025
4,294 4,294
3,754 3,754
3,312 3,312
2,530 2,530
2,151 2,151
2,020 2,020
1,885 1,885
1,754 1,754
0 1 10 100 1,000 10,000 100,000
2,629 2,629
1,676 1,676
1,495 1,495
1,075 1,075
810
709
578 578
450 450
309 309
241 241
Jobs directly supported by European investment. Total European-related jobs are likely to be higher, because these figures do not include jobs created by trade flows, indirect employment effects through distributors or suppliers, or via non-equity arrangements such as strategic alliances, joint ventures, or other deals.
Trade
Investment
Jobs
2006 2018

116 - THE TRANSATLANTIC ECONOMY 2021
Appendix A - European Commerce and the 50 U.S. States: A State-by-State Comparison
New Mexico and Europe
On a country basis, German companies operating in New Mexico represented 17% of total foreign affiliate employment in New Mexico, with German multinationals supporting approximately 300 more jobs in 2018 than in 2010.
Sources: Bureau of Economic Analysis; U.S. Census Bureau; U.S. Department of Commerce; SelectUSA.
11,600Country Employment
Germany 3,000
Canada 2,800
United Kingdom 2,800
France 2,100
Japan 1,400
Employment within New Mexico, 2018
Top Ten Exports to Europe, 2019 ($ millions) Top Ten Imports from Europe, 2019 ($ millions)
Country Exports ($ millions)
Germany 62
Ireland 46
Belgium 39
France 29
United Kingdom 29
Country Imports ($ millions)
Switzerland 152
Germany 78
United Kingdom 68
Ireland 41
France 41
Top European Export Markets, 2019 Top European Import Markets, 2019
$308.0 mNew Mexico Goods Exports to Europe, 2019
$489.3 mNew Mexico Goods Imports from Europe, 2019
Exports are relatively small, with computers & electronic products, chemicals, and transportation equipment the largest export categories for New Mexico.
Chemicals were the largest imported good from Europe, followed by computers & electronic products.
Computers & Electronic Prod.
Chemical Manufactures
Transportation Equipment
Agricultural Products
Fabricated Metal Products
Misc. Manufactures
Machinery Manufactures
Elec. Equip., Appliances & Parts
Plastic & Rubber Products
Waste & Scrap
Chemical Manufactures
Computers & Electronic Prod.
Machinery Manufactures
Transportation Equipment
Misc. Manufactures
Fabricated Metal Products
Elec. Equip., Appliances & Parts
Beverage & Tobacco Products
Primary Metal Manufactures
Plastic & Rubber Products
European companies account for
64% of foreign affiliate jobs
Number of projects does not directly translate to value of projects or jobs added. Greenfield FDI is investment in new assets.
Sources of Greenfield Foreign Direct Investment (FDI)
Number of Greenfield Projects
FranceCanada
GermanySpain
U.K.
46Greenfield Projects (October 2010 - September 2020)
Since 2006: +3,800(+48.7%)
0 2 4 6 8 10
11%
17% of the total17% of the total
15%
13%
13%
149
95
69 69
41 41
16
15
14
11
7 7
6 6
91
52 52
38 38
28 28
27
20
15
9
9
5 5
Jobs directly supported by European investment. Total European-related jobs are likely to be higher, because these figures do not include jobs created by trade flows, indirect employment effects through distributors or suppliers, or via non-equity arrangements such as strategic alliances, joint ventures, or other deals.
Jobs
Trade
Investment
0 1 10 100 1,000 10,000 0 1 10 100 1,000 10,000
2006 2018

117 - THE TRANSATLANTIC ECONOMY 2021
Appendix A - European Commerce and the 50 U.S. States: A State-by-State Comparison
New York and Europe
On a country basis, U.K. companies operating in New York represented 21% of total foreign affiliate employment in New York, with U.K. multinationals supporting approximately 18,100 more jobs in 2018 than in 2010.
Sources: Bureau of Economic Analysis; U.S. Census Bureau; U.S. Department of Commerce; SelectUSA.
357,400Country Employment
United Kingdom 107,300
Canada 59,200
France 58,200
Germany 46,000
Japan 45,400
Employment within New York, 2018
Top Ten Exports to Europe, 2019 ($ millions) Top Ten Imports from Europe, 2019 ($ millions)
Country Exports ($ millions)
Switzerland 6,179
United Kingdom 5,315
Belgium 3,365
Germany 3,094
France 2,181
Country Imports ($ millions)
France 9,470
Switzerland 6,369
Germany 6,365
Italy 6,130
United Kingdom 5,502
Top European Export Markets, 2019 Top European Import Markets, 2019
$26.1 bn
New York Goods Exports to Europe, 2019
$45.4 bn
New York Goods Imports from Europe, 2019
Miscellaneous manufactured products and used merchandise were the top goods exports to Europe.
New York's imports from Europe are relatively diverse, ranging from used and miscellaneous merchandise to chemicals and computers.
Misc. Manufactures
Used Merchandise
Computers & Electronic Prod.
Chemical Manufactures
Primary Metal Manufactures
Machinery Manufactures
Transportation Equipment
Elec. Equip., Appliances & Parts
Fabricated Metal Products
Plastic & Rubber Products
Used Merchandise
Chemical Manufactures
Misc. Manufactures
Computers & Electronic Prod.
Beverage & Tobacco Products
Primary Metal Manufactures
Machinery Manufactures
Leather & Related Goods
Apparel Manufactures
Transportation Equipment
European companies account for
69% of foreign affiliate jobs
Number of projects does not directly translate to value of projects or jobs added. Greenfield FDI is investment in new assets.
Sources of Greenfield Foreign Direct Investment (FDI)
Number of Greenfield Projects
U.K.France
CanadaGermany
Israel
1,887Greenfield Projects (October 2010 - September 2020)
Since 2006: +75,300(+26.7%)
0 100 200 300 400 500 600
5%5%
29% of the total29% of the total
8%
8%
7%
6,720
4,572 4,572
4,541 4,541
3,545 3,545
2,953 2,953
2,654 2,654
2,349 2,349
1,799 1,799
1,393 1,393
1,329 1,329
8,393
7,211
2,622 2,622
1,824 1,824
1,315
1,061
1,023
494 494
372 372
269 269
Jobs directly supported by European investment. Total European-related jobs are likely to be higher, because these figures do not include jobs created by trade flows, indirect employment effects through distributors or suppliers, or via non-equity arrangements such as strategic alliances, joint ventures, or other deals.
Trade
Investment
Jobs
0 1 10 100 1,000 10,000 0 1 10 100 1,000 10,000
2006 2018

118 - THE TRANSATLANTIC ECONOMY 2021
Appendix A - European Commerce and the 50 U.S. States: A State-by-State Comparison
North Carolina and Europe
On a country basis, Dutch companies operating in North Carolina represented 15% of total foreign affiliate employment in North Carolina, with Dutch multinationals supporting approximately 36,400 more jobs in 2018 than in 2010.
Sources: Bureau of Economic Analysis; U.S. Census Bureau; U.S. Department of Commerce; SelectUSA.
199,200Country Employment
Netherlands 43,300
Germany 42,400
United Kingdom 37,600
Japan 27,000
Canada 21,900
Employment within North Carolina, 2018
Top Ten Exports to Europe, 2019 ($ millions) Top Ten Imports from Europe, 2019 ($ millions)
Country Exports ($ millions)
France 2,618
Netherlands 1,077
Germany 898
Belgium 896
United Kingdom 832
Country Imports ($ millions)
Germany 6,028
France 2,355
Ireland 2,302
Italy 1,806
United Kingdom 1,630
Top European Export Markets, 2019 Top European Import Markets, 2019
$9.6 bn
North Carolina Goods Exports to Europe, 2019
$20.6 bn
North Carolina Goods Imports from Europe, 2019
Chemical manufactures account for about 33% of total exports to Europe.
Imports from Europe mainly consist of chemicals, machinery and transportation equipment.
Chemical Manufactures
Transportation Equipment
Machinery Manufactures
Computers & Electronic Prod.
Misc. Manufactures
Elec. Equip., Appliances & Parts
Agricultural Products
Primary Metal Manufactures
Non-Metallic Mineral Mfgs.
Paper Products
Chemical Manufactures
Machinery Manufactures
Transportation Equipment
Fabricated Metal Products
Elec. Equip., Appliances & Parts
Computers & Electronic Prod.
Misc. Manufactures
Plastic & Rubber Products
Primary Metal Manufactures
Furniture & Related Products
European companies account for
69% of foreign affiliate jobs
Number of projects does not directly translate to value of projects or jobs added. Greenfield FDI is investment in new assets.
Sources of Greenfield Foreign Direct Investment (FDI)
Number of Greenfield Projects
GermanyU.K.
JapanCanada
Switzerland
606Greenfield Projects (October 2010 - September 2020)
Since 2006: +45,400(+29.5%)
0 25 50 75 100 125 150
6%
21% of the total21% of the total
13%
11%11%
8%
6,772 6,772
3,339 3,339
2,609 2,609
1,134
1,126
697 697
640 640
384 384
266 266
243 243
3,132 3,132
2,176 2,176
881
507 507
391 391
369 369
308 308
264 264
230 230
227 227
Jobs directly supported by European investment. Total European-related jobs are likely to be higher, because these figures do not include jobs created by trade flows, indirect employment effects through distributors or suppliers, or via non-equity arrangements such as strategic alliances, joint ventures, or other deals.
Jobs
Trade
Investment
0 1 10 100 1,000 10,000 0 1 10 100 1,000 10,000
2006 2018

119 - THE TRANSATLANTIC ECONOMY 2021
Appendix A - European Commerce and the 50 U.S. States: A State-by-State Comparison
North Dakota and Europe
Sources: Bureau of Economic Analysis; U.S. Census Bureau; U.S. Department of Commerce; SelectUSA.
5,100Country Employment
Canada 1,800
United Kingdom 1,600
Japan 1,000
Netherlands 900
France 700
Employment within North Dakota, 2018
Top Ten Exports to Europe, 2019 ($ millions) Top Ten Imports from Europe, 2019 ($ millions)
Country Exports ($ millions)
Germany 58
Czech Republic 27
United Kingdom 26
Russia 26
France 21
Country Imports ($ millions)
Germany 109
France 57
Italy 33
United Kingdom 30
Sweden 16
Top European Export Markets, 2019 Top European Import Markets, 2019
$253.8 m
North Dakota Goods Exports to Europe, 2019
$322.2 m
North Dakota Goods Imports from Europe, 2019
41% of the state's exports to Europe consist of machinery manufactures.
Machinery is North Dakota's primary product import from Europe, representing about 54% of total imports.
Machinery Manufactures
Computers & Electronic Prod.
Elec. Equip., Appliances & Parts
Chemical Manufactures
Agricultural Products
Transportation Equipment
Fabricated Metal Products
Plastic & Rubber Products
Processed Foods
Misc. Manufactures
Machinery Manufactures
Computers & Electronic Prod.
Waste & Scrap
Fabricated Metal Products
Chemical Manufactures
Transportation Equipment
Elec. Equip., Appliances & Parts
Paper Products
Agricultural Products
Plastic & Rubber Products
European companies account for
37% of foreign affiliate jobs
Number of projects does not directly translate to value of projects or jobs added. Greenfield FDI is investment in new assets.
Sources of Greenfield Foreign Direct Investment (FDI)
Number of Greenfield Projects
CanadaSouth Korea
JapanFrance
Italy
33Greenfield Projects (October 2010 - September 2020)
Since 2006: +1,100(+27.5%)
0 2 4 6 8 10 12 14 16
6%
40% of the total40% of the total40% of the total
12%
12%
6%
175
24 24
20
19
19
15
12
9
8
4 4
103
42 42
32 32
21
16
11
9
7
5 5
3
Jobs directly supported by European investment. Total European-related jobs are likely to be higher, because these figures do not include jobs created by trade flows, indirect employment effects through distributors or suppliers, or via non-equity arrangements such as strategic alliances, joint ventures, or other deals.
On a country basis, U.K. companies operating in North Dakota represented 12% of total foreign affiliate employment in North Dakota, with U.K. multinationals supporting approximately 1,000 more jobs in 2018 than in 2010.
2006 2018
Trade
Investment
Jobs
0 1 10 100 1,000 10,000 0 1 10 100 1,000 10,000

120 - THE TRANSATLANTIC ECONOMY 2021
Appendix A - European Commerce and the 50 U.S. States: A State-by-State Comparison
Ohio and Europe
On a country basis, U.K. companies operating in Ohio represented 16% of total foreign affiliate employment in Ohio, with U.K. multinationals supporting approximately 12,500 more jobs in 2018 than in 2010.
Sources: Bureau of Economic Analysis; U.S. Census Bureau; U.S. Department of Commerce; SelectUSA.
172,800Country Employment
Japan 70,100
United Kingdom 49,100
Germany 35,900
Canada 29,100
Switzerland 20,400
Employment within Ohio, 2018
Top Ten Exports to Europe, 2019 ($ millions) Top Ten Imports from Europe, 2019 ($ millions)
Country Exports ($ millions)
United Kingdom 2,198
France 1,487
Germany 1,440
Netherlands 940
Belgium 611
Country Imports ($ millions)
Germany 4,859
Ireland 4,256
Italy 2,073
France 1,491
United Kingdom 1,134
Top European Export Markets, 2019 Top European Import Markets, 2019
$9.5 bn
Ohio Goods Exports to Europe, 2019
$19.2 bn
Ohio Goods Imports from Europe, 2019
Transportation equipment, chemicals and machinery are the state's top exports to Europe.
Chemical manufactures make up 43% of Ohio's imports from Europe.
Transportation Equipment
Chemical Manufactures
Machinery Manufactures
Computers & Electronic Prod.
Fabricated Metal Products
Primary Metal Manufactures
Elec. Equip., Appliances & Parts
Misc. Manufactures
Plastic & Rubber Products
Non-Metallic Mineral Mfgs.
Chemical Manufactures
Machinery Manufactures
Transportation Equipment
Primary Metal Manufactures
Computers & Electronic Prod.
Fabricated Metal Products
Elec. Equip., Appliances & Parts
Misc. Manufactures
Plastic & Rubber Products
Waste & Scrap
European companies account for
57%of foreign affiliate jobs
Number of projects does not directly translate to value of projects or jobs added. Greenfield FDI is investment in new assets.
Sources of Greenfield Foreign Direct Investment (FDI)
Number of Greenfield Projects
JapanGermany
CanadaU.K.
France
480Greenfield Projects (October 2010 - September 2020)
Since 2006: +38,800(+29.0%)
0 20 40 60 80 100 120
7%7%
22% of the total22% of the total
13%
9%
8%
8,206
2,699 2,699
1,844 1,844
1,336 1,336
998
596 596
501 501
335 335
327 327
209 209
2,889 2,889
1,599 1,599
1,267 1,267
619 619
481 481
405 405
379 379
336 336
277 277
101
Jobs directly supported by European investment. Total European-related jobs are likely to be higher, because these figures do not include jobs created by trade flows, indirect employment effects through distributors or suppliers, or via non-equity arrangements such as strategic alliances, joint ventures, or other deals.
2006 2018
Jobs
Trade
Investment
0 1 10 100 1,000 10,000 0 1 10 100 1,000 10,000
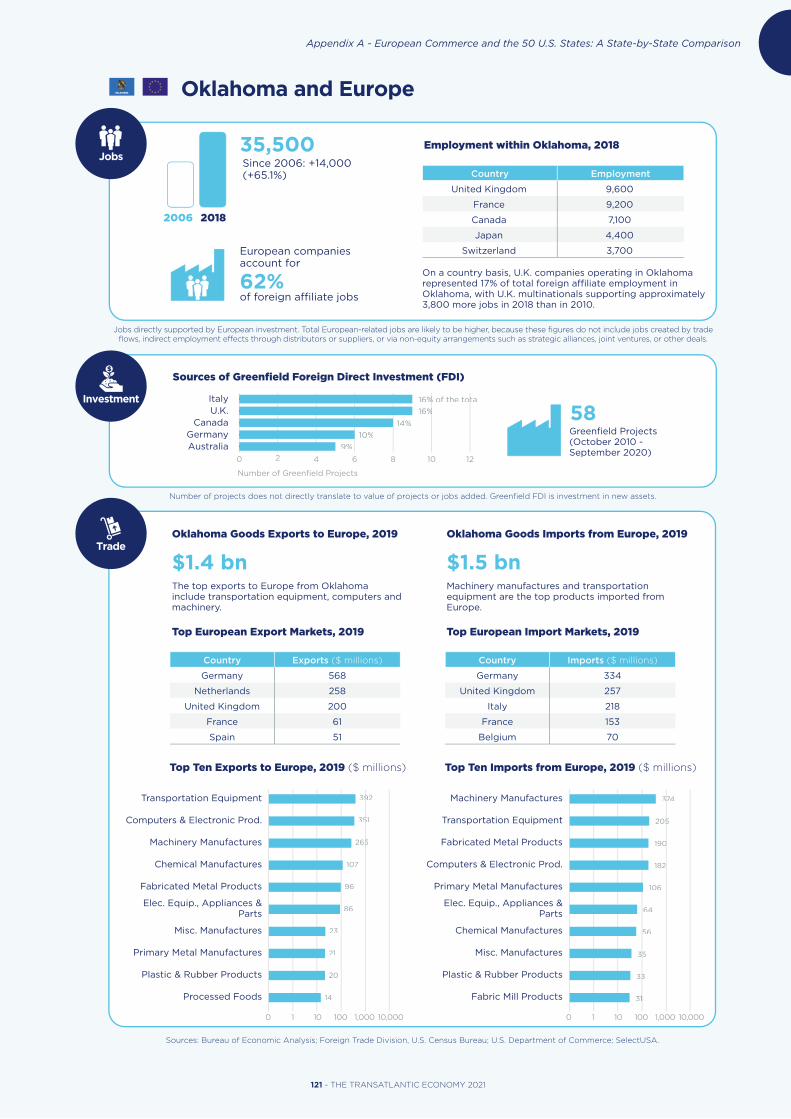
121 - THE TRANSATLANTIC ECONOMY 2021
Appendix A - European Commerce and the 50 U.S. States: A State-by-State Comparison
Oklahoma and Europe
On a country basis, U.K. companies operating in Oklahoma represented 17% of total foreign affiliate employment in Oklahoma, with U.K. multinationals supporting approximately 3,800 more jobs in 2018 than in 2010.
Sources: Bureau of Economic Analysis; Foreign Trade Division, U.S. Census Bureau; U.S. Department of Commerce; SelectUSA.
35,500Country Employment
United Kingdom 9,600
France 9,200
Canada 7,100
Japan 4,400
Switzerland 3,700
Employment within Oklahoma, 2018
Top Ten Exports to Europe, 2019 ($ millions) Top Ten Imports from Europe, 2019 ($ millions)
Country Exports ($ millions)
Germany 568
Netherlands 258
United Kingdom 200
France 61
Spain 51
Country Imports ($ millions)
Germany 334
United Kingdom 257
Italy 218
France 153
Belgium 70
Top European Export Markets, 2019 Top European Import Markets, 2019
$1.4 bn
Oklahoma Goods Exports to Europe, 2019
$1.5 bn
Oklahoma Goods Imports from Europe, 2019
The top exports to Europe from Oklahoma include transportation equipment, computers and machinery.
Machinery manufactures and transportation equipment are the top products imported from Europe.
Transportation Equipment
Computers & Electronic Prod.
Machinery Manufactures
Chemical Manufactures
Fabricated Metal Products
Elec. Equip., Appliances & Parts
Misc. Manufactures
Primary Metal Manufactures
Plastic & Rubber Products
Processed Foods
Machinery Manufactures
Transportation Equipment
Fabricated Metal Products
Computers & Electronic Prod.
Primary Metal Manufactures
Elec. Equip., Appliances & Parts
Chemical Manufactures
Misc. Manufactures
Plastic & Rubber Products
Fabric Mill Products
European companies account for
62% of foreign affiliate jobs
Number of projects does not directly translate to value of projects or jobs added. Greenfield FDI is investment in new assets.
Sources of Greenfield Foreign Direct Investment (FDI)
Number of Greenfield Projects
ItalyU.K.
CanadaGermanyAustralia
58Greenfield Projects (October 2010 - September 2020)
Since 2006: +14,000(+65.1%)
0 2 4 6 8 10 12
9%
16% of the total16% of the total16% of the total
16%16%
14%
10%
374 374
205 205
190 190
182 182
106
64 64
56 56
35 35
33 33
31 31
392 392
351 351
265 265
107
96
86
23
21
20
14
Jobs directly supported by European investment. Total European-related jobs are likely to be higher, because these figures do not include jobs created by trade flows, indirect employment effects through distributors or suppliers, or via non-equity arrangements such as strategic alliances, joint ventures, or other deals.
2006 2018
Trade
Investment
Jobs
0 1 10 100 1,000 10,000 0 1 10 100 1,000 10,000

122 - THE TRANSATLANTIC ECONOMY 2021
Appendix A - European Commerce and the 50 U.S. States: A State-by-State Comparison
Oregon and Europe
On a country basis, U.K. companies operating in Oregon represented 21% of total foreign affiliate employment in Oregon, with U.K. multinationals supporting approximately 6,500 more jobs in 2018 than in 2010.
Sources: Bureau of Economic Analysis; U.S. Census Bureau; U.S. Department of Commerce; SelectUSA.
47,800Country Employment
United Kingdom 14,800
Japan 11,500
Germany 10,900
Switzerland 6,500
Canada 5,800
Employment within Oregon, 2018
Top Ten Exports to Europe, 2019 ($ millions) Top Ten Imports from Europe, 2019 ($ millions)
Country Exports ($ millions)
Germany 503
Switzerland 378
Netherlands 333
United Kingdom 276
France 191
Country Imports ($ millions)
Netherlands 958
Ireland 941
Germany 775
Russia 281
Switzerland 187
Top European Export Markets, 2019 Top European Import Markets, 2019
$2.7 bn
Oregon Goods Exports to Europe, 2019
$4.1 bn
Oregon Goods Imports from Europe, 2019
Roughly 30% of Oregon's exports to Europe consist of computers & electronic products.
Computers & electronic products also represented roughly 30% of Oregon's total European imports.
Computers & Electronic Prod.
Chemical Manufactures
Machinery Manufactures
Transportation Equipment
Misc. Manufactures
Primary Metal Manufactures
Fabricated Metal Products
Elec. Equip., Appliances & Parts
Agricultural Products
Processed Foods
Computers & Electronic Prod.
Machinery Manufactures
Primary Metal Manufactures
Chemical Manufactures
Elec. Equip., Appliances & Parts
Petroleum & Coal Products
Transportation Equipment
Misc. Manufactures
Fabricated Metal Products
Processed Foods
European companies account for
67% of foreign affiliate jobs
Number of projects does not directly translate to value of projects or jobs added. Greenfield FDI is investment in new assets.
Sources of Greenfield Foreign Direct Investment (FDI)
Number of Greenfield Projects
JapanGermany
U.K.AustraliaCanada
116Greenfield Projects (October 2010 - September 2020)
Since 2006: +17,500(+57.8%)
0 5 10 15 20 25 30
9%
18% of the total18% of the total
16%16%
12%12%
10%
1,307 1,307
1,207 1,207
327 327
186 186
178
126
81
73 73
53 53
45 45
749
446 446
440 440
270 270
209 209
120
109
104
69
30 30
Jobs directly supported by European investment. Total European-related jobs are likely to be higher, because these figures do not include jobs created by trade flows, indirect employment effects through distributors or suppliers, or via non-equity arrangements such as strategic alliances, joint ventures, or other deals.
2006 2018
Jobs
Trade
Investment
0 1 10 100 1,000 10,000 0 1 10 100 1,000 10,000

123 - THE TRANSATLANTIC ECONOMY 2021
Appendix A - European Commerce and the 50 U.S. States: A State-by-State Comparison
Pennsylvania and Europe
On a country basis, U.K. companies operating in Pennsylvania represented 19% of total foreign affiliate employment in Pennsylvania, with U.K. multinationals supporting approximately 7,700 more jobs in 2018 than in 2010.
Sources: Bureau of Economic Analysis; U.S. Census Bureau; U.S. Department of Commerce; SelectUSA.
232,900Country Employment
United Kingdom 60,300
Netherlands 43,100
Germany 38,900
France 29,100
Canada 27,800
Employment within Pennsylvania, 2018
Top Ten Exports to Europe, 2019 ($ millions) Top Ten Imports from Europe, 2019 ($ millions)
Country Exports ($ millions)
United Kingdom 2,433
Netherlands 1,822
Belgium 1,799
Germany 1,541
France 739
Country Imports ($ millions)
Switzerland 6,570
Germany 6,159
Italy 4,994
Belgium 4,869
United Kingdom 3,039
Top European Export Markets, 2019 Top European Import Markets, 2019
$12.4 bn
Pennsylvania Goods Exports to Europe, 2019
$36.9 bn
Pennsylvania Goods Imports from Europe, 2019
Chemicals and primary metals were the state's largest exports to Europe.
Imports are heavily concentrated, with chemicals making up over 56% of the state's total imports from Europe.
European companies account for
73% of foreign affiliate jobs
Number of projects does not directly translate to value of projects or jobs added. Greenfield FDI is investment in new assets.
Sources of Greenfield Foreign Direct Investment (FDI)
Number of Greenfield Projects
U.K.Germany
CanadaFranceJapan
402Greenfield Projects (October 2010 - September 2020)
Since 2006: +50,400(+27.6%)
0 10 20 30 40 50 60 70 80 90 100
7%7%
21% of the total21% of the total21% of the total
14%14%
8%
7%7%
Jobs directly supported by European investment. Total European-related jobs are likely to be higher, because these figures do not include jobs created by trade flows, indirect employment effects through distributors or suppliers, or via non-equity arrangements such as strategic alliances, joint ventures, or other deals.
2006 2018
Chemical Manufactures
Primary Metal Manufactures
Computers & Electronic Prod.
Oil & Gas Extraction
Machinery Manufactures
Transportation Equipment
Mining
Misc. Manufactures
Elec. Equip., Appliances & Parts
Plastic & Rubber Products
Chemical Manufactures
Machinery Manufactures
Oil & Gas Extraction
Primary Metal Manufactures
Transportation Equipment
Computers & Electronic Prod.
Elec. Equip., Appliances & Parts
Processed Foods
Fabricated Metal Products
Plastic & Rubber Products
0 1 10 100 1,000 10,000 100,000
20,925 20,925
3,083 3,083
2,033 2,033
2,029 2,029
1,284 1,284
1,248 1,248
943 943
852
632 632
601 601
0 10 1,000 100,000
3,794
1,500
1,085
953
913
836
623 623
565 565
382 382
361 361
Trade
Investment
Jobs

124 - THE TRANSATLANTIC ECONOMY 2021
Appendix A - European Commerce and the 50 U.S. States: A State-by-State Comparison
Rhode Island and Europe
On a country basis, French companies operating in Rhode Island represented 18% of total foreign affiliate employment in Rhode Island, with French multinationals supporting approximately 600 more jobs in 2018 than in 2010.*Netherlands employment data suppressed to avoid disclosure of individual company data. Range of 2,500 - 4,999 employees given.
Sources: Bureau of Economic Analysis; U.S. Census Bureau; U.S. Department of Commerce; SelectUSA.
20,900Country Employment
France 4,700
United Kingdom 4,400
Netherlands 3,750*
Japan 2,100
Canada 1,700
Employment within Rhode Island, 2018
Top Ten Exports to Europe, 2019 ($ millions) Top Ten Imports from Europe, 2019 ($ millions)
Country Exports ($ millions)
Italy 192
Germany 141
Ireland 114
Turkey 112
Switzerland 92
Country Imports ($ millions)
Germany 2,208
Slovakia 974
United Kingdom 380
Ireland 367
Netherlands 243
Top European Export Markets, 2019 Top European Import Markets, 2019
$0.9 bn
Rhode Island Goods Exports to Europe, 2019
$5.2 bn
Rhode Island Goods Imports from Europe, 2019
Waste & scrap account for over 46% of exports to Europe.
The top imported product from Europe is transportation equipment, which represents 68% of the state's total European imports.
Waste & Scrap
Chemical Manufactures
Primary Metal Manufactures
Misc. Manufactures
Computers & Electronic Prod.
Machinery Manufactures
Elec. Equip., Appliances & Parts
Transportation Equipment
Fabricated Metal Products
Plastic & Rubber Products
Transportation Equipment
Petroleum & Coal Products
Misc. Manufactures
Machinery Manufactures
Fabricated Metal Products
Primary Metal Manufactures
Computers & Electronic Prod.
Chemical Manufactures
Processed Foods
Non-Metallic Mineral Mfgs.
European companies account for
80% of foreign affiliate jobs
Number of projects does not directly translate to value of projects or jobs added. Greenfield FDI is investment in new assets.
Sources of Greenfield Foreign Direct Investment (FDI)
Number of Greenfield Projects
U.K.Japan
CanadaAustralia
Israel
32Greenfield Projects (October 2010 - September 2020)
Since 2006: +6,500(+45.1%)
0 2 4 6 8
6%
13%
9%
9%
3,507 3,507
497 497
435 435
175 175
88
81
74
49 49
34 34
32 32
420 420
189
58 58
45 45
44 44
25
24
23
18
13
Jobs directly supported by European investment. Total European-related jobs are likely to be higher, because these figures do not include jobs created by trade flows, indirect employment effects through distributors or suppliers, or via non-equity arrangements such as strategic alliances, joint ventures, or other deals.
2006 2018
Jobs
Trade
Investment
0 1 10 100 1,000 10,000 0 1 10 100 1,000 10,000
16% of the total16% of the total

125 - THE TRANSATLANTIC ECONOMY 2021
Appendix A - European Commerce and the 50 U.S. States: A State-by-State Comparison
South Carolina and Europe
On a country basis, German companies operating in South Carolina represented 22% of total foreign affiliate employment in South Carolina, with German multinationals supporting approximately 16,000 more jobs in 2018 than in 2010.
Sources: Bureau of Economic Analysis; U.S. Census Bureau; U.S. Department of Commerce; SelectUSA.
110,300Country Employment
Germany 35,300
France 26,200
Canada 18,000
Japan 16,300
United Kingdom 12,900
Employment within South Carolina, 2018
Top Ten Exports to Europe, 2019 ($ millions) Top Ten Imports from Europe, 2019 ($ millions)
Country Exports ($ millions)
Germany 4,488
United Kingdom 2,069
Belgium 1,286
Netherlands 1,051
Spain 809
Country Imports ($ millions)
Germany 6,835
United Kingdom 1,248
France 972
Austria 950
Italy 834
Top European Export Markets, 2019 Top European Import Markets, 2019
$12.5 bn
South Carolina Goods Exports to Europe, 2019
$16.8 bn
South Carolina Goods Imports from Europe, 2019
71% of the state's exports consist of transportation equipment, reflecting the state's deep linkages with European auto manufacturers.
Transportation equipment was also the top imported product from Europe, making up 24% of the state's total European imports.
Transportation Equipment
Chemical Manufactures
Machinery Manufactures
Computers & Electronic Prod.
Fabricated Metal Products
Plastic & Rubber Products
Paper Products
Processed Foods
Elec. Equip., Appliances & Parts
Waste & Scrap
Transportation Equipment
Machinery Manufactures
Chemical Manufactures
Computers & Electronic Prod.
Fabricated Metal Products
Elec. Equip., Appliances & Parts
Plastic & Rubber Products
Primary Metal Manufactures
Waste & Scrap
Petroleum & Coal Products
European companies account for
70% of foreign affiliate jobs
Number of projects does not directly translate to value of projects or jobs added. Greenfield FDI is investment in new assets.
Sources of Greenfield Foreign Direct Investment (FDI)
Number of Greenfield Projects
GermanyCanada
JapanU.K.
China
449Greenfield Projects (October 2010 - September 2020))
Since 2006: +26,100(+31.0%)
0 20 40 60 80 100 120 140
6%
29% of the total29% of the total
10%
8%8%
6%
3,958 3,958
3,230 3,230
2,493 2,493
1,271 1,271
1,230 1,230
1,102 1,102
681 681
591 591
269 269
241 241
8,884
964
548 548
467 467
369 369
294 294
288 288
152
123
86
Jobs directly supported by European investment. Total European-related jobs are likely to be higher, because these figures do not include jobs created by trade flows, indirect employment effects through distributors or suppliers, or via non-equity arrangements such as strategic alliances, joint ventures, or other deals.
2006 2018
Trade
Investment
Jobs
0 1 10 100 1,000 10,000 0 1 10 100 1,000 10,000

126 - THE TRANSATLANTIC ECONOMY 2021
Appendix A - European Commerce and the 50 U.S. States: A State-by-State Comparison
South Dakota and Europe
On a country basis, U.K. companies operating in South Dakota represented 11% of total foreign affiliate employment in South Dakota, with U.K. multinationals supporting approximately 100 more jobs in 2018 than in 2010.
Sources: Bureau of Economic Analysis; U.S. Census Bureau; U.S. Department of Commerce; SelectUSA.
5,600Country Employment
Canada 2,800
United Kingdom 1,600
France 1,400
Germany 1,100
Switzerland 400
Employment within South Dakota, 2018
Top Ten Exports to Europe, 2019 ($ millions) Top Ten Imports from Europe, 2019 ($ millions)
Country Exports ($ millions)
Germany 44
Belgium 31
United Kingdom 23
Ukraine 13
Netherlands 9
Country Imports ($ millions)
Germany 42
Italy 25
Netherlands 20
United Kingdom 12
Switzerland 9
Top European Export Markets, 2019 Top European Import Markets, 2019
$159.9 m
South Dakota Goods Exports to Europe, 2019
$165.1 m
South Dakota Goods Imports from Europe, 2019
Machinery manufactures are the state's top export to Europe.
Machinery manufactures, computers & electronic products, and processed foods make up the bulk of imports from Europe.
Machinery Manufactures
Computers & Electronic Prod.
Paper Products
Transportation Equipment
Chemical Manufactures
Elec. Equip., Appliances & Parts
Plastic & Rubber Products
Fabric Mill Products
Printing & Related Products
Misc. Manufactures
Machinery Manufactures
Computers & Electronic Prod.
Processed Foods
Fabric Mill Products
Elec. Equip., Appliances & Parts
Chemical Manufactures
Fabricated Metal Products
Transportation Equipment
Animal Production
Plastic & Rubber Products
European companies account for
40% of foreign affiliate jobs
Number of projects does not directly translate to value of projects or jobs added. Greenfield FDI is investment in new assets.
Sources of Greenfield Foreign Direct Investment (FDI)
Number of Greenfield Projects
CanadaGermany
NetherlandsFrance
Hong Kong
22Greenfield Projects (October 2010 - September 2020)
Since 2006: +2,400(+75.0%)
0 1 2 3 4
9%
18% of the total
14%
14%
9%
69 69
20
11
11
7 7
6 6
5 5
5 5
4 4
4 4
48 48
27
17
16
14
8
7 7
6 6
5 5
5 5
Jobs directly supported by European investment. Total European-related jobs are likely to be higher, because these figures do not include jobs created by trade flows, indirect employment effects through distributors or suppliers, or via non-equity arrangements such as strategic alliances, joint ventures, or other deals.
2006 2018
Jobs
Trade
Investment
0 1 10 100 1,000 10,000 0 1 10 100 1,000 10,000

127 - THE TRANSATLANTIC ECONOMY 2021
Appendix A - European Commerce and the 50 U.S. States: A State-by-State Comparison
Tennessee and Europe
On a country basis, U.K. companies operating in Tennessee represented 12% of total foreign affiliate employment in Tennessee, with U.K. multinationals supporting approximately 3,800 more jobs in 2018 than in 2010.
Sources: Bureau of Economic Analysis; U.S. Census Bureau; U.S. Department of Commerce; SelectUSA.
113,500Country Employment
Japan 47,500
United Kingdom 23,700
Germany 22,800
France 19,200
Canada 15,400
Employment within Tennessee, 2018
Top Ten Exports to Europe, 2019 ($ millions) Top Ten Imports from Europe, 2019 ($ millions)
Country Exports ($ millions)
Netherlands 1,315
Germany 1,119
United Kingdom 1,010
Belgium 985
Italy 593
Country Imports ($ millions)
Ireland 7,813
Germany 4,023
United Kingdom 1,878
Italy 1,543
Switzerland 944
Top European Export Markets, 2019 Top European Import Markets, 2019
$6.8 bn
Tennessee Goods Exports to Europe, 2019
$20.4 bn
Tennessee Goods Imports from Europe, 2019
Miscellaneous manufactured goods and chemicals are the largest export categories to Europe.
Chemicals are the top imported good, comprising over half of the state's total imports from Europe.
Misc. Manufactures
Chemical Manufactures
Transportation Equipment
Computers & Electronic Prod.
Waste & Scrap
Elec. Equip., Appliances & Parts
Machinery Manufactures
Beverage & Tobacco Products
Fabricated Metal Products
Agricultural Products
Chemical Manufactures
Machinery Manufactures
Computers & Electronic Prod.
Misc. Manufactures
Transportation Equipment
Fabricated Metal Products
Elec. Equip., Appliances & Parts
Waste & Scrap
Plastic & Rubber Products
Primary Metal Manufactures
European companies account for
57% of foreign affiliate jobs
Number of projects does not directly translate to value of projects or jobs added. Greenfield FDI is investment in new assets.
Sources of Greenfield Foreign Direct Investment (FDI)
Number of Greenfield Projects
JapanGermany
CanadaU.K.
France
376Greenfield Projects (October 2010 - September 2020)
Since 2006: +38,800(+51.9%)
0 10 20 30 40 50 60 70 80 90
5%
23% of the total23% of the total
15%15%
13%
10%10%
0 10 1,000 100,000
1,466
1,229
988
887
438 438
427 427
324 324
267 267
136
129
0 1 10 100 1,000 10,000 100,000
11,580 11,580
1,824 1,824
1,526 1,526
1,428 1,428
852
721
484 484
451 451
248 248
109
Jobs directly supported by European investment. Total European-related jobs are likely to be higher, because these figures do not include jobs created by trade flows, indirect employment effects through distributors or suppliers, or via non-equity arrangements such as strategic alliances, joint ventures, or other deals.
2006 2018
Trade
Investment
Jobs

128 - THE TRANSATLANTIC ECONOMY 2021
Appendix A - European Commerce and the 50 U.S. States: A State-by-State Comparison
Texas and Europe
On a country basis, U.K. companies operating in Texas represented 18% of total foreign affiliate employment in Texas, with U.K. multinationals supporting approximately 49,300 more jobs in 2018 than in 2010.
Sources: Bureau of Economic Analysis; U.S. Census Bureau; U.S. Department of Commerce; SelectUSA.
401,500Country Employment
United Kingdom 119,900
Japan 75,300
France 64,400
Germany 60,400
Canada 56,700
Employment within Texas, 2018
Top Ten Exports to Europe, 2019 ($ millions) Top Ten Imports from Europe, 2019 ($ millions)
Country Exports ($ millions)
Netherlands 11,595
United Kingdom 9,618
France 4,678
Germany 4,535
Italy 4,109
Country Imports ($ millions)
Germany 8,034
United Kingdom 5,502
Italy 3,931
Russia 3,880
France 3,306
Top European Export Markets, 2019 Top European Import Markets, 2019
$52.5 bn
Texas Goods Exports to Europe, 2019
$42.9 bn
Texas Goods Imports from Europe, 2019
Oil and gas exports to Europe have soared in recent years, due to the shale revolution in the Permian Basin and the opening up of U.S. export markets.
Transportation equipment and chemicals are the top product imports, though total imports are relatively diverse with petroleum & coal and machinery also key imports.
Oil & Gas Extraction
Chemical Manufactures
Computers & Electronic Prod.
Transportation Equipment
Petroleum & Coal Products
Machinery Manufactures
Elec. Equip., Appliances & Parts
Misc. Manufactures
Fabricated Metal Products
Primary Metal Manufactures
European companies account for
60% of foreign affiliate jobs
Number of projects does not directly translate to value of projects or jobs added. Greenfield FDI is investment in new assets.
Sources of Greenfield Foreign Direct Investment (FDI)
Number of Greenfield Projects
U.K.Germany
CanadaJapan
France
1,440Greenfield Projects (October 2010 - September 2020)
Since 2006: +165,600(+70.2%)
0 50 100 150 200 250 300 350
5%
21% of the total21% of the total
10%
9%9%
8%
0 10 1,000 100,000
22,700 22,700
8,360 8,360
4,942
3,930
3,105
2,880
1,316
1,235
1,058
486 486
Jobs directly supported by European investment. Total European-related jobs are likely to be higher, because these figures do not include jobs created by trade flows, indirect employment effects through distributors or suppliers, or via non-equity arrangements such as strategic alliances, joint ventures, or other deals.
2006 2018
Transportation Equipment
Chemical Manufactures
Petroleum & Coal Products
Machinery Manufactures
Computers & Electronic Prod.
Primary Metal Manufactures
Fabricated Metal Products
Elec. Equip., Appliances & Parts
Beverage & Tobacco Products
Misc. Manufactures
0 1 10 100 1,000 10,000 100,000
8,246 8,246
6,168 6,168 6,168
5,453 5,453 5,453
5,028 5,028 5,028
3,967 3,967
2,550 2,550
1,936 1,936
1,407 1,407
1,325 1,325
999 999
Jobs
Trade
Investment

129 - THE TRANSATLANTIC ECONOMY 2021
Appendix A - European Commerce and the 50 U.S. States: A State-by-State Comparison
Utah and Europe
On a country basis, U.K. companies operating in Utah represented 21% of total foreign affiliate employment in Utah, with U.K. multinationals supporting approximately 4,900 more jobs in 2018 than in 2010.
Sources: Bureau of Economic Analysis; U.S. Census Bureau; U.S. Department of Commerce; SelectUSA.
33,200Country Employment
United Kingdom 10,700
France 5,500
Germany 5,200
Switzerland 3,400
Canada 3,200
Employment within Utah, 2018
Top Ten Exports to Europe, 2019 ($ millions) Top Ten Imports from Europe, 2019 ($ millions)
Country Exports ($ millions)
United Kingdom 8,752
Netherlands 486
Switzerland 403
Germany 401
France 215
Country Imports ($ millions)
Germany 299
France 213
United Kingdom 141
Italy 134
Austria 118
Top European Export Markets, 2019 Top European Import Markets, 2019
$11.0 bn
Utah Goods Exports to Europe, 2019
$1.6 bn
Utah Goods Imports from Europe, 2019
Primary metals dominate the state's exports to Europe, representing over 80% of Utah's total exports.
Imports are much more diversified than exports. Machinery, computers & electronic products, and chemicals are the state's top imports from Europe.
Primary Metal Manufactures
Misc. Manufactures
Transportation Equipment
Chemical Manufactures
Computers & Electronic Prod.
Elec. Equip., Appliances & Parts
Mining
Machinery Manufactures
Processed Foods
Plastic & Rubber Products
Machinery Manufactures
Computers & Electronic Prod.
Chemical Manufactures
Misc. Manufactures
Transportation Equipment
Fabricated Metal Products
Elec. Equip., Appliances & Parts
Leather & Related Goods
Plastic & Rubber Products
Processed Foods
2006 2018
European companies account for
66% of foreign affiliate jobs
Number of projects does not directly translate to value of projects or jobs added. Greenfield FDI is investment in new assets.
Sources of Greenfield Foreign Direct Investment (FDI)
Number of Greenfield Projects
U.K.AustraliaSweden
GermanySwitzerland
67Greenfield Projects (October 2010 - September 2020)
Since 2006: +6,300(+23.4%)
0 2 4 6 8 10 12
9%
19% of the total
11%
9%
9%
0 1 10 100 1,000 10,000 0 1 10 100 1,000 10,000
276 276
214 214
204 204
185 185
135
84
63 63
50 50
50 50
33 33
8,875
373 373
346 346
340 340
298 298
221
135
126
94
53 53
Jobs directly supported by European investment. Total European-related jobs are likely to be higher, because these figures do not include jobs created by trade flows, indirect employment effects through distributors or suppliers, or via non-equity arrangements such as strategic alliances, joint ventures, or other deals.
Trade
Investment
Jobs

130 - THE TRANSATLANTIC ECONOMY 2021
Appendix A - European Commerce and the 50 U.S. States: A State-by-State Comparison
Vermont and Europe
On a country basis, Dutch companies operating in Vermont represented 33% of total foreign affiliate employment in Vermont, with Dutch multinationals supporting approximately 3,250 more jobs in 2018 than in 2010.
*Netherlands and U.K. employment data suppressed to avoid disclosure of individual company data. Range of 2,500 - 4,999 employees given for the Netherlands; 500-999 employees for the U.K.)
Sources: Bureau of Economic Analysis; U.S. Census Bureau; U.S. Department of Commerce; SelectUSA.
8,300Country Employment
Netherlands 3,750*
Canada 1,800
France 1,400
Switzerland 900
United Kingdom 750*
Employment within Vermont, 2018
Top Ten Exports to Europe, 2019 ($ millions) Top Ten Imports from Europe, 2019 ($ millions)
Country Exports ($ millions)
Germany 98
United Kingdom 94
Netherlands 84
France 48
Estonia 24
Country Imports ($ millions)
France 122
Germany 84
United Kingdom 41
Italy 30
Russia 27
Top European Export Markets, 2019 Top European Import Markets, 2019
$457.3 m
Vermont Goods Exports to Europe, 2019
$437.0 m
Vermont Goods Imports from Europe, 2019
About 38% of exports consist of computers & electronic products.
Computers & electronics are also the state's top import from Europe, also representing roughly 38% of the total goods imported from Europe.
Computers & Electronic Prod.
Misc. Manufactures
Machinery Manufactures
Transportation Equipment
Chemical Manufactures
Plastic & Rubber Products
Elec. Equip., Appliances & Parts
Fabric Mill Products
Furniture & Related Products
Fabricated Metal Products
Computers & Electronic Prod.
Machinery Manufactures
Fabricated Metal Products
Processed Foods
Plastic & Rubber Products
Chemical Manufactures
Misc. Manufactures
Transportation Equipment
Non-Metallic Mineral Mfgs.
Elec. Equip., Appliances & Parts
European companies account for
74% of foreign affiliate jobs
Number of projects does not directly translate to value of projects or jobs added. Greenfield FDI is investment in new assets.
Sources of Greenfield Foreign Direct Investment (FDI)
Number of Greenfield Projects
CanadaSwitzerland
UAESouth Korea
U.K.
14Greenfield Projects (October 2010 - September 2020)
Since 2006: +1,600(+23.9%)
0 1 2 3 4 5 6
7%
36% of the total36% of the total
14%
7%
7%
162
62 62
34 34
32 32
31 31
22
13
11
9
8
174
84
51 51
34 34
26
25
21
7 7
5 5
5 5
Jobs directly supported by European investment. Total European-related jobs are likely to be higher, because these figures do not include jobs created by trade flows, indirect employment effects through distributors or suppliers, or via non-equity arrangements such as strategic alliances, joint ventures, or other deals.
2006 2018
Jobs
Trade
Investment
0 1 10 100 1,000 10,000 0 1 10 100 1,000 10,000

131 - THE TRANSATLANTIC ECONOMY 2021
Appendix A - European Commerce and the 50 U.S. States: A State-by-State Comparison
Virginia and Europe
On a country basis, U.K. companies operating in Virginia represented 20% of total foreign affiliate employment in Virginia, with U.K. multinationals supporting approximately 12,900 more jobs in 2018 than in 2010.
Sources: Bureau of Economic Analysis; U.S. Census Bureau; U.S. Department of Commerce; SelectUSA.
153,100Country Employment
United Kingdom 41,200
Netherlands 31,300
Germany 23,200
Canada 18,200
France 17,100
Employment within Virginia, 2018
Top Ten Exports to Europe, 2019 ($ millions) Top Ten Imports from Europe, 2019 ($ millions)
Country Exports ($ millions)
United Kingdom 929
Germany 725
Belgium 614
Netherlands 522
France 292
Country Imports ($ millions)
Germany 2,493
United Kingdom 1,180
France 1,010
Italy 840
Austria 739
Top European Export Markets, 2019 Top European Import Markets, 2019
$5.3 bn
Virginia Goods Exports to Europe, 2019
$9.1 bn
Virginia Goods Imports from Europe, 2019
Top exports include minerals & ores, chemicals, and transportation equipment.
Machinery is the largest import from Europe, followed by transportation equipment, chemicals, and computers.
Mining
Chemical Manufactures
Transportation Equipment
Computers & Electronic Prod.
Machinery Manufactures
Agricultural Products
Misc. Manufactures
Paper Products
Elec. Equip., Appliances & Parts
Fabricated Metal Products
Machinery Manufactures
Transportation Equipment
Chemical Manufactures
Computers & Electronic Prod.
Fabricated Metal Products
Beverage & Tobacco Products
Elec. Equip., Appliances & Parts
Primary Metal Manufactures
Processed Foods
Misc. Manufactures
European companies account for
73% of foreign affiliate jobs
Number of projects does not directly translate to value of projects or jobs added. Greenfield FDI is investment in new assets.
Sources of Greenfield Foreign Direct Investment (FDI)
Number of Greenfield Projects
U.K.Germany
JapanCanada
Switzerland
307Greenfield Projects (October 2010 - September 2020)
Since 2006: +40,800(+36.3%)
0 10 20 30 40 50 60
7%
14% of the total14% of the total
12%12%
10%
10%
1,963 1,963
1,951 1,951
1,069 1,069
757
531 531
521 521
290 290
279 279
251 251
244 244
1,158
748
698
572 572
324 324
287 287
247 247
237 237
148
146
Jobs directly supported by European investment. Total European-related jobs are likely to be higher, because these figures do not include jobs created by trade flows, indirect employment effects through distributors or suppliers, or via non-equity arrangements such as strategic alliances, joint ventures, or other deals.
2006 2018
Trade
Investment
Jobs
0 1 10 100 1,000 10,000 0 1 10 100 1,000 10,000

132 - THE TRANSATLANTIC ECONOMY 2021
Appendix A - European Commerce and the 50 U.S. States: A State-by-State Comparison
Washington and Europe
On a country basis, U.K. companies operating in Washington represented 16% of total foreign affiliate employment in Washington, with U.K. multinationals supporting approximately 9,100 more jobs in 2018 than in 2010.
Sources: Bureau of Economic Analysis; U.S. Census Bureau; U.S. Department of Commerce; SelectUSA.
83,400Country Employment
Canada 23,600
United Kingdom 23,000
Germany 19,400
Japan 14,800
France 12,200
Employment within Washington, 2018
Top Ten Exports to Europe, 2019 ($ millions) Top Ten Imports from Europe, 2019 ($ millions)
Country Exports ($ millions)
United Kingdom 1,859
Germany 1,762
Turkey 1,419
Netherlands 1,299
Russia 861
Country Imports ($ millions)
Russia 1,154
Germany 1,013
France 554
Italy 504
United Kingdom 454
Top European Export Markets, 2019 Top European Import Markets, 2019
$11.1 bn
Washington Goods Exports to Europe, 2019
$5.4 bn
Washington Goods Imports from Europe, 2019
Transportation equipment dominates Washington's exports to Europe, making up almost 65% of total exports.
Imports from Europe are less concentrated than exports. The state's top import, machinery, makes up only 17% of total goods imports from Europe.
Transportation Equipment
Computers & Electronic Prod.
Machinery Manufactures
Elec. Equip., Appliances & Parts
Fish & Marine Products
Chemical Manufactures
Agricultural Products
Primary Metal Manufactures
Fabricated Metal Products
Processed Foods
Machinery Manufactures
Chemical Manufactures
Fish & Marine Products
Transportation Equipment
Computers & Electronic Prod.
Petroleum & Coal Products
Beverage & Tobacco Products
Elec. Equip., Appliances & Parts
Fabricated Metal Products
Furniture & Related Products
European companies account for
59% of foreign affiliate jobs
Number of projects does not directly translate to value of projects or jobs added. Greenfield FDI is investment in new assets.
Sources of Greenfield Foreign Direct Investment (FDI)
Number of Greenfield Projects
U.K.Canada
JapanChinaIndia
251Greenfield Projects (October 2010 - September 2020)
Since 2006: +27,000(+47.9%)
0 5 10 15 20 25 30 35 40
7%7%
12% of the total12% of the total12% of the total
10%
10%
8%
0 10 1,000 10,000 0 1 10 100 1,000 10,000 100,000
936
658
525 525
482 482
382 382
332 332
305 305
192 192
168 168
153 153
7,142
1,093
497 497
431 431
298 298
269 269
232 232
202 202
189 189
174 174
Jobs directly supported by European investment. Total European-related jobs are likely to be higher, because these figures do not include jobs created by trade flows, indirect employment effects through distributors or suppliers, or via non-equity arrangements such as strategic alliances, joint ventures, or other deals.
2006 2018
Jobs
Trade
Investment

133 - THE TRANSATLANTIC ECONOMY 2021
Appendix A - European Commerce and the 50 U.S. States: A State-by-State Comparison
West Virginia and Europe
On a country basis, U.K. companies operating in West Virginia represented 11% of total foreign affiliate employment in West Virginia, with U.K. multinationals supporting approximately 1,300 fewer jobs in 2018 than in 2010.
Sources: Bureau of Economic Analysis; U.S. Census Bureau; U.S. Department of Commerce; SelectUSA.
13,400Country Employment
Canada 6,000
Japan 4,200
United Kingdom 3,100
Netherlands 2,700
Switzerland 1,700
Employment within West Virginia, 2018
Top Ten Exports to Europe, 2019 ($ millions) Top Ten Imports from Europe, 2019 ($ millions)
Country Exports ($ millions)
Ukraine 481
Netherlands 447
Belgium 256
Germany 190
Italy 140
Country Imports ($ millions)
Germany 227
France 102
Italy 97
United Kingdom 58
Poland 41
Top European Export Markets, 2019 Top European Import Markets, 2019
$1.9 bn
West Virginia Goods Exports to Europe, 2019
$0.7 bn
West Virginia Goods Imports from Europe, 2019
Mining products such as minerals and ores accounted for 57% of exports to Europe in 2019.
Chemicals and machinery are West Virginia's top imports from Europe.
Mining
Chemical Manufactures
Transportation Equipment
Primary Metal Manufactures
Machinery Manufactures
Non-Metallic Mineral Mfgs.
Misc. Manufactures
Computers & Electronic Prod.
Waste & Scrap
Wood Products
Chemical Manufactures
Machinery Manufactures
Primary Metal Manufactures
Transportation Equipment
Fabricated Metal Products
Computers & Electronic Prod.
Elec. Equip., Appliances & Parts
Fabric Mill Products
Non-Metallic Mineral Mfgs.
Waste & Scrap
European companies account for
47% of foreign affiliate jobs
Number of projects does not directly translate to value of projects or jobs added. Greenfield FDI is investment in new assets.
Sources of Greenfield Foreign Direct Investment (FDI)
Number of Greenfield Projects
JapanItaly
CanadaChina
U.K.
50Greenfield Projects (October 2010 - September 2020)
Since 2006: +1,100(+8.9%)
0 2 4 6 8 10 12 14
6%6%
24% of the total24% of the total
14%14%
10%10%
8%
171
167
118
117
48 48
26 26
12
10
7 7
6 6
1,103
466 466
99
58 58
31
26
24
16
10
9
Jobs directly supported by European investment. Total European-related jobs are likely to be higher, because these figures do not include jobs created by trade flows, indirect employment effects through distributors or suppliers, or via non-equity arrangements such as strategic alliances, joint ventures, or other deals.
Trade
Investment
Jobs
0 1 10 100 1,000 10,000 0 1 10 100 1,000 10,000
2006 2018

134 - THE TRANSATLANTIC ECONOMY 2021
Appendix A - European Commerce and the 50 U.S. States: A State-by-State Comparison
Wisconsin and Europe
On a country basis, U.K. companies operating in Wisconsin represented 14% of total foreign affiliate employment in Wisconsin, with U.K. multinationals supporting approximately 5,400 more jobs in 2018 than in 2010.
Sources: Bureau of Economic Analysis; U.S. Census Bureau; U.S. Department of Commerce; SelectUSA.
81,500Country Employment
United Kingdom 16,700
Canada 16,500
Germany 14,700
France 10,100
Switzerland 10,000
Employment within Wisconsin, 2018
Top Ten Exports to Europe, 2019 ($ millions) Top Ten Imports from Europe, 2019 ($ millions)
Country Exports ($ millions)
United Kingdom 805
Germany 760
Netherlands 452
France 435
Belgium 419
Country Imports ($ millions)
Ireland 2,333
Germany 1,932
Italy 925
United Kingdom 778
France 478
Top European Export Markets, 2019 Top European Import Markets, 2019
$4.4 bn
Wisconsin Goods Exports to Europe, 2019
$8.9 bn
Wisconsin Goods Imports from Europe, 2019
Machinery and computers & electronic products are the state's top exports to Europe.
Chemicals and machinery accounted for 38% and 27% of total imports from Europe, respectively.
Machinery Manufactures
Computers & Electronic Prod.
Chemical Manufactures
Transportation Equipment
Elec. Equip., Appliances & Parts
Misc. Manufactures
Agricultural Products
Fabricated Metal Products
Processed Foods
Plastic & Rubber Products
Chemical Manufactures
Machinery Manufactures
Computers & Electronic Prod.
Elec. Equip., Appliances & Parts
Misc. Manufactures
Fabricated Metal Products
Primary Metal Manufactures
Processed Foods
Plastic & Rubber Products
Transportation Equipment
2006 2018
European companies account for
68% of foreign affiliate jobs
Number of projects does not directly translate to value of projects or jobs added. Greenfield FDI is investment in new assets.
Sources of Greenfield Foreign Direct Investment (FDI)
Number of Greenfield Projects
GermanyCanada
SwitzerlandU.K.
Ireland
138Greenfield Projects (October 2010 - September 2020)
Since 2006: +17,400(+27.1%)
0 2 4 6 8 10 12 14 16 18 20 22
6%
14% of the total14% of the total14% of the total
12%12%
10%
9%
3,403 3,403
2,446 2,446
742
434 434
296 296
289 289
260 260
205 205
154
144
1,243 1,243
631 631
577 577
481 481
302 302
228 228
167
162
158
149
Jobs directly supported by European investment. Total European-related jobs are likely to be higher, because these figures do not include jobs created by trade flows, indirect employment effects through distributors or suppliers, or via non-equity arrangements such as strategic alliances, joint ventures, or other deals.
Jobs
Trade
Investment
0 1 10 100 1,000 10,000 0 1 10 100 1,000 10,000

135 - THE TRANSATLANTIC ECONOMY 2021
Appendix A - European Commerce and the 50 U.S. States: A State-by-State Comparison
Wyoming and Europe
On a country basis, U.K. companies operating in Wyoming represented 24% of total foreign affiliate employment in Wyoming, with U.K. multinationals supporting approximately 300 more jobs in 2018 than in 2010.
Sources: Bureau of Economic Analysis; U.S. Census Bureau; U.S. Department of Commerce; SelectUSA.
5,200Country Employment
United Kingdom 2,000
France 1,100
Canada 800
Switzerland 300
Germany 200
Employment within Wyoming, 2018
Top Ten Exports to Europe, 2019 ($ millions) Top Ten Imports from Europe, 2019 ($ millions)
Country Exports ($ millions)
Austria 9
Belgium 8
Netherlands 7
Ireland 5
Switzerland 4
Country Imports ($ millions)
Germany 21
Italy 16
Turkey 15
United Kingdom 10
Belgium 5
Top European Export Markets, 2019 Top European Import Markets, 2019
$52.1 m
Wyoming Goods Exports to Europe, 2019
$97.8 m
Wyoming Goods Imports from Europe, 2019
Chemicals accounted for 22% of Wyoming's exports to Europe in 2019, down from a share of approximately 50% the prior year.
Machinery and fabricated metal products are Wyoming's top imports from Europe.
Chemical Manufactures
Used Merchandise
Computers & Electronic Prod.
Elec. Equip., Appliances & Parts
Wood Products
Machinery Manufactures
Fabricated Metal Products
Transportation Equipment
Mining
Misc. Manufactures
Machinery Manufactures
Fabricated Metal Products
Used Merchandise
Computers & Electronic Prod.
Leather & Related Goods
Processed Foods
Plastic & Rubber Products
Transportation Equipment
Chemical Manufactures
Elec. Equip., Appliances & Parts
European companies account for
63% of foreign affiliate jobs
Number of projects does not directly translate to value of projects or jobs added. Greenfield FDI is investment in new assets.
Sources of Greenfield Foreign Direct Investment (FDI)
Number of Greenfield Projects
BelgiumCanadaTurkeySpain
Hong Kong
10Greenfield Projects (October 2010 - September 2020)
Since 2006: +300(+6.1%)
0 1 2 3 4 5
10%
30% of the total30% of the total
20%
10%
10%
25 25
14
13
10
6 6
5 5
4 4
4 4
4 4
3
12
10
6 6
6 6
5 5
5 5
4
2 2 2
1.2 1.2 1.2
0.6 0.6 0.6
Jobs directly supported by European investment. Total European-related jobs are likely to be higher, because these figures do not include jobs created by trade flows, indirect employment effects through distributors or suppliers, or via non-equity arrangements such as strategic alliances, joint ventures, or other deals.
2006 2018
Trade
Investment
Jobs
0 1 10 100 1,000 10,000 0 1 10 100 1,000 10,000