appendix a - mass.gov · web viewassessment methodology guidelines for evaluating designated use...
TRANSCRIPT
APPENDIX AASSESSMENT METHODOLOGY GUIDELINES FOR EVALUATING DESIGNATED
USE STATUS OF MASSACHUSETTS SURFACE WATERS
The Clean Water Act (CWA) Section 305(b) water quality reporting process is an essential aspect of the Nation's water pollution control effort. It is the principal means by which EPA, Congress, and the public evaluate existing water quality, assess progress made in maintaining and restoring water quality, and determine the extent of remaining problems. By this process, states report on waterbodies within the context of meeting their designated uses. These uses include: Aquatic Life, Fish Consumption, Drinking Water, Primary Contact Recreation, Secondary Contact Recreation, Shellfish Harvesting and Aesthetics. Two subclasses of Aquatic Life are also designated in the Massachusetts Surface Water Quality Standards (SWQS): Cold Water Fishery – waters capable of sustaining a year-round population of cold water aquatic life, such as trout – and Warm Water Fishery – waters that are not capable of sustaining a year-round population of cold water aquatic life (MassDEP 1996).
The SWQS, summarized in Table A1, prescribe minimum water quality criteria to sustain the designated uses. Furthermore, these standards describe the hydrological conditions at which water quality criteria must be applied (MassDEP 1996). In rivers the lowest flow conditions at and above which aquatic life criteria must be applied are the lowest mean flow for seven consecutive days to be expected once in ten years (7Q10). In artificially regulated waters, the lowest flow conditions at which aquatic life criteria must be applied are the flow equal or exceeded 99% of the time on a yearly basis or another equivalent flow that has been agreed upon. In coastal and marine waters and for lakes, the Massachusetts Department of Environmental Protection (MassDEP) will determine by on a case-by-case basis the most severe hydrological condition for which the aquatic life criteria must be applied.
The availability of appropriate and reliable scientific data and technical information is fundamental to the 305(b) reporting process. It is EPA policy (EPA Order 5360.1 CHG 1) that any individual or group performing work for or on behalf of EPA establish a quality system to support the development, review, approval, implementation, and assessment of data collection operations. To this end MassDEP describes its Quality System in an EPA-approved Quality Management Plan to ensure that environmental data collected or compiled by the MassDEP are of known and documented quality and are suitable for their intended use. For external sources of information, MassDEP requires the following: 1) an appropriate Quality Assurance Project Plan (QAPP) including a laboratory Quality Assurance /Quality Control (QA/QC) plan; 2) use of a state certified lab (or as otherwise approved by DEP for a particular analysis); and 3) sample data, QA/QC and other pertinent sample handling information documented in a citable report. This information will be reviewed by MassDEP to determine its validity and usability to assess water use support. Data use could be modified or rejected due to poor or undocumented QAPP implementation, lack of project documentation, incomplete reporting of data or information, and/or project monitoring objectives unsuitable for MassDEP assessment purposes.
EPA provides guidelines to states for making their use support determinations (EPA 1997 and 2002, Grubbs and Wayland III 2000 and Wayland III 2001). The determination of whether or not a waterbody supports each of its designated uses is a function of the type(s), quality and quantity of available current information. Although data/information older than five years are usually considered “historical” and used for descriptive purposes they can be utilized in the use support
North Shore Coastal Watersheds 2002 Water Quality Assessment Report Appendix A A193wqar06.doc DWM CN 138.5

determination provided they are known to reflect the current conditions. While the water quality standards (Table A1) prescribe minimum water quality criteria to sustain the designated uses, numerical criteria are not available for every indicator of pollution. Best available guidance from available literature may be applied in lieu of actual numerical criteria (e.g., freshwater sediment data may be compared to Guidelines for the Protection and Management of Aquatic Sediment Quality in Ontario 1993 by D. Persaud, R. Jaagumagi and A. Hayton). Excursions from criteria due solely to “naturally occurring” conditions (e.g., low pH in some areas) do not constitute violations of the SWQS.
Each designated use within a given segment is individually assessed as support or impaired. When too little current data/information exist or no reliable data are available, the use is not assessed. In this report, however, if there is some indication that water quality impairment may exist, and it is not “naturally occurring”, the use is identified with an “Alert Status”. It is important to note that not all waters are assessed. Many small and/or unnamed ponds, rivers, and estuaries have never been assessed; the status of their designated uses has never been reported to EPA in the Commonwealth’s 305(b) Report or the Integrated List of Waters nor is information on these waters maintained in the waterbody system database (WBS) or the new assessment database (ADB).
Table A1. Summary of Massachusetts Surface Water Quality Standards (MassDEP 1996, MA DPH 2002, and FDA 2003).
Dissolved Oxygen Class A, Class B Cold Water Fishery (BCWF), and Class SA: 6.0 mg/L and >75% saturation unless background conditions are lowerClass B Warm Water Fishery (BWWF) and Class SB: 5.0 mg/L and >60% saturation unless background conditions are lowerClass C: Not <5.0 mg/L for more than 16 of any 24-hour period and not <3.0 mg/L anytime unless background conditions are lower; levels cannot be lowered below 50% saturation due to a dischargeClass SC: Not <5.0 mg/L for more than 16 of any 24-hour period and not <4.0 mg/L anytime unless background conditions are lower; and 50% saturation; levels cannot be lowered below 50% saturation due to a discharge
Temperature Class A: <68°F (20°C) and 1.5°F (0.8°C) for Cold Water and <83°F (28.3°C) and 1.5°F (0.8°C) for Warm Water.Class BCWF: <68°F (20°C) and 3°F (1.7°C) due to a dischargeClass BWWF: <83°F (28.3°C) and 3°F (1.7°C) in lakes, 5°F (2.8°C) in riversClass C and Class SC: <85°F (29.4°C) nor 5°F (2.8°C) due to a dischargeClass SA: <85°F (29.4°C) nor a maximum daily mean of 80°F (26.7°C) and 1.5°F (0.8°C)Class SB: <85°F (29.4°C) nor a maximum daily mean of 80°F (26.7°C) and 1.5°F (0.8°C) between July through September and 4.0°F (2.2°C) between October through June
pH Class A, Class BCWF and Class BWWF: 6.5 - 8.3 SU and 0.5 outside the background range.Class C: 6.5 - 9.0 SU and 1.0 outside the naturally occurring range.Class SA and Class SB: 6.5 - 8.5 SU and 0.2 outside the normally occurring range.Class SC: 6.5 - 9.0 SU and 0.5 outside the naturally occurring range.
Solids All Classes: These waters shall be free from floating, suspended, and settleable solids in concentrations or combinations that would impair any use assigned to each class, that would cause aesthetically objectionable conditions, or that would impair the benthic biota or degrade the chemical composition of the bottom.
Color and Turbidity All Classes: These waters shall be free from color and turbidity in concentrations or combinations that are aesthetically objectionable or would impair any use.
Oil and Grease Class A and Class SA: Waters shall be free from oil and grease, petrochemicals and other volatile or synthetic organic pollutants.Class SA: Waters shall be free from oil and grease and petrochemicals. Class B, Class C, Class SB and Class SC: Waters shall be free from oil and grease, petrochemicals that produce a visible film on the surface of the water, impart an oily taste to the water or an oily or other undesirable taste to the edible portions of aquatic life, coat the banks or bottom of the water course or are deleterious or become toxic to aquatic life.
Taste and Odor Class A and Class SA: None other than of natural origin.
North Shore Coastal Watersheds 2002 Water Quality Assessment Report Appendix A A293wqar06.doc DWM CN 138.5

Class B, Class C, Class SB and Class SC: None in such concentrations or combinations that are aesthetically objectionable, that would impair any use assigned to each class, or that would cause tainting or undesirable flavors in the edible portions of aquatic life.
Aesthetics All Classes: All surface waters shall be free from pollutants in concentrations or combinations that settle to form objectionable deposits; float as debris, scum or other matter to form nuisances; produce objectionable odor, color, taste or turbidity; or produce undesirable or nuisance species of aquatic life.
Toxic Pollutants All Classes: All surface waters shall be free from pollutants in concentrations or combinations that are toxic to humans, aquatic life or wildlife… The division shall use the recommended limit published by EPA pursuant to 33 USC 1251, 304(a) as the allowable receiving water concentrations for the affected waters unless a site-specific limit is established.
Nutrients Shall not exceed the site-specific limits necessary to control accelerated or cultural eutrophication.
Note: Italics are direct quotations. criterion (referring to a change from natural background conditions) is applied to the effects of a permitted discharge.
North Shore Coastal Watersheds 2002 Water Quality Assessment Report Appendix A A393wqar06.doc DWM CN 138.5
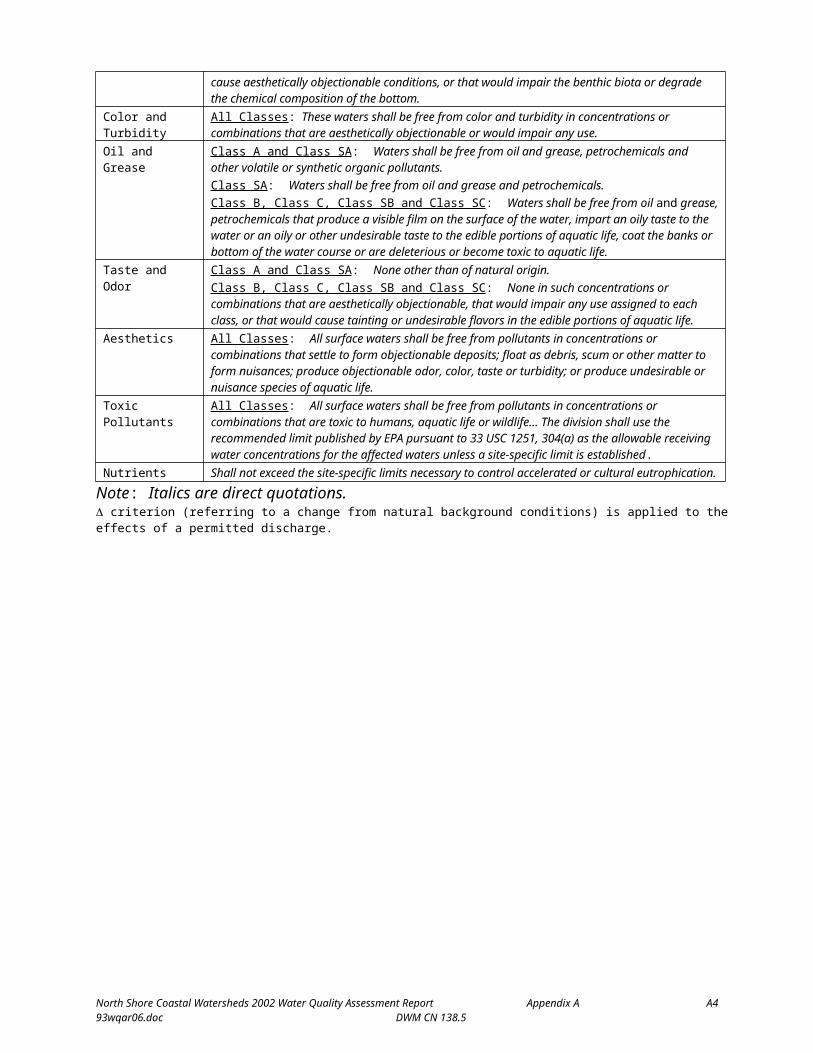
Table A1 Continued. Summary of Massachusetts Surface Water Quality Standards (MassDEP 1996, MA DPH 2002, and FDA 2003).
Bacteria (MassDEP 1996 and MA DPH 2002)
Class A criteria apply to the Drinking Water Use.
Class B and SB criteria apply to Primary Contact Recreation Use while Class C and SC criteria apply to Secondary Contact Recreation Use.
Class A: Fecal coliform bacteria:
An arithmetic mean of <20 cfu/100 ml in any representative set of samples and <10% of the samples >100 cfu/100 ml.
Class B: At public bathing beaches, as defined by MA DPH, where E. coli is the chosen indicator:
No single E. coli sample shall exceed 235 E. coli /100 ml and the geometric mean of the most recent five E. coli samples within the same bathing season shall not exceed 126 E. coli / 100 ml.
At public bathing beaches, as defined by MA DPH, where Enterococci are the chosen indicator:No single Enterococci sample shall exceed 61 Enterococci /100 ml and the geometric mean of the most recent five Enterococci samples within same bathing season shall not exceed 33 Enterococci /100 ml.
Current standards for other waters (not designated as bathing beaches), where fecal coliform bacteria are the chosen indicator:
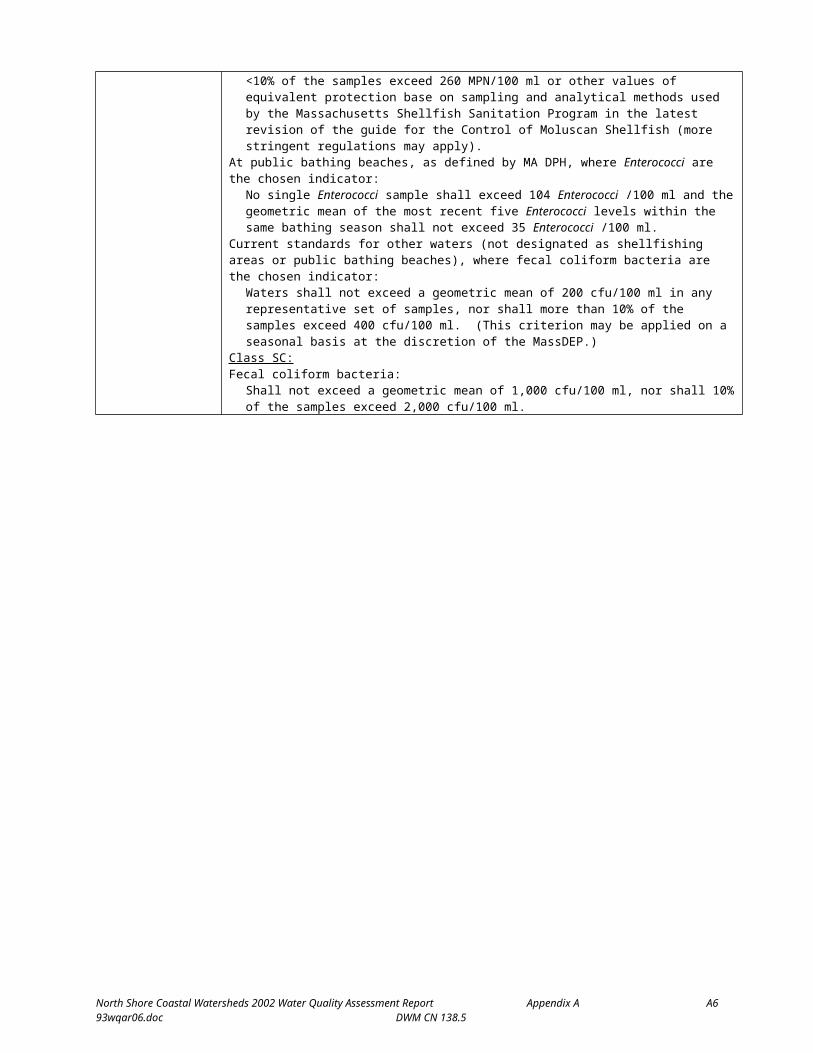
Waters shall not exceed a geometric mean of 200 cfu/100 ml in any representative set of samples, nor shall more than 10% of the samples exceed 400 cfu/100 ml. (This criterion may be applied on a seasonal basis at the discretion of the MassDEP.)
Class C: Fecal coliform bacteria:
Shall not exceed a geometric mean of 1,000 cfu/100 ml, nor shall 10% of the samples exceed 2,000 cfu/100 ml.
Class SA:Fecal coliform bacteria:
Waters designated shellfishing shall not exceed a geometric mean (most probable number (MPN) method) of 14 MPN/100 ml, nor shall more than 10% of the samples exceed 28 MPN/100 ml, or other values of equivalent protection based on sampling and analytical methods used by the Massachusetts Division of Marine Fisheries and approved by the National Shellfish Sanitation Program in the latest version of the Guide for the Control of Molluscan Shellfish Areas (more stringent regulations may apply).
At public bathing beaches, as defined by MA DPH, where Enterococci are the chosen indicator:No single Enterococci sample shall exceed 104 Enterococci /100 ml and the geometric mean of the five most recent Enterococci levels within the same bathing season shall not exceed 35 Enterococci /100 ml.
Current standards for other waters (not designated as shellfishing areas or public bathing beaches), where fecal coliform bacteria are the chosen indicator:
Waters shall not exceed a geometric mean of 200 cfu/100 ml in any representative set of samples, nor shall more than 10% of the samples exceed 400 cfu/100 ml. (This criterion may be applied on a seasonal basis at the discretion of the MassDEP.)
Class SB: Fecal coliform bacteria:
Waters designated for shellfishing shall not exceed a fecal coliform median or geometric mean (MPN method) of 88 MPN/100 ml, nor shall <10% of the samples exceed 260 MPN/100 ml or other values of equivalent protection base on sampling and analytical methods used by the Massachusetts Shellfish Sanitation Program in the latest revision of the guide for the Control of Moluscan Shellfish (more stringent regulations may apply).
At public bathing beaches, as defined by MA DPH, where Enterococci are the chosen indicator:No single Enterococci sample shall exceed 104 Enterococci /100 ml and the geometric mean of the most recent five Enterococci levels within the same bathing season shall not exceed 35 Enterococci /100 ml.
Current standards for other waters (not designated as shellfishing areas or public bathing beaches), where fecal coliform bacteria are the chosen indicator:
Waters shall not exceed a geometric mean of 200 cfu/100 ml in any representative set of samples, nor shall more than 10% of the samples exceed 400 cfu/100 ml. (This criterion may be applied on a seasonal basis at the discretion of the MassDEP.)
Class SC:Fecal coliform bacteria:
Shall not exceed a geometric mean of 1,000 cfu/100 ml, nor shall 10% of the samples exceed 2,000 cfu/100 ml.
North Shore Coastal Watersheds 2002 Water Quality Assessment Report Appendix A A493wqar06.doc DWM CN 138.5

DESIGNATED USES
The Massachusetts Surface Water Quality Standards designate the most sensitive uses for which the surface waters of the Commonwealth shall be enhanced, maintained and protected. Each of these uses is briefly described below (MassDEP 1996):
AQUATIC LIFE - suitable habitat for sustaining a native, naturally diverse, community of aquatic flora and fauna. Two subclasses of aquatic life are also designated in the standards for freshwater bodies: Cold Water Fishery - capable of sustaining a year-round population of cold water aquatic life, such as trout; Warm Water Fishery - waters that are not capable of sustaining a year-round population of cold water aquatic life.
FISH CONSUMPTION - pollutants shall not result in unacceptable concentrations in edible portions of marketable fish or for the recreational use of fish, other aquatic life or wildlife for human consumption.
DRINKING WATER - used to denote those waters used as a source of public drinking water. They may be subject to more stringent regulation in accordance with the Massachusetts Drinking Water Regulations (310 CMR 22.00). These waters are designated for protection as Outstanding Resource Waters under 314 CMR 4.04(3).
SHELLFISH HARVESTING (in SA and SB segments) – Class SA waters in approved areas (Open Shellfish Areas) shellfish harvested without depuration shall be suitable for consumption; Class SB waters in approved areas (Restricted Shellfish Areas) shellfish harvested with depuration shall be suitable for consumption.
PRIMARY CONTACT RECREATION - suitable for any recreation or other water use in which there is prolonged and intimate contact with the water with a significant risk of ingestion of water. These include, but are not limited to, wading, swimming, diving, surfing and water skiing.
SECONDARY CONTACT RECREATION - suitable for any recreation or other water use in which contact with the water is either incidental or accidental. These include, but are not limited to, fishing, boating and limited contact incident to shoreline activities.
AESTHETICS - all surface waters shall be free from pollutants in concentrations or combinations that settle to form objectionable deposits; float as debris, scum or other matter to form nuisances; produce objectionable odor, color, taste or turbidity; or produce undesirable or nuisance species of aquatic life.
AGRICULTURAL AND INDUSTRIAL - suitable for irrigation or other agricultural process water and for compatible industrial cooling and process water.
The guidance used to assess the Aquatic Life, Fish Consumption, Drinking Water, Shellfish Harvesting, Primary and Secondary Contact Recreation and Aesthetics uses follows.
North Shore Coastal Watersheds 2002 Water Quality Assessment Report Appendix A A593wqar06.doc DWM CN 138.5
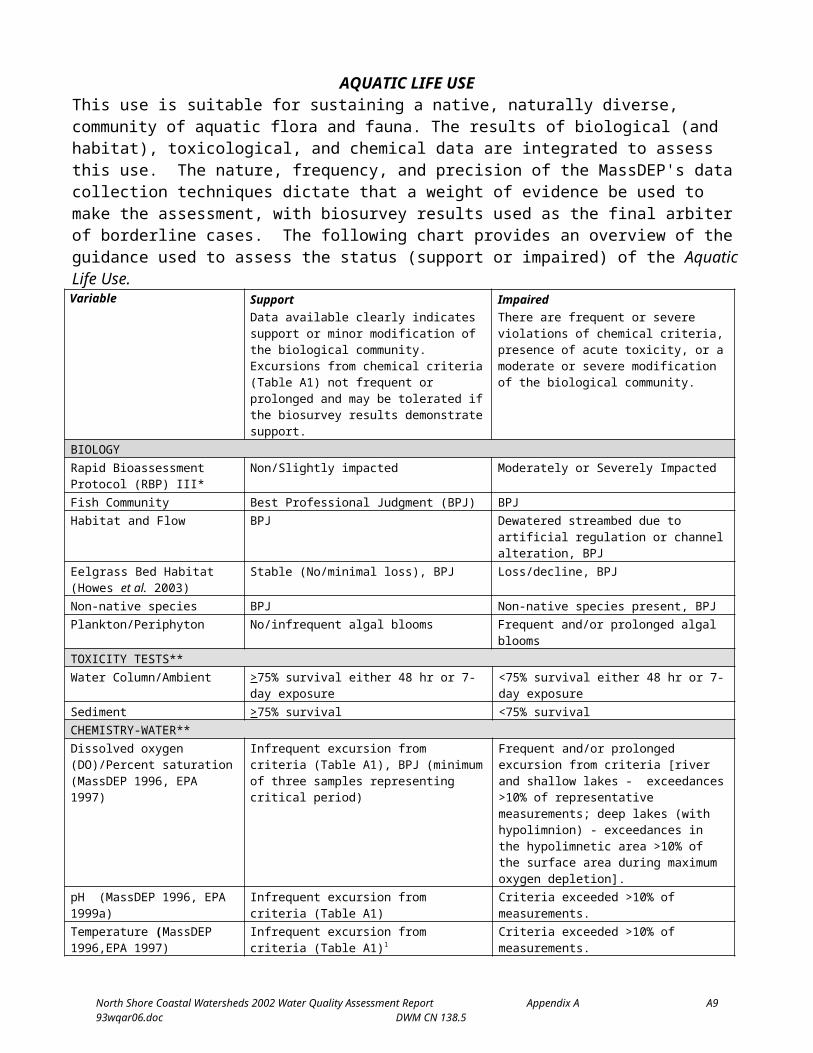
AQUATIC LIFE USEThis use is suitable for sustaining a native, naturally diverse, community of aquatic flora and fauna. The results of biological (and habitat), toxicological, and chemical data are integrated to assess this use. The nature, frequency, and precision of the MassDEP's data collection techniques dictate that a weight of evidence be used to make the assessment, with biosurvey results used as the final arbiter of borderline cases. The following chart provides an overview of the guidance used to assess the status (support or impaired) of the Aquatic Life Use.Variable Support
Data available clearly indicates support or minor modification of the biological community. Excursions from chemical criteria (Table A1) not frequent or prolonged and may be tolerated if the biosurvey results demonstrate support.
Impaired There are frequent or severe violations of chemical criteria, presence of acute toxicity, or a moderate or severe modification of the biological community.
BIOLOGYRapid Bioassessment Protocol (RBP) III*
Non/Slightly impacted Moderately or Severely Impacted
Fish Community Best Professional Judgment (BPJ) BPJHabitat and Flow BPJ Dewatered streambed due to artificial regulation
or channel alteration, BPJEelgrass Bed Habitat (Howes et al. 2003)
Stable (No/minimal loss), BPJ Loss/decline, BPJ
Non-native species BPJ Non-native species present, BPJPlankton/Periphyton No/infrequent algal blooms Frequent and/or prolonged algal bloomsTOXICITY TESTS**Water Column/Ambient >75% survival either 48 hr or 7-day exposure <75% survival either 48 hr or 7-day exposureSediment >75% survival <75% survivalCHEMISTRY-WATER**Dissolved oxygen (DO)/Percent saturation (MassDEP 1996, EPA 1997)
Infrequent excursion from criteria (Table A1), BPJ (minimum of three samples representing critical period)
Frequent and/or prolonged excursion from criteria [river and shallow lakes - exceedances >10% of representative measurements; deep lakes (with hypolimnion) - exceedances in the hypolimnetic area >10% of the surface area during maximum oxygen depletion].
pH (MassDEP 1996, EPA 1999a) Infrequent excursion from criteria (Table A1) Criteria exceeded >10% of measurements.Temperature (MassDEP 1996,EPA 1997)
Infrequent excursion from criteria (Table A1)1 Criteria exceeded >10% of measurements.
Toxic Pollutants (MassDEP 1996, EPA 1999a)
Ammonia-N (MassDEP 1996, EPA 1999b)
Chlorine (MassDEP 1996, EPA 1999a)
Infrequent excursion from criteria (Table A1)
Ammonia is pH and temperature dependent2
0.011 mg/L (freshwater) or 0.0075 mg/L (saltwater) total residual chlorine (TRC) 3
Frequent and/or prolonged excursion from criteria (exceeded >10% of measurements).
CHEMISTRY-SEDIMENT**Toxic Pollutants (Persaud et al. 1993)
Concentrations < Low Effect Level (L-EL), BPJ Concentrations Severe Effect Level (S-EL) 4, BPJ
CHEMISTRY-TISSUEPCB – whole fish (Coles 1998) <500 g/kg wet weight BPJDDT (Environment Canada 1999) <14.0 g/kg wet weight BPJPCB in aquatic tissue (Environment Canada 1999)
<0.79 ng TEQ/kg wet weight BPJ
*RBP II analysis may be considered for assessment decision on a case-by-case basis, **For identification of impairment, one or more of the following variables may be used to identify possible causes/sources of impairment: NPDES facility compliance with whole effluent toxicity test and other limits, turbidity and suspended solids data, nutrient (nitrogen and phosphorus) data for water column/sediments. 1Maximum daily mean T in a month (minimum six measurements evenly distributed over 24-hours) less than criterion. 2 Saltwater is temperature dependent only. 3 The minimum quantification level for TRC is 0.05 mg/L. 4For the purpose of this report, the S-EL for total polychlorinated biphenyl compounds (PCB) in sediment (which varies with Total Organic Carbon (TOC) content) with 1% TOC is 5.3 ppm while a sediment sample with 10% TOC is 53 ppm.
North Shore Coastal Watersheds 2002 Water Quality Assessment Report Appendix A A693wqar06.doc DWM CN 138.5
Note: National Academy of Sciences/National Academy of Engineering (NAS/NAE) guideline for maximum organochlorine concentrations (i.e., total PCB) in fish tissue for the protection of fish-eating wildlife is 500g/kg wet weight (ppb, not lipid-normalized). PCB data (tissue) in this report are presented in g/kg wet weight (ppb) and are not lipid-normalized to allow for direct comparison to the NAS/NAE guideline.

FISH CONSUMPTION USEPollutants shall not result in unacceptable concentrations in edible portions of marketable fish or for the recreational use of fish, other aquatic life or wildlife for human consumption. The assessment of this use is made using the most recent list of Fish Consumption Advisories issued by the Massachusetts Executive Office of Health and Human Services, Department of Public Health (MA DPH), Bureau of Environmental Health Assessment (MA DPH 2005 and Krueger 2006). The MA DPH list identifies waterbodies where elevated levels of a specified contaminant in edible portions of freshwater species pose a health risk for human consumption. Hence, the Fish Consumption Use is assessed as non-support in these waters.
In July 2001, MA DPH issued new consumer advisories on fish consumption and mercury contamination (MA DPH 2001).
1. The MA DPH “…is advising pregnant women, women of childbearing age who may become pregnant, nursing mothers and children under 12 years of age to refrain from eating the following marine fish; shark, swordfish, king mackerel, tuna steak and tilefish. In addition, MA DPH is expanding its previously issued statewide fish consumption advisory which cautioned pregnant women to avoid eating fish from all freshwater bodies due to concerns about mercury contamination, to now include women of childbearing age who may become pregnant, nursing mothers and children under 12 years of age (MA DPH 2001).”
2. Additionally, MA DPH “…is recommending that pregnant women, women of childbearing age who may become pregnant, nursing mothers and children under 12 years of age limit their consumption of fish not covered by existing advisories to no more than 12 ounces (or about 2 meals) of cooked or uncooked fish per week. This recommendation includes canned tuna, the consumption of which should be limited to 2 cans per week. Very small children, including toddlers, should eat less. Consumers may wish to choose to eat light tuna rather than white or chunk white tuna, the latter of which may have higher levels of mercury (MA DPH 2001).”
Other statewide advisories that MA DPH has previously issued and are still in effect are as follows (MA DPH 2001):
1. Due to concerns about chemical contamination, primarily from polychlorinated biphenyl compounds (PCB) and other contaminants, no individual should consume lobster tomalley from any source. Lobster tomalley is the soft green substance found in the tail and body section of the lobster.
2. Pregnant and breastfeeding women and those who are considering becoming pregnant should not eat bluefish due to concerns about PCB contamination in this species.
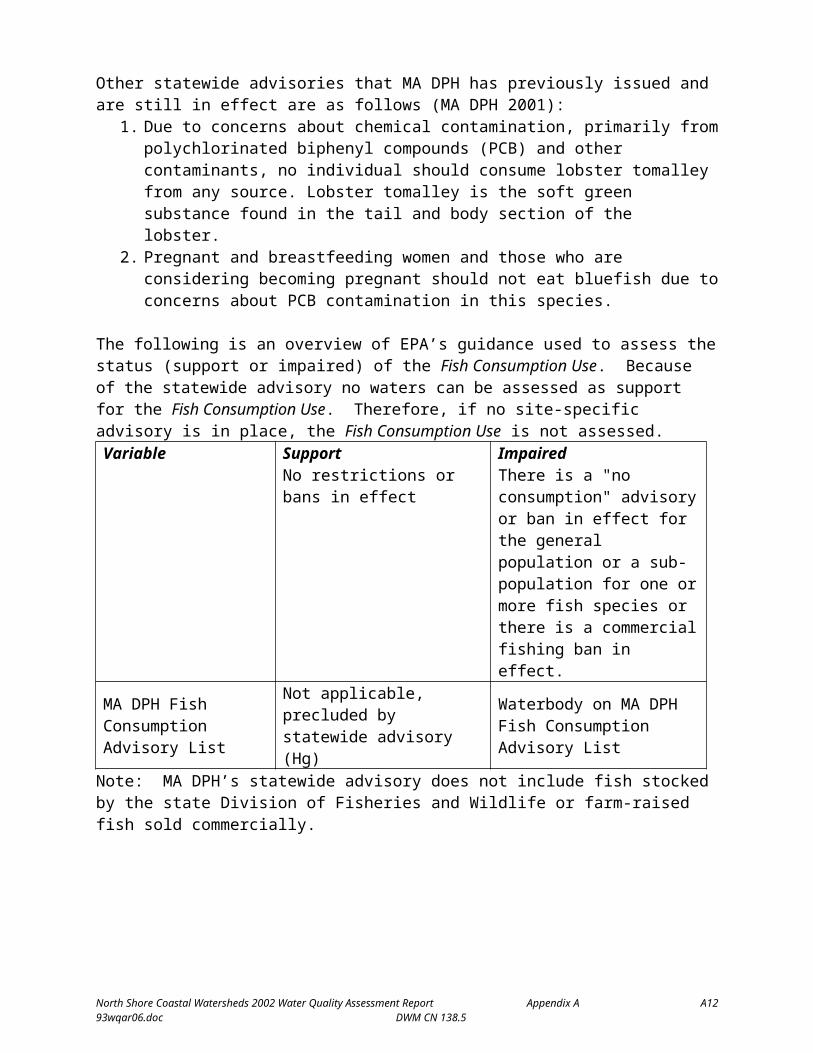
The following is an overview of EPA’s guidance used to assess the status (support or impaired) of the Fish Consumption Use. Because of the statewide advisory no waters can be assessed as support for the Fish Consumption Use. Therefore, if no site-specific advisory is in place, the Fish Consumption Use is not assessed. Variable Support
No restrictions or bans in effect
ImpairedThere is a "no consumption" advisory or ban in effect for the general population or a sub-population for one or more fish species or there is a commercial
North Shore Coastal Watersheds 2002 Water Quality Assessment Report Appendix A A793wqar06.doc DWM CN 138.5

fishing ban in effect.MA DPH Fish Consumption Advisory List
Not applicable, precluded by statewide advisory (Hg)
Waterbody on MA DPH Fish Consumption Advisory List
Note: MA DPH’s statewide advisory does not include fish stocked by the state Division of Fisheries and Wildlife or farm-raised fish sold commercially.
North Shore Coastal Watersheds 2002 Water Quality Assessment Report Appendix A A893wqar06.doc DWM CN 138.5
DRINKING WATER USEThe term Drinking Water Use denotes those waters used as a source of public drinking water. These waters may be subject to more stringent regulation in accordance with the Massachusetts Drinking Water Regulations (310 CMR 22.00). They are designated for protection as Outstanding Resource Waters in 314 CMR 4.04(3). MassDEP’s Drinking Water Program (DWP) has primacy for implementing the provisions of the federal Safe Drinking Water Act (SDWA). Except for suppliers with surface water sources for which a waiver from filtration has been granted (these systems also monitor surface water quality) all public drinking water supplies are monitored as finished water (tap water). Monitoring includes the major categories of contaminants established in the SDWA: bacteria, volatile and synthetic organic compounds, inorganic compounds and radionuclides. The DWP maintains current drinking supply monitoring data. The suppliers currently report to MassDEP and EPA the status of the supplies on an annual basis in the form of a consumer confidence report (http://yosemite.epa.gov/ogwdw/ccr.nsf/Massachusetts). Below is EPA’s guidance to assess the status (support or impaired) of the drinking water use.
Variable SupportNo closures or advisories (no contaminants with confirmed exceedances of maximum contaminant levels, conventional treatment is adequate to maintain the supply).
ImpairedHas one or more advisories or more than conventional treatment is required or has a contamination-based closure of the water supply.
Drinking Water Program (DWP) Evaluation See note below See note below
Note: While this use is not assessed in this report, information on drinking water source protection and finish water quality is available at http://www.mass.gov/dep/water/drinking.htm and from local public water suppliers.
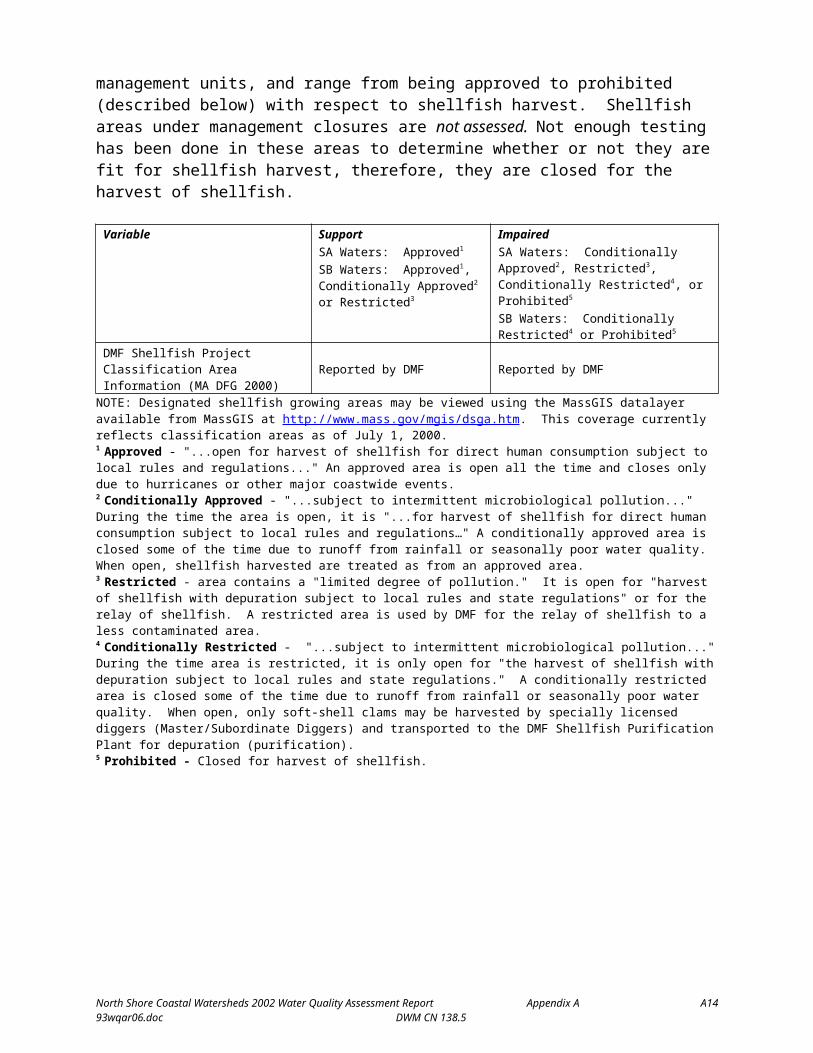
SHELLFISHING USEThis use is assessed using information from the Department of Fish and Game's Division of Marine Fisheries (DMF). A designated shellfish growing area is an area of potential shellfish habitat. Growing areas are managed with respect to shellfish harvest for direct human consumption, and comprise at least one or more classification areas. The classification areas are the management units, and range from being approved to prohibited (described below) with respect to shellfish harvest. Shellfish areas under management closures are not assessed. Not enough testing has been done in these areas to determine whether or not they are fit for shellfish harvest, therefore, they are closed for the harvest of shellfish.
Variable Support SA Waters: Approved1 SB Waters: Approved1, Conditionally Approved2 or Restricted3
Impaired SA Waters: Conditionally Approved2, Restricted3, Conditionally Restricted4, or Prohibited5
SB Waters: Conditionally Restricted4 or Prohibited5
DMF Shellfish Project Classification Area Information (MA DFG 2000) Reported by DMF Reported by DMF
NOTE: Designated shellfish growing areas may be viewed using the MassGIS datalayer available from MassGIS at http://www.mass.gov/mgis/dsga.htm. This coverage currently reflects classification areas as of July 1, 2000. 1 Approved - "...open for harvest of shellfish for direct human consumption subject to local rules and regulations..." An approved area is open all the time and closes only due to hurricanes or other major coastwide events.2 Conditionally Approved - "...subject to intermittent microbiological pollution..." During the time the area is open, it is "...for harvest of shellfish for direct human consumption subject to local rules and regulations…" A conditionally approved area is closed some of the time due to runoff from rainfall or seasonally poor water quality. When open, shellfish harvested are treated as from an approved area.3 Restricted - area contains a "limited degree of pollution." It is open for "harvest of shellfish with depuration subject to local rules and state regulations" or for the relay of shellfish. A restricted area is used by DMF for the relay of shellfish to a less contaminated area.
North Shore Coastal Watersheds 2002 Water Quality Assessment Report Appendix A A993wqar06.doc DWM CN 138.5

4 Conditionally Restricted - "...subject to intermittent microbiological pollution..." During the time area is restricted, it is only open for "the harvest of shellfish with depuration subject to local rules and state regulations." A conditionally restricted area is closed some of the time due to runoff from rainfall or seasonally poor water quality. When open, only soft-shell clams may be harvested by specially licensed diggers (Master/Subordinate Diggers) and transported to the DMF Shellfish Purification Plant for depuration (purification).5 Prohibited - Closed for harvest of shellfish.
North Shore Coastal Watersheds 2002 Water Quality Assessment Report Appendix A A1093wqar06.doc DWM CN 138.5

PRIMARY CONTACT RECREATION USEThis use is suitable for any recreational or other water use in which there is prolonged and intimate contact with the water with a significant risk of ingestion of water during the primary contact recreation season (1 April to 15 October). These include, but are not limited to, wading, swimming, diving, surfing and water skiing. The chart below provides an overview of the guidance used to assess the status (support or impaired) of the Primary Contact Recreation Use. Excursions from criteria due to natural conditions are not considered impairment of use.
Variable Support Criteria are met, no aesthetic conditions that preclude the use
Impaired Frequent or prolonged violations of criteria and/or formal bathing area closures, or severe aesthetic conditions that preclude the use
Bacteria (105 CMR 445.000) Minimum Standards for Bathing Beaches State Sanitary Code) (MassDEP 1996)
At “public bathing beach” areas: Formal beach postings/advisories neither frequent nor prolonged during the swimming season (the number of days posted or closed cannot exceed 10% during the locally operated swimming season).
Other waters: Samples* collected during the primary contact season must meet criteria (Table A1).
Shellfish Growing Area classified as “Approved” by DMF.
At “public bathing beach” areas: Formal beach closures/postings >10% of time during swimming season (the number of days posted or closed exceeds 10% during the locally operated swimming season).
Other waters: Samples* collected during the primary contact season do not meet the criteria (Table A1).
Aesthetics (MassDEP 1996) - All surface waters shall be free from pollutants in concentrations or combinations that settle to form objectionable deposits; float as debris, scum or other matter to form nuisances; produce objectionable odor, color, taste or turbidity; or produce undesirable or nuisance [growth or amount] species of aquatic life
Odor, oil and grease,color and turbidity, floating matter
Transparency (MA DPH 1969)
Nuisance organisms
Narrative “free from” criteria met or excursions neither frequent nor prolonged, BPJ.
Public bathing beach and lakes – Secchi disk depth >1.2 meters (> 4’) (minimum of three samples representing critical period).
No overabundant growths (i.e., blooms) that render the water aesthetically objectionable or unusable, BPJ.
Narrative “free from” criteria not met - objectionable conditions either frequent and/or prolonged, BPJ.
Public bathing beach and lakes - Secchi disk depth <1.2 meters (< 4’) (minimum of three samples representing critical period).
Overabundant growths (i.e., blooms and/or non-native macrophyte growth dominating the biovolume) rendering the water aesthetically objectionable and/or unusable, BPJ.
* Data sets to be evaluated for assessment purposes must be representative of a sampling location (at least five samples per station recommended) over the course of the primary contact season. Samples collected on one date from multiple stations on a river are not considered adequate to assess this designated use. Because of low sample frequency (i.e., less than ten samples per station) an impairment decision will not be based on a single sample exceedance (i.e., the geometric mean of five samples is <200 cfu/100 ml but one of the five sample exceeds 400 cfu/100 ml). The method detection limit (MDL) will be used in the calculation of the geometric mean when data are reported as less than the MDL (e.g. use 20 cfu/100 ml if the result is reported as <20 cfu/100 ml). Those data reported as too numerous to count (TNTC) will not be used in the geometric mean calculation; however frequency of TNTC sample results should be presented.
North Shore Coastal Watersheds 2002 Water Quality Assessment Report Appendix A A1193wqar06.doc DWM CN 138.5
SECONDARY CONTACT RECREATION USEThis use is suitable for any recreation or other water use in which contact with the water is either incidental or accidental. These include, but are not limited to, fishing, boating and limited contact incident to shoreline activities. Following is an overview of the guidance used to assess the status (support or impaired) of the Secondary Contact Use. Excursions from criteria due to natural conditions are not considered impairment of use.
Variable Support Criteria are met, no aesthetic conditions that preclude the use
Impaired Frequent or prolonged violations of criteria, or severe aesthetic conditions that preclude the use
Fecal Coliform Bacteria (MassDEP 1996)
Other waters: Samples* collected must meet the Class C or SC criteria (see Table A1).
Other waters: Samples* collected do not meet the Class C or SC criteria (see Table A1).
Aesthetics (MassDEP 1996) - All surface waters shall be free from pollutants in concentrations or combinations that settle to form objectionable deposits; float as debris, scum or other matter to form nuisances; produce objectionable odor, color, taste or turbidity; or produce undesirable or nuisance [growth or amount] species of aquatic life
Odor, oil and grease,color and turbidity, floating matter
Transparency (MA DPH 1969)
Nuisance organisms
Narrative “free from” criteria met or excursions neither frequent nor prolonged, BPJ.
Public bathing beach and lakes – Secchi disk depth >1.2 meters (> 4’) (minimum of three samples representing critical period).
No overabundant growths (i.e., blooms) that render the water aesthetically objectionable or unusable, BPJ.
Narrative “free from” criteria not met - objectionable conditions either frequent and/or prolonged, BPJ.
Public bathing beach and lakes - Secchi disk depth <1.2 meters (< 4’) (minimum of three samples representing critical period).
Overabundant growths (i.e., blooms and/or non-native macrophyte growth dominating the biovolume) rendering the water aesthetically objectionable and/or unusable, BPJ.
*Data sets to be evaluated for assessment purposes must be representative of a sampling location (at least five samples per station recommended) over time. Because of low sample frequency (i.e., less than ten samples per station) an impairment decision will not be based on a single sample exceedance. Samples collected on one date from multiple stations on a river are not considered adequate to assess this designated use.
AESTHETICS USEAll surface waters shall be free from pollutants in concentrations or combinations that settle to form objectionable deposits; float as debris, scum or other matter to form nuisances; produce objectionable odor, color, taste or turbidity; or produce undesirable or nuisance species of aquatic life. The aesthetic use is closely tied to the public health aspects of the recreational uses (swimming and boating). Below is an overview of the guidance used to assess the status (support or impaired) of the Aesthetics Use.
Variable Support Narrative “free from” criteria met
Impaired Objectionable conditions frequent and/or prolonged
Odor, oil and grease,color and turbidity, floating matter
Transparency (MA DPH 1969)
Nuisance organisms
Narrative “free from” criteria met or excursions neither frequent nor prolonged, BPJ.
Public bathing beach and lakes – Secchi disk depth >1.2 meters (> 4’) (minimum of three samples representing critical period).
No overabundant growths (i.e., blooms) that render the water aesthetically objectionable or unusable, BPJ.
Narrative “free from” criteria not met - objectionable conditions either frequent and/or prolonged, BPJ.
Public bathing beach and lakes - Secchi disk depth <1.2 meters (< 4’) (minimum of three samples representing critical period).
Overabundant growths (i.e., blooms and/or non-native macrophyte growth dominating the biovolume) rendering the water aesthetically objectionable and/or unusable, BPJ.
REFERENCES
Coles, J.F. 1998. Organochlorine compounds in fish tissue for the Connecticut, Housatonic, and Thames River Basins study unit, 1992-94. USGS Water-Resources Investigations Report 98-4075. U.S. Geological Survey, National Water Quality Assessment Program, Water Resources Division, Marlborough, MA.
North Shore Coastal Watersheds 2002 Water Quality Assessment Report Appendix A A1293wqar06.doc DWM CN 138.5

Costello, C. 2003. Mapping Eelgrass in Massachusetts, 1993-2003. Massachusetts Department of Environmental Protection, Bureau of Resource Protection, Boston, MA.
Environment Canada. 1999. Canadian Environmental Quality Guidelines [Online]. Environment Canada. Retrieved 04 November 1999 from http://www.ec.gc.ca/CEQG-RCQE/English/default.cfm updated 28 September 1998.
EPA. 1997. Guidelines for Preparation of the Comprehensive State Water Quality Assessments (305(b) Reports) and Electronic Updates Report Contents. U.S. Environmental Protection Agency, Assessment and Watershed Protection Division (4503F); Office of Wetlands, Oceans, and Watersheds; Office of Water, Washington D.C.
EPA. 1999a. Federal Register Document [Online]. U.S. Environmental Protection Agency, Washington, D.C. Retrieved 19 November 1999 from http://www.epa.gov/fedrgstr/EPA-WATER/1998/December/Day-10/w30272.htm.
EPA. 1999b. 1999 Update of Ambient Water Quality Criteria for Ammonia. U.S. Environmental Protection Agency, Office of Water and Office of Science and Technology, Washington, D.C. and Office of Research and Development, Duluth, MN.
EPA. 2002. Consolidated Assessment and Listing Methodology – toward a compendium of best practices. U.S. Environmental Protection Agency; Office of Wetlands, Oceans and Watersheds; Washington, D.C.
FDA. 2003. Guide for the Control of Molluscan Shellfish 2003 Revision. [Online]. Updated 12 November 2004. United States Food and Drug Administration, Department of Health and Human Services, National Shellfish Sanitation Program. http://www.cfsan.fda.gov/~ear/nss2-toc.html. Accessed 2005 December 5.
Grubbs, G.H. and R.H. Wayland III. 2000. Letter to Colleague dated 24 October 2000. EPA recommendations on the use of fish and shellfish consumption advisories and certain shellfish growing area classifications in determining attainment of water quality standards and listing impaired waterbodies under section 303(d) of the Clean Water Act. United States Environmental Protection Agency; Office of Wetlands, Oceans and Watersheds; Washington, D.C.
Howes, B.L., R. Samimy, and B. Dudley. 2003. Massachusetts Estuaries Project Site-Specific Nitrogen Thresholds for Southeastern Massachusetts Embayments: Critical Indicators Interim Report Revised December 22, 2003. University of Massachusetts Dartmouth, School of Marine Science and Technology (SMAST), Coastal Systems Laboratory. New Bedford, MA and Massachusetts Department of Environmental Protection, Lakeville, MA.
Krueger, E.T. 2006. Letter to the members of the Interagency Committee on Fish Toxics dated 29 June 2006. Re: Public Health Fish Consumption Advisories Being Issued. Massachusetts Department of Public Health, Environmental Toxicology Program, Boston, MA.
MassDEP. 1996. (Revision of 1995 report). Massachusetts Surface Water Quality Standards (Revision of 314 CMR 4.00, effective June 23, 1996). Massachusetts Department of Environmental Protection, Division of Water Pollution Control, Technical Services Branch, Westborough, MA.
MA DFG. 2000. Designated Shellfish Growing Areas Datalayer – July 2000. Published by MassGIS in October 2000. Massachusetts Department of Fish and Game, Division of Marine Fisheries, Boston, MA.
MA DPH. 1969. Article 7 Regulation 10.2B of the State Sanitary Code. Massachusetts Department of Public Health. Boston, MA.
MA DPH. 2001. MA DPH Issues New Consumer Advisories on Fish Consumption and Mercury Contamination. Massachusetts Department of Public Health, Bureau of Environmental Health Assessment, Boston, MA.
MA DPH. 2002. 105 CMR 445.000: Minimum Standards For Bathing Beaches, State Sanitary Code, Chapter VII [Online]. Massachusetts Department of Public Health, Division of Community Sanitation Regulations and Statutes, Boston, MA. Retrieved 19 September 2002 from http://www.state.ma.us/dph/dcs/csanregs.htm.
MA DPH. 2005. Freshwater Fish Consumption Advisory List – May 2005. Massachusetts Department of Public Health, Bureau of Environmental Health Assessment, Boston, MA.
Persaud, D., R. Jaagumagi, and A. Hayton. 1993. Guidelines for the protection and management of aquatic sediment quality in Ontario. Water Resources Branch, Ontario Ministry of the Environment, Ontario, Canada.
Wayland III, R.H. 2001. Memorandum to EPA Regional Water Management Directors, EPA Regional Science and Technology Directors, and State, Territory and Authorized Tribe Water Quality Program Directors dated 19 November 2001. Re: 2002
North Shore Coastal Watersheds 2002 Water Quality Assessment Report Appendix A A1393wqar06.doc DWM CN 138.5
Integrated Water Quality Monitoring and Assessment Report Guidance. U.S. Environmental Protection Agency; Office of Wetlands, Oceans and Watersheds; Washington, D.C.
North Shore Coastal Watersheds 2002 Water Quality Assessment Report Appendix A A1493wqar06.doc DWM CN 138.5

NORTH COASTAL DRAINAGE AREA
Division of Watershed Management Year 2002 Water Quality Monitoring Data
Technical Memorandum TM-93-2
DWM Control Number CN 80.1
Commonwealth of MassachusettsExecutive Office of Environmental Affairs
Stephen R. Pritchard, SecretaryMassachusetts Department of Environmental Protection
Robert W. Golledge Jr., CommissionerBureau of Resource Protection
Glenn Haas, Acting Assistant CommissionerDivision of Watershed Management
Glenn Haas, Director
December 2005
North Shore Coastal Water Quality Assessment Report Appendix B B193wqar06.doc DWM CN 138.5

Revised March 2007
North Shore Coastal Water Quality Assessment Report Appendix B B293wqar06.doc DWM CN 138.5

Table of Contents
Introduction 3Study Area Description 3Project Objectives 3Field and Analytical Methods 9Quality Assurance and Quality Control
9Tidal Information 10Survey Conditions 10Water Quality Data 21Quality Control Data 33References 35Appendices 36
List of Tables
Table 1: 2002 North Coastal Water Quality Sampling Matrix – Station Locations and Analytical Coverage 6
Table 2: WES/DWM Analytical Methods and Detection Limits for 2002 Water Quality
Analytes 9Table 3: Tidal and Sampling Times for Tidally-influenced Monitoring Sites
10Table 4: 2002 Precipitation Data (in inches) for Six Sites in the North Coastal Drainage Area
12Table 5: 2002 USGS Stream Discharge Data for the Saugus River
14Table 6: 2002 USGS Stream Discharge Data for the Parker River
15Table 7: 2002 MassDEP North Coastal Drainage Area in-situ multiprobe Data
21Table 8: 2002 MassDEP North Coastal Drainage Area Physicochemical and Bacteria Data
28Table 9: 2002 MassDEP North Coastal Drainage Area Quality Control Data-Blank 33Table 10: 2002 MassDEP North Coastal Drainage Area Quality Control Data-Duplicates 33
List of Figures
Figure 1: North Coastal Drainage Area 5Figure 2: 2002 Water Quality Sampling Stations in the North Coastal Drainage Area
8 Figure 3: Mean Precipitation and Saugus River Discharge Data – May, 2002
16
North Shore Coastal Water Quality Assessment Report Appendix B B393wqar06.doc DWM CN 138.5

Figure 4: Mean Precipitation and Parker River Discharge Data – May, 2002 16
Figure 5: Mean Precipitation and Saugus River Discharge Data – June, 2002 17Figure 6: Mean Precipitation and Parker River Discharge Data – June, 2002
17Figure 7: Mean Precipitation and Saugus River Discharge Data – July, 2002
18Figure 8: Mean Precipitation and Parker River Discharge Data – July, 2002
18Figure 9: Mean Precipitation and Saugus River Discharge Data – August, 2002
19Figure 10: Mean Precipitation and Parker River Discharge Data – August, 2002 19Figure 11: Mean Precipitation and Saugus River Discharge Data – September, 2002
20Figure 12: Mean Precipitation and Parker River Discharge Data – September, 2002
20
List of Appendices
Appendix 1: Quality Assurance/Quality Control Data Validation for the North Coastal Drainage Area 2002 Water Quality Survey
36
Appendix 2: Data Symbols and Qualifiers for the North Coastal Drainage Area 2002 Water Quality Survey
39
North Shore Coastal Water Quality Assessment Report Appendix B B493wqar06.doc DWM CN 138.5
INTRODUCTION
This memorandum presents water quality and ancillary data that resulted from a water quality survey performed in the North Coastal Drainage Area (Figure 1) in 2002 by the Massachusetts Division of Watershed Management (DWM). Results of additional sampling to support the DWM’s TMDL and fish toxics monitoring programs are reported elsewhere (MassDEP 2004, 2005c). Consistent with the DWM’s general approach to watershed monitoring to meet defined programmatic objectives, water quality sampling was performed once a month in May, June, July, August and September at 11 freshwater and 9 tidally-influenced stations located on a total of 18 different named streams. In situ dissolved oxygen (including pre-dawn), temperature, conductivity, salinity and pH measurements were taken at all survey locations. Grab samples were taken for chemical and bacteriological analyses according to the regimen summarized in Table 1. All surveys were conducted in accordance with the Quality Assurance Project Plan for 2002 Monitoring in the Charles, Housatonic, Hudson, North Coastal and Ten Mile Watersheds (“2002 QAPP”)(MassDEP 2002). Figure 2, depicts the locations of the 2002 sampling sites.
STUDY AREA DESCRIPTION
The North Coastal Drainage Area (Figure 1) is located in northeastern Massachusetts where it is bordered by the Ipswich Watershed to the west and by the Boston Harbor (Mystic) Watershed to the south. In its northernmost reaches it contains parts of the extensive Hampton and Seabrook saltmarshes, bordering the Merrimack River. Progressing southward, Cape Ann provides some of the most distinctive rocky features of the Massachusetts coastline. Further south the coastline consists of peninsulas interspersed with embayments, pockets of salt marsh, and estuaries with offshore rocky islands. The Rumney Marshes, which includes all or portions of the Pines and Saugus Rivers and Diamond Creek, are located at the southern extreme of the watershed. The Saugus River estuary is a large and historically degraded saltwater ecosystem with vast areas of wildlife habitat.
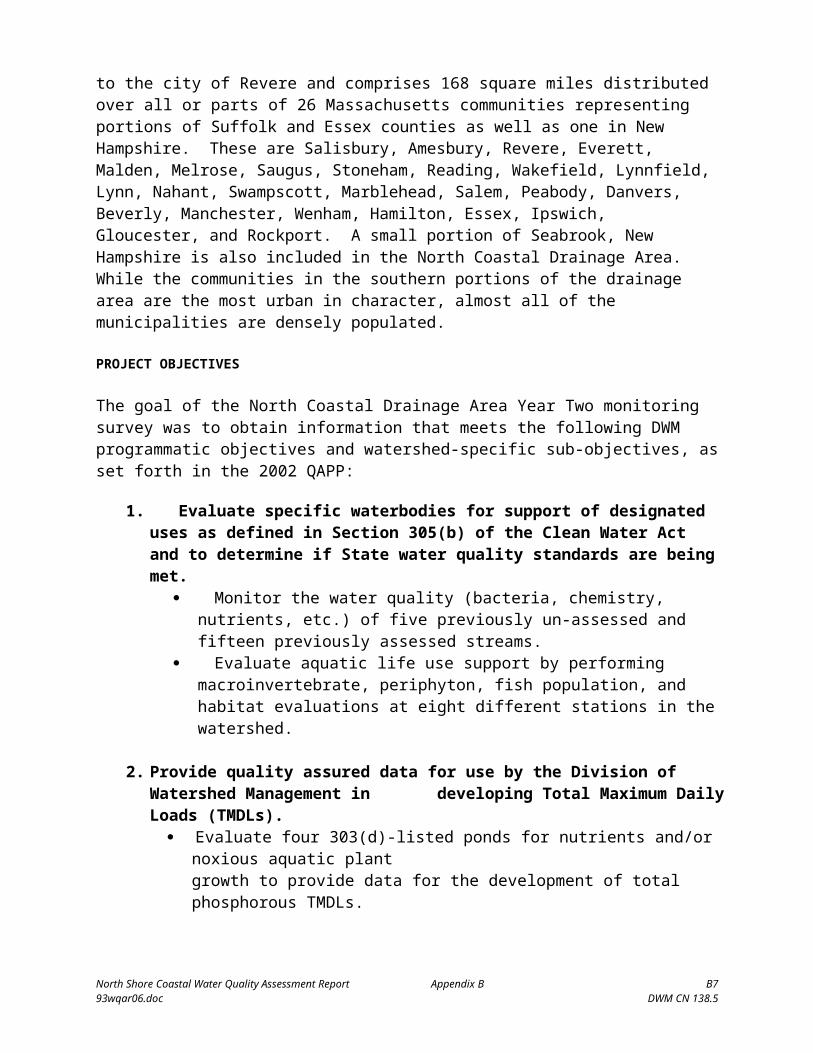
The North Coastal Drainage Area occupies much of the coastal region of Massachusetts' north shore. It extends from Salisbury to the city of Revere and comprises 168 square miles distributed over all or parts of 26 Massachusetts communities representing portions of Suffolk and Essex counties as well as one in New Hampshire. These are Salisbury, Amesbury, Revere, Everett, Malden, Melrose, Saugus, Stoneham, Reading, Wakefield, Lynnfield, Lynn, Nahant, Swampscott, Marblehead, Salem, Peabody, Danvers, Beverly, Manchester, Wenham, Hamilton, Essex, Ipswich, Gloucester, and Rockport. A small portion of Seabrook, New Hampshire is also included in the North Coastal Drainage Area. While the communities in the southern portions of the drainage area are the most urban in character, almost all of the municipalities are densely populated.
PROJECT OBJECTIVES
The goal of the North Coastal Drainage Area Year Two monitoring survey was to obtain information that meets the following DWM programmatic objectives and watershed-specific sub-objectives, as set forth in the 2002 QAPP:
North Shore Coastal Water Quality Assessment Report Appendix B B593wqar06.doc DWM CN 138.5

1. Evaluate specific waterbodies for support of designated uses as defined in Section 305(b) of the Clean Water Act and to determine if State water quality standards are being met.
Monitor the water quality (bacteria, chemistry, nutrients, etc.) of five previously un-assessed and fifteen previously assessed streams.
Evaluate aquatic life use support by performing macroinvertebrate, periphyton, fish population, and habitat evaluations at eight different stations in the watershed.
2. Provide quality assured data for use by the Division of Watershed Management in developing Total Maximum Daily Loads (TMDLs).
Evaluate four 303(d)-listed ponds for nutrients and/or noxious aquatic plant growth to provide data for the development of total phosphorous TMDLs.
Monitor the water quality of seven 303(d) listed streams to help determine if TMDLs need to be developed.
3. Screen fish to provide data to the Massachusetts Department of Public Health for
public health risk assessment due to fish tissue contaminants (heavy metals, polychlorinated biphenyls (PCB’s), and pesticides).
Evaluate the concentration of heavy metals, PCB’s, and pesticides in fish tissue from two established fisheries in the basin.
4. Provide quality assured E.Coli data, in light of the potential for new State freshwater criteria.
Provide E.Coli, Enterococci and fecal coliform data from 13 freshwater stream segments in the basin.
While most of the goals for monitoring in the North Coastal Drainage Area were met during the course of the DWM 2002 surveys, the biological monitoring was not completed as originally called for in the QAPP (see second bullet under Goal 1 above). First, only four sites were visited, not eight as planned, and only habitat assessments and macroinvertebrate sampling were accomplished. Furthermore, the macroinvertebrate samples were not processed due to laboratory constraints. Habitat scoring sheets for the four sites are on file at the DWM Office in Worcester.
North Shore Coastal Water Quality Assessment Report Appendix B B693wqar06.doc DWM CN 138.5
North Shore Coastal Water Quality Assessment Report Appendix B B793wqar06.doc DWM CN 138.5
Gloucester
Lynn
Lynnfield
Rockport
Essex
Manchester
Hamilton
Wenham
BeverlyDanvers
Salem Marblehead
SwampscottSaugus
Peabody
Wakefield
Melrose
RevereMalden
Reading
4 0 4 8 Miles
N
EW
S
Salisbury
Nahant
Figure 1: NORTH COASTAL DRAINAGE AREA

Table 1. 2002 North Coastal Water Quality Sampling Matrix – Station Locations and Analytical Coverage. May – June – July
Station Number Waterbody Location May 6 May 7 May 8 May 9 June 10 June 11 June 12 July 15 July 16 July 17 July 18
SB01 Shute Brook Upstream from Central Street, Saugus
H, B, N, SS H H, B, N,
SS H H, B, N, SS H
BP01 Bennetts Pond Brook At mall entrance south off Lynn Fells Parkway, Saugus
H, B, N, SS H H, B, N,
SS H H, B, N, SS H
AL01 Alewife Brook Upstream from stormdrain at Apple Street, Essex
H, B, N, SS H H, B, N,
SS H H, B, N, SS H
TL01* Unnamed Tributary “Town Line Brook”
At northern end of Beth Israel cemetery, Fuller Street, Malden
H, B, N, SS H H, B, N,
SSH, B, N,
SS H
CR01 Crane River Ash Street, Danvers H, B, N, SS H H, B, N,
SS H H, B, N, SS H
FF00* Frost Fish Brook Downstream at Route 62, Danvers H, B, N, SS H H, B, N,
SSH, B, N,
SS H
GB01 Goldthwait Brook Foster Street, Peabody H, B, N, SS H H, B, N,
SS H H, B, N, SS H
SR04A Saugus River Vernon Street/Main Street, Wakefield/Lynnfield
H, B, N, SS H H, B, N,
SS H H, B, N, SS H
SR01B Saugus River Elm Street, Saugus H, B, N, SS H H, B, N,
SS H H, B, N, SS H
WA00* Waters River Water Street (Rte. 35), Danvers H, B, N, SS H H, B, N,
SSH, B, N,
SS H
FR01A* Forest River Loring Avenue, Salem H, B, N, SS H H, B, N,
SSH, B, N,
SS H
DR01* Danvers River Kernwood Street, Beverly/Salem H, B, N, SS H H, B, N,
SSH, B, N,
SS H
PB03* Proctor Brook Grove Street, Salem H, B, N, SS H H, B, N,
SSH, B, N,
SS H
CB01 Causeway Brook Lincoln Street, Manchester H, B H H, B H H, B H
SM03 Cat Brook Lincoln Street, Manchester H, B H H, B H H, B H
CR02 Crane Brook Pine Street, Danvers H, B H H, B H H, B H
CR03 Beaver Brook Holten Street, Danvers H, B H H, B H H, B H
ER01* Essex River Route 133 (Main Street), Essex H, B H H, B H, B H
MR01* Mill River Downstream at Route 127 (Washington Street), Gloucester H, B H H, B H, B H
SR00* Saugus River 800 ft. upstream of Route 107, Saugus H, B H H, B H, B H
Note: B = bacteria (fecal coliform, E. coli, Enterococcus); SS = total suspended solids; N = nutrients (ammonia, total phosphorus); H = DO, pH, temperature, specific conductance * denotes a tidally influenced sampling site
North Shore Coastal Water Quality Assessment Report Appendix B B893wqar06.doc DWM CN 138.5
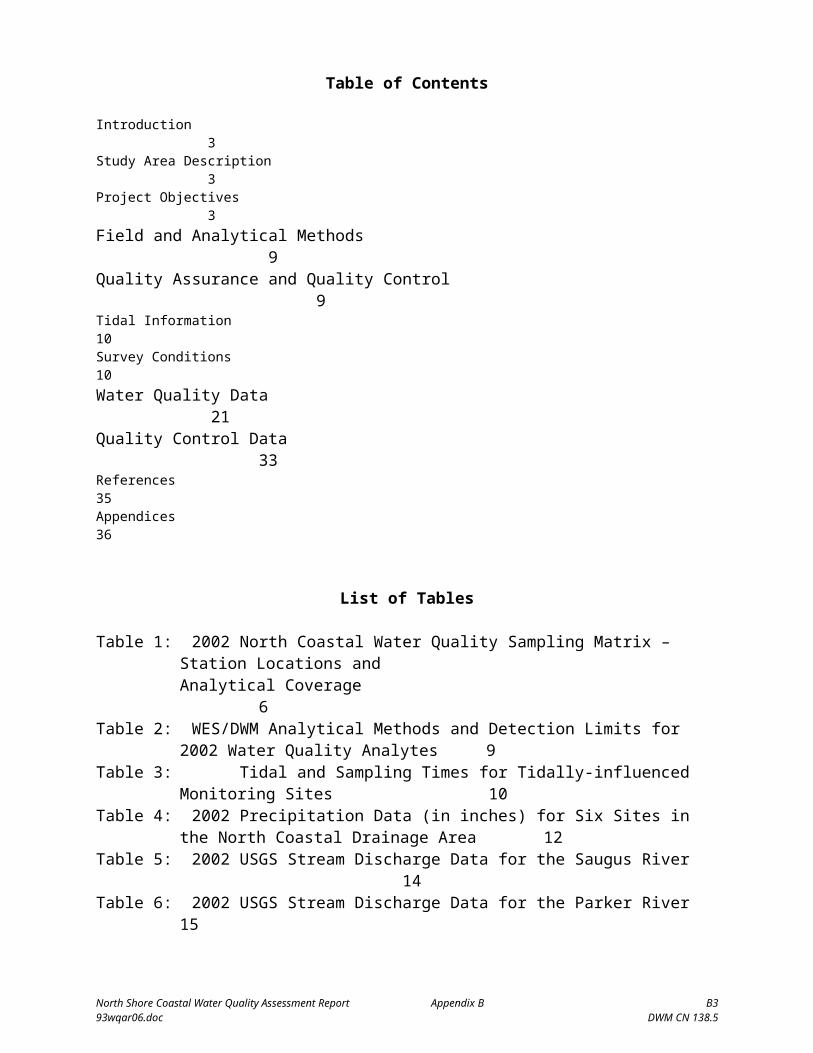
Table 1 (Cont.) 2002 North Coastal Water Quality Sampling Matrix – Station Locations and Analytical Coverage. August – September
Station Number Waterbody Location Aug 12 Aug 13 Aug 14 Aug 15 Sept 6 Sept 16 Sept 17 Sept 18 Sept 19
SB01 Shute Brook Upstream from Central Street, Saugus
H, B, N, SS H H, B, N,
SS H
BP01 Bennetts Pond Brook At mall entrance south off Lynn Fells Parkway, Saugus
H, B, N, SS H H, B, N,
SS H
AL01 Alewife Brook Upstream from stormdrain at Apple Street, Essex
H, B, N, SS H H, B, N,
SS H
TL01* Unnamed Tributary “Town Line Brook”
At northern end of Beth Israel cemetery, Fuller Street, Malden B, N, SS H H, B, N,
SS
CR01 Crane River Ash Street, Danvers H, B, N, SS H H, B, N,
SS H
FF00* Frost Fish Brook Downstream at Route 62, Danvers H, B, N, SS H H, B, N,
SS H
GB01 Goldthwait Brook Foster Street, Peabody H, B, N, SS H H, B, N,
SS H
SR04A Saugus River Vernon Street/Main Street, Wakefield/Lynnfield
H, B, N, SS H H, B, N,
SS H
SR01B Saugus River Elm Street, Saugus H, B, N, SS H H, B, N,
SS H
WA00* Waters River Water Street (Rte. 35), Danvers H, B, N, SS H H H, B, N,
SS H
FR01A* Forest River Loring Avenue, Salem H, B, N, SS H H H, B, N,
SS H
DR01* Danvers River Kernwood Street, Beverly/Salem H, B, N, SS H H, B, N,
SS H
PB03* Proctor Brook Grove Street, Salem H, B, N, SS H H H, B, N,
SS H
CB01 Causeway Brook Lincoln Street, Manchester H, B H H, B H
SM03 Cat Brook Lincoln Street, Manchester H, B H H, B H
CR02 Crane Brook Pine Street, Danvers H, B H H, B H
CR03 Beaver Brook Holten Street, Danvers H, B H H, B H
ER01* Essex River Route 133 (Main Street), Essex H, B H H H, B H
MR01* Mill River Downstream at Route 127 (Washington Street), Gloucester H, B H H H, B H
SR00* Saugus River 800 ft. upstream of Route 107, Saugus H, B H H H, B H
Note: B = bacteria (fecal coliform, E. coli, Enterococcus); SS = total suspended solids; N = nutrients (ammonia, total phosphorus); H = DO, pH, temperature, specific conductance * denotes a tidally influenced sampling site
North Shore Coastal Water Quality Assessment Report Appendix B B993wqar06.doc DWM CN 138.5

Figure 2: 2002 Water Quality Sampling Stations in the North Coastal Drainage Area
North Shore Coastal Water Quality Assessment Report Appendix B B1093wqar06.doc DWM CN 138.5
#
#
#
#
#
#
#
#
#
#
#
##
# #
#
#
###READING
STONEHAM
MELROSE
WAKEFIELD
LYNN
SAUGUS
REVERE
MALDEN
EVERETT
PEABODY
SWAMPSCOTT
SALEM MARBLEHEAD
NAHANT
DANVERS
WENHAM
HAMILTON
IPSWICH
BEVERLY
MANCHESTER
ESSEX
GLOUCESTER
ROCKPORT
LYNNFIELD
MR01ER01AL01
CB01SM03
DR01
FF00CR03CR02
CR01WA00
GB01PB03
FR01A
TL01
SB01SR01B
BP01
SR04A
N
MA DEP Water Quality Stations#
Town Boundaries
North Coastal Drainage Area Outline
Surface Waters
LEGEND
5 0 5 Miles
Location of theNorth Coastal Drainage Area
SR00

FIELD AND ANALYTICAL METHODS
Information pertaining to station location, rationale, and objectives is available in the 2002 QAPP (MassDEP 2002). Procedures used for water sample collecting and handling are described in Sample Collection Techniques for DWM Surface Water Quality Monitoring (MassDEP 2001a). The Wall Experiment Station (WES) in Lawrence, MA supplied all sample bottles and field preservatives, which were prepared according to the WES Laboratory Quality Assurance Plan and Standard Operating Procedures (MassDEP 2001b).
In situ measurements were made with a multiprobe in accordance with the Standard Operating Procedure for the Hydrolab® Series 3/Series 4 Multiprobe (MassDEP 2001c). Measurements included dissolved oxygen, percent saturation, pH, conductivity, temperature, and total dissolved solids. Grab samples were also collected and sent to WES where they were analyzed for low-level total phosphorus (TP), ammonia as nitrogen (NH3-N), total suspended solids (TSS), and E. coli and fecal coliform bacteria. Since sampling stations in this watershed included saltwater stations, an effort was made to time the sampling events at those stations with ebbing tides to minimize tidal influence on the sample water quality. All analytical methods employed are presented in Table 2.
During each sampling event DWM personnel recorded a number of field observations for each site to facilitate the interpretation of the analytical data. Observations pertaining to weather and tidal conditions, observed uses, potential pollution sources, water color and odor, presence/absence of objectionable deposits (trash and debris and scum), percentage of periphyton/algae/aquatic plants covering the sampling reach, and riparian vegetation were recorded on DWM field sheets.
Table 2. WES/DWM Analytical Methods and Typical Detection Limits for 2002 Water Quality Analytes
Method * MDL ** RDL **In Situ Water Quality Analytes (DWM)
Hydrolab® Multiprobe Series 3 DWM SOP (CN 004.1) NA NAWater Quality Analytes (WES)
Total Phosphorus SM 4500-P-E 0.005 mg/L 0.015 mg/LTSS SM 2540 D 1.0 mg/L 1.0 mg/L
NH3-N EPA 350.1 0.02 mg/L 0.04 mg/LFecal Coliform *** SM 9222-D 6 CFU/100ml 6 CFU/100ml
E. coli *** EPA modified 1103.1 6 CFU/100ml 6 CFU/100mlEnterococci*** EPA 1600 6 CFU/100ml 6 CFU/100ml
“ * ” = “Methods for Chemical Analysis of Water and Wastes”, Environmental Protection Agency, Environmental Monitoring Systems Laboratory – Cincinnati (EMSL-CI), EPA-600/4-79-020, Revised March 1983 and 1979 where applicable; Standard Methods, Examination of Water and Wastewater, 20 th edition
“ ** ” = WES reports results down to the MDL with a qualifier upon request“ *** ” = MDL and RDL not listed for fecal, E. coli and Enterococcus results; 6 CFUs/100 mls was the practical RDL for
WES, as no results were reported below 6 (these were reported as “<6”)“ NA ” = Not Applicable
QUALITY ASSURANCE AND QUALITY CONTROL
Procedures used were consistent with the prevailing DWM sampling protocols that are described in Sample Collection Techniques for DWM Surface Water Quality Monitoring (MassDEP 2001a). For all water quality surveys, quality control samples (field blanks and sample splits) were taken at a minimum of one each per analyte per crew per survey. All water quality and bacteria samples were delivered to the WES laboratory for analysis.
North Shore Coastal Water Quality Assessment Report Appendix B B1193wqar06.doc DWM CN 138.5

DWM quality assurance and database management staff reviewed lab data reports and all multi-probe data. The data were validated and finalized using procedures presented in Standard Operating Procedure for Data Validation and Usability (MassDEP 2005a). All water sample data were validated by reviewing QC sample results, analytical holding time compliance, QC sample frequency and related ancillary data/documentation (at a minimum). A complete summary of censoring and qualification decisions for all 2002 DWM data is provided in the Data Validation Report for Year 2002 Project Data – CN 202.0 (MassDEP 2005b). Appendix 1 of this technical memorandum contains data censoring/qualification decisions for the 2002 data. Definitions for the data qualifiers are included in Appendix 2.
TIDAL INFORMATION
While the QAPP (MassDEP 2002) called for the sampling of tidally-influenced sites on outgoing tides, a review of tidal information and selected water quality data suggests that this goal was not usually met (Table 3). Survey logistics were complex and, although tidally-influenced sites were scheduled as a group for sampling on separate dates from the non-tidal streams, the duration of the sampling runs still contributed to considerable variation in the sampling times with respect to where they fell on the tidal cycle. Furthermore, the objective of sampling pre-dawn to capture dissolved oxygen minima sometimes conflicted with the goal of sampling on ebbing tides. Finally, sampling stations established for several of the tidal streams were situated too far downstream to be influenced by the low freshwater flows encountered in 2002, even at low tide. For example, the Danvers River (DR01) was sampled near high tide on May 8 and near low tide on May 9, yet salinity values were 32.6 ppt and 31.1 ppt, respectively, suggesting that samples collected on both dates were essentially seawater and not representative of upstream freshwater quality conditions (Table 7). Examination of salinity data from all of the survey dates suggests that this was true for all of the tidally-influenced streams except Frost Fish Brook and the unnamed tributary known as “Town Line Brook”. The former brook exhibited much lower salinities on all dates except September 18 and “Town Line Brook” appeared to be more indicative of freshwater conditions on May 9 and July 17.
Table 3. Tidal and Sampling Times for Tidally-influenced Monitoring SitesMonitoring Dates
Tidal Times (24 hr.) Range of Sampling Times
Tidal Status at SamplingLow High Low High
5/8/02 0321 0933 1542 2159 0825 – 1134 Near High5/9/02 0407 1019 1623 2238 0237 – 0519 Near Low6/12/02 0705 1318 1912 0120 (6/13) 0800 – 1247 Incoming7/17/02 2317 (7/16) 0528 1142 1801 0815 – 1245 Near Low7/18/02 0019 0630 1239 1858 0230 – 0542 Incoming8/14/02 2200 (8/13) 0412 1023 1640 0823 – 1145 Near Low8/15/02 2258 (8/14) 0511 1118 1737 0238 – 0513 Incoming9/6/02 0503 1114 1718 2330 0209 – 0456 Outgoing9/18/02 0350 1006 1558 2216 0842 – 1320 Near High9/19/02 0437 1051 1645 2301 0213 – 0452 Near Low
SURVEY CONDITIONS
Precipitation and stream discharge data were reviewed to determine the hydrologic conditions leading up to and during the water quality sampling events. This analysis was used, in part, to determine whether the water quality and bacteria data were representative of “wet” or “dry weather” sampling conditions. This, in turn, provided insight with regard to the relative
North Shore Coastal Water Quality Assessment Report Appendix B B1293wqar06.doc DWM CN 138.5
magnitude of point versus nonpoint sources of pollution. Furthermore, stream discharge data were reviewed to determine whether sampling events were representative of typical hydrological conditions, or if unusually high or low flows were encountered. The Massachusetts Surface Water Quality Standards (WQS) specify the most severe hydrologic condition at which water quality criteria must be met. For` rivers, the flow statistic at and above which criteria must be applied is the minimum seven-day mean streamflow expected to occur once in ten years, or 7Q10. In artificially regulated waters the lowest flow condition at which criteria must be applied is the value exceeded 99% of the time on a yearly basis or another equivalent flow that has been agreed upon. Finally, for tidally influenced sites, tide charts were consulted to determine where sampling times fell on the tidal cycle (see discussion at the end of this section).
It should be noted that the Massachusetts Emergency Management Agency (MEMA) and Executive Office of Environmental Affairs (EOEA) issued a drought advisory on December 28, 2001 and that Massachusetts was under drought advisories and watches throughout 2002. The lack of precipitation in July and August, 2002 caused surface water and groundwater conditions to deteriorate and drought conditions persisted throughout the 2002 DWM monitoring survey period. These drought conditions are reflected in precipitation data obtained for a total of six sites distributed throughout the North Coastal Drainage Area from a network of gages maintained by the Massachusetts Department of Conservation and Recreation (DCR), as well as from the National Weather Service’s website (http://www.erh.noaa.gov/box/dailystns.shtml) (NOAA 2005).
Rainfall data are summarized in Table 4 for the five days leading up to and including each of the sampling dates. Stream discharge data were obtained from two continuous USGS stream monitors: Saugus River at Saugus, MA (Table 5), located in the southern portion of the North Coastal Drainage Area, and the Parker River at Byfield, MA (Table 6), actually located outside of the North Coastal Drainage Area but considered representative of the northern portion of the drainage. Figures 3 – 12 depict mean precipitation and flow conditions in the Saugus and Parker rivers for each sampling period (i.e., May – September). Weather and hydrological conditions are described below for each survey period.
May 6 – 9, 2002 (Fig. 3 and 4) – Weather conditions were primarily clear and cool on the May sampling dates. Although approximately one-half inch of rain fell on May 2 – 3, no rain occurred anywhere throughout the North Coastal Drainage Area during May 4 – 8, and daily stream discharge values for the Saugus and Parker rivers declined steadily throughout the May sampling period. An average of less than one-quarter of an inch of rain fell on May 9, a multiprobe-only survey date. Nonetheless, the May surveys should be considered representative of dry weather conditions for the purpose of reviewing and interpreting the water quality data.
June 10 – 12, 2002 (Fig. 5 and 6) – Field notes indicated clear and cool weather on June 10 and 11 that gave way to overcast and drizzly conditions on June 12. Previously, over one inch of rain fell during June 5 – 7 and this led to variable, yet substantial, increases in streamflow in the North Coastal Drainage Area. Saugus River discharge more than doubled between June 5 and 7 but returned to near pre-storm conditions before the water quality sampling was carried out. The Parker River exhibited a similar increase in flow, but the response was less rapid, and higher flow values persisted into the actual sampling dates. This suggests that June water quality data were likely affected to some degree by the earlier wet-weather conditions.
North Shore Coastal Water Quality Assessment Report Appendix B B1393wqar06.doc DWM CN 138.5

July 15 – 18, 2002 (Fig. 7 and 8) – The July surveys were marked by clear skies and air temperatures between 70°F and 80°F. Almost no rain fell during the five days leading up to the sampling dates, and both the Saugus and Parker river gages exhibited a steady decrease in stream discharge. Water quality data from the July surveys are representative of dry-weather conditions.
August 12 – 15, 2002 (Fig. 9 and 10) – By August, 2002, Massachusetts was experiencing effects of drought conditions predicted by earlier watches and advisories. Weather during the survey dates was described on field sheets as clear and hot with no wind. No precipitation was reported from any of the rain gages in the North Coastal Drainage area between August 7 – 15, and the Saugus and Parker rivers were nearing 7Q10 flow conditions. In fact, 7Q10 conditions appear to have been reached on the August 15 sampling date. Water quality data from the August surveys are indicative of worst-case, low-flow, dry-weather conditions.
September 16 – 19, 2002 (Fig. 11 and 12) – Weather conditions during this sampling period were primarily overcast and cool with some clearing exhibited on September 19. Over one-half inch of rain fell between September 15 and 17 at scattered locations in the drainage area resulting in a substantial increase in the Saugus River discharge from 1.7 cfs to 10 cfs in one day. Flow values for the Parker River remained well below 7Q10 conditions but did exhibit a slight response to the rain event. Despite the prevailing low-flow conditions, the increases in stream discharge observed on the DWM sampling dates suggest that the recent rainfall affected the water quality data.
Table 4. 2002 Precipitation Data (in inches) for Six Sites in the North Coastal Drainage AreaDate* Beverly Salem Gloucester Lynn Wakefield Marblehead Mean
May 1 0.00 0.00 0.00 0.00 0.00 0.00 0.00
May 2 0.48 0.64 0.56 0.65 0.00 0.37 0.45
May 3 0.02 0.10 0.00 0.00 0.55 0.35 0.17
May 4 0.00 0.00 0.00 0.00 0.00 0.00 0.00
May 5 0.00 0.00 0.00 0.00 0.00 0.00 0.00
May 6 0.00 0.00 0.00 0.00 0.00 0.00 0.00
May 7 0.00 0.00 0.00 0.00 0.00 0.00 0.00
May 8 0.00 0.00 0.00 0.00 0.00 0.00 0.00
May 9 0.12 0.04 0.30 0.43 0.00 0.05 0.16
June 5 0.20 0.00 0.32 0.36 0.09 0.00 0.16
June 6 0.61 0.77 0.69 0.76 0.30 0.32 0.58
June 7 0.49 0.60 0.11 0.26 0.82 0.96 0.54
June 8 0.00 0.00 0.01 0.00 0.00 0.13 0.02
June 9 T** 0.02 0.00 0.00 0.00 0.00 0.01
June 10 0.00 0.00 0.00 0.00 0.00 0.00 0.00
June 11 T** 0.00 0.00 0.00 0.13 0.00 0.02
June 12 0.28 0.17 0.40 0.18 0.00 T** 0.17
North Shore Coastal Water Quality Assessment Report Appendix B B1493wqar06.doc DWM CN 138.5

July 10 0.01 0.00 0.00 0.00 0.80 -- 0.16
July 11 0.00 0.00 0.00 0.00 0.00 -- 0.00
July 12 0.00 0.00 0.00 0.00 0.00 -- 0.00
July 13 0.00 0.00 0.00 0.00 0.00 -- 0.00
July 14 0.00 0.00 0.00 0.00 0.00 -- 0.00
July 15 T** 0.00 0.03 0.00 0.00 -- 0.01
July 16 0.00 0.00 0.00 0.00 0.00 -- 0.00
July 17 0.00 0.00 0.00 0.00 0.00 -- 0.00
July 18 0.01 0.00 0.14 0.38 0.00 -- 0.11
Aug 7 0.00 0.00 0.00 0.00 0.00 0.00 0.00
Aug 8 0.00 0.00 0.00 0.00 0.00 0.00 0.00
Aug 9 0.00 0.00 0.00 0.00 0.00 0.00 0.00
Aug 10 0.00 0.00 0.00 0.00 0.00 0.00 0.00
Aug 11 0.00 0.00 0.00 0.00 0.00 0.00 0.00
Aug 12 0.00 0.00 0.00 0.00 0.00 0.00 0.00
Aug 13 0.00 0.00 0.00 0.00 0.00 0.00 0.00
Aug 14 0.00 0.00 0.00 0.00 0.00 0.00 0.00
Aug 15 0.00 0.00 0.00 0.00 0.00 0.00 0.00
Date* Beverly Salem Gloucester Lynn Wakefield Marblehead Mean
Sept 1 T** 0.00 -- 0.02 0.00 -- 0.01
Sept 2 0.40 0.45 -- 0.90 0.00 -- 0.44
Sept 3 0.38 0.53 -- 0.02 0.00 -- 0.23
Sept 4 0.02 0.00 -- 0.06 0.76 -- 0.21
Sept 5 0.00 0.00 -- 0.00 0.00 -- 0.00
Sept 6 0.00 0.00 -- 0.00 0.00 -- 0.00
Sept 11 T** 0.00 -- 0.00 0.00 -- 0.00
Sept 12 0.00 0.00 -- 0.00 0.00 -- 0.00
Sept 13 0.00 0.00 -- 0.00 0.00 -- 0.00
Sept 14 0.00 0.00 -- 0.00 0.00 -- 0.00
Sept 15 0.18 0.14 -- 0.44 0.00 -- 0.19
Sept 16 0.40 0.00 -- 0.57 0.49 -- 0.37
Sept 17 0.00 0.00 -- 0.00 0.55 -- 0.14
Sept 18 0.01 0.00 -- 0.00 0.00 -- 0.00
Sept 19 0.01 0.00 -- 0.00 0.00 -- 0.00* DWM sampling dates indicated in bold** T = Trace-- = No data reported from either source (see below)Sources: MA DCR (2002) and NOAA (2005)
North Shore Coastal Water Quality Assessment Report Appendix B B1593wqar06.doc DWM CN 138.5
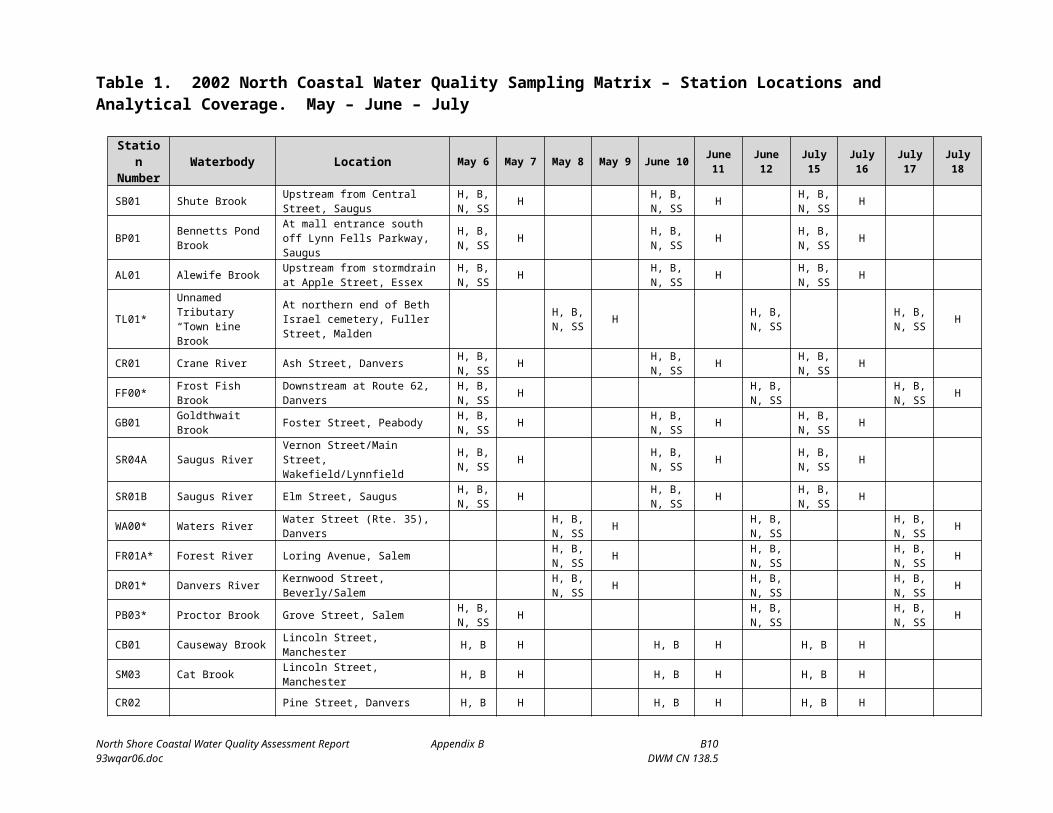
Table 5: 2002 USGS Stream Discharge Data for the Saugus River (Socolow et al., 2003)
Saugus River at Saugus Iron Works, Saugus, MA (Gage # 01102345 – Drainage area = 23.3 sq. mi.)DISCHARGE IN CUBIC FEET PER SECOND (CFS)
Survey Dates
5 Days Prior
4 Days Prior
3 Days Prior
2 Days Prior
1 Day Prior
Sample Date
MonthlyMean
POR* Mean
May 6 23 26 36 26 22 20 45.8 30.3May 7 26 36 26 22 20 18 45.8 30.3May 8 36 26 22 20 18 16 45.8 30.3May 9 26 22 20 18 16 15 45.8 30.3June 10 27 36 58 48 36 33 28.2 26.7June 11 36 58 48 36 33 30 28.2 26.7June 12 58 48 36 33 30 28 28.2 26.7July 15 18 7.9 6.0 5.2 4.5 4.0 5.63 10.3July 16 7.9 6.0 5.2 4.5 4.0 3.6 5.63 10.3July 17 6.0 5.2 4.5 4.0 3.6 3.4 5.63 10.3July 18 5.2 4.5 4.0 3.6 3.4 3.3 5.63 10.3Aug 12 2.1 2.0 1.9 1.9 1.8 1.7 2.70 6.06Aug 13 2.0 1.9 1.9 1.8 1.7 1.7 2.70 6.06Aug 14 1.9 1.9 1.8 1.7 1.7 1.5 2.70 6.06Aug 15 1.9 1.8 1.7 1.7 1.5 1.4 2.70 6.06Sept 6 3.3 4.1 10 6.0 4.0 3.2 5.57 10.0Sept 16 2.0 1.8 1.7 1.6 1.7 10 5.57 10.0Sept 17 1.8 1.7 1.6 1.7 10 8.9 5.57 10.0Sept 18 1.7 1.6 1.7 10 8.9 4.2 5.57 10.0Sept 19 1.6 1.7 10 8.9 4.2 3.0 5.57 10.0* POR = monthly mean for period of record (1994 - 2002)
North Shore Coastal Water Quality Assessment Report Appendix B B1693wqar06.doc DWM CN 138.5

Table 6: 2002 USGS Stream Discharge Data for the Parker River (Socolow et al., 2003)
Parker River at Byfield, MA (Gage # 011001000 – Drainage area = 21.3 sq. mi.)Discharge in Cubic Feet per Second (cfs)
Survey Dates
5 Days Prior
4 Days Prior
3 Days Prior
2 Days Prior
1 Day Prior
Sample Date
MonthlyMean
POR* Mean
May 6 52 51 51 50 47 42 56.8 49.3May 7 51 51 50 47 42 37 56.8 49.3May 8 51 50 47 42 37 32 56.8 49.3May 9 50 47 42 37 32 29 56.8 49.3June 10 23 25 33 46 47 42 31.5 28.1June 11 25 33 46 47 42 34 31.5 28.1June 12 33 46 47 42 34 31 31.5 28.1July 15 4.4 4.0 3.5 3.3 3.0 2.6 5.21 8.69July 16 4.0 3.5 3.3 3.0 2.6 2.6 5.21 8.69July 17 3.5 3.3 3.0 2.6 2.6 2.3 5.21 8.69July 18 3.3 3.0 2.6 2.6 2.3 1.9 5.21 8.69Aug 12 .38 .28 .37 .27 .22 .18 .28 5.39Aug 13 .28 .37 .27 .22 .18 .19 .28 5.39Aug 14 .37 .27 .22 .18 .19 .18 .28 5.39Aug 15 .27 .22 .18 .19 .18 .16 .28 5.39Sept 6 .06 .06 .09 .07 .06 .07 .20 6.19Sept 16 .07 .06 .08 .09 .07 .09 .20 6.19Sept 17 .06 .08 .09 .07 .09 .12 .20 6.19Sept 18 .08 .09 .07 .09 .12 .10 .20 6.19Sept 19 .09 .07 .09 .12 .10 .07 .20 6.197Q10 = 0.16 cfs (Ries, 1999).* POR = monthly mean for period of record (1945 - 2002)
North Shore Coastal Water Quality Assessment Report Appendix B B1793wqar06.doc DWM CN 138.5
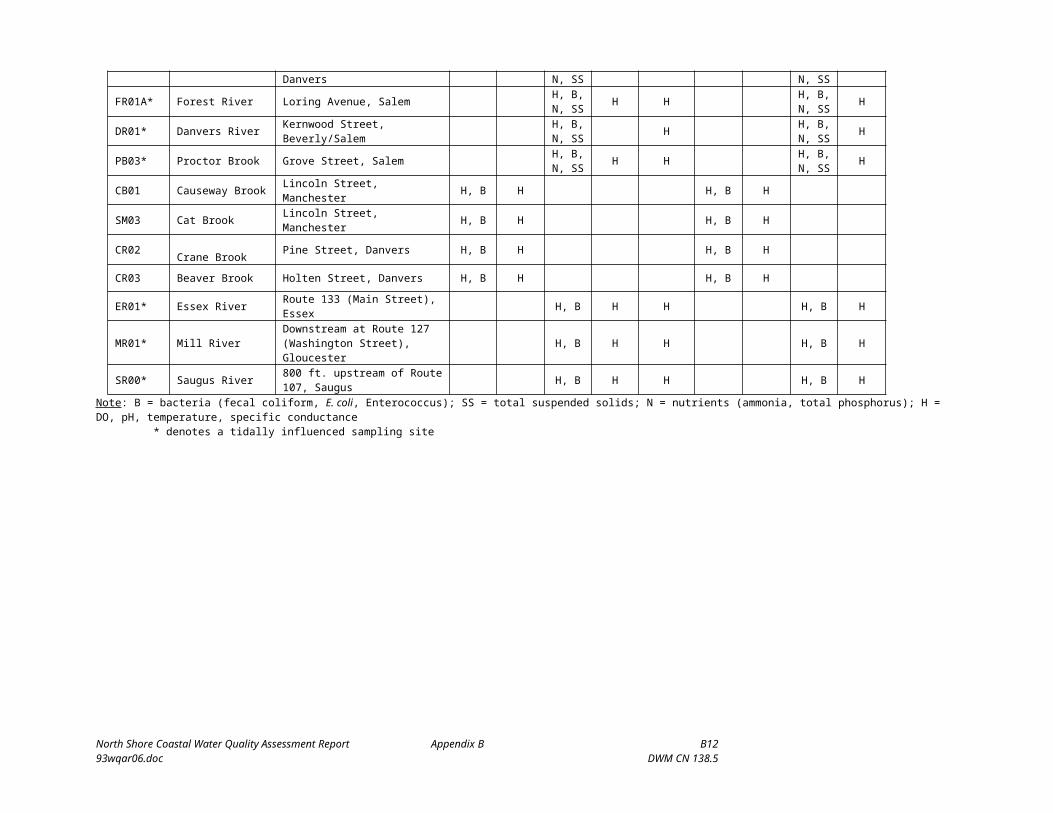
Figure 3. Mean Precipitation and Saugus River Discharge Data - May, 2002 (Survey dates denoted by asterisks)
Figure 4. Mean Precipitation and Parker River Discharge Data - May, 2002 (Survey dates denoted by asterisks)
North Shore Coastal Water Quality Assessment Report Appendix B B1893wqar06.doc DWM CN 138.5
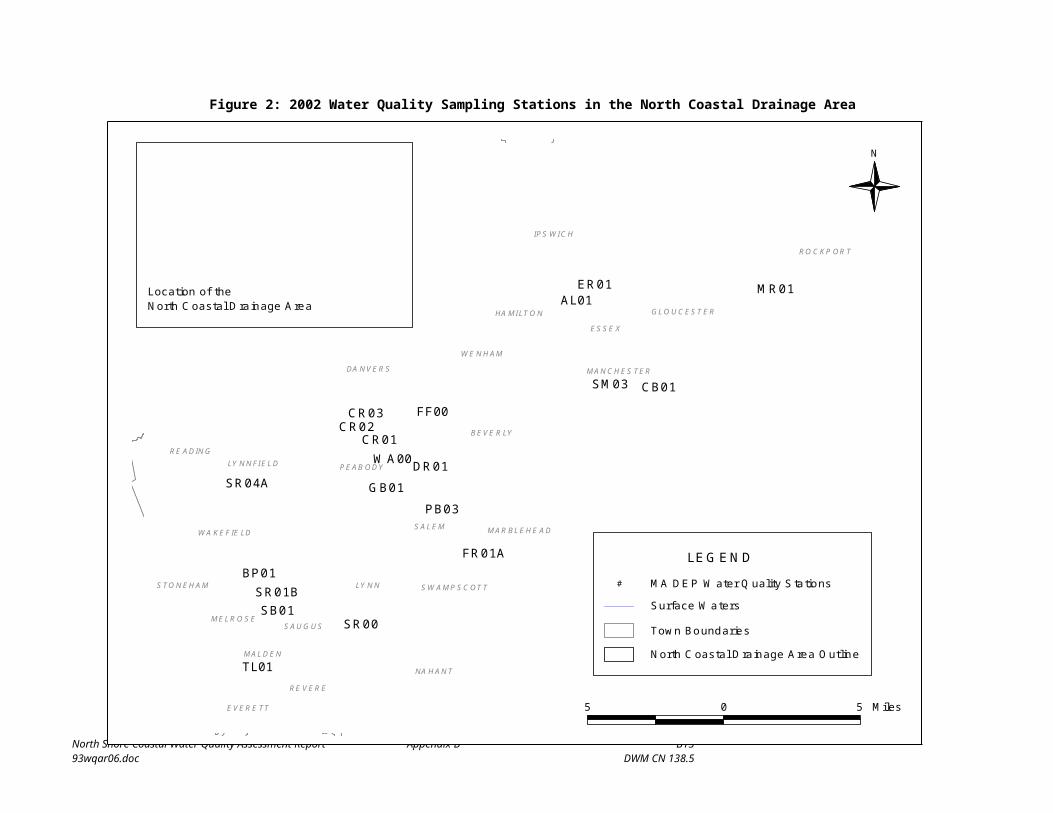
Figure 5. Mean Precipitation and Saugus River Discharge Data - June, 2002 (Survey dates denoted by asterisks)
Figure 6. Mean Precipitation and Parker River Discharge Data - June, 2002 (Survey dates denoted by asterisks)
North Shore Coastal Water Quality Assessment Report Appendix B B1993wqar06.doc DWM CN 138.5

Figure 7. Mean Precipitation and Saugus River Discharge Data - July, 2002 (Survey dates denoted by asterisks)
Figure 8. Mean Precipitation and Parker River Discharge Data - July, 2002 (Survey dates denoted by asterisks)
North Shore Coastal Water Quality Assessment Report Appendix B B2093wqar06.doc DWM CN 138.5
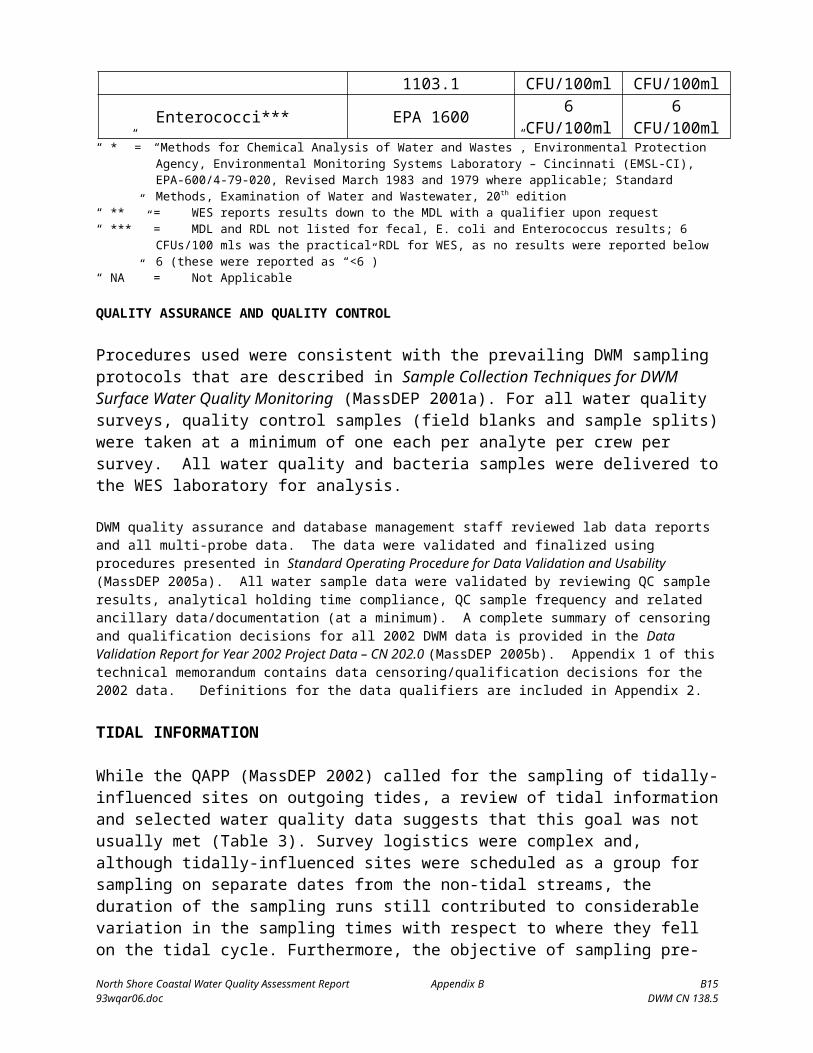
Figure 9. Mean Precipitation and Saugus River Discharge Data - August, 2002 (Survey dates denoted by asterisks)
Figure 10. Mean Precipitation and Parker River Discharge Data - August, 2002 (Survey dates denoted by asterisks)
North Shore Coastal Water Quality Assessment Report Appendix B B2193wqar06.doc DWM CN 138.5
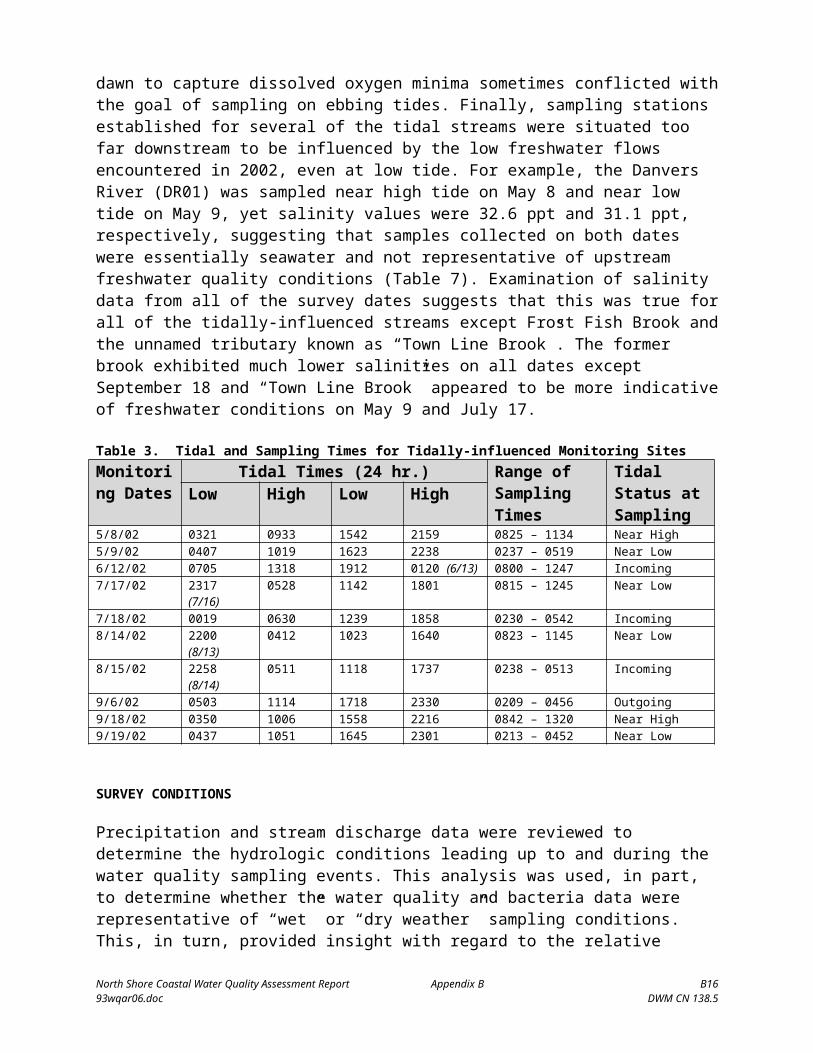
Figure 11. Mean Precipitation and Saugus River Discharge Data - September, 2002 (Survey dates denoted by asterisks)
Figure 12. Mean Precipitation and Parker River Discharge Data - September, 2002 (Survey dates denoted by asterisks)
North Shore Coastal Water Quality Assessment Report Appendix B B2293wqar06.doc DWM CN 138.5

WATER QUALITY DATA
Raw data files, field sheets, lab reports and chain of custody (COC) records are stored in open files at the DWM in Worcester. All DEP DWM water quality data are managed and maintained in the Water Quality Data Access Database. Data exports for publishing are provided by DWM’s database manager. Tables 7 and 8 are QC Status 4 (“Final”) data exports for the North Coastal Drainage Area. This level of data reflects project-level review by appropriate staff for reasonableness, completeness and acceptability. These data can be freely used and cited in documents without caution or caveat. Data validation procedures are described in Appendix 1. Data qualifiers are listed at the bottom of each page and in Appendix 2.
Table 7. 2002 MassDEP North Coastal Drainage Area in situ multiprobe Data.OWMID (sample ID), Temp (Temperature), pH, Conductivity, Total Dissolved Solids (TDS), Dissolved Oxygen (DO), and Percent Saturation
North Coastal (2002) (QC Status: 4) Exported: 9/21/2005 2:59:31 PM
Unnamed Tributary Unique_ID: W0880 Station: TL01, Mile Point: 1.112Description: unnamed tributary to Pines River locally known as Town Line Brook, north of Fuller Street, Everett at northern end of Beth Israel Cemetery, Malden
Date OWMID Time Depth Temp pH Cond@ 25C TDS SAL DO SAT (24hr) (m) (C) (SU) (uS/cm) (mg/l) (ppt) (mg/l) (%)
05/08/02 93-0321 11:41 0.5 15.7 7.4 c 39,510 -- 25.2 7.3 u 85 u05/09/02 93-0328 05:19 0.1 i 11.7 6.8 4,780 -- 2.6 5.5 51 06/12/02 93-0383 12:47 0.9 16.7 7.2 37,950 -- 24.1 ## mu ## mu07/17/02 93-0447 12:48 0.1 i 29.8 u 9.0 8,530 -- 4.8 ## ir ## ir07/18/02 93-0456 05:49 0.5 21.5 7.3 43,830 -- 28.3 4.4 58 08/15/02 93-0520 05:13 ## ir 24.1 7.3 48,150 -- 31.5 4.0 57 09/06/02 No Flow ** -- -- -- -- -- -- -- -- 09/18/02 No Flow ** -- -- -- -- -- -- -- -- 09/18/02 93-0584 13:20 0.6 19.2 7.1 35,210 u -- 22.2 u 6.8 u 83 u
ESSEX RIVER (Saris: 9354625)Unique_ID: W0890 Station: ER01, Mile Point: 3.131Description: Route 133 (Main Street), Essex
Date OWMID Time Depth Temp pH Cond@ 25C TDS SAL DO SAT (24hr) (m) (C) (SU) (uS/cm) (mg/l) (ppt) (mg/l) (%)
05/08/02 93-0309 08:56 0.6 15.1 7.5 c 35,240 u -- 22.2 u 7.7 u 86 u05/09/02 93-0323 03:08 0.3 15.9 7.2 c 24,970 -- 15.2 7.8 u 84 u06/12/02 93-0367 08:49 0.5 16.4 6.7 c 18,110 -- 10.7 5.8 mu 62 mu07/17/02 93-0431 09:01 0.5 20.8 7.0 47,810 -- 31.2 3.7 49 07/18/02 93-0449 03:02 0.4 22.4 7.0 45,410 -- 29.5 3.8 52 08/14/02 93-0495 08:53 ## ir 25.1 7.0 49,660 -- 32.6 3.0 43 08/15/02 93-0513 03:09 ## ir 25.6 7.2 49,820 -- 32.7 4.1 u 59 u09/06/02 93-0522 02:35 0.5 19.4 7.0 44,360 -- 28.7 4.2 u 53 u09/18/02 93-0568 09:14 0.8 18.9 7.3 49,060 -- 32.1 4.9 u 63 u09/19/02 93-0586 02:39 0.7 19.4 7.1 48,320 -- 31.6 4.5 u 58 u
“ ## ” = Censored data (i.e., data that have been discarded for some reason).“ ** ” = Missing data (i.e., data that should have been reported).“ -- ” = No data (i.e., data not taken/not required).“ c ” = Greater than calibration standard used for pre-calibration, or outside the acceptable range about the calibration standard. “ i ” = Inaccurate readings from multiprobe likely.“ m ” = Method not followed; one or more protocols contained in the DWM Multi-probe SOP not followed, i.e., operator error [e.g., less
than three readings per station (rivers) or per depth (lakes), or instrument failure not allowing method to be implemented.]“ u ” = Unstable readings, due to lack of sufficient equilibration time prior to final readings, non-representative location, highly-variable
water quality conditions, etc. “ r ” = Data not representative of actual field conditions.
North Shore Coastal Water Quality Assessment Report Appendix B B2393wqar06.doc DWM CN 138.5

Table 7. (Continued) 2002 MassDEP North Coastal Drainage Area in situ multiprobe Data.ALEWIFE BROOK (Saris: 9354725)Unique_ID: W0879 Station: AL01, Mile Point: 0.001Description: upstream of stormdrain coming in from northwest side of brook at Apple Street, Essex
Date OWMID Time Depth Temp pH Cond@ 25C TDS SAL DO SAT (24hr) (m) (C) (SU) (uS/cm) (mg/l) (ppt) (mg/l) (%)
05/06/02 93-0264 08:20 0.4 m 12.8 m 6.1 m 195 m 125 m -- 8.7 m 80 m05/07/02 93-0293 02:02 0.3 16.3 6.1 u 176 113 -- 7.7 u 76 u06/10/02 93-0330 08:07 0.6 18.1 6.1 192 123 -- 6.4 66 06/11/02 93-0353 01:55 0.5 18.4 6.1 193 124 -- 6.9 u 72 u07/15/02 93-0394 07:58 0.1 i 18.9 6.3 c 265 170 -- 3.4 36 07/16/02 93-0417 02:17 0.1 i 19.9 6.3 c 276 176 -- 3.7 40 08/12/02 93-0458 08:28 ## ir 20.3 6.9 c 312 200 -- 2.0 21 08/13/02 93-0481 02:11 ## ir 22.9 u 6.7 309 198 -- 2.2 u 26 u09/16/02 93-0531 08:22 0.1 i 20.3 6.4 163 104 -- 2.4 u 27 u09/17/02 93-0554 02:11 0.1 i 17.4 6.4 257 165 -- 1.7 u 18 u
MILL RIVER (Saris: 9354850)Unique_ID: W0891 Station: MR01, Mile Point: 0.001Description: downstream at Route 127 (Washington Street), Gloucester
Date OWMID Time Depth Temp pH Cond@ 25C TDS SAL DO SAT (24hr) (m) (C) (SU) (uS/cm) (mg/l) (ppt) (mg/l) (%)
05/08/02 93-0307 08:27 0.8 11.3 7.6 cu 48,910 -- 32.0 8.3 91 05/09/02 93-0322 02:41 0.2 16.9 8.1 cu 26,230 -- 16.0 8.8 98 06/12/02 93-0365 08:11 0.4 18.7 8.4 32,970 -- 20.6 8.9 107 06/13/02 93-0384 03:19 ## i ## im ## im ## imu -- ## imu ## im ## im07/17/02 93-0429 08:26 1.0 ## u 7.9 iu 48,430 iu -- 31.7 iu ## iu ## iu07/18/02 93-0448 02:34 0.3 22.6 8.4 39,190 -- 25.0 8.4 111 08/14/02 93-0493 08:23 ## ir 24.3 8.3 42,990 -- 27.7 7.3 u 101 u08/15/02 93-0512 02:38 ## ir ## iu 8.2 iu 47,460 iu -- 31.0 iu 5.1 iu 71 iu09/06/02 93-0521 02:09 0.6 19.9 8.1 42,950 -- 27.7 8.1 103 09/18/02 93-0566 08:44 1.9 17.7 7.7 49,520 -- 32.5 5.8 u 73 u09/19/02 93-0585 02:13 0.7 18.4 7.8 48,700 -- 31.9 7.1 89
CAT BROOK (Saris: 9355050)Unique_ID: W0889 Station: SM03, Mile Point: 0.701Description: Lincoln Street, Manchester
Date OWMID Time Depth Temp pH Cond@ 25C TDS SAL DO SAT (24hr) (m) (C) (SU) (uS/cm) (mg/l) (ppt) (mg/l) (%)
05/06/02 93-0268 09:01 0.2 12.1 5.9 321 205 -- 10.1 u 91 u05/07/02 93-0295 02:28 0.3 15.5 6.0 323 207 -- 9.2 90 06/10/02 93-0334 08:55 0.3 16.6 6.0 325 208 -- 8.3 m 83 m06/11/02 93-0355 02:26 0.3 16.4 6.1 320 205 -- 8.6 86 07/15/02 93-0398 08:35 0.1 i 15.4 6.3 c 294 188 -- 7.8 77 07/16/02 93-0419 02:56 0.1 i 18.2 6.3 c 411 263 -- 7.1 iu 75 iu08/12/02 93-0462 09:05 ## ir 18.8 6.4 382 244 -- 4.0 u 42 u08/13/02 93-0483 02:48 ## ir 20.5 6.5 336 215 -- 4.4 u 48 u09/16/02 93-0535 08:55 0.1 i 17.8 6.3 254 163 -- 4.4 u 45 u09/17/02 93-0556 02:42 0.1 i 16.3 6.3 388 249 -- 4.7 u 47 u
“ ## ” = Censored data (i.e., data that have been discarded for some reason).“ ** ” = Missing data (i.e., data that should have been reported).“ -- ” = No data (i.e., data not taken/not required).“ c ” = Greater than calibration standard used for pre-calibration, or outside the acceptable range about the calibration standard. “ i ” = Inaccurate readings from multiprobe likely.“ m ” = Method not followed; one or more protocols contained in the DWM Multi-probe SOP not followed, i.e., operator error [e.g., less
than three readings per station (rivers) or per depth (lakes), or instrument failure not allowing method to be implemented.]“ u ” = Unstable readings, due to lack of sufficient equilibration time prior to final readings, non-representative location, highly-variable
water quality conditions, etc. “ r ” = Data not representative of actual field conditions.
North Shore Coastal Water Quality Assessment Report Appendix B B2493wqar06.doc DWM CN 138.5

Table 7. (Continued) 2002 MassDEP North Coastal Drainage Area in situ multiprobe Data.
CAUSEWAY BROOK (Saris: 9355075)Unique_ID: W0888 Station: CB01, Mile Point: 0.077Description: Lincoln Street, Manchester
Date OWMID Time Depth Temp pH Cond@ 25C TDS SAL DO SAT (24hr) (m) (C) (SU) (uS/cm) (mg/l) (ppt) (mg/l) (%)
05/06/02 93-0266 08:49 0.4 12.4 6.3 245 157 -- 10.2 93 05/07/02 93-0294 02:20 0.3 14.4 6.1 u 243 155 -- 7.7 u 73 u06/10/02 93-0332 08:40 0.3 15.9 6.1 269 172 -- 5.3 m 52 m06/11/02 93-0354 02:16 0.3 13.9 6.0 268 172 -- 4.7 45 07/15/02 93-0396 08:23 0.1 i 19.3 u 6.0 c 236 151 -- 2.4 26 07/16/02 93-0418 02:43 0.1 i 19.1 u 6.0 c 232 148 -- 2.1 iu 23 iu08/12/02 93-0460 08:53 ## ir 20.4 6.1 217 139 -- 1.6 u 18 u08/13/02 93-0482 02:35 ## ir 21.3 6.2 239 153 -- 1.0 u 11 u09/16/02 93-0533 08:45 0.1 i 19.1 6.1 180 115 -- 2.8 29 09/17/02 93-0555 02:32 0.1 i 16.7 6.1 196 126 -- 1.9 u 19 u
DANVERS RIVER (Saris: 9355200)Unique_ID: W0886 Station: DR01, Mile Point: 0.816Description: Kernwood Street, Beverly/Salem
Date OWMID Time Depth Temp pH Cond@ 25C TDS SAL DO SAT (24hr) (m) (C) (SU) (uS/cm) (mg/l) (ppt) (mg/l) (%)
05/08/02 93-0313 09:58 0.4 11.4 u 7.9 c 49,750 -- 32.6 9.6 u 105 u05/09/02 93-0325 04:05 0.3 13.6 7.9 c 47,710 -- 31.1 9.0 102 06/12/02 93-0373 10:39 0.8 14.1 7.7 48,110 -- 31.4 6.8 mu 79 mu07/17/02 93-0437 10:29 0.5 17.3 7.9 49,600 -- 32.5 8.2 102 07/18/02 93-0452 04:16 0.3 16.7 7.9 48,730 -- 31.9 8.3 102 08/14/02 93-0501 10:16 ## ir 22.8 u 8.0 i 49,280 i -- 32.3 i 7.1 i 98 i09/06/02 93-0525 03:42 0.2 19.1 7.8 47,810 -- 31.2 6.2 u 80 u09/18/02 93-0574 11:03 0.8 17.2 7.8 49,690 -- 32.6 7.9 u 98 u09/19/02 93-0589 03:47 0.5 17.8 7.8 49,240 -- 32.3 6.7 u 84 u
FROST FISH BROOK (Saris: 9355250)Unique_ID: W0881 Station: FF00, Mile Point: 0.011Description: directly downstream at Route 62, Danvers
Date OWMID Time Depth Temp pH Cond@ 25C TDS SAL DO SAT (24hr) (m) (C) (SU) (uS/cm) (mg/l) (ppt) (mg/l) (%)
05/06/02 93-0270 09:35 0.2 11.4 7.0 c 2,430 cu 1,550 cu -- 11.1 100 05/07/02 93-0296 02:50 0.6 13.7 6.9 u 624 399 -- 9.1 u 86 u06/12/02 93-0369 09:34 0.4 13.5 7.2 748 -- 0.4 8.3 mu 78 mu07/17/02 93-0433 09:38 0.3 16.6 7.1 3,810 -- 2.1 8.5 86 07/18/02 93-0450 03:35 0.2 17.9 7.1 1,630 u -- 0.9 u 8.3 87 08/14/02 93-0497 09:28 ## ir 21.5 7.3 4,250 -- 2.3 7.7 86 09/06/02 93-0523 03:03 0.2 16.5 7.2 4,870 u -- 2.7 u 7.9 u 81 u09/18/02 93-0570 09:47 1.0 17.5 7.4 44,490 -- 28.8 5.9 72 09/19/02 93-0587 03:09 0.5 16.4 7.3 5,720 u -- 3.2 u 7.2 73
“ ## ” = Censored data (i.e., data that have been discarded for some reason).“ ** ” = Missing data (i.e., data that should have been reported).“ -- ” = No data (i.e., data not taken/not required).“ c ” = Greater than calibration standard used for pre-calibration, or outside the acceptable range about the calibration standard. “ i ” = Inaccurate readings from multiprobe likely.“ m ” = Method not followed; one or more protocols contained in the DWM Multi-probe SOP not followed, i.e., operator error [e.g., less
than three readings per station (rivers) or per depth (lakes), or instrument failure not allowing method to be implemented.]“ u ” = Unstable readings, due to lack of sufficient equilibration time prior to final readings, non-representative location, highly-variable
water quality conditions, etc.“ r ” = Data not representative of actual field conditions.
North Shore Coastal Water Quality Assessment Report Appendix B B2593wqar06.doc DWM CN 138.5

Table 7. (Continued) 2002 MassDEP North Coastal Drainage Area in situ multiprobe Data.CRANE RIVER (Saris: 9355275)Unique_ID: W0452 Station: CR01, Mile Point: 1.547Description: Ash Street, Danvers
Date OWMID Time Depth Temp pH Cond@ 25C TDS SAL DO SAT (24hr) (m) (C) (SU) (uS/cm) (mg/l) (ppt) (mg/l) (%)
05/06/02 93-0278 10:44 0.1 i 14.9 7.5 c 840 c 537 c -- 10.9 105 05/07/02 93-0299 03:27 0.4 15.8 7.3 c 866 c 554 c -- 8.7 86 06/10/02 93-0340 10:02 0.5 17.6 7.2 c 752 c 482 c -- 8.3 m 85 m06/11/02 93-0358 03:21 0.5 17.7 7.2 cu 784 c 502 c -- 7.7 79 07/15/02 93-0404 09:37 0.3 22.2 7.3 841 c 539 c -- 5.2 59 07/16/02 93-0422 03:59 0.3 22.3 7.4 848 c 543 c -- 4.6 m 52 m08/12/02 93-0468 10:06 ## ir 22.7 7.3 c 919 c 588 c -- 6.2 70 08/13/02 93-0486 03:50 ## ir 23.9 7.3 c 917 c 587 c -- 5.3 u 62 u09/16/02 93-0541 09:51 0.3 21.1 7.5 c 773 c 495 c -- 6.9 76 09/17/02 93-0559 03:31 0.3 19.5 7.3 c 697 446 -- 6.0 65
BEAVER BROOK (Saris: 9355300)Unique_ID: W0450 Station: CR03, Mile Point: 0.071Description: Holten Street, Danvers
Date OWMID Time Depth Temp pH Cond@ 25C TDS SAL DO SAT (24hr) (m) (C) (SU) (uS/cm) (mg/l) (ppt) (mg/l) (%)
05/06/02 93-0272 10:05 0.1 i 14.2 6.6 890 c 570 c -- 5.6 u 53 u05/07/02 93-0297 03:07 0.3 17.3 6.8 916 c 586 c -- 7.1 u 72 u06/10/02 93-0336 09:28 0.4 17.7 6.6 806 c 516 c -- 5.1 m 53 m06/11/02 93-0356 02:54 0.3 18.3 6.6 838 c 536 c -- 4.8 50 07/15/02 93-0400 09:04 0.2 20.2 6.5 c 1,020 c 651 c -- 2.9 u 31 u07/16/02 93-0420 03:28 0.1 i 20.1 6.5 c 1,050 c 673 c -- 2.0 u 22 u08/12/02 93-0464 09:34 ## ir 20.7 6.6 1,140 c 730 c -- 3.8 42 08/13/02 93-0484 03:19 ## ir 21.1 6.6 1,130 c 725 c -- 3.4 u 38 u09/16/02 93-0537 09:26 0.1 i 18.9 6.5 1,040 c 663 c -- 2.3 u 24 u09/17/02 93-0557 03:09 0.1 i 18.8 6.5 905 c 579 c -- 2.3 u 24 u
CRANE BROOK (Saris: 9355325)Unique_ID: W0451 Station: CR02, Mile Point: 0.267Description: Pine Street, Danvers
Date OWMID Time Depth Temp pH Cond@ 25C TDS SAL DO SAT (24hr) (m) (C) (SU) (uS/cm) (mg/l) (ppt) (mg/l) (%)
05/06/02 93-0274 10:24 0.1 i 12.1 7.1 c 843 c 540 c -- 9.6 u 87 u05/07/02 93-0298 03:16 0.3 14.5 7.0 c 847 c 542 c -- 6.6 u 64 u06/10/02 93-0338 09:46 0.4 15.3 7.0 c 773 c 495 c -- 6.3 m 61 m06/11/02 93-0357 03:06 0.3 16.3 7.0 c 800 c 512 c -- 5.7 57 07/15/02 93-0402 09:23 0.1 i 19.1 7.1 856 c 548 c -- 5.3 57 07/16/02 93-0421 03:43 0.1 i 19.9 7.2 837 c 536 c -- 5.6 mu 61 mu08/12/02 93-0466 09:50 ## ir 19.8 7.0 c 812 c 520 c -- 6.3 68 08/13/02 93-0485 03:37 ## ir 20.3 7.1 c 819 c 524 c -- 5.9 64 09/16/02 93-0539 09:37 0.1 i 20.3 6.9 c 399 256 -- 5.0 u 54 u09/17/02 93-0558 03:20 0.1 i 17.9 7.0 c 665 426 -- 5.0 52
“ ## ” = Censored data (i.e., data that have been discarded for some reason).“ ** ” = Missing data (i.e., data that should have been reported).“ -- ” = No data (i.e., data not taken/not required).“ c ” = Greater than calibration standard used for pre-calibration, or outside the acceptable range about the calibration standard. “ i ” = Inaccurate readings from multiprobe likely.“ m ” = Method not followed; one or more protocols contained in the DWM Multi-probe SOP not followed, i.e., operator error [e.g., less
than three readings per station (rivers) or per depth (lakes), or instrument failure not allowing method to be implemented.]“ u ” = Unstable readings, due to lack of sufficient equilibration time prior to final readings, non-representative location, highly-variable
water quality conditions, etc. “ r ” = Data not representative of actual field conditions.
North Shore Coastal Water Quality Assessment Report Appendix B B2693wqar06.doc DWM CN 138.5

Table 7. (Continued) 2002 MassDEP North Coastal Drainage Area in situ multiprobe Data.WATERS RIVER (Saris: 9355350)Unique_ID: W0884 Station: WA00, Mile Point: 0.197Description: Water Street (Route 35), Danvers
Date OWMID Time Depth Temp pH Cond@ 25C TDS SAL DO SAT (24hr) (m) (C) (SU) (uS/cm) (mg/l) (ppt) (mg/l) (%)
05/08/02 93-0311 09:33 0.4 13.1 7.8 c 47,960 -- 31.3 9.1 103 05/09/02 93-0324 03:45 0.1 i 14.1 7.7 c ## u -- ## u 7.7 86 06/12/02 93-0371 10:02 0.7 15.6 7.6 46,560 -- 30.3 6.7 m 80 m07/17/02 93-0435 10:03 0.3 19.3 u 7.8 47,680 -- 31.1 6.7 86 07/18/02 93-0451 03:55 0.5 18.7 7.9 48,060 -- 31.4 7.8 99 08/14/02 93-0499 09:51 ## ir 24.1 7.7 45,980 -- 29.9 5.6 79 08/15/02 93-0515 03:43 ## ir 22.6 7.8 49,190 -- 32.2 6.6 u 90 u09/06/02 93-0524 03:23 0.4 19.3 7.7 47,170 -- 30.8 6.0 78 09/18/02 93-0572 10:27 2.5 17.5 7.7 49,200 -- 32.2 6.9 86 09/19/02 93-0588 03:26 0.6 18.2 7.7 48,420 -- 31.7 6.3 79
PROCTOR BROOK (Saris: 9355400)Unique_ID: W0887 Station: PB03, Mile Point: 0.728Description: Grove Street, Salem
Date OWMID Time Depth Temp pH Cond@ 25C TDS SAL DO SAT (24hr) (m) (C) (SU) (uS/cm) (mg/l) (ppt) (mg/l) (%)
05/06/02 93-0282 08:55 0.9 11.9 u 7.4 c ## I ## ci -- 4.9 77 05/07/02 93-0301 02:13 0.1 i 15.7 7.0 c 808 c 517 c -- 7.6 u 75 u06/12/02 93-0375 11:12 0.9 16.7 7.3 1,010 -- 0.5 6.4 mu 65 mu07/17/02 93-0439 10:57 0.2 23.6 u 7.9 2,680 -- 1.4 11.3 132 07/18/02 93-0453 04:35 0.7 20.5 7.1 27,140 u -- 16.6 u 2.1 u 26 u08/14/02 93-0503 10:41 ## ir 23.3 u 6.9 i 13,360 iu -- 7.7 iu 2.5 iu 30 iu08/15/02 93-0517 04:04 ## ir 22.5 7.3 45,510 -- 29.5 2.8 u 38 u09/06/02 93-0526 04:07 0.1 i 16.6 7.2 2,860 -- 1.5 5.4 u 55 u09/18/02 93-0576 11:42 1.1 16.8 7.4 43,500 -- 28.1 5.0 60 09/19/02 93-0590 04:06 0.4 17.2 7.4 u 2,210 -- 1.2 6.3 u 65 u
GOLDTHWAIT BROOK (Saris: 9355450)Unique_ID: W0454 Station: GB01, Mile Point: 0.457Description: Foster Street, Peabody
Date OWMID Time Depth Temp pH Cond@ 25C TDS SAL DO SAT (24hr) (m) (C) (SU) (uS/cm) (mg/l) (ppt) (mg/l) (%)
05/06/02 93-0280 08:22 0.5 14.3 7.0 c 754 c 482 c -- 9.5 90 05/07/02 93-0300 01:56 0.1 i 16.8 7.3 cu 731 c 468 c -- 9.7 u 98 u06/10/02 93-0342 10:28 0.5 18.3 6.9 c 646 414 -- 7.4 m 77 m06/11/02 93-0359 03:39 0.3 18.8 6.9 c 658 421 -- 8.0 85 07/15/02 93-0406 10:12 0.2 19.0 6.8 c 657 421 -- 6.6 70 07/16/02 93-0423 04:28 0.1 i 17.0 6.8 c 658 421 -- ## mu ## mu08/12/02 93-0470 10:28 ## ir 20.6 6.8 600 384 -- 4.2 45 08/13/02 93-0487 04:09 ## ir 17.4 6.7 558 357 -- 2.7 u 28 u09/16/02 93-0543 10:18 0.1 i 19.3 6.6 528 338 -- 4.4 47 09/17/02 93-0560 03:51 0.1 i 16.5 6.6 554 355 -- 2.5 u 25 u
“ ## ” = Censored data (i.e., data that have been discarded for some reason).“ ** ” = Missing data (i.e., data that should have been reported).“ -- ” = No data (i.e., data not taken/not required).“ c ” = Greater than calibration standard used for pre-calibration, or outside the acceptable range about the calibration standard. “ i ” = Inaccurate readings from multiprobe likely.“ m ” = Method not followed; one or more protocols contained in the DWM Multi-probe SOP not followed, i.e., operator error [e.g., less
than three readings per station (rivers) or per depth (lakes), or instrument failure not allowing method to be implemented.]“ u ” = Unstable readings, due to lack of sufficient equilibration time prior to final readings, non-representative location, highly-variable
water quality conditions, etc. “ r ” = Data not representative of actual field conditions.
North Shore Coastal Water Quality Assessment Report Appendix B B2793wqar06.doc DWM CN 138.5

Table 7. (Continued) 2002 MassDEP North Coastal Drainage Area in situ multiprobe Data.
FOREST RIVER (Saris: 9355500)Unique_ID: W0885 Station: FR01A, Mile Point: 0.562Description: Loring Avenue, Salem
Date OWMID Time Depth Temp pH Cond@ 25C TDS SAL DO SAT (24hr) (m) (C) (SU) (uS/cm) (mg/l) (ppt) (mg/l) (%)
05/08/02 93-0315 10:29 0.3 13.7 7.7 c 37,910 -- 24.1 8.7 95 05/09/02 93-0326 04:31 0.1 i 15.3 7.4 c 3,540 u -- 1.9 u 6.5 u 64 u06/12/02 93-0377 11:43 0.4 14.6 7.4 36,100 u -- 22.8 u 6.3 m 71 m07/17/02 93-0443 11:31 0.2 22.9 7.2 35,970 -- 22.7 6.5 u 86 u07/18/02 93-0454 04:58 0.1 i 19.9 7.4 44,230 -- 28.6 4.3 56 08/14/02 93-0507 11:10 ## i 26.8 7.4 43,910 -- 28.4 6.6 95 08/15/02 93-0518 04:22 ## ir 22.2 7.6 48,680 -- 31.9 4.6 u 62 u09/06/02 93-0527 04:27 0.2 18.9 7.2 41,060 -- 26.3 4.4 u 55 u09/18/02 93-0580 12:14 0.5 18.1 7.7 46,200 -- 30.0 7.7 96 09/19/02 93-0591 04:26 0.5 17.8 7.3 39,680 -- 25.3 5.2 u 63 u
SAUGUS RIVER (Saris: 9355550)Unique_ID: W0882 Station: SR04A, Mile Point: 12.439Description: Vernon Street/Main Street, Wakefield/Lynnfield
Date OWMID Time Depth Temp pH Cond@ 25C TDS SAL DO SAT (24hr) (m) (C) (SU) (uS/cm) (mg/l) (ppt) (mg/l) (%)
05/06/02 93-0284 09:29 0.6 12.5 6.6 779 c 498 c -- 7.5 u 69 u05/07/02 93-0302 02:40 0.2 14.6 6.5 769 c 492 c -- 6.7 u 65 u06/10/02 93-0344 10:59 0.4 16.5 6.5 682 437 -- 6.1 m 61 m06/11/02 93-0360 04:08 0.7 16.6 6.5 703 450 -- 6.2 62 07/15/02 93-0408 10:39 0.2 19.1 6.8 c 924 c 591 c -- 5.2 u 55 u07/16/02 93-0424 04:51 0.2 18.9 6.9 920 c 589 c -- 4.9 m 53 m08/12/02 93-0472 11:02 ## ir 20.3 7.1 c 974 c 623 c -- 5.8 u 63 u08/13/02 93-0488 04:33 ## ir 21.5 6.8 869 c 556 c -- 5.4 u 61 u09/16/02 93-0545 10:44 0.2 20.0 6.6 694 444 -- 4.4 u 47 u09/17/02 93-0561 04:15 0.2 18.3 6.6 392 251 -- 4.6 u 48 u
SAUGUS RIVER (Saris: 9355550)Unique_ID: W0883 Station: SR01B, Mile Point: 4.963Description: Elm Street, Saugus
Date OWMID Time Depth Temp pH Cond@ 25C TDS SAL DO SAT (24hr) (m) (C) (SU) (uS/cm) (mg/l) (ppt) (mg/l) (%)
05/06/02 93-0286 09:59 0.4 13.1 7.1 cu 638 409 -- 10.3 95 05/07/02 93-0303 03:21 0.1 i 15.1 7.1 c 634 406 -- 8.5 u 83 u06/10/02 93-0346 11:28 0.4 17.3 7.2 c 528 338 -- 8.2 m 83 m06/11/02 93-0361 04:33 0.4 17.2 7.2 cu 538 344 -- 8.2 u 83 u07/15/02 93-0412 11:14 0.1 i 21.4 7.4 717 459 -- 7.6 84 07/16/02 93-0425 05:15 0.1 i 20.6 7.4 732 c 469 c -- 7.4 iu 81 iu08/12/02 93-0476 11:30 ## ir 22.4 7.6 c 752 c 481 c -- 8.2 u 93 u08/13/02 93-0489 04:57 ## ir 22.1 7.4 cu 751 c 481 c -- 7.6 u 86 u09/16/02 93-0549 11:12 0.1 i 20.7 7.1 c 474 303 -- 6.5 u 71 u09/17/02 93-0562 04:39 0.3 18.5 7.0 c 293 187 -- 6.8 71
“ ## ” = Censored data (i.e., data that have been discarded for some reason).“ ** ” = Missing data (i.e., data that should have been reported).“ -- ” = No data (i.e., data not taken/not required).“ c ” = Greater than calibration standard used for pre-calibration, or outside the acceptable range about the calibration standard. “ i ” = Inaccurate readings from multiprobe likely.“ m ” = Method not followed; one or more protocols contained in the DWM Multi-probe SOP not followed, i.e., operator error [e.g., less
than three readings per station (rivers) or per depth (lakes), or instrument failure not allowing method to be implemented.]“ u ” = Unstable readings, due to lack of sufficient equilibration time prior to final readings, non-representative location, highly-variable
water quality conditions, etc. “ r ” = Data not representative of actual field conditions.
North Shore Coastal Water Quality Assessment Report Appendix B B2893wqar06.doc DWM CN 138.5

Table 7. (Continued) 2002 MassDEP North Coastal Drainage Area in situ multiprobe Data.
SAUGUS RIVER (Saris: 9355550)Unique_ID: W0892 Station: SR00, Mile Point: 0.963Description: approximately 800 feet upstream of Route 107, Saugus
Date OWMID Time Depth Temp pH Cond@ 25C TDS SAL DO SAT (24hr) (m) (C) (SU) (uS/cm) (mg/l) (ppt) (mg/l) (%)
05/08/02 93-0317 11:10 1.3 15.4 u 7.9 c 46,540 u -- 30.3 u 8.4 99 05/09/02 93-0327 04:56 1.2 16.6 7.7 c 37,480 -- 23.8 7.2 84 06/12/02 93-0379 12:19 1.6 15.2 7.8 46,530 -- 30.3 7.4 mu 88 mu07/17/02 93-0445 12:13 1.5 23.2 u 7.7 45,420 -- 29.5 6.8 u 93 u07/18/02 93-0455 05:28 1.5 19.2 u 7.9 48,190 -- 31.5 7.9 u 103 u08/14/02 93-0509 11:49 ## ir 25.9 7.7 47,900 -- 31.3 5.2 76 08/15/02 93-0519 04:51 ## ir 21.9 u 7.9 49,560 -- 32.5 7.1 u 97 u09/06/02 93-0528 04:56 1.5 20.7 u 7.4 40,770 -- 26.1 5.2 u 67 u09/18/02 93-0582 12:56 2.2 20.1 u 7.6 45,670 -- 29.7 6.0 u 77 u09/19/02 93-0592 04:52 1.2 20.5 7.4 40,500 -- 25.9 4.8 62
SHUTE BROOK (Saris: 9355575)Unique_ID: W0877 Station: SB01, Mile Point: 0.808Description: upstream of Central Street (upstream of railroad tracks), Saugus
Date OWMID Time Depth Temp pH Cond@ 25C TDS SAL DO SAT (24hr) (m) (C) (SU) (uS/cm) (mg/l) (ppt) (mg/l) (%)
05/06/02 93-0288 10:41 0.4 13.1 7.2 cu 825 c 528 c -- 10.6 u 98 u05/07/02 93-0304 03:38 0.1 i 12.5 7.1 c 824 c 527 c -- 9.0 u 83 u06/10/02 93-0348 11:49 0.3 15.4 7.2 c 772 c 494 c -- 8.9 m 87 m06/11/02 93-0362 04:47 0.3 14.4 7.2 c 807 c 517 c -- 8.9 86 07/15/02 93-0414 11:32 0.1 i 19.6 7.6 976 c 624 c -- 8.5 92 07/16/02 93-0426 05:29 0.1 i 17.5 7.4 963 c 616 c -- 7.2 iu 75 iu08/12/02 93-0478 11:48 ## ir 21.7 7.6 c 1,020 c 655 c -- 8.3 u 93 u08/13/02 93-0490 05:15 ## ir 20.2 7.4 c 1,020 c 655 c -- 7.7 u 84 u09/16/02 93-0551 11:26 0.1 i 20.8 7.1 c 313 201 -- 6.6 73 09/17/02 93-0563 04:51 0.1 i 17.8 7.2 c 674 431 -- 7.4 76
BENNETTS POND BROOK (Saris: 9355625)Unique_ID: W0878 Station: BP01, Mile Point: 0.297Description: at mall entrance south off Lynn Fells Parkway and east of Forest Street, Saugus (approximately 0.3 miles from confluence with Saugus River)
Date OWMID Time Depth Temp pH Cond@ 25C TDS SAL DO SAT (24hr) (m) (C) (SU) (uS/cm) (mg/l) (ppt) (mg/l) (%)
05/06/02 93-0292 11:02 0.4 13.5 6.9 c 659 422 -- 11.8 110 05/07/02 93-0305 03:57 ## i 12.7 6.7 673 431 -- 8.5 79 06/10/02 93-0352 12:17 0.4 15.5 6.8 617 395 -- 8.9 mu 87 mu06/11/02 93-0363 05:01 0.3 14.3 6.8 639 409 -- 8.7 83 07/15/02 93-0416 11:52 0.1 i 19.7 7.1 582 372 -- 8.7 93 07/16/02 93-0427 05:44 0.1 i 16.7 7.0 576 369 -- 8.1 i 82 i08/12/02 93-0480 12:09 ## ir 21.4 7.2 c 566 362 -- 8.6 u 96 u08/13/02 93-0491 05:33 ## ir 19.3 6.9 c 569 364 -- 7.8 u 83 u09/16/02 93-0553 11:48 0.1 i 20.1 6.6 559 358 -- 6.0 65 09/17/02 93-0564 05:07 0.2 17.8 6.5 271 173 -- 6.3 65
“ ## ” = Censored data (i.e., data that have been discarded for some reason).“ ** ” = Missing data (i.e., data that should have been reported).“ -- ” = No data (i.e., data not taken/not required).“ c ” = Greater than calibration standard used for pre-calibration, or outside the acceptable range about the calibration standard. “ i ” = Inaccurate readings from multiprobe likely.“ m ” = Method not followed; one or more protocols contained in the DWM Multi-probe SOP not followed, i.e., operator error [e.g., less
than three readings per station (rivers) or per depth (lakes), or instrument failure not allowing method to be implemented.]“ u ” = Unstable readings, due to lack of sufficient equilibration time prior to final readings, non-representative location, highly-variable
water quality conditions, etc. “ r ” = Data not representative of actual field conditions.
North Shore Coastal Water Quality Assessment Report Appendix B B2993wqar06.doc DWM CN 138.5

Table 8. 2002 MassDEP North Coastal Drainage Area Physicochemical and Bacteria Data.OWMID (sample ID), Fecal coliform, E. coli, Enterococcus, Ammonia-Nitrogen (NH3-N), Total Phosphorus (TP), and Total Suspended Solids (TSS)
North Coastal (2002) (QC Status: 4) Exported: 9/21/2005 4:28:43 PM
Unnamed Tributary Unique_ID: W0880 Station: TL01, Mile Point: 1.112Description: unnamed tributary to Pines River locally known as Town Line Brook, north of Fuller Street, Everett at northern end of Beth Israel Cemetery, MaldenDate OWMID QAQC Time Fecal E.coli Entero NH3-N TP TSS
(24hr) CFU/100mL CFU/100mL CFU/100mL mg/L mg/L mg/L05/08/02 93-0318 93-0319 11:40 78 ## j 39 0.37 a 0.040 a 5.8 d05/08/02 93-0319 93-0318 11:40 59 ## j 78 0.39 a 0.040 a 7.7 d06/12/02 93-0380 93-0381 ** 8400 6400 650 0.10 ad 0.090 a 9.4 06/12/02 93-0381 93-0380 ** 8200 6400 720 0.13 ad 0.089 a 7.8 07/17/02 93-0446 -- 12:45 550 210 98 <0.02 0.092 a 12 08/14/02 93-0510 -- ** 1700 660 720 j 0.09 a 0.20 a 11 09/06/02 No Flow -- ** -- -- -- -- -- --09/18/02 No Flow -- ** -- -- -- -- -- --09/18/02 93-0583 -- 13:15 1700 560 800 <0.30 a 0.084 a 11
ESSEX RIVER (Saris: 9354625)Unique_ID: W0890 Station: ER01, Mile Point: 3.131Description: Route 133 (Main Street), EssexDate OWMID QAQC Time Fecal E.coli Entero NH3-N TP TSS
(24hr) CFU/100mL CFU/100mL CFU/100mL mg/L mg/L mg/L05/08/02 93-0308 -- 08:50 <20 ## j <20 -- -- --06/12/02 93-0366 -- 08:45 340 e 360 e 240 -- -- --07/17/02 93-0430 -- 09:05 6 6 52 -- -- --08/14/02 93-0494 -- 08:45 1000 19 39 j -- -- --09/18/02 93-0567 -- 09:12 19 13 13 -- -- --
ALEWIFE BROOK (Saris: 9354725)Unique_ID: W0879 Station: AL01, Mile Point: 0.001Description: upstream of stormdrain coming in from northwest side of brook at Apple Street, EssexDate OWMID QAQC Time Fecal E.coli Entero NH3-N TP TSS
(24hr) CFU/100mL CFU/100mL CFU/100mL mg/L mg/L mg/L05/06/02 93-0263 -- 08:10 20 de 59 e <20 d <0.02 0.020 1.0 06/10/02 93-0329 -- 08:10 120 90 130 d <0.06 0.028 <1.0 07/15/02 93-0393 -- 07:55 390 e 400 e 250 0.08 0.048 30 08/12/02 93-0457 -- 08:25 97 71 65 <0.02 0.036 j 5.5 09/16/02 93-0530 -- 08:15 19000 -- 120000 0.07 0.10 10
MILL RIVER (Saris: 9354850)Unique_ID: W0891 Station: MR01, Mile Point: 0.001Description: downstream at Route 127 (Washington Street), GloucesterDate OWMID QAQC Time Fecal E.coli Entero NH3-N TP TSS
(24hr) CFU/100mL CFU/100mL CFU/100mL mg/L mg/L mg/L05/08/02 93-0306 -- 08:30 <20 ## j 39 -- -- --06/12/02 93-0364 -- 08:10 52 39 19 -- -- --07/17/02 93-0428 -- 08:10 <6 <6 <6 -- -- --08/14/02 93-0492 -- 08:20 19 6 13 j -- -- --09/18/02 93-0565 -- 08:35 45 26 6 -- -- --
“ ## ” = Censored data (i.e., data that have been discarded for some reason).“ ** ” = Missing data (i.e., data that should have been reported).“ -- ” = No data (i.e., data not taken/not required).“ d ” = Precision of field duplicates (as RPD) did not meet project data quality objectives identified for program or in QAPP. Batched
samples may also be affected.“ e ” = Not theoretically possible. Specifically, used for bacteria data where colonies per unit volume for e-coli bacteria > fecal coliform
bacteria and for other incongruous or conflicting results.“ j ” = ‘estimated’ value; used for lab-related issues where certain lab QC criteria are not met and re-testing is not possible (as identified by
the WES lab only). Also used to report sample data where the sample concentration is less than the ‘reporting’ limit or RDL and greater than the method detection limit or MDL (mdl< x <rdl). Also used to note where values have been reported at levels less
North Shore Coastal Water Quality Assessment Report Appendix B B3093wqar06.doc DWM CN 138.5

than the mdl.
North Shore Coastal Water Quality Assessment Report Appendix B B3193wqar06.doc DWM CN 138.5

Table 8. (Continued) 2002 MassDEP North Coastal Drainage Area Physicochemical and Bacteria Data.
CAT BROOK (Saris: 9355050)Unique_ID: W0889 Station: SM03, Mile Point: 0.701Description: Lincoln Street, ManchesterDate OWMID QAQC Time Fecal E.coli Entero NH3-N TP TSS
(24hr) CFU/100mL CFU/100mL CFU/100mL mg/L mg/L mg/L05/06/02 93-0267 -- 08:55 20 d 20 78 d -- -- --06/10/02 93-0333 -- 08:55 240 e 310 e 210 d -- -- --07/15/02 93-0397 -- 08:30 490 97 180 -- -- --08/12/02 93-0461 -- 09:00 490 440 930 -- -- --09/16/02 93-0534 -- 08:50 6800 -- 200 -- -- --
CAUSEWAY BROOK (Saris: 9355075)Unique_ID: W0888 Station: CB01, Mile Point: 0.077Description: Lincoln Street, ManchesterDate OWMID QAQC Time Fecal E.coli Entero NH3-N TP TSS
(24hr) CFU/100mL CFU/100mL CFU/100mL mg/L mg/L mg/L05/06/02 93-0265 -- 08:45 20 de 59 e 20 d -- -- --06/10/02 93-0331 -- 08:40 230 e 310 e 240 d -- -- --07/15/02 93-0395 -- 08:20 68 58 300 -- -- --08/12/02 93-0459 -- 08:50 760 e 1500 e 460 -- -- --09/16/02 93-0532 -- 08:40 10000 -- 7800 -- -- --
DANVERS RIVER (Saris: 9355200)Unique_ID: W0886 Station: DR01, Mile Point: 0.816Description: Kernwood Street, Beverly/SalemDate OWMID QAQC Time Fecal E.coli Entero NH3-N TP TSS
(24hr) CFU/100mL CFU/100mL CFU/100mL mg/L mg/L mg/L05/08/02 93-0312 -- 09:55 <20 ## j <20 <0.06 a 0.021a 5.5 06/12/02 93-0372 -- 10:39 26 e 32 e 13 <0.04 a 0.060 a 5.9 07/17/02 93-0436 -- 10:30 6 <6 <6 <0.06 a 0.066 a 11 08/14/02 93-0500 -- 10:15 45 6 13 j <0.20 a 0.15 a 88 09/18/02 93-0573 -- 10:56 73 7 13 <0.10 a 0.041 a 4.1
FROST FISH BROOK (Saris: 9355250)Unique_ID: W0881 Station: FF00, Mile Point: 0.011Description: directly downstream at Route 62, DanversDate OWMID QAQC Time Fecal E.coli Entero NH3-N TP TSS
(24hr) CFU/100mL CFU/100mL CFU/100mL mg/L mg/L mg/L05/06/02 93-0269 -- 09:30 20 de 78 e 330 d <0.02 0.026 1.2 06/12/02 93-0368 -- 09:30 14000 13000 1100 <0.04 0.038 1.2 07/17/02 93-0432 -- 09:25 5800 1000 1400 0.08 0.048 2.3 08/14/02 93-0496 -- 09:25 8000 4400 2400 j 0.12 0.060 2.0 09/18/02 93-0569 -- 09:40 7200 2400 1100 <0.10 a 0.11 a 5.2
“ ## ” = Censored data (i.e., data that have been discarded for some reason).“ ** ” = Missing data (i.e., data that should have been reported).“ -- ” = No data (i.e., data not taken/not required).“ d ” = Precision of field duplicates (as RPD) did not meet project data quality objectives identified for program or in QAPP. Batched
samples may also be affected.“ e ” = Not theoretically possible. Specifically, used for bacteria data where colonies per unit volume for e-coli bacteria > fecal coliform
bacteria and for other incongruous or conflicting results.“ j ” = ‘estimated’ value; used for lab-related issues where certain lab QC criteria are not met and re-testing is not possible (as identified by
the WES lab only). Also used to report sample data where the sample concentration is less than the ‘reporting’ limit or RDL and greater than the method detection limit or MDL (mdl< x <rdl). Also used to note where values have been reported at levels less than the mdl.
North Shore Coastal Water Quality Assessment Report Appendix B B3293wqar06.doc DWM CN 138.5

Table 8. (Continued) 2002 MassDEP North Coastal Drainage Area Physicochemical and Bacteria Data.
CRANE RIVER (Saris: 9355275)Unique_ID: W0452 Station: CR01, Mile Point: 1.547Description: Ash Street, DanversDate OWMID QAQC Time Fecal E.coli Entero NH3-N TP TSS
(24hr) CFU/100mL CFU/100mL CFU/100mL mg/L mg/L mg/L05/06/02 93-0275 93-0276 10:35 10 d 10 20 d <0.02 0.031 2.9 05/06/02 93-0276 93-0275 10:35 59 d <20 98 d <0.02 0.033 2.3 06/10/02 93-0339 -- 10:01 150 58 170 d 0.07 0.063 7.8 07/15/02 93-0403 -- 09:35 200 84 210 0.07 0.076 6.0 08/12/02 93-0467 -- 10:00 77 19 58 <0.02 0.063 j 2.4 09/16/02 93-0540 -- 09:45 680 -- 1200 <0.02 0.12 12
BEAVER BROOK (Saris: 9355300)Unique_ID: W0450 Station: CR03, Mile Point: 0.071Description: Holten Street, DanversDate OWMID QAQC Time Fecal E.coli Entero NH3-N TP TSS
(24hr) CFU/100mL CFU/100mL CFU/100mL mg/L mg/L mg/L05/06/02 93-0271 -- 09:59 <20 d 20 59 d -- -- --06/10/02 93-0335 -- 09:25 180 150 310 d -- -- --07/15/02 93-0399 -- 09:05 52 e 65 e 90 -- -- --08/12/02 93-0463 -- 09:30 65 13 45 -- -- --09/16/02 93-0536 -- 09:20 580 -- 560 -- -- --
CRANE BROOK (Saris: 9355325)Unique_ID: W0451 Station: CR02, Mile Point: 0.267Description: Pine Street, DanversDate OWMID QAQC Time Fecal E.coli Entero NH3-N TP TSS
(24hr) CFU/100mL CFU/100mL CFU/100mL mg/L mg/L mg/L05/06/02 93-0273 -- 10:15 <20 d <20 160 d -- -- --06/10/02 93-0337 -- 09:45 810 e 820 e 600 d -- -- --07/15/02 93-0401 -- 09:25 310 250 350 -- -- --08/12/02 93-0465 -- 09:45 180 130 390 -- -- --09/16/02 93-0538 -- 09:33 17000 -- 1000 -- -- --
WATERS RIVER (Saris: 9355350)Unique_ID: W0884 Station: WA00, Mile Point: 0.197Description: Water Street (Route 35), DanversDate OWMID QAQC Time Fecal E.coli Entero NH3-N TP TSS
(24hr) CFU/100mL CFU/100mL CFU/100mL mg/L mg/L mg/L05/08/02 93-0310 -- 09:35 <20 ## j <20 <0.06 a 0.026 a 7.4 06/12/02 93-0370 -- 10:00 140 e 180 e 52 <0.04 a 0.068 a 8.0 07/17/02 93-0434 -- 10:00 26 13 6 0.09 a 0.073 a <1.0 08/14/02 93-0498 -- 09:49 97 e 100 e 84 j <0.20 a 0.089 a 11 09/18/02 93-0571 -- 10:22 6 <6 13 <0.10 a 0.056 a 4.4
“ ## ” = Censored data (i.e., data that have been discarded for some reason).“ ** ” = Missing data (i.e., data that should have been reported).“ -- ” = No data (i.e., data not taken/not required).“ d ” = Precision of field duplicates (as RPD) did not meet project data quality objectives identified for program or in QAPP. Batched
samples may also be affected.“ e ” = Not theoretically possible. Specifically, used for bacteria data where colonies per unit volume for e-coli bacteria > fecal coliform
bacteria and for other incongruous or conflicting results.“ j ” = ‘estimated’ value; used for lab-related issues where certain lab QC criteria are not met and re-testing is not possible (as identified by
the WES lab only). Also used to report sample data where the sample concentration is less than the ‘reporting’ limit or RDL and greater than the method detection limit or MDL (mdl< x <rdl). Also used to note where values have been reported at levels less than the mdl.
North Shore Coastal Water Quality Assessment Report Appendix B B3393wqar06.doc DWM CN 138.5

Table 8. (Continued) 2002 MassDEP North Coastal Drainage Area Physicochemical and Bacteria Data.
PROCTOR BROOK (Saris: 9355400)Unique_ID: W0887 Station: PB03, Mile Point: 0.728Description: Grove Street, SalemDate OWMID QAQC Time Fecal E.coli Entero NH3-N TP TSS
(24hr) CFU/100mL CFU/100mL CFU/100mL mg/L mg/L mg/L05/06/02 93-0281 -- 08:50 330 20 98 0.08 a 0.028 a 1.0 06/12/02 93-0374 -- 11:12 3000 1300 5800 <0.04 0.044 2.3 07/17/02 93-0438 -- 10:55 500 140 71 0.06 0.057 3.8 08/14/02 93-0502 -- 10:40 1400 530 650 j 0.10 0.067 a 3.3 09/18/02 93-0575 -- 11:30 1800 900 400 <0.10 a 0.078 a 4.7
GOLDTHWAIT BROOK (Saris: 9355450)Unique_ID: W0454 Station: GB01, Mile Point: 0.457Description: Foster Street, PeabodyDate OWMID QAQC Time Fecal E.coli Entero NH3-N TP TSS
(24hr) CFU/100mL CFU/100mL CFU/100mL mg/L mg/L mg/L05/06/02 93-0279 -- 08:15 78 <20 39 <0.02 0.027 1.9 06/10/02 93-0341 -- 10:30 100 e 120 e 13 d 0.08 0.036 1.5 07/15/02 93-0405 -- 10:10 270 170 140 0.50 0.047 2.1 08/12/02 93-0469 -- 10:25 1100 590 390 0.73 0.20 36 09/16/02 93-0542 -- 10:10 8000 -- 55000 0.58 0.21 16
FOREST RIVER (Saris: 9355500)Unique_ID: W0885 Station: FR01A, Mile Point: 0.562Description: Loring Avenue, SalemDate OWMID QAQC Time Fecal E.coli Entero NH3-N TP TSS
(24hr) CFU/100mL CFU/100mL CFU/100mL mg/L mg/L mg/L05/08/02 93-0314 -- 10:26 10 ## j 49 0.07 a 0.032 a 6.1 06/12/02 93-0376 -- 11:35 850 740 900 <0.04 a 0.078 a 15 07/17/02 93-0440 93-0441 11:30 110 6 d 210 <0.06 a 0.063 a 5.9 07/17/02 93-0441 93-0440 11:30 120 39 d 130 0.06 a 0.062 a 5.6 08/14/02 93-0504 93-0505 11:05 19 d 19 2900 j <0.20 a 0.11 a 14 d08/14/02 93-0505 93-0504 11:05 65 d 26 2500 j <0.20 a 0.094 a 17 d09/18/02 93-0577 93-0578 12:07 52 19 570 <0.10 a 0.076 a 11 d09/18/02 93-0578 93-0577 12:07 45 26 490 <0.10 a 0.083 a 15 d
SAUGUS RIVER (Saris: 9355550)Unique_ID: W0882 Station: SR04A, Mile Point: 12.439Description: Vernon Street/Main Street, Wakefield/LynnfieldDate OWMID QAQC Time Fecal E.coli Entero NH3-N TP TSS
(24hr) CFU/100mL CFU/100mL CFU/100mL mg/L mg/L mg/L05/06/02 93-0283 -- 09:30 39 20 29 0.15 0.063 6.6 06/10/02 93-0343 -- 11:00 130 e 170 e 130 d 0.33 0.13 14 07/15/02 93-0407 -- 10:35 630 190 120 0.10 0.16 19 08/12/02 93-0471 -- 10:58 1400 1200 400 <0.06 0.091 20 09/16/02 93-0544 -- 10:40 20000 -- 16000 0.10 0.15 18
“ ## ” = Censored data (i.e., data that have been discarded for some reason).“ ** ” = Missing data (i.e., data that should have been reported).“ -- ” = No data (i.e., data not taken/not required).“ d ” = Precision of field duplicates (as RPD) did not meet project data quality objectives identified for program or in QAPP. Batched
samples may also be affected.“ e ” = Not theoretically possible. Specifically, used for bacteria data where colonies per unit volume for e-coli bacteria > fecal coliform
bacteria and for other incongruous or conflicting results.“ j ” = ‘estimated’ value; used for lab-related issues where certain lab QC criteria are not met and re-testing is not possible (as identified by
the WES lab only). Also used to report sample data where the sample concentration is less than the ‘reporting’ limit or RDL and greater than the method detection limit or MDL (mdl< x <rdl). Also used to note where values have been reported at levels less than the mdl.
North Shore Coastal Water Quality Assessment Report Appendix B B3493wqar06.doc DWM CN 138.5

Table 8. (Continued) 2002 MassDEP North Coastal Drainage Area Physicochemical and Bacteria Data.
SAUGUS RIVER (Saris: 9355550)Unique_ID: W0883 Station: SR01B, Mile Point: 4.963Description: Elm Street, SaugusDate OWMID QAQC Time Fecal E.coli Entero NH3-N TP TSS
(24hr) CFU/100mL CFU/100mL CFU/100mL mg/L mg/L mg/L05/06/02 93-0285 -- 10:00 220 <20 20 <0.02 0.034 2.8 06/10/02 93-0345 -- 11:30 210 e 240 e 290 d <0.06 0.053 3.6 07/15/02 93-0409 93-0410 11:15 340 150 140 <0.02 0.083 4.2 07/15/02 93-0410 93-0409 11:15 290 140 230 <0.06 0.085 4.5 08/12/02 93-0473 93-0474 11:25 400 360 330 <0.02 0.054 1.4 08/12/02 93-0474 93-0473 11:25 420 410 350 <0.02 0.053 1.3 09/16/02 93-0546 93-0547 11:05 14000 -- 24000 <0.06 0.059 2.6 09/16/02 93-0547 93-0546 11:05 17000 -- 22000 <0.06 0.059 3.0
SAUGUS RIVER (Saris: 9355550)Unique_ID: W0892 Station: SR00, Mile Point: 0.963Description: approximately 800 feet upstream of Route 107, SaugusDate OWMID QAQC Time Fecal E.coli Entero NH3-N TP TSS
(24hr) CFU/100mL CFU/100mL CFU/100mL mg/L mg/L mg/L05/08/02 93-0316 -- 11:05 <20 ## j <20 -- -- --06/12/02 93-0378 -- 12:15 330 220 84 -- -- --07/17/02 93-0444 -- 12:10 130 <6 <6 -- -- --08/14/02 93-0508 -- 11:48 210 77 <6 j -- -- --09/18/02 93-0581 -- 12:50 58 <6 39 -- -- --
SHUTE BROOK (Saris: 9355575)Unique_ID: W0877 Station: SB01, Mile Point: 0.808Description: upstream of Central Street (upstream of railroad tracks), SaugusDate OWMID QAQC Time Fecal E.coli Entero NH3-N TP TSS
(24hr) CFU/100mL CFU/100mL CFU/100mL mg/L mg/L mg/L05/06/02 93-0287 -- 10:40 440 <20 78 <0.06 0.030 1.7 06/10/02 93-0347 -- 11:50 500 270 660 d 0.11 0.037 2.1 07/15/02 93-0413 -- 11:30 2200 590 2200 0.08 0.036 <1.0 08/12/02 93-0477 -- 11:40 2600 2200 1700 <0.02 0.054 <1.0 09/16/02 93-0550 -- 11:20 28000 -- 32000 0.07 0.098 7.0
BENNETTS POND BROOK (Saris: 9355625)Unique_ID: W0878 Station: BP01, Mile Point: 0.297Description: at mall entrance south off Lynn Fells Parkway and east of Forest Street, Saugus (approximately 0.3 miles from confluence with Saugus River)Date OWMID QAQC Time Fecal E.coli Entero NH3-N TP TSS
(24hr) CFU/100mL CFU/100mL CFU/100mL mg/L mg/L mg/L05/06/02 93-0289 93-0290 11:00 220 20 39 <0.02 0.024 1.6 05/06/02 93-0290 93-0289 11:00 220 <20 59 <0.02 0.023 1.2 06/10/02 93-0349 93-0350 12:18 1700 1500 5000 d <0.06 0.049 3.5 06/10/02 93-0350 93-0349 12:18 1600 1300 970 d <0.06 0.058 3.6 07/15/02 93-0415 -- 11:50 4200 500 3200 <0.02 0.028 1.3 08/12/02 93-0479 -- 12:05 1500 1100 1600 <0.02 0.025 <1.0 09/16/02 93-0552 -- 11:40 9400 -- 6600 <0.06 0.19 2.2
“ ## ” = Censored data (i.e., data that have been discarded for some reason).“ ** ” = Missing data (i.e., data that should have been reported).“ -- ” = No data (i.e., data not taken/not required).“ d ” = Precision of field duplicates (as RPD) did not meet project data quality objectives identified for program or in QAPP. Batched
samples may also be affected.“ e ” = Not theoretically possible. Specifically, used for bacteria data where colonies per unit volume for e-coli bacteria > fecal coliform
bacteria and for other incongruous or conflicting results.“ j ” = ‘estimated’ value; used for lab-related issues where certain lab QC criteria are not met and re-testing is not possible (as identified by
the WES lab only). Also used to report sample data where the sample concentration is less than the ‘reporting’ limit or RDL and greater than the method detection limit or MDL (mdl< x <rdl). Also used to note where values have been reported at levels less than the mdl.
North Shore Coastal Water Quality Assessment Report Appendix B B3593wqar06.doc DWM CN 138.5

QUALITY CONTROL DATA
North Coastal Drainage Area quality control data for trip blanks and field duplicate samples can be found in Tables 9 and 10. Additional information pertaining to the data validation process is provided in Appendix 1. Data qualifiers are presented at the bottom of each table and in Appendix 2.
Table 9. 2002 MassDEP North Coastal Drainage Area Quality Control Data-Blanks.OWMID (sample ID), Fecal coliform, E. coli, Enterococcus, Ammonia-Nitrogen (NH3-N), Total Phosphorus (TP), and Total Suspended Solids (TSS)
North Coastal (2002) (QC Status: 4) Exported: 9/22/2005 5:17:48 PM
Date OWMID QAQC Time Fecal E.coli Entero NH3-N TP TSS (24hr) CFU/100mL CFU/100mL CFU/100mL mg/L mg/L mg/L
05/06/02 93-0277 Blank 10:35j <20 d <20 <20 d <0.02 <0.005 <1.0 05/06/02 93-0291 Blank 11:00j <20 <20 <20 <0.02 <0.005 <1.0 05/08/02 93-0320 Blank 11:34j <20 [##] j 20 b <0.02 <0.005 <1.0 06/10/02 93-0351 Blank 12:15j <6 <6 <6 d <0.02 <0.005 <1.0 06/12/02 93-0382 Blank ** <6 <6 <6 <0.04 <0.005 <1.0 07/15/02 93-0411 Blank 11:15j <6 <6 <6 <0.02 <0.005 <1.0 07/17/02 93-0442 Blank 11:30j <6 <6 <6 <0.06 <0.005 <1.0 08/12/02 93-0475 Blank 11:25j <6 <6 <6 <0.02 <0.005 <1.0 08/14/02 93-0506 Blank ** <6 <6 <6 j <0.04 <0.005 <1.0 09/16/02 93-0548 Blank 11:05j <6 -- <6 <0.02 <0.005 <1.0 09/18/02 93-0579 Blank 12:07j <6 <6 <6 <0.10 <0.005 <1.0
“ ## ” = Censored data (i.e., data that have been discarded for some reason).“ ** ” = Missing data (i.e., data that should have been reported).“ -- ” = No data (i.e., data not taken/not required).“ d ” = Precision of field duplicates (as RPD) did not meet project data quality objectives identified for program or in QAPP. Batched
samples may also be affected.“ b ” = blank Contamination in lab reagent blanks and/or field blank samples (indicating possible bias high and false positives).“ j ” = ‘estimated’ value; used for lab-related issues where certain lab QC criteria are not met and re-testing is not possible (as identified by
the WES lab only). Also used to report sample data where the sample concentration is less than the ‘reporting’ limit or RDL and greater than the method detection limit or MDL (mdl< x <rdl). Also used to note where values have been reported at levels less than the mdl.
Table 10. 2002 MassDEP North Coastal Drainage Area Quality Control Data-DuplicatesOWMID (sample ID), Fecal coliform, E. coli, Enterococcus, Ammonia-Nitrogen (NH3-N), Total Phosphorus (TP), and Total Suspended Solids (TSS)
North Coastal (2002) (QC Status: 4) Exported: 9/26/2005 2:20:52 PM
Unnamed Tributary Unique_ID: W0880 Station: TL01, Mile Point: 1.112Description: unnamed tributary to Pines River locally known as Town Line Brook, north of Fuller Street, Everett at northern end of Beth Israel Cemetery, MaldenDate OWMID QAQC Time Log10(Fecal) Log10(E.coli) Log10(Entero) NH3-N TP TSS
(24hr) CFU/100mL CFU/100mL CFU/100mL mg/L mg/L mg/L05/08/02 93-0318 93-0319 11:40 1.892 ## j 1.591 0.37 a 0.040 a 5.8 d05/08/02 93-0319 93-0318 11:40 1.771 ## j 1.892 0.39 a 0.040 a 7.7 dRelative Percent Difference 6.6% -- 17.3% 5.3% 0.0% 28.1%06/12/02 93-0380 93-0381 ** 3.924 3.806 2.813 0.10 ad 0.090 a 9.4 06/12/02 93-0381 93-0380 ** 3.914 3.806 2.857 0.13 ad 0.089 a 7.8 Relative Percent Difference 0.3% 0.0% 1.6% 26.1% 1.1% 18.6%
North Shore Coastal Water Quality Assessment Report Appendix B B3693wqar06.doc DWM CN 138.5
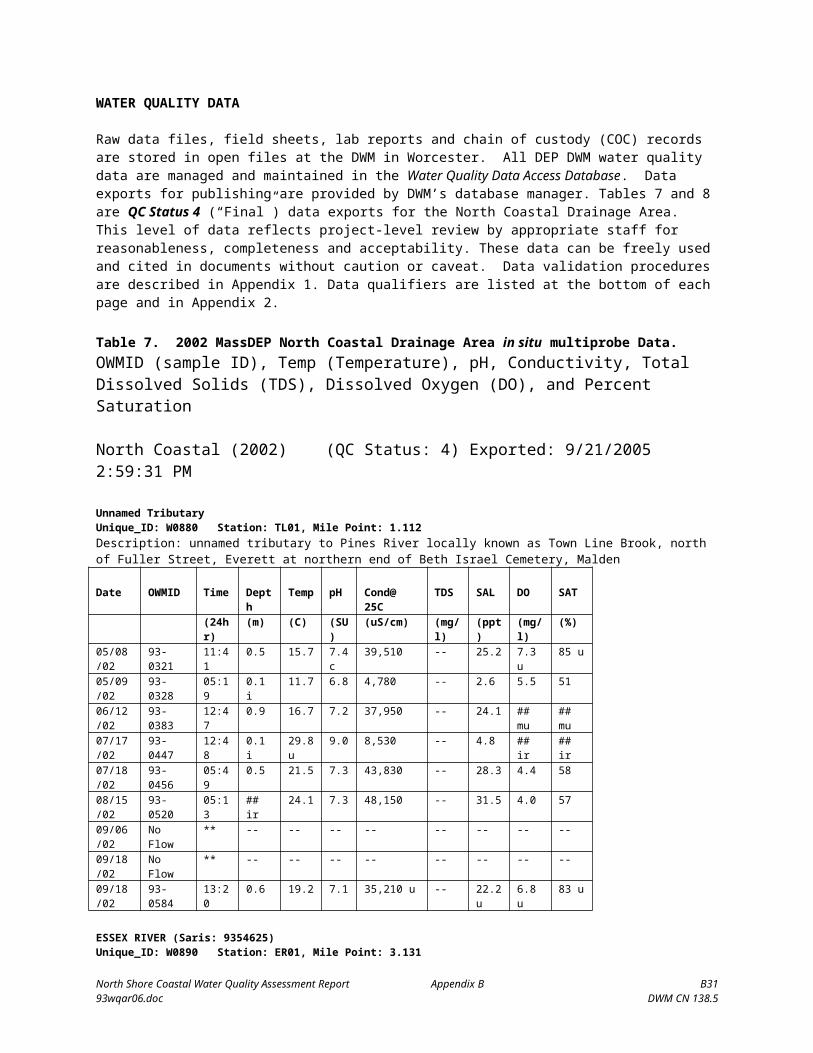
Table 10. (Continued) 2002 MassDEP North Coastal Drainage Area Quality Control Data-Duplicates
CRANE RIVER (Saris: 9355275)Unique_ID: W0452 Station: CR01, Mile Point: 1.547Description: Ash Street, DanversDate OWMID QAQC Time Log10(Fecal) Log10(E.coli) Log10(Entero) NH3-N TP TSS
(24hr) CFU/100mL CFU/100mL CFU/100mL mg/L mg/L mg/L05/06/02 93-0275 93-0276 10:35 1.000 d 1.000 1.301 d <0.02 0.031 2.9 05/06/02 93-0276 93-0275 10:35 1.771 d 1.301 1.991 d <0.02 0.033 2.3 Relative Percent Difference 55.6% 26.2% 41.9% 0.0% 6.3% 23.1%
FOREST RIVER (Saris: 9355500)Unique_ID: W0885 Station: FR01A, Mile Point: 0.562Description: Loring Avenue, SalemDate OWMID QAQC Time Log10(Fecal) Log10(E.coli) Log10(Entero) NH3-N TP TSS
(24hr) CFU/100mL CFU/100mL CFU/100mL mg/L mg/L mg/L07/17/02 93-0440 93-0441 11:30 2.041 0.778 d 2.322 <0.06 a 0.063 a 5.9 07/17/02 93-0441 93-0440 11:30 2.079 1.591 d 2.114 0.06 a 0.062 a 5.6 Relative Percent Difference 1.8% 68.6% 9.4% 0.0% 1.6% 5.2%08/14/02 93-0504 93-0505 11:05 1.279 d 1.279 3.462 j <0.20 a 0.11 a 14 d08/14/02 93-0505 93-0504 11:05 1.813 d 1.415 3.398 j <0.20 a 0.094 a 17 dRelative Percent Difference 34.6% 10.1% 1.9% 0.0% 15.7% 19.4%09/18/02 93-0577 93-0578 12:07 1.716 1.279 2.756 <0.10 a 0.076 a 11 d09/18/02 93-0578 93-0577 12:07 1.653 1.415 2.690 <0.10 a 0.083 a 15 dRelative Percent Difference 3.7% 10.1% 2.4% 0.0% 8.8% 30.8%
SAUGUS RIVER (Saris: 9355550)Unique_ID: W0883 Station: SR01B, Mile Point: 4.963Description: Elm Street, SaugusDate OWMID QAQC Time Log10(Fecal) Log10(E.coli) Log10(Entero) NH3-N TP TSS
(24hr) CFU/100mL CFU/100mL CFU/100mL mg/L mg/L mg/L07/15/02 93-0409 93-0410 11:15 2.531 2.176 2.146 <0.02 0.083 4.2 07/15/02 93-0410 93-0409 11:15 2.462 2.146 2.362 <0.06 0.085 4.5 Relative Percent Difference 2.8% 1.4% 9.6% 100.0% 2.4% 6.9%08/12/02 93-0473 93-0474 11:25 2.602 2.556 2.519 <0.02 0.054 1.4 08/12/02 93-0474 93-0473 11:25 2.623 2.613 2.544 <0.02 0.053 1.3 Relative Percent Difference 0.8% 2.2% 1.0% 0.0% 1.9% 7.4%09/16/02 93-0546 93-0547 11:05 4.146 -- 4.380 <0.06 0.059 2.6 09/16/02 93-0547 93-0546 11:05 4.230 -- 4.342 <0.06 0.059 3.0 Relative Percent Difference 2.0% -- 0.9% 0.0% 0.0% 14.3%
BENNETTS POND BROOK (Saris: 9355625)Unique_ID: W0878 Station: BP01, Mile Point: 0.297Description: at mall entrance south off Lynn Fells Parkway and east of Forest Street, Saugus (approximately 0.3 miles from confluence with Saugus River)Date OWMID QAQC Time Log10(Fecal) Log10(E.coli) Log10(Entero) NH3-N TP TSS
(24hr) CFU/100mL CFU/100mL CFU/100mL mg/L mg/L mg/L05/06/02 93-0289 93-0290 11:00 2.342 1.301 1.591 <0.02 0.024 1.6 05/06/02 93-0290 93-0289 11:00 2.342 1.301 1.771 <0.02 0.023 1.2 Relative Percent Difference 0.0% 0.0% 10.7% 0.0% 4.3% 28.6%06/10/02 93-0349 93-0350 12:18 3.230 3.176 3.699 d <0.06 0.049 3.5 06/10/02 93-0350 93-0349 12:18 3.204 3.114 2.987 d <0.06 0.058 3.6 Relative Percent Difference 0.8% 2.0% 21.3% 0.0% 16.8% 2.8%
“ ## ” = Censored data (i.e., data that have been discarded for some reason).“ ** ” = Missing data (i.e., data that should have been reported).“ -- ” = No data (i.e., data not taken/not required).“ d ” = Precision of field duplicates (as RPD) did not meet project data quality objectives identified for program or in QAPP. Batched
samples may also be affected.“ j ” = ‘estimated’ value; used for lab-related issues where certain lab QC criteria are not met and re-testing is not possible (as identified by
the WES lab only). Also used to report sample data where the sample concentration is less than the ‘reporting’ limit or RDL and greater than the method detection limit or MDL (mdl< x <rdl). Also used to note where values have been reported at levels less than the mdl.
North Shore Coastal Water Quality Assessment Report Appendix B B3793wqar06.doc DWM CN 138.5
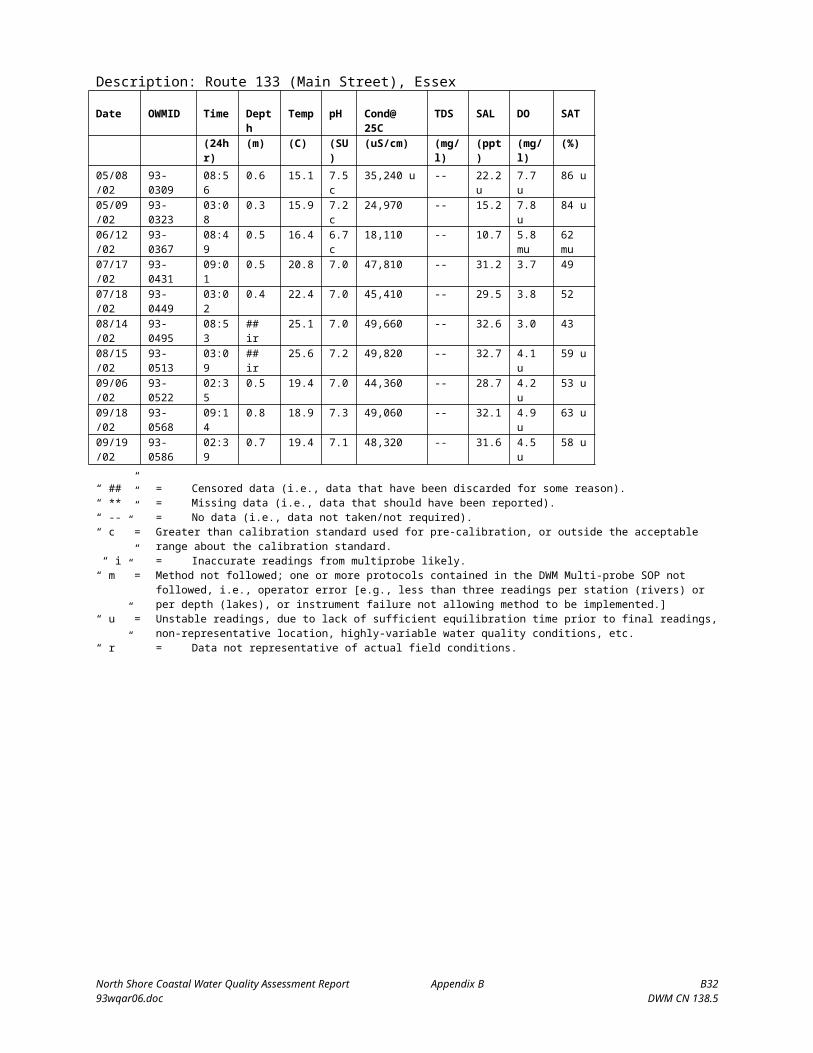
REFERENCES
MA DCR. 2002. Unpublished precipitation reports. Massachusetts Department of Conservation and Recreation (formerly Department of Environmental Management), Division of Water Supply Protection. Boston, MA.
MassDEP. 2001a. CN 001.1 - Sample Collection Techniques for DWM Surface Water Quality Monitoring. May 2001. Massachusetts Department of Environmental Protection, Division of Watershed Management. Worcester, MA.
MassDEP. 2001b. Laboratory Quality Assurance Plan and Standard Operating Procedures. Massachusetts Department of Environmental Protection, Division of Environmental Analysis, Senator William X. Wall Experiment Station. Lawrence, MA.
MassDEP. 2001c. CN 004.1 - Standard Operating Procedure for the Hydrolab® Series 3/Series 4 Multiprobe. Massachusetts Department of Environmental Protection, Division of Watershed Management. Worcester, MA.
MassDEP. 2002. CN 081.0 - Quality Assurance Project Plan for 2002 Monitoring in the Charles, Housatonic, Hudson, North Coastal and Ten Mile Watersheds. Massachusetts Department of Environmental Protection, Division of Watershed Management. Worcester, MA.
MassDEP. 2004. CN 99.0 – 2002 Fish Toxics Monitoring – Public Request and Year 2 Watershed Surveys. July, 2004. Massachusetts Department of Environmental Protection, Division of Watershed Management. Worcester, MA.
MassDEP. 2005a. CN 56.2 - Standard Operating Procedure for Data Validation and Usability. Working Draft. January 2005. Massachusetts Department of Environmental Protection, Division of Watershed Management. Worcester, MA.
MassDEP. 2005b. CN 202.0 – Data Validation Report for Year 2002 Project Data. October, 2005. Massachusetts Department of Environmental Protection, Division of Watershed Management. Worcester, MA.
MassDEP. 2005c. CN 204.0 – 2002 Baseline Lake Survey. Draft. November, 2005. Massachusetts Department of Environmental Protection, Division of Watershed Management. Worcester, MA.
NOAA. 2005. Daily Climate Data for the Northeast U.S. National Oceanic and Atmospheric Administration. National Weather Service Forecast Office. Boston, MA. [Online]. (http://www.erh.noaa.gov/box/dailystns.shtml)
Ries, K.G., III. 1999. Streamflow Measurements, Basin Characteristics, and Streamflow Statistics for Low-Flow Partial Record Stations Operated in Massachusetts from 1989 Through 1996: USGS Water Resources Investigations Report 99-4006. USGS Water Resources Division, Northborough, MA.
Socolow, R. S., G. G. Girouard and L. R. Ramsbey. 2003. Water Resources Data Massachusetts and Rhode Island Water Year 2002. Water Data Report MA-RI-02-1. USGS Water Resources Division, Northborough, MA.
North Shore Coastal Water Quality Assessment Report Appendix B B3893wqar06.doc DWM CN 138.5

Appendix 1
Quality Assurance/Quality Control Data Validation for theNorth Coastal Drainage Area 2002 Water Quality Survey
Selected Excerpts from:Data Validation Report for Year 2002 Project Data (CN 202.0)
4.0 2002 In-situ Multiprobe Data
4.1 General Validation Criteria for 2002 In-situ Multi-probe Data
The following non-probe-specific validation criteria for multi-probe data were used:
• Consistency with the Multi-probe SOP (specifically, the requirement for three (minimum)-five (preferred) sequential readings one-minute-apart at appropriate depths, proper field use, etc.). Where appropriate, “m” qualifier is used. NOTE: only Hydrolab Series ¾ used in 2002.
• Representativeness of data (review of fieldsheets and notes for any information that might indicate non-representativeness; eg. not taken at the deep hole). Where appropriate, “r” qualifier is used.
• Check for “outliers” or unreasonable data, based on best professional judgment. Outliers are identified and reviewed for potential qualification or censoring (“r”).
• Multi-probe record acceptance : Within each set of records for individual OWMID #s, automatically accept the final line of data for each depth where the change in depth from the previous accepted-record-depth is greater than 0.2 meters, subject to review and change by the multi-probe review team. (Note: where no electronic data is available and fieldsheet data is used, an “s” qualifier is applied)
4.2 Probe-Specific Validation Criteria
• Overall accuracy of readings are assessed through review of pre-survey calibration/check and post-survey check data for each parameter, field notes for any information on faulty operation and/or unusual field conditions, ranges of calibration standards used and by checking stability of readings (latter for attended data only). This review may have resulted in the use of the “i”, “c” and/or “u” qualifiers.
For lake depth profiles, more leeway is given to apparently unstable multi-probe data, given that thermal stratification can cause rapid, natural changes in parameters within the thermocline.
The specific criteria used for both attended (during a defined survey) and unattended (continuous recording mode) are outlined in the Data Validation Report for Year 2002 Project Data (CN 202.0).
North Shore Coastal Water Quality Assessment Report Appendix B B3993wqar06.doc DWM CN 138.5

5.0 2002 Discrete Water Sample Data
5.1 QA/QC Objectives and Criteria for 2002 Discrete Water Sample Data
In general, critical review and evaluation of 2002 data involved the following quality assurance elements. Also, see the Data Validation Report for Year 2002 Project Data (CN 202.0) for more detailed outline of data validation criteria.
A) Analytical Holding Time (analyte-specific)
B) Quality Control Sample Frequency (At a minimum, one field blank and one replicate must be collected for every ten samples by any given sampling crew on any given date.)
C) Field Blanks (Field blanks were prepared at the DWM Worcester Laboratory. Reagent grade water was transported into the field in a sample container where it was transferred into a different sample container directly or via a sampling device (equipment blank) using the same methods as for its corresponding field sample (e.g., blank samples were preserved in the same way). All blanks were submitted to the WES laboratory “blind”.)
D) Field Replicates (in 2002, field duplicate samples for rivers were taken as co-located, simultaneous duplicates. As a result, these duplicate results include any spatial, natural variability present between side-by-side samples, which should be minimal in most cases where site selection has accounted for uniform mixing. Duplicate lake samples were sequential and therefore also include any temporal variability. Samples were submitted to WES laboratory “blind”.)
E) Field and/or Lab Audits (as available)
F) Laboratory assessment of analytical precision and accuracy: The WES Laboratory is solely responsible for the administration of its Quality Assurance Program and Standard Operating Procedures. WES staff release discrete water sample data when their established QA/QC criteria have been met. When the following criteria cannot be met, data are qualified using appropriate qualifiers:
• Low Calibration Standards – Checks the stability of the instrument’s calibration curve; analyzes the accuracy of an instrument’s calibration within a 5% range.
• Reference Standards – Generally, a second source standard (a standard different from the calibration stock standard) that analyzes the method accuracy.
• Laboratory Reagent Blank/Method Blank (LRB) – Reagent grade water (de-ionized) extracted with every sample set used to ensure that the system is free of target analytes (< MDL) and to assess potential blank contamination.
• Duplicate Sample – Measures the precision (as Relative Percent Difference or RPD) of the analytical process. The acceptable laboratory %RPD range is typically 25%. For bacteria, duplicate data are evaluated based the range of logged values.
• Spike Sample (Laboratory Fortified Blank - LFB, Laboratory Fortified Matrix - LFM)– Measures the accuracy (% Recovery) of an analytical method. The acceptable laboratory %
North Shore Coastal Water Quality Assessment Report Appendix B B4093wqar06.doc DWM CN 138.5

recovery range is typically between 80 – 120% for LFB samples and 70 –130% for LFM discrete water samples.
5.2 Field and Lab Audit Results
In 2002, three field audits (total) were performed by DWM’s QC Analyst. These audits involved six different DWM staff members. All audits concluded that staff performance was fair-excellent in terms of SOP adherence. Audit results did not impact validation of survey sample results.
5.3 QA/QC Issues and Considerations for 2002 Data
The following is particularly noteworthy regarding 2002 DWM/CERO surveys. The validation decisions contained in the tables below reflect this consideration.
Pre-rinsing sample bottles: Sample collection in 2002 was performed without pre-rinsing sample bottles. (Precautionary pre-rinsing was started in mid-June 2003, based on the occasional finding of small amounts of visible particles in some of the new, pre-cleaned sample bottles). Due to uncertainty regarding the extent of this problem and lack of any comparison data to evaluate its effects on specific analytes, this issue did not affect 2002 data validation decisions.
5.4 2002 Censored/Qualified Discrete Water Sample Data (by analyte)
A complete summary of Year 2002 data decisions (censored or qualified) for discrete water samples collected from the North Coastal Drainage Area is available upon request.
North Shore Coastal Water Quality Assessment Report Appendix B B4193wqar06.doc DWM CN 138.5
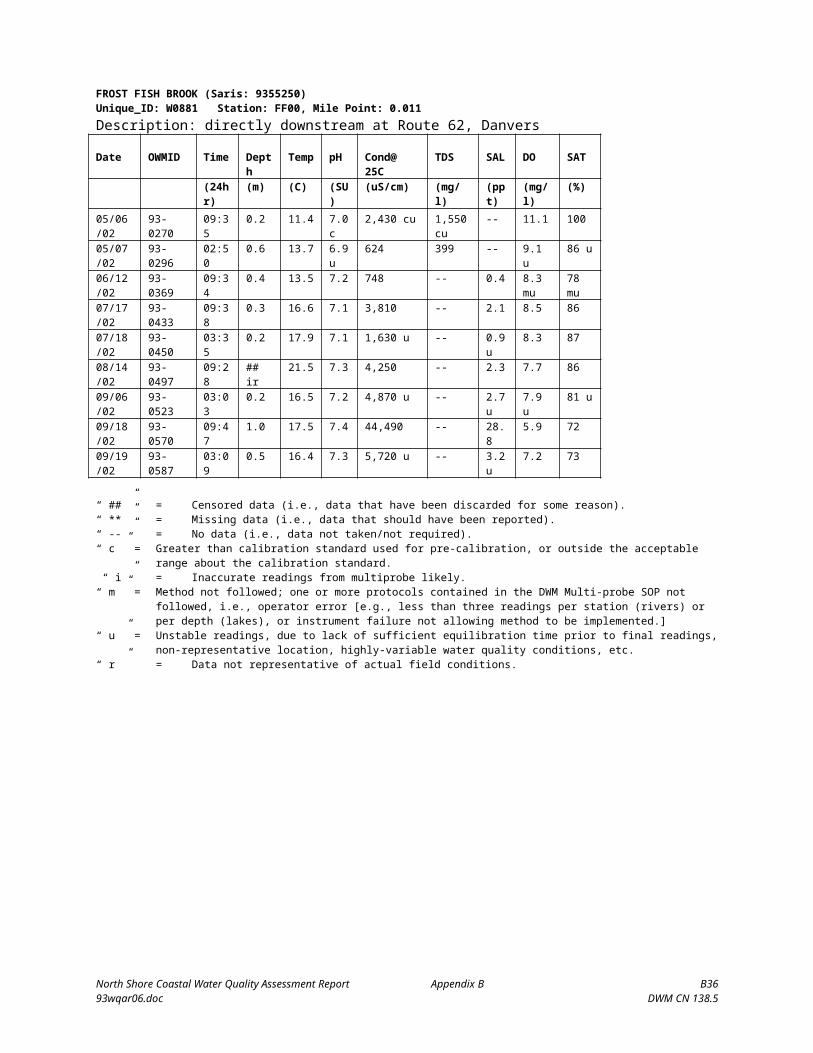
Appendix 2
Data Symbols and Qualifiers for the North Coastal Drainage Area 2002 Water Quality Survey
Selected Excerpts from:Data Validation Report for Year 2002 Project Data (CN 202.0)
The following data qualifiers or symbols are used in the MADEP/DWM WQD database for qualified and censored water quality and multi-probe data. Decisions regarding censoring vs. qualification for specific, problematic data are made based on a thorough review of all pertinent information related to the data. General Symbols (applicable to all types):
“ ## ” = Censored data (i.e., data that has been discarded for some reason). NOTE: Prior to 2001 data, “**” denoted either censored or missing data.
“ ** ” = Missing data (i.e., data that should have been reported). See NOTE above.
“ -- ” = No data (i.e., data not taken/not required)
* = Analysis performed by Laboratory OTHER than DEP’s Wall Experiment Station (WES)
[ ] = A result reported inside brackets has been “censored”, but is shown for informational purposes (e.g., high blank results).
Multi-probe-specific Qualifiers: “ i ” = inaccurate readings from Multi-probe likely; may be due to significant pre-survey calibration problems, post-survey checks outside typical acceptance ranges for the low ionic and deionized water checks, lack of calibration of the depth sensor prior to use, or to checks against laboratory analyses. Where documentation on unit pre-calibration is lacking, but SOPs at the time of sampling dictated pre-calibration prior to use, then data are considered potentially inaccurate.
North Shore Coastal Water Quality Assessment Report Appendix B B4293wqar06.doc DWM CN 138.5
Qualification Criteria for Depth (i):
General Depth Criteria: Apply to each OWMID#
- Clearly erroneous readings due to faulty depth sensor: Censor (i) - Negative and zero depth readings: Censor (i); (likely in error)- 0.1 m depth readings: Qualify (i); (potentially in error)- 0.2 and greater depth readings: Accept without qualification; (likely accurate)
Specific Depth Criteria: Apply to entirety of depth data for survey date
- If zero and/or negative depth readings occur more than once per survey date, censor all negative/zero depth data, and qualify all other depth data for that survey (indicates that erroneous depth readings were not recognized in the field and that corrective action (field calibration of the depth sensor) was not taken, ie. that all positive readings may be in error.)

“ m ” = method not followed; one or more protocols contained in the DWM Multi-probe SOP not followed, ie. operator error (eg. less than 3 readings per station (rivers) or per depth (lakes), or instrument failure not allowing method to be implemented.
“ s ” = field sheet recorded data were used to accept data, not data electronically recorded in the Multi-probe surveyor unit, due to operator error or equipment failure.
“ u ” = unstable readings, due to lack of sufficient equilibration time prior to final readings, non-representative location, highly-variable water quality conditions, etc. See Section 4.1 for acceptance criteria.
“ c ” = greater than calibration standard used for pre-calibration, or outside the acceptable range about the calibration standard. Typically used for conductivity (>718, 1,413, 2,760, 6,668 or 12,900 uS/cm) or turbidity (>10, 20 or 40 NTU). It can also be used for TDS and Salinity calculations based on qualified (“c”) conductivity data, or that the calculation was not possible due to censored conductivity data (TDS and Salinity are calculated values and entirely based on conductivity reading). See Section 4.1 for acceptance criteria.
“ r ” = data not representative of actual field conditions.
“ ? ” = Light interference on Turbidity sensor (Hydrolab error message). Data is typically censored.
Sample-Specific Qualifiers:
“ a ” = accuracy as estimated at WES Lab via matrix spikes, PT sample recoveries, internal check standards and lab-fortified blanks did not meet project data quality objectives identified for program or in QAPP.
“ b ” = blank Contamination in lab reagant blanks and/or field blank samples (indicating possible bias high and false positives).
“ d ” = precision of field duplicates (as RPD) did not meet project data quality objectives identified for program or in QAPP. Batched samples may also be affected.
“ e ” = not theoretically possible. Specifically, used for bacteria data where colonies per unit volume for e-coli bacteria > fecal coliform bacteria, for lake Secchi and station depth data where a specific Secchi depth is greater than the reported station depth, and for other incongruous or conflicting results. “ f ” = frequency of quality control duplicates did not meet data quality objectives identified for program or in QAPP.
“ h ” = holding time violation (usually indicating possible bias low)
“ j ” = ‘estimated’ value; used for lab-related issues where certain lab QC criteria are not met and re-testing is not possible (as identified by the WES lab only). Also used to report sample data where the sample concentration is less than the ‘reporting’ limit or RDL and greater than the method detection limit or MDL (mdl< x <rdl). Also used to note where values have been reported at levels less than the mdl.
North Shore Coastal Water Quality Assessment Report Appendix B B4393wqar06.doc DWM CN 138.5
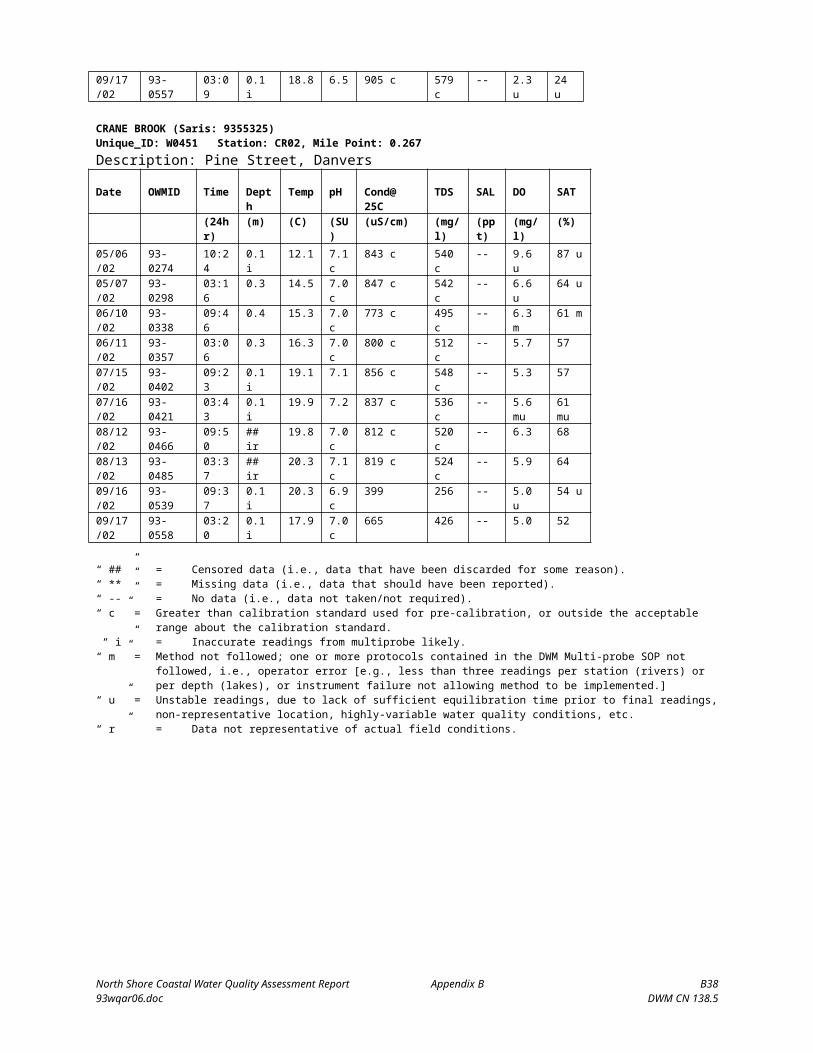
“ m ” = method SOP not followed, only partially implemented or not implemented at all, due to complications with sample matrix (eg. sediment in sample, floc formation), lab error (eg. cross-contamination between samples), additional steps taken by the lab to deal with matrix complications, lost/unanalyzed samples, and missing data.
“ p ” = samples not preserved per SOP or analytical method requirements.
“ r ” = samples collected may not be representative of actual field conditions, including the possibility of “outlier” data and flow-limited conditions (e.g., pooled).
North Shore Coastal Water Quality Assessment Report Appendix B B4493wqar06.doc DWM CN 138.5

APPENDIX CDWM 2002 LAKE SURVEY DATA IN THE NORTH SHORE COASTAL WATERSHEDS
In the North Shore Coastal Watersheds, the MassDEP Division of Watershed Management (DWM) staff conducted baseline lake surveys at Beck, Coy, Pillings, and West ponds between July and September 2002. The surveys were conducted to coincide with maximum growth of aquatic vegetation, highest recreational use, and highest lake productivity. In-situ measurements using the Hydrolab® multiprobe (including dissolved oxygen, water temperature, pH, conductivity, and depth and calculates total dissolved solids and % oxygen saturation) were recorded once in each waterbody. At deep-hole stations measurements were recorded at various depths creating profiles. In-lake samples were also collected and analyzed for alkalinity, total phosphorus, apparent color, and chlorophyll a (an integrated sample).
Procedures used for water sampling and sample handling are described in the Grab Collection Techniques for DWM Water Quality Sampling Standard Operating Procedure and the Multiprobe Standard Operating Procedure (MassDEP 2001a and MassDEP 2001b). Apparent color and chlorophyll a were measured according to standard procedures at the MassDEP DWM office in Worcester (MassDEP 2001c and MassDEP 2001d). The aquatic plant cover (native and non-native) and species distribution were mapped and recorded. Details on procedures used can be found in the Quality Assurance Project Plan for TMDL Baseline Lakes Survey 2002 (MassDEP 2002).
The Wall Experiment Station (WES), the Department’s analytical laboratory, supplied all sample bottles and field preservatives, which were prepared according to the WES Laboratory Quality Assurance Plan and Standard Operating Procedures (MassDEP 1995). Samples were preserved in the field as necessary, transported on ice to WES, and analyzed according to the WES Standard Operating Procedures (SOP). Quality control samples (field blanks and duplicates) were also taken and transported on ice to WES on each sampling date.
Information about data quality objectives (accuracy, precision, detection limits, holding times, representativeness and comparability) is available in the 2002 Data Validation Report (MassDEP 2005).
Water quality data were excerpted from the Baseline Lake Survey 2002 Technical Memo (Mattson in preparation) and are presented in tables C1 and C2. Symbols and qualifiers used for DWM data are provided in Attachment 1 (excerpted from data validation report).
North Shore Coastal Watersheds 2002 Water Quality Assessment Report Appendix C C193wqar06.doc DWM CN 138.5

Table C1. 2002 MassDEP DWM North Shore Coastal Watersheds Baseline Lakes physico-chemical data.
NORTH COASTAL/Beck Pond, Unique ID: W0968 Station: ADescription: deep hole, HamiltonDate Secchi Secchi Time Station Depth OWMID QAQC Time SmpTyp RelDepth Depth Chloride Chl-a TP AppColor
m 24hr m 24hr -- m mg/L mg/m3 mg/L PCU07/02/02 2.9 13:40 3.2
LB-2017 LB-2018 13:25 VDOR s 0.5 -- -- 0.017 60* am LB-2018 LB-2017 13:30 VDOR s 0.5 -- -- 0.022 60* am LB-2019 -- 13:35 VDOR nb 2.5 -- -- 0.019 -- LB-2021 LB-2022 13:40 DINT -- 0 - 2.9 -- 3.8* -- -- LB-2022 LB-2021 13:45 DINT -- 0 - 2.9 -- 3.9* -- --
07/30/02 2.5 13:30 3.2 LB-2158 LB-2159 13:20 VDOR s 0.5 -- -- ## b 45* a LB-2159 LB-2158 13:20 VDOR s 0.5 -- -- ## b 49* a LB-2160 -- 13:25 VDOR nb 2.7 -- -- ## b -- LB-2162 LB-2163 13:35 DINT -- 0 - 2.7 -- 2.9* -- -- LB-2163 LB-2162 13:35 DINT -- 0 - 2.7 -- 3.4* -- --
08/21/02 2.3 14:15 3.3 LB-2299 LB-2300 14:00 VDOR s 0.5 -- -- 0.016 55* LB-2300 LB-2299 14:05 VDOR s 0.5 -- -- 0.017 50* LB-2301 -- 14:10 VDOR nb 2.8 -- -- 0.024 -- LB-2303 LB-2304 14:20 DINT -- 0 - 2.8 -- 3.2* -- -- LB-2304 LB-2303 14:25 DINT -- 0 - 2.8 -- 3.8* -- --
NORTH COASTAL/Coy Pond, Unique ID: W0966 Station: ADescription: deep hole, center of pond, WenhamDate Secchi Secchi Time Station Depth OWMID QAQC Time SmpTyp RelDepth Depth Chloride Chl-a TP AppColor
m 24hr m 24hr -- m mg/L mg/m3 mg/L PCU07/02/02 1.0 11:55 2.0
LB-2024 -- 11:55 VDOR s 0.5 -- -- 0.021 b 120* am LB-2025 -- 11:55 DINT -- ** - ** -- 11.7* -- --
07/30/02 1.4 12:20 2.1 LB-2165 -- 12:15 VDOR s 0.5 -- -- 0.028 100* a LB-2166 -- 12:20 DINT -- 0 - 1.5 -- 18.2* -- --
08/21/02 1.2 12:00 1.8 LB-2307 -- 11:55 VDOR s 0.5 -- -- 0.021 b 100* LB-2308 -- 12:25 DINT -- 0 - 1.3 -- 9.0* -- --
NORTH COASTAL/PILLINGS POND, UNIQUE ID: W0956 STATION: BDescription: approximate center of pond, LynfieldDate Secchi Secchi Time Station Depth OWMID QAQC Time SmpTyp RelDepth Depth Chloride Chl-a TP AppColor
m 24hr m 24hr -- m mg/L mg/m3 mg/L PCU07/02/02 1.0 10:00 1.4
LB-2030 -- 10:00 VDOR s 0.5 -- -- 0.041 45* am LB-2031 -- 10:05 DINT -- -- -- 17.4* -- --
North Shore Coastal Watersheds 2002 Water Quality Assessment Report Appendix C C293wqar06.doc DWM CN 138.5

NORTH COASTAL/Pillings Pond, Unique ID: W0985 Station: ADescription: deep hole, southeastern end, LynfieldDate Secchi Secchi Time Station Depth OWMID QAQC Time SmpTyp RelDepth Depth Chloride Chl-a TP AppColor
m 24hr m 24hr -- m mg/L mg/m3 mg/L PCU07/30/02 0.6 10:45 7.3
LB-2171 -- 10:10 VDOR s 0.5 -- -- 0.045 35* a LB-2371 -- 10:40 VDOR nb 6.8 -- -- 0.31 -- LB-2173 -- 10:45 DINT -- 0 - 1.8 -- 63* -- --
09/10/02 1.1 15:40 6.9 LB-2312 -- 16:00 VDOR s 0.5 -- -- 0.034
bf37* f
LB-2313 -- 16:05 MNGR s 0.5 -- -- 0.035 bf
38* f
LB-2314 -- 16:10 VDOR nb ** -- -- 0.53 bf
--
LB-2316 LB-2317
16:15 DINT -- ** - ** -- 24.1* -- --
LB-2317 LB-2316
16:15 DINT -- ** - ** -- 23.3* -- --
NORTH COASTAL/West Pond, Unique ID: W0967 Station: ADescription: deep hole southern end, GloucesterDate Secchi Secchi Time Station Depth OWMI
DQAQC Time SmpTyp RelDepth Depth Chloride Chl-a TP AppColor
m 24hr m 24hr -- m mg/L mg/m3 mg/L PCU07/02/02 2.4 14:45 2.6
LB-2033 -- 14:45 VDOR s 0.5 -- -- 0.009 j
23* am
LB-2034 -- 14:45 DINT -- 0 - 2.1 -- 5.0* -- --07/30/02 0.6 14:30 2.6
LB-2175 -- 14:30 VDOR s 0.5 -- -- 0.017 65* a LB-2176 -- 14:35 VDOR nb 2.1 -- -- 0.019 -- LB-2177 -- 14:40 DINT -- 0 - 1.8 -- 15.7* -- --
09/10/02 1.0 11:00 2.4 LB-2320 -- 10:55 VDOR s 0.5 -- -- 0.014
bfj39* f
LB-2321 -- 11:00 VDOR nb 1.9 -- -- 0.033 bfj
--
LB-2322 -- 11:15 DINT -- 0 - 1.9 -- 25.9* -- --
North Shore Coastal Watersheds 2002 Water Quality Assessment Report Appendix C C393wqar06.doc DWM CN 138.5

Table C2. 2002 MassDEP DWM North Coastal Watershed Baseline Lakes in-situ data.
NORTH COASTAL/Beck Pond, Unique ID: W0968 Station: ADescription: deep hole, HamiltonDate OWMID Time Depth Temp pH Cond@ 25C TDS DO SAT
(24hr) (m) (C) (SU) (uS/cm) (mg/l) (mg/l) (%)08/21/02
LB-2305 14:18 0.4 27.4 7.1 c 175 112 7.1 88 LB-2305 14:26 1.5 26.7 7.1 c 179 u 114 u 7.1 86 LB-2305 14:36 2.8 25.5 6.7 176 113 3.7 u 44 u
NORTH COASTAL/Coy Pond, Unique ID: W0966 Station: ADescription: deep hole, center of pond, WenhamDate OWMID Time Depth Temp pH Cond@25C TDS DO SAT
(24hr) (m) (C) (SU) (uS/cm) (mg/l) (mg/l) (%)08/21/02
LB-2309 12:01 0.5 25.5 u 6.6 397 254 4.0 48 LB-2309 12:09 1.3 24.6 6.5 396 253 2.2 u 26 u
NORTH COASTAL/Pillings Pond, Unique ID: W0985 Station: ADescription: deep hole, southeastern end, LynfieldDate OWMID Time Depth Temp pH Cond@ 25C TDS DO SAT
(24hr) (m) (C) (SU) (uS/cm) (mg/l) (mg/l) (%)09/10/02
LB-2318 15:49 0.5 28.1 8.8 c 534 342 10.3 u 130 uLB-2318 15:54 1.5 24.1 u 8.6 c 531 340 10.7 u 126 uLB-2318 16:03 2.6 21.3 7.7 c 529 339 5.3 u 59 uLB-2318 16:13 3.5 20.5 7.2 c 525 336 0.3 u 3 uLB-2318 16:18 4.5 16.5 u 6.9 c 561 359 <0.2 <2 LB-2318 16:24m 5.5 m 13.6 m 6.7 m 580 m 371 m <0.2 m <2 mLB-2318 16:34 6.4 12.6 u 6.6 600 u 384 u <0.2 <2
NORTH COASTAL/WEST POND, UNIQUE ID: W0967 STATION: ADescription: deep hole, southern end, GloucesterDate OWMID Time Depth Temp pH Cond@ 25C TDS DO SAT
(24hr) (m) (C) (SU) (uS/cm) (mg/l) (mg/l) (%)09/10/02
LB-2323 10:53 0.5 24.2 7.9 c 171 110 8.2 96 LB-2323 11:07 1.5 21.2 7.8 c 170 109 8.2 u 91 uLB-2323 11:19 1.8 20.9 7.4 c 173 110 ## u ## u
North Shore Coastal Watersheds 2002 Water Quality Assessment Report Appendix C C493wqar06.doc DWM CN 138.5

ATTACHMENT 1
The following data qualifiers or symbols are used in the MADEP/DWM Water Quality Database (WQD) database for qualified and censored water quality and multi-probe data. Decisions regarding censoring vs. qualification for specific, problematic data are made based on a thorough review of all pertinent information related to the data. General Symbols (applicable to all types):
“ ## ” = Censored data (i.e., data that has been discarded for some reason). NOTE: Prior to 2001 data, “**” denoted either censored or missing data.
“ ** ” = Missing data (i.e., data that should have been reported). See NOTE above.
“ -- ” = No data (i.e., data not taken/not required)
* = Analysis performed by Laboratory OTHER than DEP’s Wall Experiment Station (WES)
[ ] = A result reported inside brackets has been “censored”, but is shown for informational purposes (e.g., high blank results).
Multi-probe-specific Qualifiers: “ i ” = inaccurate readings from Multi-probe likely; may be due to significant pre-survey calibration problems, post-survey calibration readings outside typical acceptance range for the low ionic check and for the deionized blank water check, lack of calibration of the depth sensor prior to use, or to checks against laboratory analyses. Specifically, for depth readings the following criteria were applied:
General Depth Criteria: Apply to each OWMID# - Clearly erroneous readings due to faulty depth sensor: Censor (i) - Negative and zero depth readings: Censor (i); (likely in error)- 0.1 m depth readings: Qualify (i); (potentially in error)- 0.2 and greater depth readings: Accept without qualification; (likely accurate)
Specific Depth Criteria: Apply to entirety of depth data for survey date
- If zero and/or negative depth readings occur more than once per survey date, censor all negative/zero depth data, and qualify all other depth data for that survey (indicates that erroneous depth readings were not recognized in the field and that corrective action (field calibration of the depth sensor) was not taken, i.e., that all positive readings may be in error.)
“ m ” = method not followed; one or more protocols contained in the DWM Multi-probe SOP not followed, i.e., operator error (e.g., less than 3 readings per station (rivers) or per depth (lakes), or instrument failure not allowing method to be implemented.
“ s ” = field sheet recorded data were used to accept data, not data electronically recorded in the Multi-probe surveyor unit, due to operator error or equipment failure.
North Shore Coastal Watersheds 2002 Water Quality Assessment Report Appendix C C593wqar06.doc DWM CN 138.5

“ u ” = unstable readings, due to lack of sufficient equilibration time prior to final readings, non-representative location, highly-variable water quality conditions, etc. See Section 4.1 for acceptance criteria.
“ c ” = greater than calibration standard used for pre-calibration, or outside the acceptable range about the calibration standard. Typically used for conductivity (>718, 1,413, 2,760, 6,668 or 12,900 uS/cm) or turbidity (>10, 20 or 40 NTU). It can also be used for TDS and Salinity calculations based on qualified (“c”) conductivity data, or that the calculation was not possible due to censored conductivity data ( TDS and Salinity are calculated values and entirely based on conductivity reading). See Section 4.1 for acceptance criteria.
“ r ” = data not representative of actual field conditions.
“ ? ” = Light interference on Turbidity sensor (Multiprobe error message). Data is typically censored.
Sample-Specific Qualifiers:
“ a ” = accuracy as estimated at WES Lab via matrix spikes, PT sample recoveries, internal check standards and lab-fortified blanks did not meet project data quality objectives identified for program or in QAPP.
“ b ” = blank Contamination in lab reagant blanks and/or field blank samples (indicating possible bias high and false positives).
“ d ” = precision of field duplicates (as RPD) did not meet project data quality objectives identified for program or in QAPP. Batched samples may also be affected.
“ e ” = not theoretically possible. Specifically, used for bacteria data where colonies per unit volume for e-coli bacteria > fecal coliform bacteria, for lake Secchi and station depth data where a specific Secchi depth is greater than the reported station depth, and for other incongruous or conflicting results. “ f ” = frequency of quality control duplicates did not meet data quality objectives identified for program or in QAPP.
“ h ” = holding time violation (usually indicating possible bias low)
“ j ” = ‘estimated’ value; used for lab-related issues where certain lab QC criteria are not met and re-testing is not possible (as identified by the WES lab only). Also used to report sample data where the sample concentration is less than the ‘reporting’ limit or RDL and greater than the method detection limit or MDL (mdl< x <rdl). Also used to note where values have been reported at levels less than the mdl.
“ m ” = method SOP not followed, only partially implemented or not implemented at all, due to complications with sample matrix (eg. sediment in sample, floc formation), lab error (eg. cross-contamination between samples), additional steps taken by the lab to deal with matrix complications, lost/unanalyzed samples, and missing data.
North Shore Coastal Watersheds 2002 Water Quality Assessment Report Appendix C C693wqar06.doc DWM CN 138.5
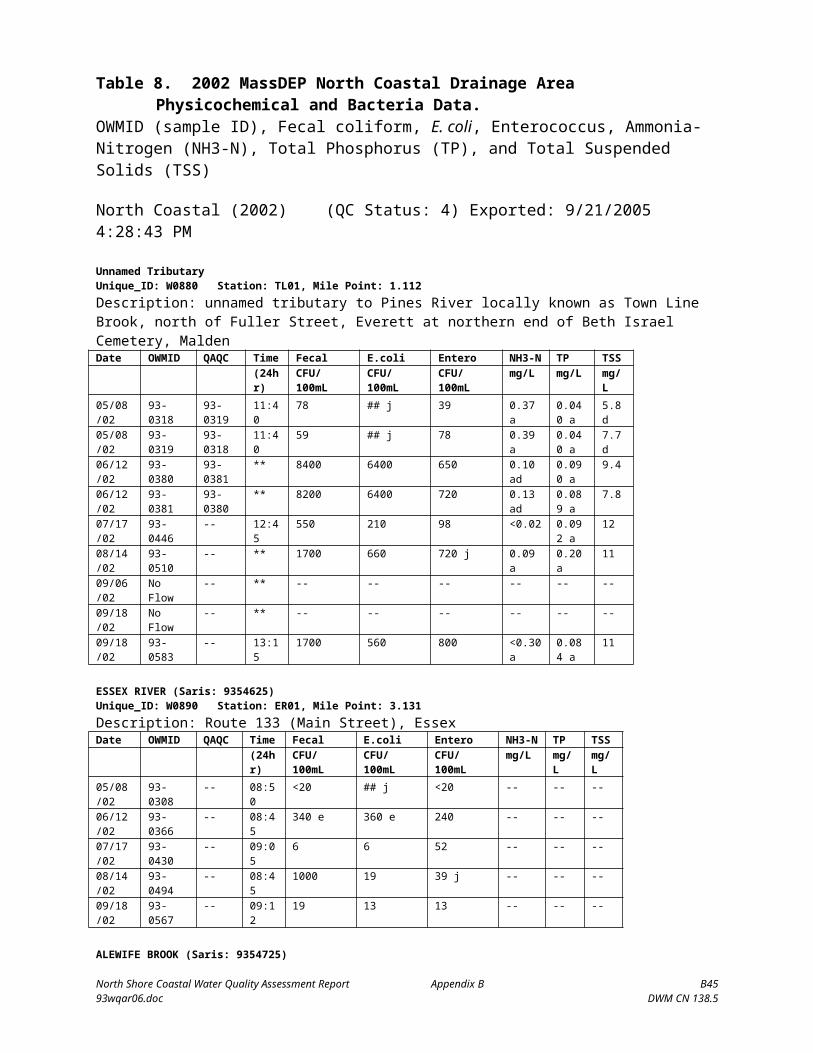
“ p ” = samples not preserved per SOP or analytical method requirements.
“ r ” = samples collected may not be representative of actual field conditions, including the possibility of “outlier” data and flow-limited conditions (e.g., pooled).
Sample codes for sampling:
OWMID: Office of Watershed Management Identification Code for the bottle.
QAQC: the OWMID codes (e.g. LB-1903) refer to the field duplicate sample (usually immediately above or below in the table) to be compared with the current sample.
Time: Local time.
SymTyp: Sample Type- VDOR= Van Dorn; DINT= Depth integrated by vertical hose; MNGR= Manual Grab; NR= not recorded.
RelDepth: Relative Depth- s= Near Surface; m= middle depth; nb= near bottom.
North Shore Coastal Watersheds 2002 Water Quality Assessment Report Appendix C C793wqar06.doc DWM CN 138.5

References
Mattson, M. in preparation. Baseline Lake 2002 Technical Memo Massachusetts Department of Environmental Protection, Division of Watershed Management, Worcester, MA.
MassDEP. 1995. January Draft Laboratory Quality Assurance Plan and Standard Operating Procedures Massachusetts Department of Environmental Protection, Division of Environmental Analysis, Wall Experiment Station, Lawrence, MA.
MassDEP. 2001a. Sample Collection Techniques for DWM Surface Water Quality Monitoring CN001.1. Massachusetts Department of Environmental Protection, Division of Watershed Management, Worcester, MA.
MassDEP. 2001b. Hydrolab® Series 3/Series 4 Multiprobe Standard Operating Procedure CN004.1. Massachusetts Department of Environmental Protection, Division of Watershed Management, Worcester, MA.
MassDEP. 2001c. Standard Operating Procedures for Apparent Color CN2.1 Massachusetts Department of Environmental Protection, Division of Watershed Management, Worcester, MA
MassDEP. 2001d. Standard Operating Procedures for Chlorophyll a CN3.2 Massachusetts Department of Environmental Protection, Division of Watershed Management, Worcester, MA
MassDEP. 2002. Quality Assurance Project Plan for TMDL Baseline Lake Survey 2002. CN72.0. Massachusetts Department of Environmental Protection, Division of Watershed Management, Worcester, MA.
MassDEP 2005. Data Validation Report for Year 2002 Project Data. CN202.0. Massachusetts Department of Environmental Protection, Division of Watershed Management, Worcester, MA
North Shore Coastal Watersheds 2002 Water Quality Assessment Report Appendix C C893wqar06.doc DWM CN 138.5
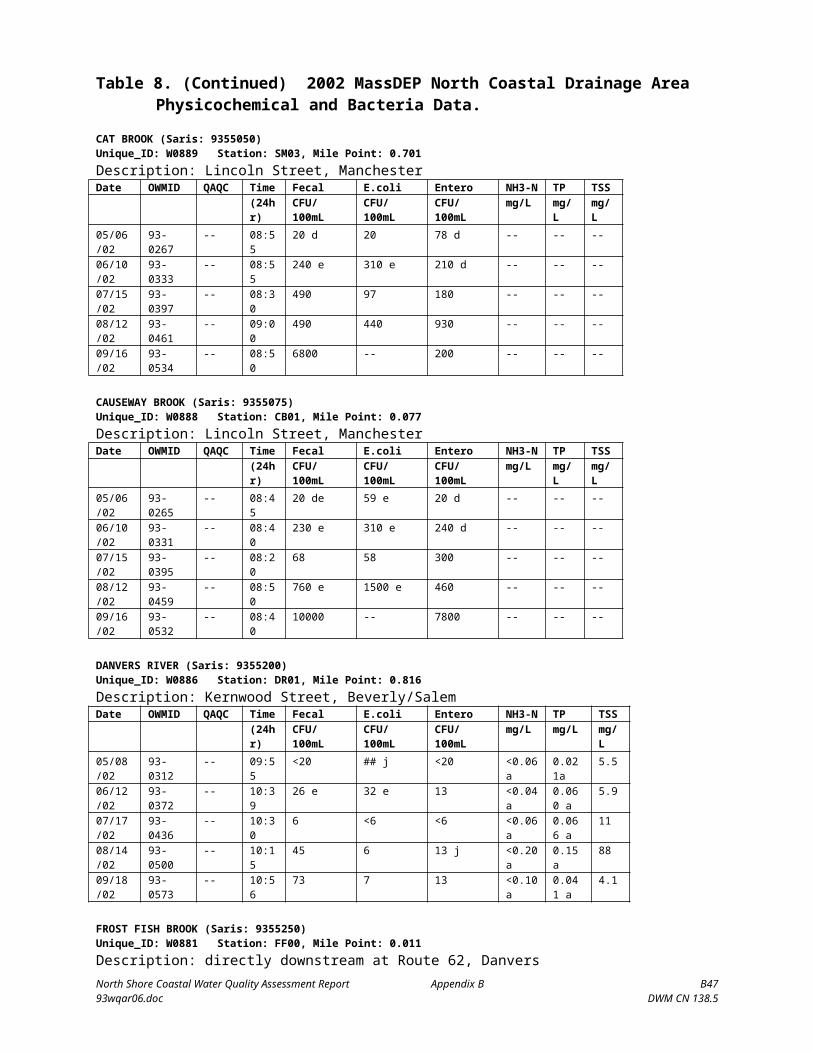
APPENDIX DMassDEP DWM 2002 Fish Toxics Monitoring in the North Shore Coastal Watersheds
INTRODUCTIONFish contaminant monitoring is a cooperative effort between three Massachusetts Department of Environmental Protection (MassDEP) Divisions/Offices (Watershed Management (DWM), Environmental Analysis, and Research and Standards), the Massachusetts Department of Fish and Game, and the Massachusetts Department of Public Health (MA DPH). Fish contaminant monitoring is designed to screen the edible fillets of several species of fish desired by the angling public for consumption, as well as species representing different feeding guilds (i.e., bottom dwelling omnivores, top-level predators, etc.) for the presence of heavy metals (Pb, Cd, Se, Hg, As), Polychlorinated biphenyls (PCBs), and organochlorine pesticides. These data are used by the MA DPH in assessing human health risks associated with the consumption of freshwater fishes. In the North Shore Coastal Watersheds fish contaminant monitoring surveys have been conducted by DEP DWM staff in several waterbodies including Reedy Meadow (along the Saugus River), Flax Pond, and Foster Pond (Maietta undated). Fish contaminant monitoring data provided here include surveys conducted in 2002. The objective of these surveys was to screen the edible fillets of fishes for potential contaminants (e.g., selected metals, PCBs and organochlorine pesticides). All results were submitted to the MA DPH for review.
Project ObjectivesFish contaminant monitoring is typically conducted to assess the levels of toxic contaminants in freshwater fish, identify waterbodies where those levels may impact human health, and identify waters where toxic chemicals may impact fish and other aquatic life. Nonetheless, human health concerns have received higher priority and, therefore, fish tissue analysis has been restricted to edible fillets. The fish toxics monitoring was designed to screen the edible fillets of several species of fish representing different feeding groups (i.e., bottom dwelling omnivores, top-level predators, etc.) for the presence of heavy metals, PCBs and chlorinated pesticides.
Fish toxics monitoring conducted in 2002 followed guidance in the Quality Assurance Project Plan for Fish Toxics Monitoring (MassDEP 2003). Data quality objectives are presented in the above-mentioned QAPP.
METHODSField MethodsUniform protocols, designed to assure accuracy and prevent cross-contamination of samples, were followed for collecting, processing and shipping fish (MassDEP 2003 and MassDEP 2005). The characteristics of each site determine the method(s) of sample collection. Waterbodies in the North Shore Coastal Watersheds were sampled by DWM using boat electrofishing, gill nets, trot lines, and/or rods and reels. Electrofishing was performed by maneuvering the boat through the littoral zone and shallow water habitat of a given waterbody, and collecting most fish shocked. Fish collected by electrofishing were stored in a live well filled with site water until the completion of sampling. Fish to be included in the sample were stored on ice and transported to the DWM laboratory in Worcester. Rod and reel fishing was performed by casting lures into fish holding cover and retrieving lures, and at times fish. Gill nets were set in various locations and either checked every two hours or on occasion left
North Shore Coastal Water Quality Assessment Report Appendix D D193wqar06.doc DWM CN 138.5

overnight. Gill nets set overnight were retrieved the following morning. Trotlines were baited with nightcrawlers or shiners, set, and left overnight. After removal from the gill nets, trotlines, or lure, fish to be included in the sample were stored on ice and transported to the DWM laboratory in Worcester. In all cases, live fish, which were not included as part of the sample, were released.
DWM Laboratory Methods (Sample processing)Fish brought to the MassDEP DWM laboratory in Worcester were processed using protocols designed to assure accuracy and prevent cross-contamination of samples (MassDEP 2003 and MassDEP 2005). Specimen lengths and weights were recorded along with notes on tumors, lesions, or other anomalies noticed during an external visual inspection. Scales, spines, or pectoral fin ray samples were obtained for use in age determination. Species, length, and weight data can be found in Tables D1. Fish were filleted (skin off) on glass cutting boards and prepared for freezing. All equipment used in the filleting process was rinsed in tap water and then rinsed twice in de-ionized water before and or after each sample. Samples (individual or composite) targeted for % lipids, PCBs and organochlorine pesticide analysis were wrapped in aluminum foil. Samples targeted for metals analysis were placed in VWR high density polyethylene (HDPE) cups with covers. Composite samples were composed of three fillets from like-sized individuals of the same species (occasionally the same genus). Samples were tagged and frozen for subsequent delivery to the Department’s Wall Experiment Station (WES).
WES Laboratory Methods (Analytical)All analyses for cadmium, lead and selenium were conducted using EPA method 200.7. All analyses for PCBs and organics were conducted using AOAC method 983.21. All mercury analyses prior to 2005 were conducted using EPA method 245.1. Additional information on analytical techniques used at WES is available from the laboratory (Maietta et al. 2004).
In 2002 mercury was analyzed by a cold vapor method using a Perkin Elmer, FIMS (Flow Injection Mercury System), which uses Flow Injection Atomic Absorption Spectroscopy. Cadmium and lead were analyzed using a Perkin Elmer, Optima 3000 XL ICP - Optical Emmission Spectrophotometer. Arsenic and selenium were analyzed using a Perkin Elmer, Zeeman 5100 PC, Platform Graphite Furnace, Atomic Absorption Spectrophotometer. PCB Arochlor, PCB congener, and organochlorine pesticide analysis was performed on a gas chromatograph equipped with an electron capture detector “according to the modified AOAC 983.21 procedure for the analysis of PCB Arochlors, Congeners, and Organochlorine Pesticides” (Maietta et al. 2004).
RESULTSAll fish tissue data met DWM data quality objectives and passed QC acceptance limits of the WES laboratory without qualification unless otherwise noted below. Fish toxics monitoring survey data can be found in Table D1 (excerpted from Maietta et al. 2004).
Fish tissue data passed the QC acceptance limits of the WES laboratory. WES reported a number of lab-validated data with “qualification”. All but one of these “qualified” data points were for very low concentrations of either PCBs (Congeners and Arochlors) and/or organochlorine pesticides. One data point for arsenic at the detection limit was also qualified. The lab fortified matrix spike recovery for toxaphene was 50% resulting in “J” (estimated) qualification by WES. These QC data suggest potential poor recovery of toxaphene in samples. Lab accuracy estimates for metals (all analytes) using lab-fortified matrix samples were acceptable ranging from 80-112 % recovery except for two selenium samples at 126 and 128 % recovery and one lead sample at 130% recovery. QC
North Shore Coastal Water Quality Assessment Report Appendix D D293wqar06.doc DWM CN 138.5

sample recoveries were acceptable ranging from 83-117%. Lab accuracy estimates for metals (all analytes) using lab fortified blanks were acceptable ranging from 82 to 111 % recovery except for one lead sample at 128% recovery.
All quality assurance and quality control data are available from the laboratory upon request.
North Shore Coastal Water Quality Assessment Report Appendix D D393wqar06.doc DWM CN 138.5

Table D1. 2002 Fish Toxics Monitoring data for North Shore Coastal Waterbodies (Flax Pond, Lynn, Foster Pond, Swampscott, and Reedy Meadow, Wakefield/Lynnfield (Maietta et al. 2004). Results, reported in wet weight, are from composite samples of fish fillets with skin off.
SampleID
CollectionDate
SpeciesCode1
Length(cm)
Weight(g)
Sample ID(laboratory sample #)
Cd(mg/kg)
Pb(mg/kg)
Hg(mg/kg)
As(mg/kg)
Se(mg/kg)
% Lipids(%)
PCB Arochlors and Congeners
(g/g)
Pesticides(g/g)
Flax Pond, Lynn`2002007
(L2002159-1)(L2002160-1)
<0.04 <0.20 0.15 <0.060 0.21 0.07 ND DDE-0.012JFPF02-1 5/22/02 LMB 38.6 700FPF02-2 5/22/02 LMB 35.1 570FPF02-3 5/22/02 LMB 36.1 640FPF02-4 5/22/02 WP 24.2 200
2002008(L2002159-2)(L2002160-2)
<0.04 <0.20 0.10 <0.060 0.55 0.63 NDChlor2-0.091 JDDD-0.0092JDDE-0.031
FPF02-5 5/22/02 WP 23.1 170
FPF02-6 5/22/02 WP 24.0 180FPF02-7 5/22/02 YP 20.5 80
2002009(L2002159-3)(L2002160-3)
<0.04 <0.20 0.05 <0.060 0.43 0.15 ND DDE-0.0058 JFPF02-8 5/22/02 YP 21.8 100
FPF02-9 5/22/02 YP 20.3 90FPF02-10 5/22/02 AE 67.1 560
2002010(L2002159-4)(L2002160-4)
<0.04 <0.20 0.15 <0.060 0.22 13
A1254-0.097A1260-0.18
BZ#118-0.014BZ#114-0.025BZ#105-0.0080BZ#156-0.0053BZ#157-0.0015JBZ#180-0.041BZ#170-0.0060
Chlordane-0.83DDD-0.11DDE-0.33DDT-0.023
FPF02-11 5/22/02 AE 62.0 440
FPF02-12
5/22/02 AE 57.2 360
Foster Pond Swampscott2002052
(L2002453-1)(L2002455-1)
<0.040 <0.20 0.12 <RDL(0.080) 0.24 0.10 ND DDE-0.0061J
FOPF02-01 10/1/02 YP 23.3 160FOPF02-02 10/1/02 YP 23.2 150FOPF02-03 10/1/02 YP 22.3 140
FOPF02-04 10/2/02 AE 69.3 690
2002053(L2002453-2)(L2002455-2)
<0.040 <0.20 0.10 <0.060 0.25 16
A1260-0.098BZ#118-0.0087BZ#114-0.0087BZ#105-0.0030JBZ#156-0.0031JBZ#157-0.0012JBZ#180-0.018BZ#170-0.0064
DDD-0.053DDE-0.21DDT-0.020
FOPF02-05 10/2/02 AE 64.9 660
FOPF02-06 10/2/02 AE 67.5 680
North Shore Coastal Water Quality Assessment Report Appendix D D493wqar06.doc DWM CN 138.5
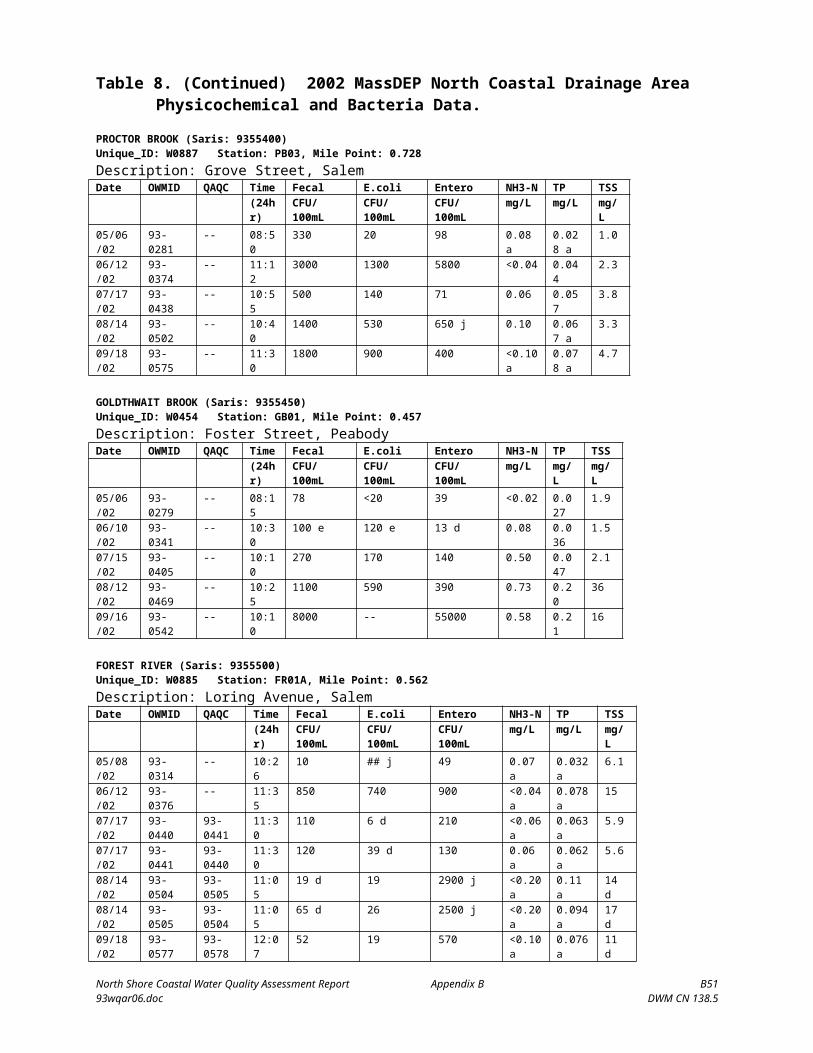
Table D1 (continued). 2002 Fish Toxics Monitoring data for North Shore Coastal Waterbodies (Flax Pond, Lynn, Foster Pond, Swampscott, and Reedy Meadow, Wakefield/Lynnfield (Maietta et al. 2004). Results, reported in wet weight, are from composite samples of fish fillets with skin off.
Reedy Meadow, Wakefield/Lynnfield2002001
(L2002157-1)(L2002158-1)
<0.04 <0.20 0.35 0.06 J 0.32 0.06 ND NDRMF02-1 4/24/02 YP 21.2 140RMF02-2 4/24/02 YP 22.0 140RMF02-3 4/24/02 YP 22.7 110RMF02-4 4/25/02 BB 22.4 160 2002002
(L2002157-2)(L2002158-2)
<0.04 <0.20 0.30 <0.040 0.20 0.16 ND NDRMF02-5 4/25/02 BB 25.5 230
RMF02-6 4/25/02 BB 27.9 290
1 Species Code , Common Name, Scientific name(AE) American eel Anguilla rostrata(BB) brown bullhead Ameiurus nebulosus(LMB) largemouth bass Micropterus salmoides(WP) white perch Morone americana(YP) yellow perch Perca flavescens2 - ChlordaneND - not detected or the analytical result is at or below the established method detection limit (MDL). J-estimated value, concentration <RDL or certain QC criteria not metRDL = reporting detection limit< = result not detected above method detection limit, unless otherwise noted
North Shore Coastal Water Quality Assessment Report Appendix D D593wqar06.doc DWM CN 138.5

REFERENCES
MassDEP. 2003. CN096.0. Quality Assurance Project Plan for Fish Toxics Monitoring. Massachusetts Department of Environmental Protection, Division of Watershed Management. Worcester, MA.
MassDEP. 2005. CN040.1. Standard Operating Procedure for Fish Toxics Monitoring Fish Collection and Preparation. Massachusetts Department of Environmental Protection, Division of Watershed Management. Worcester, MA.
Maietta, R. J. undated. 1983-2004 Fish Toxics Monitoring Survey List. CN219.0. Massachusetts Department of Environmental Protection, Division of Watershed Management. Worcester, MA. (TM-S-18).
Maietta, R. J., J. Ryder, and R.F. Chase. 2004. CN099.0. 2002 Fish Toxics Monitoring Public Request and Year 2 Watershed Surveys. Massachusetts Department of Environmental Protection, Division of Watershed Management. Worcester, MA.
North Shore Coastal Water Quality Assessment Report Appendix D D693wqar06.doc DWM CN 138.5
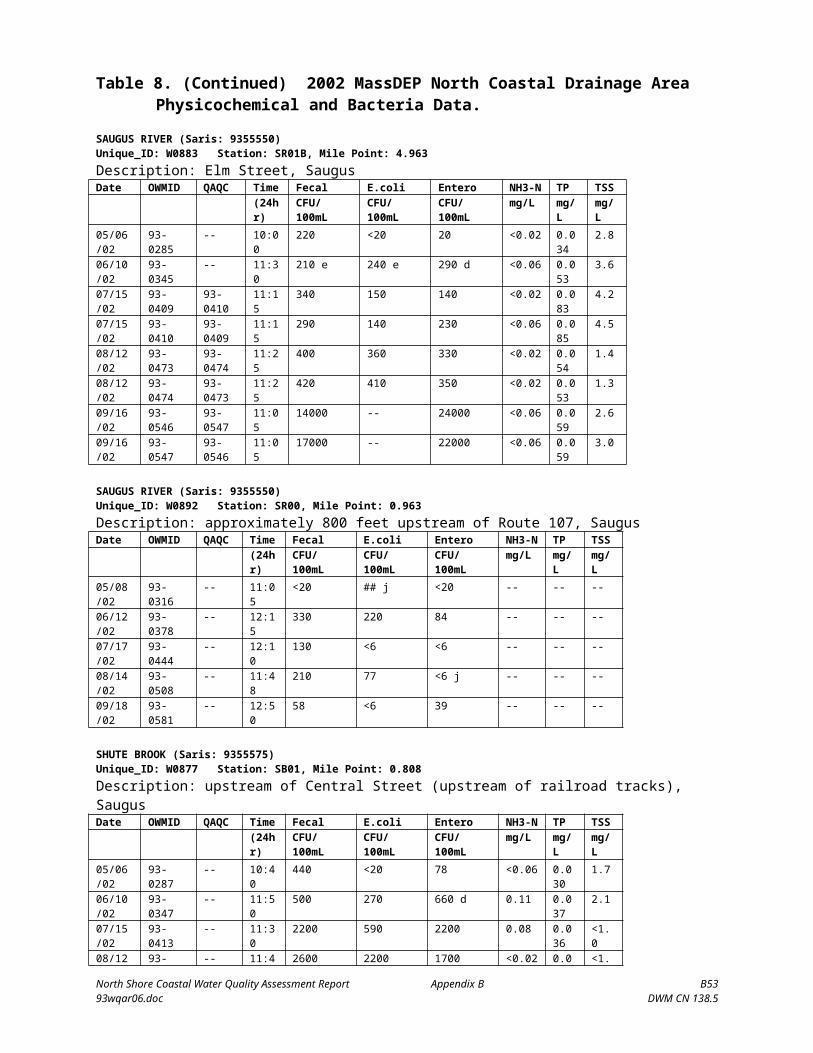
APPENDIX ENORTH SHORE COASTAL WATERSHEDS WMA AND NPDES PERMITS
North Shore Coastal Watersheds 2002 Water Quality Assessment Report Appendix E E193wqar06.doc DWM CN 138.5
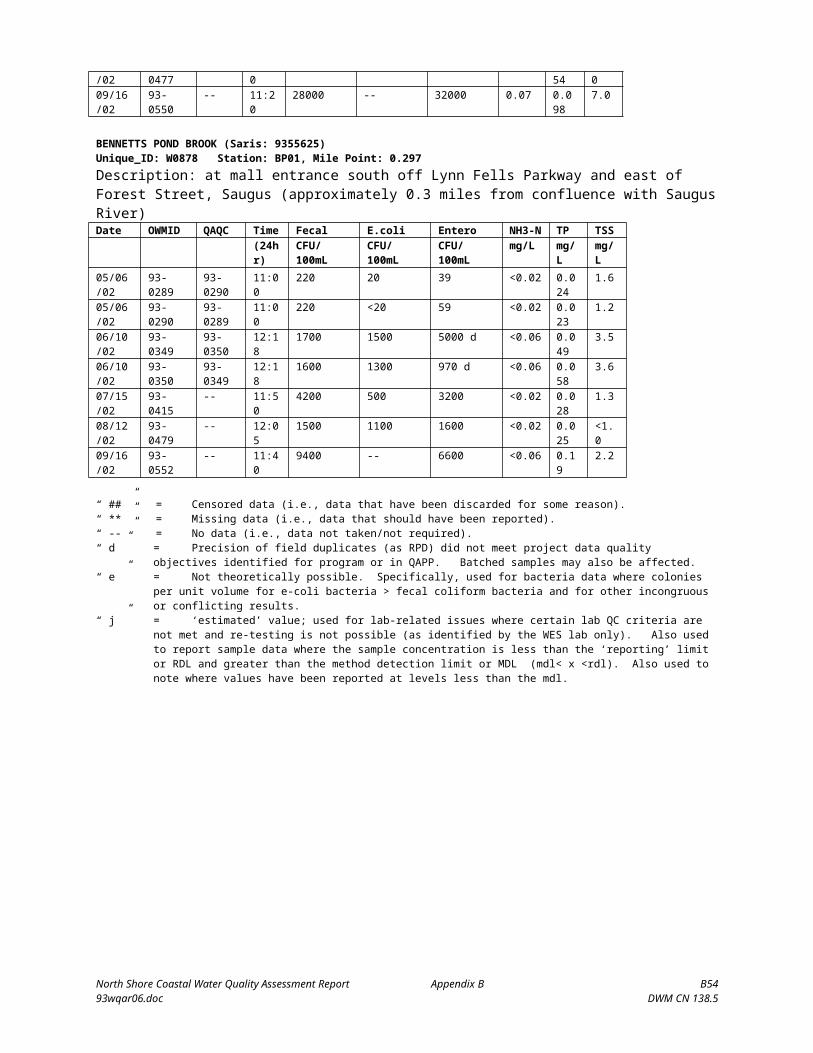
Table E1. Water Management Act (WMA) Registration/Permittees North Shore Coastal Watersheds.
Permit Registration# Water Supply System NameRegistered
Volume (MGD)
Registered withdrawal
(days)20 Year Permitted
Volume (MGD)Permit #
days Segment
9P231318107 Bass Rocks Golf Club 0.08 210 very near ocean not near any segment31803001 Beverly Commerce Park, Inc. 0.4 365 Not Applicable MA93-07
9P31822902 31822902 Eastman Gelatine Corporation 2.74 365 0.6 365 MA93-0531816602 Essex Country Club 0.1 196 Not Applicable MA93-2931809201 Essex DPW-Water Division 0.22 365 Not Applicable MA93-45,
9P31810701 31810701 Gloucester Department Public Works 3.38 365 0.37 365MA93001, MA93022, MA93031, MA93093, MA93085, MA93-27
9P231825801 31825801 Kernwood Country Club 0.1 180 0 180 MA93-09
9P31816302 31816302 Lynn Water & Sewer Commission1,2 8.93 365 0.33 365MA93-34, MA94-32, MA93004, MA93006, MA93032, MA93084
31816401 Lynnfield Center Water District 0.32 365 Not Applicable MA93-30
9P31816601 31816601 Manchester Water Department 0.72 365 0 365MA93028, MA93063, MA93-29, MA93-47
31822903 Peabody Dept. of Public Services 1.89 365 Not ApplicableMA93073, MA93074 (in the MA93-05 subwatershed area)
9P231825201 31825201 Rockport Water Department3 0.72 365 0 365 MA93011, MA9305331822901 Salem Country Club 0.1 150 Not Applicable MA93-3931825802 Salem Suede, Inc. 0.18 234 Not Applicable MA93-4031825901 Salisbury Water Supply Company 0.81 365 Not Applicable no segments defined in this area
9P31816402 Sheraton Colonial Golf Club 0.2 153 MA93-3431816801 Tedesco Country Club 0.1 180 Not Applicable MA93-1031830501 Wakefield Water Department 0.48 365 Not Applicable MA93018
1. The Lynn Water & Sewer Commission is also registered to withdraw 5.31 MGD from December through May from the Ipswich River. Their original permit authorized that an additional 1.28 MGD could be withdrawn, however MassDEP issued them a modified permit, which held the additional volume to 0.33 MGD. LWSC appealed that permit modification. 2. A Comprehensive Surface Water Supply Protection Plan for the City of Lynn's Breeds, Hawkes, Birch, and Walden Ponds Reservoirs, and Ipswich River and Saugus River sources was developed through the Source Water Protection Project by the City of Lynn (Grant Project 01-03 SWT).3. A Wellhead Protection Plan was developed for the Mill Brook Watershed, Rockport MA (Project # 02-06 WHP) by Community Investment Associates, Cape Ann Mapping and The BioEngineering Group, Inc. (June 2004).
North Shore Coastal Watersheds 2002 Water Quality Assessment Report Appendix E E293wqar06.doc DWM CN 138.5

Table E2. National Pollutant Discharge Elimination System (NPDES) Permittees in the North Shore Coastal Watersheds.
PERMITTEEBardon Trimount, Inc. –
Swampscott
NPDES#MA0001830
SEGMENTMA93026
The NPDES permit issued to Bardon Trimount, Inc. in April 2000 authorized the discharge of groundwater and stormwater used for operating a stone quarry for producing gravel and crushed stone via outfall 001 to Foster’s Pond. [Note: Lynn Sand & Stone held the permit issued in 1974.] Permitted limits include pH (6.5 to 8.3 SU), TSS (25 mg/L average monthly), and turbidity (8 NTU). Flow, settleable solids, and total ammonia are report only. The permit also required the development of a Best Management Practices Plan (BMP) to minimize potential for violations of permit, protect the designated water uses of the surrounding water body, and to mitigate pollution from site runoff, improper use of waste disposal system, and accidental spills, etc.
PERMITTEEBayoil Company, Inc. –
Peabody
NPDES#MA0026794
SEGMENTMA93-09
MA0026794 was issued to Bayoil Company, Inc in September 1978. The permit authorized to discharge 0.013 MGD maximum daily of non-contact cooling water via outfall #001 to the Danvers River (by drain). Permitted limits are pH (6.5 to 8.5 SU), and temperature (83ºF maximum daily). EPA list indicated permit inactivated in March 1986.
PERMITTEECrane River West
Condominiums – Danvers
NPDES#MA0030091
SEGMENTMA93-41
The NPDES permit MA0030091 issued to Crane River West Condominiums in Danvers (incorrectly identified as MA0036311 in the North Coastal 1997/1998 Water Quality Assessment Report) for stormwater, was terminated by EPA in April 1999.
PERMITTEECape Ann Lighthouse –
Rockport
NPDES#MA0090654
SEGMENTNot Applicable (Atlantic Ocean)
MA0090654was issued for the Cape Ann Lighthouse on Thatchers Island in July 1982. The permit authorized the discharge of 0.0012 MGD of treated sanitary wastewater. EPA list dated August 2005 indicated the permit was terminated in April 1999 because the discharge was terminated.
PERMITTEECPI, Inc. Beverly
Microwave Division – Beverly
NPDES#MAG250520
SEGMENTMA93-07
CPI, Inc. Beverly Microwave Division – Beverly is authorized (permit issued September 2000) to discharge 0.033 MGD average monthly (0.042 MGD maximum daily) non-contact cooling water through two outfalls to a stormdrain that discharges to an unnamed tributary to the Bass River. [Note: permit formerly issued to Varian Associates, Inc.] Toxicity testing using Ceriodaphnia dubia was required because of low available dilution. Source of water is municipal.
PERMITTEEDominion Energy Salem
Harbor, LLC
NPDES#MA0005096
SEGMENTMA93-21
Dominion Energy Salem Harbor, LLC (Transferred November 2004 from USGenNE). [Original
North Shore Coastal Watersheds 2002 Water Quality Assessment Report Appendix E E393wqar06.doc DWM CN 138.5

permit was issued to Salem Harbor Station in September 1994, and then the permit was transferred to US Gen NE, Inc., in September 1998.] The facility is a 775 MW oil and coal fired stream electric power generation facility. The permit authorizes the following outfalls: - Outfall 001: 668.9 MGD of condenser cooling water, boiler blowdown, reboiler and evaporator blowdown, freshwater storage tank overflow, service water, boiler blowdown tanks, and stormwater runoff from the yard. Chlorine or hydantoin is authorized for biocide. In addition, Clamtrol is used for 18 hours three times per unit per year to control the growth of mussels. A detoxifier is used to ensure that Clamtrol is not detectable in the effluent. Total Residual Oxidants should not exceed 0.1 mg/L (Simultaneous multi-unit application of biocide was permitted). The permit also stated that “at no time can the outfall exceed an absolute temperature of 93F” and further stated that “at no time can temperature of this outfall exceed a 28F rise over intake temperature”. The permit also required that “a temperature differential between the point of discharge and the intake structure shall not change more than 12F during any one-hour period from 1 April to 31 October nor shall the differential change more than 9F between 1 November and 31 March during any one-hour period”. - Outfall 006: 1.5 MGD average monthly/2.6 MGD maximum daily discharge of wastewater treatment service-ash settling point, Unit 4 seal water, floor drains, equipment drains, demineralizer/regenerator wastes, equipment wash water systems, bottom ash recycle system blowdown, stormwater from yard drains and coal pile runoff. - Outfalls 005 and 007: intake screen wash water. - Outfall 014: 19.2 MGD maximum daily discharge of condenser cooling water plus intermittent heat recycle cooling water up to a temperature of 115F within the four-hour period used to control biological fouling of the condenser systems. Outfall 015: emergency spillway overflow for coal pile runoff.
No violations of temperature limits between January 2000 and August 2006 have been reported.
PERMITTEEEastern Tool and Stamping
Company
NPDES#MA0004634
SEGMENTMA93-44
The Eastern Tool and Stamping Company was authorized (MA0004634 issued July 1978) to discharge non-contact cooling water via two outfalls to the Saugus River. The company sent a letter to EPA in November 2005 that they have gone out of business and therefore the permit has been terminated.
PERMITTEEEasterly Inn
NPDES#MA0025500
NOT APPLICABLE
A NPDES permit was issued to Easterly Inn in September 1975. This permit is listed as becoming inactive on 5/5/99 due to tie in to Gloucester WPCF (EPA Inactive list Aug 2004).
PERMITTEEEssex Housing Authority
NPDES#MA0029564
SEGMENTMA93-46
The Essex Housing Authority (EHA) was authorized (permit issued December 1999) to discharge an average monthly flow of 0.015 MGD of treated wastewater to Alewife Brook (a tributary to the Essex River). The EHA whole effluent toxicity testing (LC50>100%, CNOEC=100% effluent limits) using Menidia beryllina as well as Arbacia punctulata for the chronic testing was required four times per year. Other permitted parameters include Total Ammonia, TRC, BOD5, TSS, and Fecal Coliform. The ammonia-nitrogen concentrations reported for the effluent in the facility’s toxicity testing reports conducted between October 1999 and October 2005 (excluding reports for tests done in 2000 and 2001 which were not available for review) ranged from <0.1 to 15 mg/L (n=16). The total residual chlorine concentrations in those same reports were reported to range from <0.05 to 1.12 mg/L (n=16) with 12 of the 16 measurements >0.05 mg/L.
North Shore Coastal Watersheds 2002 Water Quality Assessment Report Appendix E E493wqar06.doc DWM CN 138.5
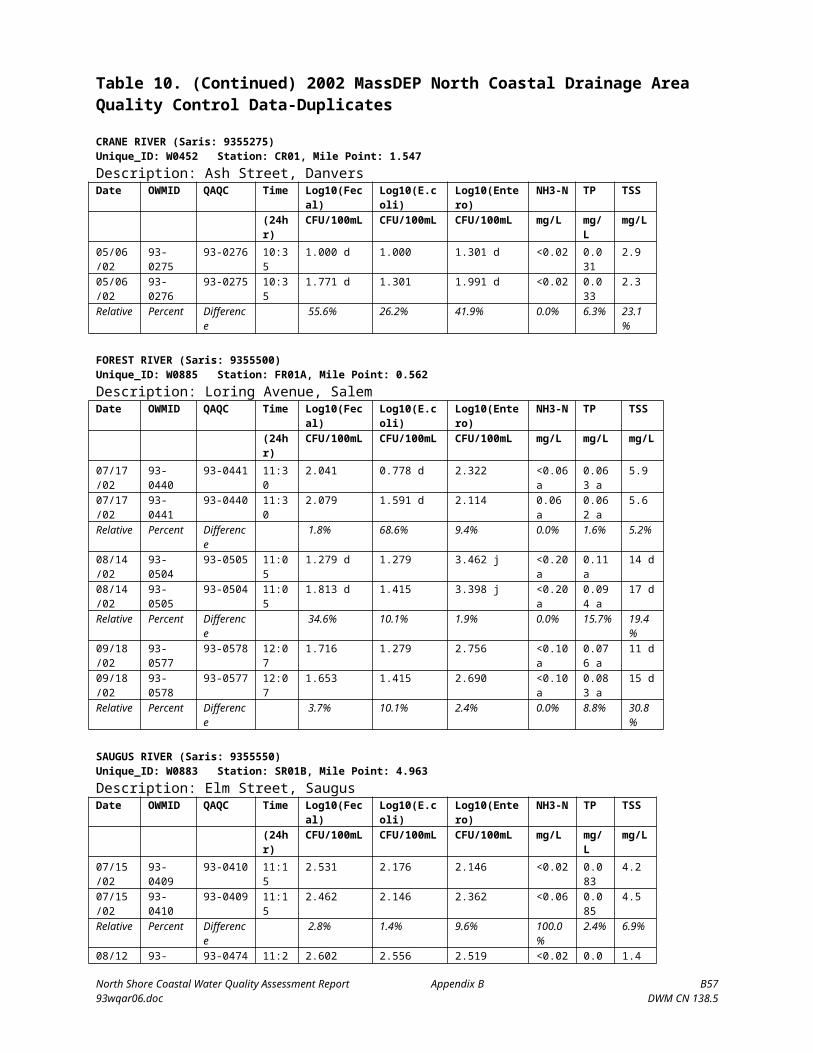
The facility began operation/discharging in November 1969 although the first permit wasn’t issued until March 1987. The wastewater was connected to the Essex sewer system in December 2005 and therefore the permit needs to be terminated.
PERMITTEEEastman Gelatine
Corporation
NPDES#MA0003956
SEGMENTMA93-05
MA0003956 Eastman Gelatine Corporation is authorized (permit issued July 1989) to discharge non-contact cooling water (0.5 MGD average monthly flow) and storm water runoff from outfall 001 and storm water runoff from 18 other outfalls into Goldthwait Brook. The facility is engaged in the manufacturing of photographic gelatin and for barometric condenser cooling and electric generators. The wastewater generated from the gelatin process is discharged to the Peabody sewer system, which in turn is part of the South Essex Sewage District.
Acute toxicity testing must be conducted using Ceriodaphnia dubia on grab samples collected from Goldthwaite Brook upstream and downstream of the Eastman Gelatine Corp. discharges. These acute tests shall be performed seasonally and at least one test in the summer each year must be representative of wet weather while one test each year must be representative of dry weather conditions. Two acute whole effluent toxicity tests of outfall #001 must also be conducted each year (one wet and one dry). These toxicity testing requirements are monitor only (no permit limits).
Note: A new permit for this facility was signed on 27 September 2006, which will become effective on 1 December 2006.
PERMITTEEFederal Express
NPDES#MA0033723
SEGMENTMA93-39
This permit is listed as becoming inactive as of 04/30/1999 because the discharge is now covered under the multisector general stormwater permit (EPA Inactive list Aug 2005).
North Shore Coastal Watersheds 2002 Water Quality Assessment Report Appendix E E593wqar06.doc DWM CN 138.5

PERMITTEEGeneral Electric Company –
Lynn
NPDES#MA0003905
SEGMENTMA93-44
General Electric Company – Lynn (GE Lynn) is authorized (MA0003905 issued September 1993) to discharge from permitted discharge outfalls along the northern bank of the Saugus River from Route 107 (Western Avenue) and Route 1A (General Edwards Bridge) in Lynn. On July 5, 2000, operation of the Consolidated Drains Treatment System was initiated at this facility. As a result, dry weather flows from eight permitted outfalls (001, 007, 010, 019, 027, 028, 030, 031 and 032) were combined so that they may be collected in concrete equalization tanks prior to discharge of treated effluent through Outfall 027. Current discharges at this plant are summarized as follows:
003: average flow of 0.55 MGD up to 95F and daily maximum 1.4 MGD of 105F of non-contact cooling water (water supplied by city).005: average flow of 0.55 MGD up to 95F and daily maximum 1.4 MGD of 105F of non-contact cooling water (water supplied by city).
014: average flow (discharge is intermittent) of 27 MGD up to 90F and daily maximum 45 MGD of 95F of non-contact cooling water (salt water). As of April 2001, anti-foam chemical addition was initiated at this outfall to reduce levels of foam produced by the natural salinity of the Saugus River.
018: average flow of 35.6 MGD up to 90F and daily maximum 35.6 MGD of 95F of non-contact cooling water. (salt water) from power generation equipment, boiler blowdown and steam condensate. As of April 2001, anti-foam chemical addition was initiated at this outfall to reduce levels of foam produced by the natural salinity of the Saugus River.
020: In June 2000, the facility discontinued dry and wet weather discharge to outfall 020 with the exception of discharges of unused river water. With approval of the EPA, GE is to report “no discharge” on the monthly and quarterly discharge monitoring reports for this outfall.
027: average flow of 0.3 MGD up to 85F and daily maximum 0.83 MGD of 90F of stormwater runoff from roof and yard drains, steam condensate, oil coolers, and floor drainage. As a result of the Consolidated Drains Treatment System, flow limits for dry weather discharges through outfall 027 have been increased to an average monthly dry weather flow of 0.5 MGD and a maximum daily dry weather flow of 1.0 MGD.029: average flow of 28.8 MGD up to 90F and daily maximum 54.7 MGD of 95F of non-contact cooling water from steam
turbine test equipment and heat exchangers (salt water) most likely intermittent.
Additionally the GE Lynn NPDES permit states “the thermal plumes from the station shall: (a) not block zones of fish passage, (b) not interfere with spawning of indigenous populations, (c) not change the balanced indigenous population of the receiving water, and (d) have minimum contact with surrounding shorelines”.
GE Lynn was required to develop a multi-year biomonitoring program, developed in conjunction with DMF, DEP, CZM and EPA, that at a minimum was to determine the following characteristics of intake water from the Saugus River:
occurrence and abundance of species impinged and entrained, mortality of species impinged and entrained and Determine resulting losses to local spawning stocks.
If the data revealed negative impacts to the Saugus River marine resources by the cooling water intake system, structural or operational modification to the intake system would be required. Incidences of fish mortality associated with the plumes or unusual numbers of fish impinged on the intake traveling screens were to be reported to the regulatory agencies.
The GE Lynn permit also required a storm water pollution prevention plan.
No violations of temperature limits between January 2000 and August 2006 have been reported.
PERMITTEEGLEN-MOR Fuel Oil Co.
NPDES#MA0036897
SEGMENTMA93-15
This permit is listed as becoming inactive as of 10/28/1999 because the remediation was completed (EPA Inactive list Aug 2005).
North Shore Coastal Watersheds 2002 Water Quality Assessment Report Appendix E E693wqar06.doc DWM CN 138.5

PERMITTEECity of Gloucester
NPDES#MA0100625
SEGMENTGloucester Harbor (MA93-18) and
Atlantic OceanThe City of Gloucester is authorized (MA0100625 issued August 2001) to discharge from the Gloucester Water Pollution Control Facility (WPCF) a flow of 5.15 MGD (annual average calculated monthly) of treated effluent from outfall# 001 to Massachusetts Bay. This WPCF has been designed to accomplish only primary treatment. The unit process flow diagram incorporates an aerated grit chamber followed by a comminutor for preliminary treatment. Primary clarification follows with chemical addition. Polymer and ferric chloride are added to the wastewater prior to it entering the primary clarifiers to enhance BOD and TSS removals. A Parshall flume, used for flow measurement, directs flow to the chlorine contact basins where sodium hypochlorite is added to disinfect the wastewater. Dechlorination, part of an upgrade, was made operational in February 2006 using sodium bisulfite. During low tide, the effluent leaves the facility by gravity. At medium to high tide, effluent pumps remove the effluent from the facility. An outfall pipe carries effluent over 5,000 feet off shore. The outfall pipe extends 7/10ths of a mile beyond the breakwater that defines the harbor from the ocean. The primary sludge is sent to gravity thickeners and then to either a holding tank or a belt-filter press for dewatering. The dewatered sludge is hauled to Unity, ME to be composted (Millhouse 2006).
The pH (6.0 to 8.5 SU limits) of the effluent between December 2001 and March 2006 ranged from 6.8 to 7.5 SU (n=18)(TOXTD database). Ammonia-nitrogen concentrations of the effluent during the same time period ranged from 3.1 to 31.4 mg/L (n=18)(TOXTD database). The TRC (0.49 mg/L average monthly and 0.77 mg/L maximum daily limits) of the effluent between December 2001 and March 2006 ranged from <0.02 to 0.24 mg/L (n=18)(TOXTD database). The facility’s whole effluent toxicity testing, (LC50 >100% effluent limit) using Mysidopsis bahia and Menidia beryllina as test species, is performed on a quarterly basis. Other permitted parameters include BOD, TSS, Settleable Solids, Oil & Grease, Fecal Coliform Bacteria and Total Petroleum Hydrocarbons.
The city of Gloucester is required to conduct receiving water, biological and toxics control monitoring as part of their NPDES permit, which is required by the 301(h) regulations. The monitoring is conducted in the vicinity of the outfall outside of Gloucester Harbor proper and these data are available in annual reports.
Gloucester Harbor: Five CSO discharges as well as a pump station bypass outfalls also discharge directly into Gloucester Harbor. The Riverside Avenue (outfall # 011) and Grant Circle (outfall #012) Pumping Station Bypasses were reportedly eliminated in 1993.
In May 2005, the City of Gloucester entered into a modified consent decree with EPA and MassDEP that will mitigate 5 Combined Sewer Overflows (CSO) beginning in Spring 2006 (Millhouse 2006). A phased approach will be used starting with the largest CSO. The CSO’s/bypasses discharge directly into Gloucester Harbor. Metcalf & Eddy, on behalf of the City of Gloucester, submitted on June 30, 2005 the Final Combined Sewer Overflow Revised Long-Term Control Plan. The Plan included a description of the CSO system, baseline CSO activations and volumes, an assessment of a range of CSO control alternatives, and a recommended CSO abatement plan. The Plan recommended a sewer separation program throughout much of the existing combined sewer areas. The work (total estimated cost is $14.6 million) has been divided into three phases. On September 2, 2005, after lengthy negotiations, DEP, EPA, and the City reached agreement on a federal modified consent decree (MCD), which established an enforceable schedule for the implementation of the recommended plan. The sewer separation work is required to start in 2006 and to be completed by June 30, 2012. This CSO work will dramatically reduce the activations and volumes of CSO discharges to Pavilion Beach and inner Gloucester Harbor. The MCD also includes requirements for the City to proceed with additional work to address infiltration and inflow, and stipulated penalties where the City violates the requirements of the NPDES permit. Upon completion of the work identified in the Plan and required under the MCD, the following reductions in CSO activations/volumes are expected:
Discharge Point
Description Annual Discharge Volume
(MG)
Activations (Events/Year)
002 Mansfield Street Drain Western Ave CSO 0.14 1004 Rogers Street CSO 0.14 2005 Main Street CSO 0.06 1006 East Main Street CSO 0 0
006A East Main Street CSO 0.01 1
North Shore Coastal Watersheds 2002 Water Quality Assessment Report Appendix E E793wqar06.doc DWM CN 138.5

PERMITTEECity of Gloucester, Babson
Filtration Plant
NPDES#MAG640012
SEGMENTAlewife Brook (MA93-27)
The Town of Gloucester is authorized (MAG640012 issued December 2002) to discharge treated effluent via one outfall to Alewife Brook.
PERMITTEECity of Gloucester, West
Gloucester Filtration Plant
NPDES#MAG640013
SEGMENTSee Annisquam River System
The City of Gloucester is authorized (MAG640013 issued December 2002) to discharge effluent from the West Gloucester Filtration Plant to the Little River. There are plans to tie this discharge into the sewer but this has not yet been implemented.
PERMITTEEHoliday Fitness Center
NPDES#MA0033103
SEGMENTMA93-15
This permit is listed as becoming inactive as of 05/05/1999 because the facility tied into the MWRA system (EPA Inactive list Aug 2005).
PERMITTEECity of Lynn
NPDES#MA0100552
SEGMENTSMA93-24, MA93-44, MA93-52 and MA93-53
A new permit has been drafted for this facility. However, the Lynn Water & Sewer Commission is currently authorized (MA0100552 issued in May 2000) to discharge an average monthly flow of 25.8 MGD to the Lynn Outer Harbor. When the influent flows exceed 75 MGD, the permittee is authorized to discharge combined primary and secondary treated effluent to the Lynn Inner Harbor through Outfall 002 and to the Lynn Outer Harbor through Outfall 001. The facility is also permitted to discharge wet weather combined sewer overflows via five additional outfalls each of which is described below.Outfall 001: Lynn Outer Harbor (MA93-53). Permitted parameters: Flow 25.8 MGD, average monthly (annual average is calculated and reported as a rolling average), pH 6.2 to 8.5 SU, TRC 0.14 mg/L average monthly and 0.247 mg/L maximum daily, LC50 > 100% effluent, C-NOEC> 5.26% effluent using three test species for either acute and/or chronic tests (Mysidopsis bahia, Menidia beryllina, and Arbacia punctulata) conducted 4x/year. Other permitted parameters include: BOD, TSS, Fecal Coliform, Oil & Grease, Total Copper, and Total Nitrogen (report only). Other report parameters are Flow and Fecal Coliform.Outfall 002: Lynn Inner Harbor (MA93-52) Permitted parameters: TRC 0.0075 mg/L, average monthly and 0.013 mg/L maximum daily.Other maximum daily permitted parameters: BOD, TSS and Oil & Grease.CSO Outfalls: Outfall 003 (Summer Street Overflow to Saugus River - MA93-44), Outfall 004 (Market Street Overflow to Lynn Inner Harbor - MA93-52), Outfall 005 (Broad Street Overflow to Lynn Inner Harbor - MA93-52), and Outfall 006 (Sanderson Avenue Overflow to Nahant Bay MA93-24). Outfall 007 (Washington Street Overflow to Lynn Inner Harbor - MA93-52) was sealed.
TOXTD database: pH in effluent ranged from 7.9 to 8.6 SU, Ammonia-nitrogen ranged from 6.7 to 29.5 mg/L and TRC ranged from <0.1 to 0.54 mg/L (reports submitted from July 2000 to March 2006).
According to Kevin Brander (MassDEP), the LWSC, DEP, and EPA agreed to terms on a Second Modified Consent Decree (SMCD), which was executed on June 29, 2001. The SMCD included requirements for sewer separation work, which would result in elimination of three of the Commission’s four CSO discharges: 003, 004, 005, and 006. The SMCD required the Commission to proceed with sewer separation work and I/I work in the 003 system, and conduct follow-up monitoring to determine if further actions are needed to eliminate this outfall.
The SMCD required outfall 006 to be eliminated by December 31, 2003, outfall 005 to be eliminated by December 31, 2006, and outfall 006 to be eliminated by December 31, 2009. During implementation of the sewer separation work to achieve this outcome, it was discovered that 900 acres of the city thought to be served by separate sewer and drain systems were in fact combined systems, and that the ongoing design fro the SMCD sewer separation work would fail to achieve the intended benefits. The Commission has since developed and submitted an October 2004 Supplemental CSO Facilities Plan (SFP). The recommendations from that plan are to proceed with $55 million in I/I projects, sewer separation projects, and CSO storage facilities. This would be in addition to the $80 million spent to date by the Commission on CSO abatement actions.
DEP and EPA are continuing to review the recommendations in the SFP, and discussions have been focused on identifying and proceeding with projects to eliminate CSO discharges to King’s Beach. There has been a Draft CSO 006 Sewer Service Area Regulator
North Shore Coastal Watersheds 2002 Water Quality Assessment Report Appendix E E893wqar06.doc DWM CN 138.5

Evaluation Study submitted as a result of these ongoing discussions, and I/I projects and regulator modification are now proceeding with the goal of eliminating the 006 discharge.
PERMITTEELynnfield Center Water
District
NPDES#MAG640017
SEGMENTMA93-30
This permit authorizes the Lynnfield Center Water District (MAG640017 issued June 2004) to discharge effluent from the water treatment facility to Beaverdam Brook. No aluminum is allowed to be discharged.
PERMITTEETown of Manchester WWTP
NPDES#MA0100871
SEGMENTMA93-25
The Town of Manchester is authorized (MA0100871 issued in December 2004) to discharge 0.67 MGD (average monthly limit from June to November) and 1.2 MGD (average monthly limit from December to May) of treated effluent from the Manchester wastewater treatment plant (WWTP). An annual average flow limit of 0.67 MGD (calculated monthly) is in place. The treated effluent from the WWTP outfall# 001 is discharged into Manchester Harbor (considered part of Salem Sound in this report) near Sauli Rock. The Manchester WWTP, an extended aeration activated sludge process, was upgraded in 1998/1999. Inflow and infiltration (I&I) work was performed in the downtown area in 2005 (Sibbalds 2006).
The WWTP flow diagram begins with preliminary treatment that consists of a grinding device and a settling tank for grit. Influent wet well pumps elevate the flow before it enters the aeration tanks that are equipped with small bubble diffusers to produce dissolved oxygen. Soda ash is added to the head of aeration for alkalinity restoration due to nitrification. Secondary sedimentation follows the aeration tanks. Flow from the sedimentation units enters a flash-mixing tank where sodium hypochlorite is added for disinfection. Effluent pumps remove the effluent flow from the facility and direct it to the outfall pipe. The outfall pipe extends 8,900 feet off shore (Sibbalds 2006). Waste activated sludge removed from the secondary sedimentation units is pretreated with polymer and then is sent to a rotary thickener. The thickened sludge is hauled to the Upper Blackstone Water Pollution Abatement District, located in Millbury Massachusetts, to undergo further treatment (Sibbalds 2006).
The ammonia-nitrogen concentration (no limit currently exists) of the effluent between March 2000 and September 2005 ranged from 0.2 to 1.2 mg/L (n=12)(TOXTD database). The pH (6.5 to 8.5 SU limit) of the effluent for the same time period ranged from 6.7 to 8.5 SU (n=12)(TOXTD database). The TRC (1.0 mg/L maximum daily limit) of the effluent between March 2000 and September 2005 ranged from 0.03 to 0.14 mg/L (n=10)(TOXTD database). The Manchester WWTP’s whole effluent toxicity testing (LC50>50% 2004 permit limit) using Menidia beryllina is performed twice per year. The NPDES permit issued in September 1999 required testing with Mysidopsis bahia and Menidia beryllina. The toxicity test results will reflect the use of both species since most of the toxicity data was collected during the period when both species were required to be evaluated. Other 2004 permitted parameters include BOD, TSS, and Fecal Coliform. TKN, Total Nitrate and Nitrite, and Total Ammonia Nitrogen are report only.
PERMITTEETown of Manchester By-The-Sea, Gravelly Pond
WTP
NPDES#MAG640003
SEGMENTMA93028
The Town of Manchester By-The-Sea is authorized (MAG640003 issued in February 2001) to discharge effluent from the water treatment facility to Gravelly Pond.
North Shore Coastal Watersheds 2002 Water Quality Assessment Report Appendix E E993wqar06.doc DWM CN 138.5
PERMITTEETown of Marblehead
Sargent Road Pump Station
NPDES#MA0100374
NOT APPLICABLEDischarge into Massachusetts Bay.
The Town of Marblehead is authorized (MA0100374 issued September 1994, expired September 1999) under emergency conditions to discharge from the Sargent Road Pump Station to Massachusetts Bay. Emergency conditions can be defined simply as a back up in the sewerage system that occurs typically with high water volume events starting at the South Essex Sewerage District and working its way back to the Sargent Road Pump Station (McCollum 2006). Flow that must be diverted is screened and chlorinated prior to it being discharged into Massachusetts Bay.
The Town of Marblehead has begun the process of installing a Supervisory Control and Data Acquisition (SCADA) system for the water and sewer systems. Sherwood Road and Phillip Street installations are close to completion, however, it will take several years to complete the installation for the entire town (McCollum 2006).
PERMITTEENew England Detroit Diesel
NPDES#MA0026247
SEGMENTMA93-34
New England Detroit Diesel-Allison, Inc. of Wakefield (MA0026247). This facility is engaged in the rebuilding and testing of engine components. A new permit was just reissued for this facility (effective January 2007), which authorizes the discharge of stormwater runoff (Outfall 001A), 0.086 MGD of process water from the engine dynamometer (Outfall 001B), and 0.086 MGD of process water from the chassis dynamometer (Outfall 001C) which all combine and flow through outfall 001 which then discharges to a one-mile long surface drainage channel that flows to the Saugus River. City water is used as the source for the dynamometers so the permit also requires monitoring for TRC. This permit also requires that a best management plan/storm water pollution prevention plan be updated and implemented.
The prior permit was issued in March 1986 (formerly to Power Products, Inc.) to discharge 0.0035 MGD average monthly (0.005 MGD daily maximum) of non-contact cooling water plus stormwater run-off from outfall 001 to a surface drainage channel to the Saugus River.
PERMITTEENortheast Petroleum
Pocahantas Fuel Company
NPDES#MA00024732
SEGMENTMA93-01
Northeast Petroleum Pocahantas Fuel Company was authorized (MA00024732 issued November 1978 –permit formerly issued to White Fuel Corporation) to discharge stormwater from their treatment facility via outfall #001 to the Waters River. The company went out of business and the permit has been terminated (EPA Inactive list Aug 2004).
PERMITTEEOSRAM/Silvania, Inc.
NPDES#MA0003859
SEGMENTMA93-02
This permit is listed as becoming inactive as of 10/27/98 because the discharge was terminated (originally issued to GTE Sylvania Inc.) (EPA Inactive list Aug 2004).
PERMITTEEOSRAM/Silvania, Inc.
NPDES#MA0025411
SEGMENTMA93-01
This permit is listed as becoming inactive as of 5/23/96 (originally issued to GTE Sylvania Inc.) (EPA Inactive list Aug 2004).
North Shore Coastal Watersheds 2002 Water Quality Assessment Report Appendix E E1093wqar06.doc DWM CN 138.5
PERMITTEE City of Peabody, Coolidge
Avenue WTP
NPDES#MAG640006
SEGMENTMA93074
The city of Peabody is authorized (MAG640006 issued August 2004) to discharge of treated (lagoons) filter backwash water from the Coolidge Avenue Water Treatment Facility (WTF) to Spring Pond [North Basin] (also known as lower Spring Pond.
PERMITTEEPeabody Municipal Light Plant
NPDES#MA0023132
SEGMENTMA93-39
The permit authorizing the Peabody Municipal Light Plant to discharge to Proctor Brook expired 7/28/99 because the plant had been dismantled (EPA Inactive list Aug 2004).
PERMITTEERefuse Energy Systems
Company (RESCO)
NPDES#MA0034045
SEGMENTMA93-15
Refuse Energy Systems Company was authorized (MA0034045 issued September 1992) to discharge diffuse sheet flow from the Saugus Landfill to a tributary of the Pines River. This permit is listed as expired as of September 1997 (EPA Inactive list Aug 2004).
PERMITTEETown of Rockport Water
Treatment Plant
NPDES#MAG640021
SEGMENTMA93011
The Town of Rockport is authorized (MAG640021 issued February 2001) to discharge effluent from water treatment facility to Cape Pond.
North Shore Coastal Watersheds 2002 Water Quality Assessment Report Appendix E E1193wqar06.doc DWM CN 138.5
PERMITTEERockport WWTP
NPDES#MA0100145
SEGMENTSandy Bay which is outside of
Rockport Harbor proper (See MA93-17)
The Town of Rockport is authorized (MA0100145 issued in July 2004) to discharge a flow of 0.8 MGD (annual average calculated monthly) of treated effluent from the Rockport Wastewater Treatment Plant (WWTP) via outfall# 001 to Sandy Bay. A consent decree and an amended consent decree were signed by the Town of Rockport (Board of Selectman and Board of Public Works and the MassDEP in December 1998 and May 2003, respectively, to address inflow and infiltration (I&I) concerns. The I&I work has been on going. Upgrading the aeration equipment to fine-bubble diffusers, covering the basins, and treating the air with a biofilter addressed odors problems from the aeration basins at the facility. Construction began in 2004 and the new components became operational in 2005 (Wonson 2006).
The Rockport WWTP, designed with an extended aerated activated sludge process, begins treatment of the wastewater by settling grit then removing it by a degritting process. Screening is accomplished by the use of two bar racks in series. Flow measurement is determined by the use of a Parshall flume. Biological treatment takes place in the aeration basins and secondary sedimentation units follow to promote the settling of solids. Gaseous chlorine is added to a manhole where clarified effluent flows for disinfection and a 25-minute contact time before the treated effluent reaches the end of the outfall pipe. Waste activated sludge that is removed from the secondary treatment process undergoes aerobic digestion. Lime is added to thicken the digested sludge. The sludge is then conditioned with polymer prior to dewatering by a belt-filter press. During the colder months, the dewatered sludge is hauled to Brickend Farm in Hamilton to be land applied. During the warmer months, the dewatered sludge is hauled to a privately operated composting facility located in Ipswich (Wonson 2006).
The pH (6.5 to 8.5 SU limit) of the effluent between January 2000 and March 2006 ranged from 5.4 to 7.6 SU. Three pH measurements were below 6.5 SU of the 13 results reported (TOXTD database). The ammonia-nitrogen concentration (no limit currently exists) of the effluent during the same time period ranged from 0.10 to 22.0 mg/L (n=13)(TOXTD database). The TRC (0.26 mg/L, average monthly and 0.46 mg/L, maximum daily limits) of the effluent between January 2000 and March 2006 were all <0.02 mg/L (n=12)(TOXTD database). The Rockport WWTP’s whole effluent toxicity testing (LC50>100% limit) using Menidia beryllina is performed twice per year. Other permitted parameters include BOD, TSS, and Fecal Coliform.
PERMITTEESalem Oil & Grease
Company
NPDES#MA0025372
SEGMENTMA93-39
This permit is listed as becoming inactive as of 2/18/04 (EPA Inactive list Aug 2004).
PERMITTEEShore Cliff Deaconess
Retirement Home WWTP
NPDES#MA0027391
SEGMENT(Not applicable) Mass Bay
The Shore Cliff Deaconess Retirement Home was authorized (MA0027391 issued in June 2005) to discharge a flow of 0.004 MGD (average monthly) of treated effluent from an on-site wastewater treatment facility (WWTF) via outfall# 001 to Massachusetts Bay (Atlantic Ocean). Plans to undergo new construction involving the Retirement Home and the WWTF unofficially ran into neighborhood opposition according to an employee of the City of Gloucester’s Assessor’s Office. The residents were relocated elsewhere and the Retirement Home went out of business around the time that the June 2005
North Shore Coastal Watersheds 2002 Water Quality Assessment Report Appendix E E1293wqar06.doc DWM CN 138.5

NPDES permit was issued. The former NPDES permit was issued for the facility in September 1999. The facility was required to test for acute whole effluent toxicity 2 times per year using Mysidopsis bahia and Menidia beryllina with a limit of LC50>50% effluent. Between March 2000 and March 2004, the LC50’s for M. bahia and M. beryllina were all >100% effluent (n=8) (TOXTD database).
PERMITTEESouth Essex Sewerage
District WWTP
NPDES#MA0100501
SEGMENTMA93-25
The SESD is authorized (MA0100501 issued in February 2001) to discharge treated effluent from the SESD (WWTP) via outfall# 001 to Salem Sound. The facility was upgraded to secondary treatment with dechlorination as of June 1998. Four permit conditions were appealed by the permittee – the flow limit (29.71 MGD annual rolling average) and monitoring requirements, the TRC limit (0.24 mg/L average monthly, 0.338 mg/L maximum daily) and monitoring requirements, the infiltration/inflow requirements and the ambient monitoring program requirement to study the benthic community in the vicinity of the outfall in Salem Sound. EPA withdrew the contested permit requirements in a letter dated 10 September 2001.
The South Essex Sewer District begins treatment with several bar screens and a single channel monster located at pump stations within the collection system. Flow is measured with magnetic meters at the pump stations (to determine the flow from the contributing communities which make up the district). At the treatment facility the wastewater starts with 4 aerated grit chambers. Grit is removed from the chambers via clamshell crane and land filled. This is followed by 7 rectangular clarifiers with effluent end scum skimmers. Primary sludge and scum are pumped to a holding tank. Secondary treatment is composed of four, five-stage pure oxygen reactors followed by 7stacked rectangular clarifiers. Disinfection is accomplished by sodium hypochlorite followed by sodium bisulfite for dechlorination. Waste activated sludge is blended with primary sludge and scum, amended with polymer and treated on 4 belt filter presses. Sludge cake is disposed of offsite via Cynagro sludge handling services.
The pH (6.5 to 8.5 SU limit) of the effluent between February 1999 and April 2006 ranged from 6.87 to 7.97 SU (TOXTD database). The ammonia-nitrogen concentration (no limit currently exists) of the effluent during the same time period ranged from 9.1 to 31 mg/L (n=30)(TOXTD database). Effluent TRC concentrations between February 1999 and August 2005 were all <0.05 mg/L (n=30)(TOXTD database). The SESD whole effluent toxicity testing (LC50>100% limit) using Mysidopsis bahia and Menidia beryllina is performed four times per year. Other permitted parameters include CBOD5, TSS, and Fecal Coliform.
(Note: This facility was the recipient of the 2005 EPA New England Exemplary Performance Award).
PERMITTEESpir- it, Inc.
NPDES#MA0034452
SEGMENTMA93-31
Spirit, Inc. had applied (MA0034452 in December 1992) to discharge non-contact cooling water to Wakefield Brook, which flows into the Mill River. The facility closed-looped their non-contact cooling water discharge in December 1999 and no longer discharges to the brook. The permit needs to be terminated by EPA.
PERMITTEESports Oil Corporation
NPDES#MA0032671
SEGMENTMA93-15
This permit is listed as becoming inactive as of 03/26/1999 based on agency (EPA) determination (EPA Inactive list Aug 2005).
North Shore Coastal Watersheds 2002 Water Quality Assessment Report Appendix E E1393wqar06.doc DWM CN 138.5
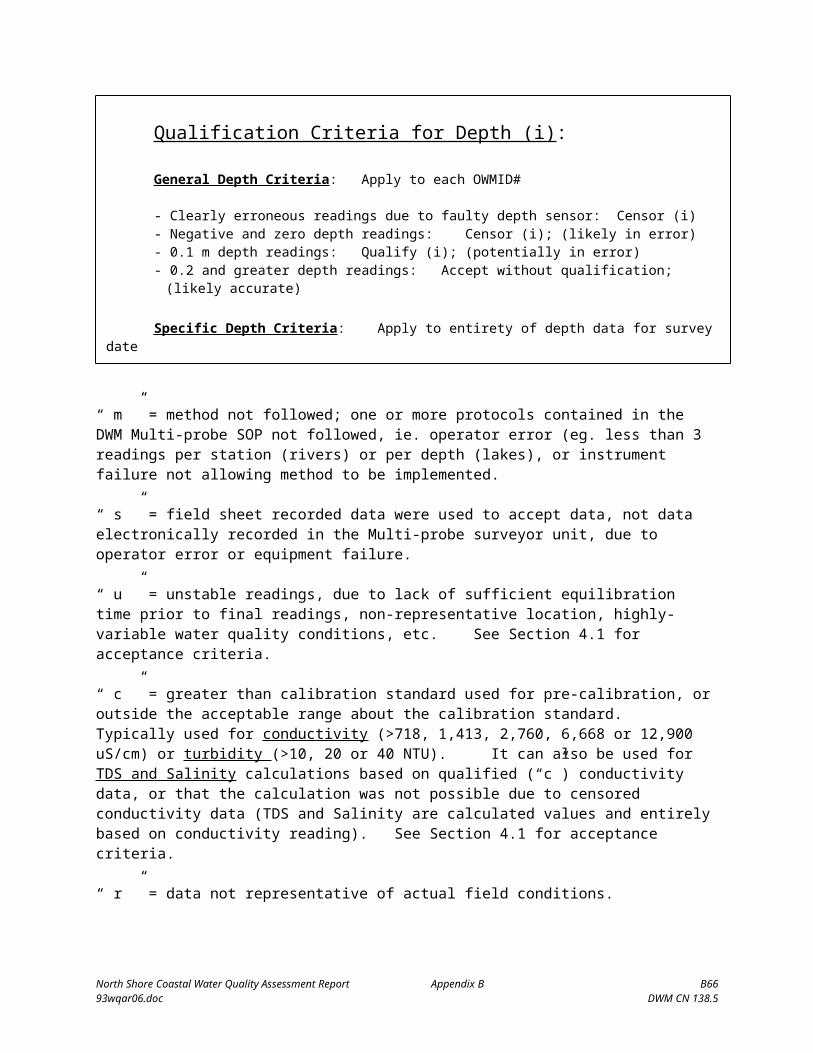
PERMITTEEStahl USA (formerly
Permuthane, Inc.)
NPDES#MA0028584, MA0035467,
MA0028215
SEGMENTMA93-05
MA0028584 is listed as becoming inactive as of 3/01/2000 (EPA Inactive list Aug 2004) because the property was sold.MA0035467 is listed as becoming inactive as of 12/12/2002 (EPA Inactive list Aug 2004) because the flow was tied into SESD.MA0028215 was comprised of non-contact cooling water and boiler condensate with chemical additives, which was closed-looped as of March 2003. This permit was terminated in September 2005.
PERMITTEETown of Swampscott
NPDES#MA0101907 - now terminated
SEGMENTMA93-24
The Swampscott WWTP discharge from outfall 001 to Nahant Bay authorized by the NPDES permit MA0101907 was tied into the LWSC facility on 2 June 1992. The town was also authorized in the permit to discharge from three stormwater outfalls (described as “contaminated stormwater”) described below:
002: Sculpin Way Drain to Nahant Bay.003: Marshall Brook Drain to Nahant Bay.004: New Ocean Street Underdrain intermittent discharge to Stacey Brook.
Note: In October 1992, EPA determined that a NPDES permit was no longer required for these discharges. While discharges from outfall 002 and 003 stormdrains are currently permitted by the towns stormwater permit MAR041064, chlorinated stormwater from outfall 004 is not authorized by MAR041064.The 004 discharge point is adjacent and just north of the Stacey Brook box culvert from the City of Lynn. The town of Swampscott continues to operate a chlorination system during the summer months, to disinfect flows from the 004 outfall to King’s Beach during the swimming season. The practice of chlorinating the outfall and/or the receiving stream is not in compliance with Massachusetts Water Quality Standards without a duly issued NPDES permit. DEP and EPA are now evaluating the quantity and quality of this discharge, in order to determine the need for permitting, and establishing effluent limitations.
PERMITTEEThermadyne – Danvers
NPDES#MA0034819
SEGMENTFrost Fish Brook (MA93-36)
An emergency exclusion to discharge from a groundwater remediation system at Thermadyne Wingaersheek Building– Danvers was issued in January 1992. The system was in place and discharging in September 1999 and was expected to be actively discharge for one to two more years. The contaminants of concern were 1-1-Dichloroethane, 1,1,1-Trichloroethane; Trichloroethylene and Tetrachloroethylene. A site visit conducted in November 2005 reported no evidence of a discharge. EPA has closed out the application file.
PERMITTEEUnited States Coast Guard –
Gloucester
NPDES#MA0090492
SEGMENTGloucester Harbor (MA93-18)
The United States Coast Guard is authorized (MA0090492 issued March 2000) to discharge 0.0006 MGD (average monthly) of treated sanitary wastewater via outfall #001 to Gloucester Harbor.
PERMITTEE NPDES# SEGMENT
North Shore Coastal Watersheds 2002 Water Quality Assessment Report Appendix E E1493wqar06.doc DWM CN 138.5

The Town of Wakefield MA0103004 MA93-31
The Town of Wakefield had applied (MA0103004) in May 1996 to discharge wastewater from their Crystal Lake Water Treatment Plant to Crystal Lake. In April 2003, the construction of the new Broadway Water Treatment Plant was completed. There is no wastewater discharge of filter backwash or sedimentation since treatment is slow sand filtration. Whether or not a permit will be required (once or twice a year when the sand filter is drained and the solids are removed, the water goes into the clear well and is then directed to the outlet stream downstream from Crystal Lake) needs to be determined by EPA and MassDEP.
PERMITTEEThe Wakefield Corporation
NPDES#MAG250965
SEGMENTMA93-31
The Wakefield Corporation is authorized (MAG250965 issued August 1998) to discharge non-contact cooling water to Wakefield Brook, which flows into the Mill River. The facility was required to submit the results of one whole effluent modified acute and chronic toxicity test using Ceriodaphnia dubia. The individual permit MA0002356 for this discharge was terminated in August 1998.
North Shore Coastal Watersheds 2002 Water Quality Assessment Report Appendix E E1593wqar06.doc DWM CN 138.5
PERMITTEEWheelabrator Saugus JV
NPDES#MA0028193
SEGMENTMA93-44
Wheelabrator Saugus JV (formerly Refuse Energy Systems Company (RESCO) is authorized (permit MA0028193 issued September 1991) to discharge, via outfall 001, 60 MGD of once through non-contact cooling water. The facility is engaged in trash burning and power generation and became operational in September 1985. RESCO withdraws water from the Saugus River at their intake structure located southeast of the Route 107 (Salem Turnpike) in East Saugus. The outfall diffuser is located at the bottom of the north edge of the channel in about 20’ of water approximately 60% of the distance to the railroad bridge from the steam bridge (Swanson et al. 2004). The permit limit for temperature at the outfall is 90F max and at no time is the discharge to exceed a 20F rise over the temperature of the intake.
A few violations of temperature limits between January 2000 and August 2006 have been reported. Specifically, In January 2003 the temperature differential was 24F and in May 2003 the temperature differential was 21F. In June 2005 the temperature was 91F and in August 2005 the temperature was 91F. Also in August 2005 the temperature differential was 21F. In June 2006 the temperature differential was 22F.
A pre and post-operational biological monitoring program was required to determine potential impacts associated with the facility’s operation on the Saugus River. The pre-operational (one-year baseline) monitoring program was completed in 1984. Field sampling activities performed included ichthyoplankton tows, beach seining, otter trawls, and recording physical data within the river (salinity, temperature, and dissolved oxygen). The post-operative monitoring study began in June 1986 and continued through May 1988 repeating the pre-operative sampling program and the addition of field components to evaluate the potential impacts of the water withdrawal on the local fish community in the Saugus River. Entrainment of ichthyoplankton by the once-through river water-cooling system and impingement of finfish on the traveling intake screens was also evaluated.
The NPDES permit states that the following actions are required to document intake velocity and evaluate intake design: -Determine intake velocity at several tidal periods. Model and field-test physical and operational changes to intake system that will result in reduced larval entrainment. [Intake velocities averaged 0.2-0.3 ft/s at low water and mid-tide. The highest single observation was 0.6 ft/sec.]- The permittee shall use 1991 ichthyoplankton sampling data and other applicable sources to model RESCO entrainment on adult populations of smelt and winter flounder in the Saugus River. Equivalent winter flounder adults based upon an estimated 3.5 million larvae entrained in 1991 was 216 age 3 adults. Rainbow smelt larval abundance was too low to perform a meaningful analysis. - The permittee shall report on the results of all of the items mentioned above. The report shall be attached to the October 1991 DMR. If the data were to be judged to be inadequate, the program shall be repeated the following year. [All three of these items were addressed in the October 31, 1991 report by MRI.]
Swanson1, C., H. Rines1, D.L. Mendelsohn2, and W.K. Saunders2. 2004. Temperature Mapping and Hydrothermal Model Calibration of the Lower Saugus River Estuary Draft Report 04-115 prepared for Wheelbrator Saugus, Inc. 1Applied Science Associates, Inc. Narragansett, RI and 2Applied Technology & Management, Inc. Newport, RI
North Shore Coastal Watersheds 2002 Water Quality Assessment Report Appendix E E1693wqar06.doc DWM CN 138.5

SALISBURY
READING
WAKEFIELD
SAUGUS
MELROSE
MALDEN
REVERE NAHANT
LYNN
PEABODY
SALEM
DANVERS
SWAMPSCOTT
MARBLEHEAD
BEVERLY
HAMILTON
MANCHESTER
ESSEX
IPSWICH
GLOUCESTER
ROCKPORT
EVERETT
N
4 0 4 8 Miles
LYNNFIELD
LEGEND
Urban Areas
Town Boundaries
North Coastal Watershed Outline
Data Sources:Regulated areas are urbanized areas as defined by the US Census Bureau (2000). Population density data also from the US Census Bureau.
STORMWATERThe NPDES Phase II General Permit program requires NPDES permit coverage for stormwater discharges from small municipal separate storm sewer systems (MS4s), and construction activity disturbing one acre or more of land in a mapped "urbanized area" defined and delineated by the US Bureau of Census in 2000 http://www.epa.gov/npdes/pubs/fact2-2.pdf.
Large and medium MS4s (populations over 100,000) were permitted during Phase I of the NPDES stormwater program. Under EPA's Phase II program, the definition of "municipal" includes Massachusetts communities, U.S. military installations, state or federal owned facilities such as hospitals, prison complexes, state colleges or universities and state highways. An MS4 is a system that: discharges at one or more a point sources; is a separate storm sewer system (not designed to carry combined stormwater and sanitary waste water); is operated by a public body; discharges to the Waters of the United States or to another MS4; and, is located in an "Urbanized Area". The NPDES Phase II General Permit requires operators of regulated MS4s to develop and implement a stormwater management program that prevents harmful pollutants from being washed or dumped directly into the storm sewer system which is subsequently discharged into local waterbodies. The NPDES Stormwater Phase II General Permit requires operators of regulated small municipal separate storm sewer systems (MS4s) to develop a stormwater management program that prevents harmful pollutants from being washed or dumped directly into the storm sewer system, and then discharged into local waterbodies. Certain Massachusetts communities were automatically designated (either in full or part) by the Phase II rule based on the urbanized area delineations from the 2000 U.S. Census.
As a result of the census mapping, all 26 communities in the North Shore Coastal Watersheds were located either totally or partially in the regulated Urbanized Area (see below Figure above). Municipalities that are totally regulated must implement the requirements of the Phase II permit in the entire town, while communities that are partially regulated need to comply with the Phase II permit only in the mapped Urbanized Areas. All North Shore Coastal drainage area communities applied to EPA and MassDEP for coverage under the Phase II stormwater general permit, issued on 1 May 2003. EPA issued stormwater general permits to all 26 North Shore Coastal Watersheds municipalities after
North Shore Coastal Watersheds 2002 Water Quality Assessment Report Appendix E E1793wqar06.doc DWM CN 138.5

administrative review and, in coordination with MassDEP, will complete a thorough review of the communities' stormwater management program during the five-year permit term. Phase II stormwater general permits will expire on 1 May 2008 (Domizio 2004). For detailed community maps see http://www.epa.gov/region01/npdes/stormwater/ma.html.
North Shore Coastal Watersheds 2002 Water Quality Assessment Report Appendix E E1893wqar06.doc DWM CN 138.5

Table E3. NPDES Phase II stormwater permit information for the North Shore Coastal Watersheds communities.
Community Permit # Permit Issued Mapped Regulatory area in communityAmesbury MAR041177 1/8/2004 Partial
Beverly MAR041181 9/29/2003 TotalDanvers MAR041188 9/26/2003 TotalEssex MAR041239 12/5/2003 PartialEverett MAR041078 9/12/2003 Total
Gloucester MAR041192 1/8/2004 TotalHamilton MAR041196 2/24/2004 PartialIpswich MAR041199 9/18/2003 Partial
Lynn MAR041044 10/2/2003 TotalLynnfield MAR041045 9/25/2003 TotalMalden MAR041046 10/9/2003 Total
Manchester MAR041207 8/28/2003 PartialMarblehead MAR041047 9/18/2003 Total
Melrose MAR041050 10/3/2003 TotalNahant MAR041051 9/29/2003 Total
Peabody MAR041216 10/31/2003 TotalReading MAR041056 8/26/2003 TotalRevere MAR041057 10/17/2003 Total
Rockport MAR041217 12/5/2003 TotalSalem MAR041219 10/7/2003 Total
Salisbury MAR041220 10/30/2003 PartialSaugus MAR041059 10/30/2003 Total
Stoneham MAR041062 10/23/2003 TotalSwampscott MAR041064 9/29/2003 Total
Wakefield MAR041065 9/25/2003 TotalWenham MAR041230 8/28/2003 Partial
The NPDES Phase I Storm Water Program, (EPA HQ) in place since 1990, regulates cities and counties with populations of 100,000 that operate a municipal separate storm sewer system (MS4), specific industrial operations (as defined at 40 CFR 122.26(b)(14)), and construction activities that disturb 5 or more acres of land. Information for these permittees can be found online at: http://cfpub.epa.gov/npdes/stormwater/noi/noisearch.cfm.
Under a grant from the Executive Office of Environmental Affairs (EOEA) MassDEP to the Massachusetts Watershed Initiative Program, the Vanasse Hangen Brustlin, Inc. (VHB) project team provided technical assistance to 15 communities within the North Coastal Region to begin their efforts towards the development of a Plan to achieve compliance with EPA’s NPDES Stormwater Phase II Regulations. The 15 communities included in the project are Gloucester, Beverly, Marblehead, Danvers, Salem, Peabody, Swampscott, Lynn, Lynnfield, Melrose, Reading, Wakefield, Saugus, Malden and Revere.
The project included close coordination between EOEA and the MassDEP Stormwater Outreach Program. The goals of the project were to offer focused Stormwater Phase II compliance assistance. VHB's efforts focused on assessing the existing stormwater management efforts in the communities and assisting the towns in prioritizing their planning and coordination tasks to facilitate the development of their compliance plans (VHB 2001/2002).
ReferencesDomizio, L. 2004. Stormwater permitting information Phase II Communities. Massachusetts Department of Environmental Protection, Division of Watershed Management, Worcester, MA. Personal Communication.
North Shore Coastal Watersheds 2002 Water Quality Assessment Report Appendix E E1993wqar06.doc DWM CN 138.5

McCollum, Charles. 2006. Personal Communication. Marblehead Sargent Road Pump Station operational status. Communication with Richard Alden, Massachusetts Department of Environmental Protection, Division of Watershed Management, 16 February 2006. Assistant Superintendent, Town of Marblehead.
VHB. 2001/2002. Final Draft 5/1/02. Massachusetts Watershed Initiative: Stormwater Compliance Phase II Contract 01-09/MWI. Vanasse Hangen Brustlin, Inc., Watertown, Massachusetts.
North Shore Coastal Watersheds 2002 Water Quality Assessment Report Appendix E E2093wqar06.doc DWM CN 138.5