appendix - ars.els-cdn.com · web viewtable 1 below compares the characteristics of countries...
TRANSCRIPT

AppendixAppendix 1. Effect weighting
When calculating the average effect of trade liberalization on child mortality I follow Acemoglu et al. (2016) in assigning weights to each country-level effect estimate according to the model fit in the pre-treatment period, measured as the Root Mean Squared Prediction Error (RMSPE). Country-level effect estimates based on models with a better fit are assigned greater weights by first taking the reciprocal of the model’s RMSPE in the pre-intervention period per Equation 1:
Equation 1. ρ j=
1
√ ∑t=T−10
T −1
¿¿¿¿
Where j refers to the liberalizing countries j=1,...,J, c=1,…,C are their comparison countries, and t refers to the year in the pre-treatment period, t =T-10,…,T-1 (T=0 is the treatment year). The denominator is the RMSPE. Taking the reciprocal ensures that countries with higher prediction error have lower values of ρ j . I then used ρ j to calculate a normalized weight,π j, so that each weight varied from 0 to 1 and all weights sum up to 1, per Equation 2:
Equation 2. π j=
ρ j
∑j=1
J
ρ j
I calculate the weighted-mean effect τ t across all liberalization episodes at a given time point t by assigning these weights to each country-level effect δ jtand summing across episodes, per Equation 3:
Equation 3. τ t=∑ π j . δ jt
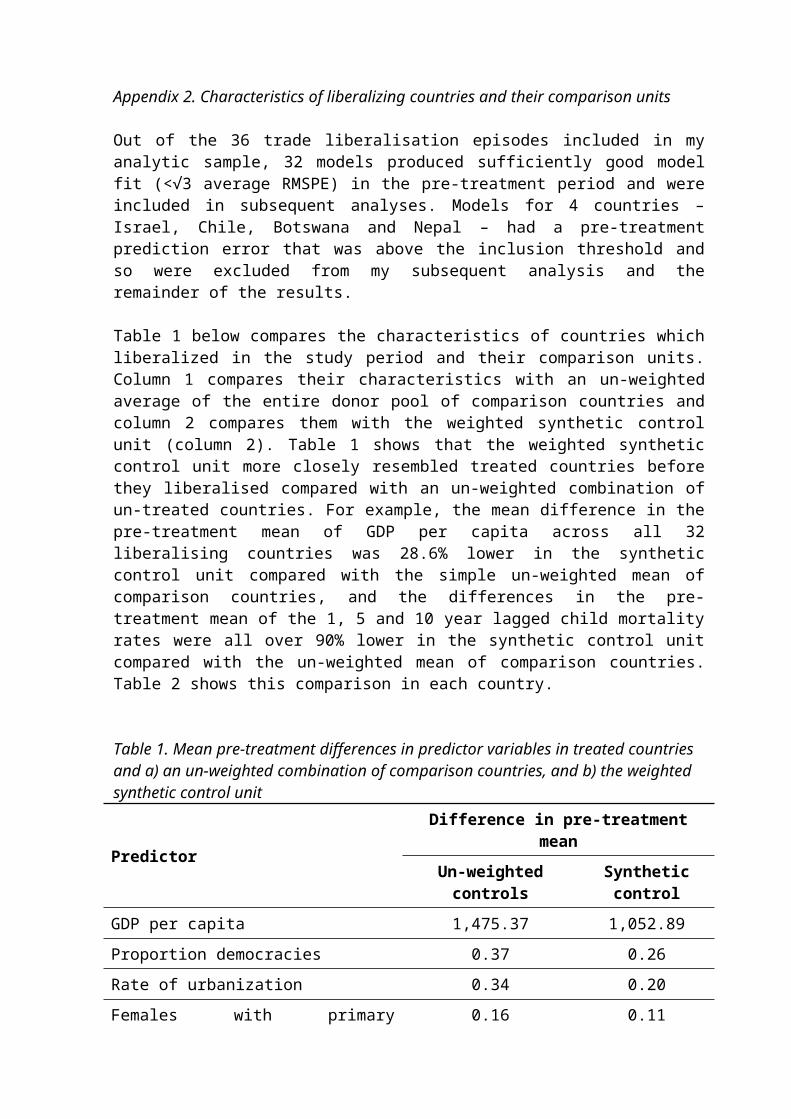
Appendix 2. Characteristics of liberalizing countries and their comparison units
Out of the 36 trade liberalisation episodes included in my analytic sample, 32 models produced sufficiently good model fit (<√3 average RMSPE) in the pre-treatment period and were included in subsequent analyses. Models for 4 countries – Israel, Chile, Botswana and Nepal – had a pre-treatment prediction error that was above the inclusion threshold and so were excluded from my subsequent analysis and the remainder of the results.
Table 1 below compares the characteristics of countries which liberalized in the study period and their comparison units. Column 1 compares their characteristics with an un-weighted average of the entire donor pool of comparison countries and column 2 compares them with the weighted synthetic control unit (column 2). Table 1 shows that the weighted synthetic control unit more closely resembled treated countries before they liberalised compared with an un-weighted combination of un-treated countries. For example, the mean difference in the pre-treatment mean of GDP per capita across all 32 liberalising countries was 28.6% lower in the synthetic control unit compared with the simple un-weighted mean of comparison countries, and the differences in the pre-treatment mean of the 1, 5 and 10 year lagged child mortality rates were all over 90% lower in the synthetic control unit compared with the un-weighted mean of comparison countries. Table 2 shows this comparison in each country.
Table 1. Mean pre-treatment differences in predictor variables in treated countries and a) an un-weighted combination of comparison countries, and b) the weighted synthetic control unit
PredictorDifference in pre-treatment mean
Un-weighted controls Synthetic control
GDP per capita 1,475.37 1,052.89
Proportion democracies 0.37 0.26
Rate of urbanization 0.34 0.20
Females with primary education (%) 0.16 0.11
Population growth rate 0.08 0.08
Proportion in conflict 0.19 0.19
Child mortality rate, 1 year before reform 18.68 1.53
Child mortality rate, 5 years before reform 18.64 1.66
Child mortality rate, 10 years before reform 18.64 1.51Notes: See Table 1 for measurement and data source for each variable. See Appendix 2 for comparison of predictor means in each country.

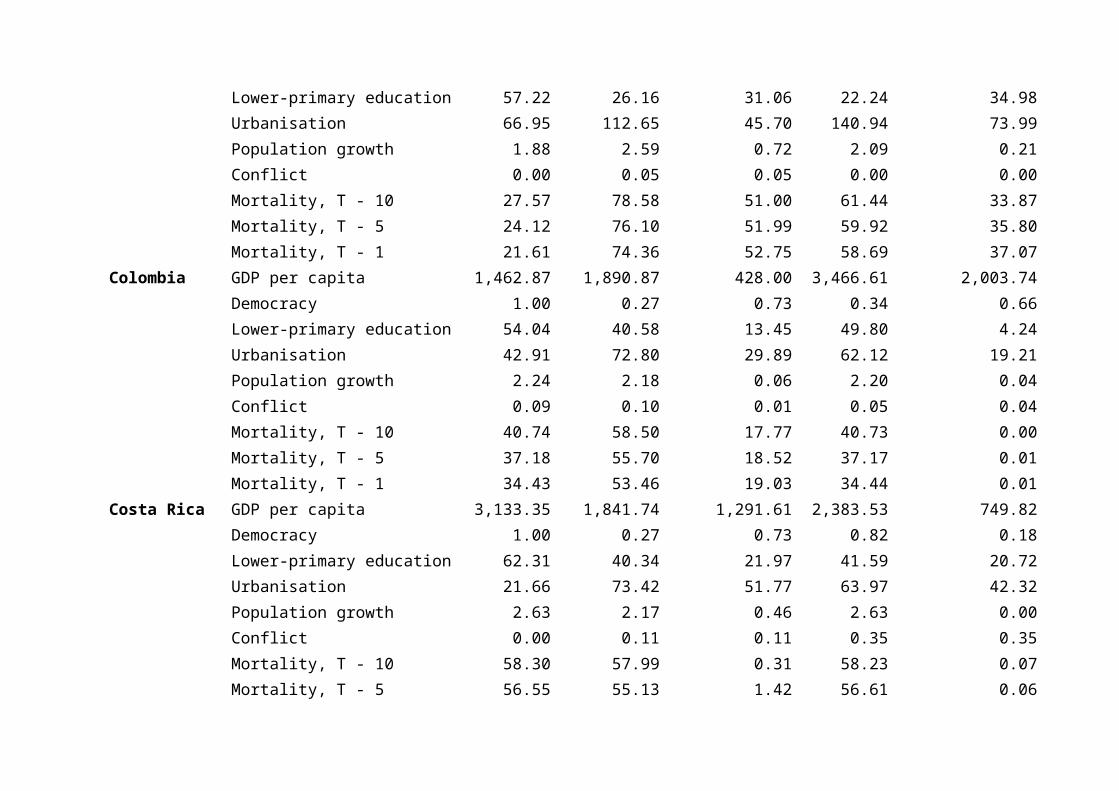
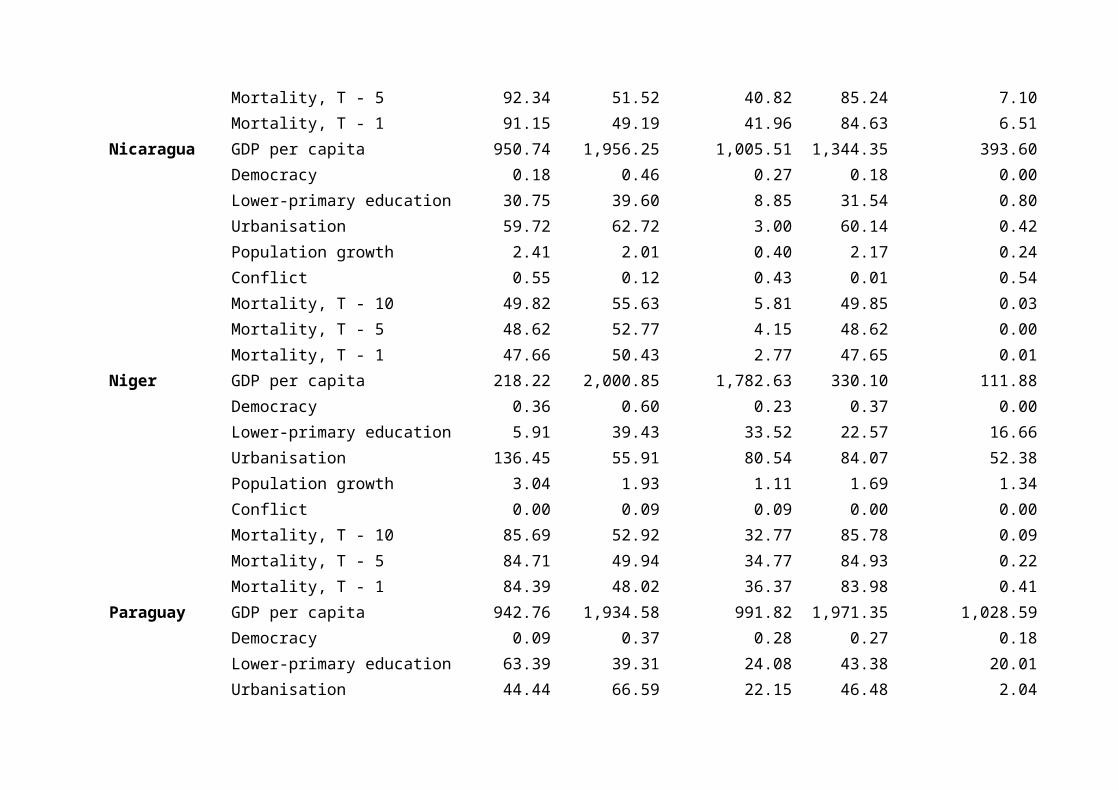
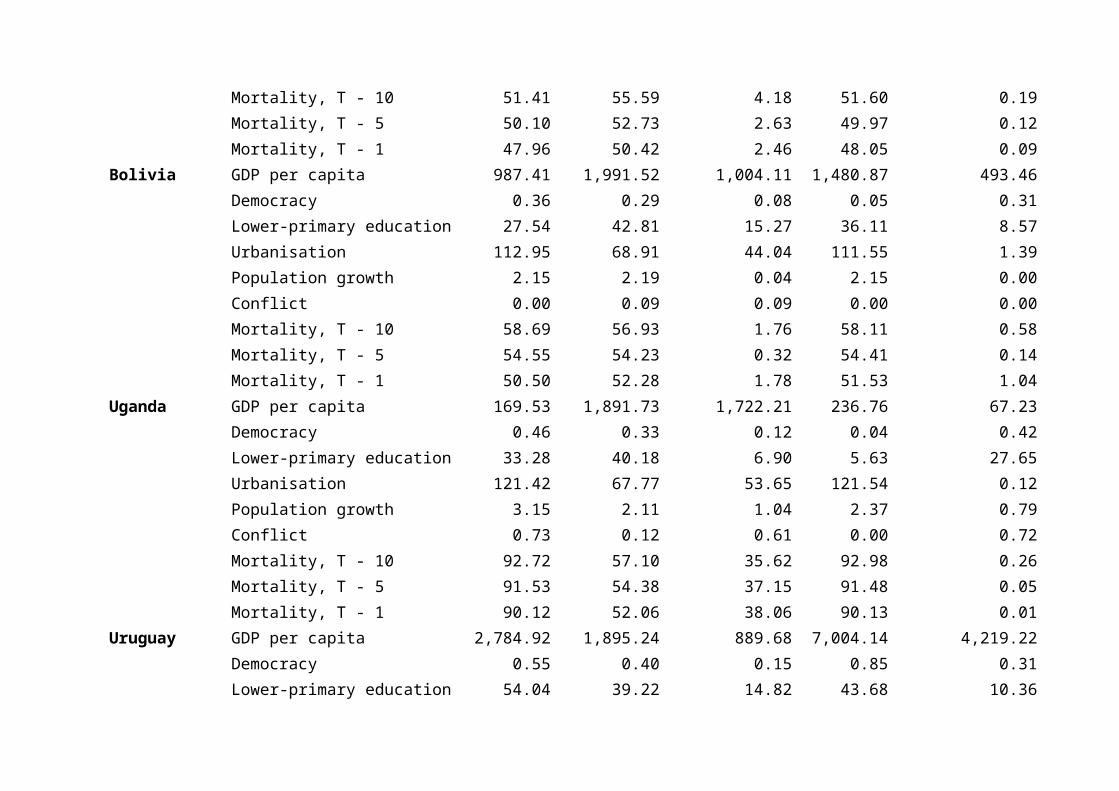
Table 2. Comparison of pre-treatment predictor means in treated countries and synthetic controls (T= treatment year)
Country Variable Treated Country
Sample Mean
Treated – Sample Mean
Synthetic Control
Treated – Synthetic Control
Albania GDP per capita 1,188.74 1,953.50 764.76 1,322.94 134.20Democracy 0.27 0.50 0.23 0.21 0.06Lower-primary education 22.65 39.54 16.88 41.73 19.08Urbanisation 42.19 61.62 19.43 50.09 7.90Population growth 1.59 2.02 0.43 1.60 0.00Conflict 0.00 0.12 0.12 0.00 0.00Mortality, T - 10 65.71 54.62 11.10 65.75 0.03Mortality, T - 5 64.38 51.70 12.68 64.39 0.01Mortality, T - 1 63.30 49.48 13.82 63.23 0.07
Cameroon GDP per capita 863.31 1,968.99 1,105.68 861.40 1.92Democracy 0.00 0.56 0.56 0.25 0.25Lower-primary education 37.10 38.83 1.73 37.06 0.04Urbanisation 89.61 58.73 30.88 79.18 10.43Population growth 2.99 1.95 1.03 2.41 0.58Conflict 0.00 0.11 0.11 0.01 0.01Mortality, T - 10 65.52 54.06 11.46 65.52 0.00Mortality, T - 5 61.49 51.18 10.31 61.49 0.00Mortality, T - 1 59.18 49.17 10.02 59.19 0.00
Chile GDP per capita 2,072.00 466.15 1,605.85 822.50 1,249.50Democracy 0.64 0.30 0.34 0.00 0.64Lower-primary education 57.22 26.16 31.06 22.24 34.98Urbanisation 66.95 112.65 45.70 140.94 73.99Population growth 1.88 2.59 0.72 2.09 0.21Conflict 0.00 0.05 0.05 0.00 0.00

Mortality, T - 10 27.57 78.58 51.00 61.44 33.87Mortality, T - 5 24.12 76.10 51.99 59.92 35.80Mortality, T - 1 21.61 74.36 52.75 58.69 37.07
Colombia GDP per capita 1,462.87 1,890.87 428.00 3,466.61 2,003.74Democracy 1.00 0.27 0.73 0.34 0.66Lower-primary education 54.04 40.58 13.45 49.80 4.24Urbanisation 42.91 72.80 29.89 62.12 19.21Population growth 2.24 2.18 0.06 2.20 0.04Conflict 0.09 0.10 0.01 0.05 0.04Mortality, T - 10 40.74 58.50 17.77 40.73 0.00Mortality, T - 5 37.18 55.70 18.52 37.17 0.01Mortality, T - 1 34.43 53.46 19.03 34.44 0.01
Costa Rica GDP per capita 3,133.35 1,841.74 1,291.61 2,383.53 749.82Democracy 1.00 0.27 0.73 0.82 0.18Lower-primary education 62.31 40.34 21.97 41.59 20.72Urbanisation 21.66 73.42 51.77 63.97 42.32Population growth 2.63 2.17 0.46 2.63 0.00Conflict 0.00 0.11 0.11 0.35 0.35Mortality, T - 10 58.30 57.99 0.31 58.23 0.07Mortality, T - 5 56.55 55.13 1.42 56.61 0.06Mortality, T - 1 54.56 52.87 1.69 54.51 0.04
Ecuador GDP per capita 1,797.33 1,932.07 134.74 1,796.10 1.23Democracy 1.00 0.43 0.57 0.87 0.13Lower-primary education 43.31 39.24 4.07 44.34 1.04Urbanisation 52.94 62.91 9.98 52.63 0.30Population growth 2.47 2.01 0.45 2.42 0.04Conflict 0.00 0.13 0.13 0.05 0.05
Mortality, T - 10 52.11 55.57 3.45 52.09 0.02Mortality, T - 5 48.01 52.79 4.78 48.02 0.01Mortality, T - 1 44.91 50.51 5.60 44.90 0.01
El Salvador GDP per capita 1,786.01 1,910.48 124.47 1,785.94 0.07Democracy 0.73 0.36 0.37 0.39 0.34Lower-primary education 48.84 39.73 9.11 48.83 0.01Urbanisation 64.07 66.03 1.95 55.46 8.62Population growth 1.46 2.09 0.63 1.62 0.17Conflict 0.82 0.10 0.72 0.16 0.65Mortality, T - 10 56.46 56.54 0.08 56.44 0.02Mortality, T - 5 53.88 53.83 0.05 53.89 0.01Mortality, T - 1 51.81 51.46 0.35 51.80 0.00
Argentina GDP per capita 2,358.70 1,916.03 442.67 3,593.45 1,234.75Democracy 0.82 0.44 0.38 0.67 0.15Lower-primary education 58.02 38.82 19.20 51.84 6.18Urbanisation 28.42 63.61 35.20 28.34 0.08Population growth 1.51 2.04 0.53 0.97 0.54Conflict 0.00 0.13 0.13 0.01 0.01Mortality, T - 10 16.69 56.58 39.89 16.66 0.03Mortality, T - 5 14.56 53.74 39.19 14.59 0.03Mortality, T - 1 13.02 51.42 38.40 13.01 0.00
Ghana GDP per capita 271.55 2,013.89 1,742.33 1,392.93 1,121.38Democracy 0.18 0.29 0.11 0.12 0.07Lower-primary education 11.73 43.30 31.58 23.96 12.23Urbanisation 102.03 69.25 32.78 101.91 0.11Population growth 2.55 2.18 0.37 2.55 0.00Conflict 0.00 0.09 0.09 0.05 0.05

Mortality, T - 10 69.95 56.58 13.37 70.03 0.07Mortality, T - 5 68.84 53.79 15.05 68.89 0.05Mortality, T - 1 67.79 51.73 16.06 67.69 0.10
Guatemala GDP per capita 1,778.54 1,894.97 116.43 1,536.35 242.19Democracy 0.27 0.33 0.06 0.44 0.17Lower-primary education 33.44 40.37 6.93 33.51 0.07Urbanisation 79.08 67.44 11.64 81.37 2.28Population growth 2.57 2.10 0.47 2.30 0.27Conflict 0.00 0.13 0.13 0.30 0.30Mortality, T - 10 62.87 56.94 5.94 62.97 0.10Mortality, T - 5 61.62 54.17 7.45 61.60 0.03Mortality, T - 1 60.07 51.83 8.24 60.06 0.01
Guyana GDP per capita 763.14 1,923.98 1,160.84 773.73 10.59Democracy 0.00 0.34 0.34 0.00 0.00Lower-primary education 64.80 39.48 25.32 40.76 24.04Urbanisation 51.64 68.23 16.59 80.19 28.55Population growth -0.34 2.18 2.52 3.29 3.63Conflict 0.00 0.13 0.13 0.00 0.00Mortality, T - 10 69.71 56.74 12.96 71.18 1.47Mortality, T - 5 69.79 53.94 15.85 69.67 0.12Mortality, T - 1 70.15 51.54 18.61 69.52 0.62
Honduras GDP per capita 932.33 1,956.78 1,024.45 1,117.17 184.85Democracy 1.00 0.43 0.57 0.36 0.64Lower-primary education 52.97 38.96 14.01 34.34 18.63Urbanisation 53.98 62.88 8.90 76.08 22.10Population growth 2.97 2.00 0.97 2.13 0.84Conflict 0.00 0.13 0.13 0.01 0.01

Mortality, T - 10 64.57 55.21 9.36 64.56 0.00Mortality, T - 5 61.68 52.40 9.29 61.68 0.00Mortality, T - 1 59.54 50.09 9.45 59.54 0.00
Hungary GDP per capita 5,319.15 1,822.84 3,496.31 1,976.00 3,343.15Democracy 0.18 0.41 0.23 0.30 0.12Lower-primary education 65.48 38.90 26.58 56.23 9.25Urbanisation 20.60 65.51 44.91 34.59 13.99Population growth -0.29 2.11 2.40 0.27 0.55Conflict 0.00 0.13 0.13 0.00 0.00Mortality, T - 10 35.81 56.57 20.76 35.84 0.03Mortality, T - 5 34.91 53.77 18.87 34.89 0.02Mortality, T - 1 34.19 51.39 17.20 34.20 0.01
Israel GDP per capita 11,337.90 1,668.06 9,669.84 2,618.32 8,719.59Democracy 1.00 0.27 0.73 0.09 0.91Lower-primary education 27.95 42.80 14.84 58.11 30.15Urbanisation 16.08 71.94 55.85 36.67 20.59Population growth 2.05 2.20 0.14 0.59 1.47Conflict 0.09 0.09 0.01 0.00 0.09Mortality, T - 10 13.36 58.35 44.99 16.61 3.26Mortality, T - 5 11.42 55.58 44.16 14.61 3.19Mortality, T - 1 10.28 53.53 43.25 13.15 2.87
Jamaica GDP per capita 2,779.54 1,882.10 897.44 2,779.14 0.40Democracy 1.00 0.35 0.65 0.35 0.65Lower-primary education 62.55 39.34 23.22 38.80 23.75Urbanisation 29.82 67.00 37.19 71.65 41.83Population growth 1.15 2.10 0.95 2.77 1.61Conflict 0.00 0.12 0.12 0.02 0.02

Mortality, T - 10 53.81 56.61 2.80 53.74 0.07Mortality, T - 5 51.78 53.89 2.11 51.84 0.06Mortality, T - 1 50.96 51.48 0.52 50.92 0.04
Kenya GDP per capita 419.10 1,981.68 1,562.58 361.19 57.91Democracy 0.00 0.56 0.56 0.29 0.29Lower-primary education 44.81 38.61 6.20 24.92 19.89Urbanisation 65.10 59.43 5.67 84.08 18.98Population growth 3.51 1.94 1.57 1.22 2.29Conflict 0.00 0.11 0.11 0.00 0.00Mortality, T - 10 84.12 53.53 30.59 84.11 0.01Mortality, T - 5 83.62 50.55 33.07 83.33 0.28Mortality, T - 1 82.66 48.50 34.16 82.55 0.11
Mali GDP per capita 220.90 1,939.47 1,718.57 602.81 381.91Democracy 0.00 0.34 0.34 0.09 0.09Lower-primary education 7.59 41.11 33.52 16.12 8.52Urbanisation 151.05 65.39 85.66 116.47 34.58Population growth 1.81 2.12 0.31 2.15 0.34Conflict 0.00 0.13 0.13 0.16 0.16Mortality, T - 10 82.46 56.38 26.08 82.42 0.04Mortality, T - 5 80.03 53.65 26.38 80.05 0.02Mortality, T - 1 77.93 51.32 26.61 77.92 0.01
Mauritania GDP per capita 418.42 2,016.20 1,597.78 1,254.11 835.69Democracy 0.00 0.66 0.66 0.21 0.21Lower-primary education 32.16 38.29 6.12 36.29 4.12Urbanisation 79.34 56.10 23.24 77.71 1.63Population growth 2.78 1.92 0.87 2.89 0.11Conflict 0.00 0.08 0.08 0.00 0.00

Mortality, T - 10 65.01 52.91 12.09 64.59 0.41Mortality, T - 5 58.68 50.12 8.56 58.80 0.12Mortality, T - 1 55.54 48.42 7.12 55.71 0.17
Mexico GDP per capita 5,186.96 1,781.34 3,405.62 1,873.68 3,313.28Democracy 0.00 0.30 0.30 0.01 0.01Lower-primary education 47.69 40.77 6.92 47.65 0.04Urbanisation 53.97 72.47 18.50 50.50 3.47Population growth 2.36 2.18 0.18 1.86 0.50Conflict 0.00 0.11 0.11 0.00 0.00Mortality, T - 10 36.51 58.63 22.12 36.03 0.48Mortality, T - 5 33.13 55.82 22.69 32.88 0.26Mortality, T - 1 31.05 53.56 22.51 31.35 0.30
Mozambique GDP per capita 138.96 2,024.19 1,885.23 257.18 118.22Democracy 0.18 0.65 0.47 0.38 0.19Lower-primary education 13.67 38.81 25.14 10.97 2.71Urbanisation 158.41 53.84 104.57 130.38 28.03Population growth 1.86 1.94 0.08 2.04 0.18Conflict 0.64 0.06 0.57 0.01 0.63Mortality, T - 10 81.67 52.44 29.24 78.48 3.20Mortality, T - 5 75.00 49.65 25.35 76.16 1.16Mortality, T - 1 73.02 47.92 25.10 74.38 1.37
Nepal GDP per capita 160.75 1,978.83 1,818.08 243.24 82.49Democracy 0.18 0.46 0.27 0.09 0.09Lower-primary education 3.12 40.39 37.26 4.87 1.75Urbanisation 115.12 61.14 53.98 138.31 23.19Population growth 2.33 2.02 0.31 2.86 0.53Conflict 0.00 0.13 0.13 0.00 0.00

Mortality, T - 10 93.62 54.38 39.24 86.34 7.28Mortality, T - 5 92.34 51.52 40.82 85.24 7.10Mortality, T - 1 91.15 49.19 41.96 84.63 6.51
Nicaragua GDP per capita 950.74 1,956.25 1,005.51 1,344.35 393.60Democracy 0.18 0.46 0.27 0.18 0.00Lower-primary education 30.75 39.60 8.85 31.54 0.80Urbanisation 59.72 62.72 3.00 60.14 0.42Population growth 2.41 2.01 0.40 2.17 0.24Conflict 0.55 0.12 0.43 0.01 0.54Mortality, T - 10 49.82 55.63 5.81 49.85 0.03Mortality, T - 5 48.62 52.77 4.15 48.62 0.00Mortality, T - 1 47.66 50.43 2.77 47.65 0.01
Niger GDP per capita 218.22 2,000.85 1,782.63 330.10 111.88Democracy 0.36 0.60 0.23 0.37 0.00Lower-primary education 5.91 39.43 33.52 22.57 16.66Urbanisation 136.45 55.91 80.54 84.07 52.38Population growth 3.04 1.93 1.11 1.69 1.34Conflict 0.00 0.09 0.09 0.00 0.00Mortality, T - 10 85.69 52.92 32.77 85.78 0.09Mortality, T - 5 84.71 49.94 34.77 84.93 0.22Mortality, T - 1 84.39 48.02 36.37 83.98 0.41
Paraguay GDP per capita 942.76 1,934.58 991.82 1,971.35 1,028.59Democracy 0.09 0.37 0.28 0.27 0.18Lower-primary education 63.39 39.31 24.08 43.38 20.01Urbanisation 44.44 66.59 22.15 46.48 2.04Population growth 2.81 2.06 0.76 1.92 0.90Conflict 0.00 0.12 0.12 0.01 0.01

Mortality, T - 10 58.86 56.47 2.39 58.85 0.01Mortality, T - 5 55.75 53.78 1.98 55.76 0.01Mortality, T - 1 52.79 51.43 1.36 52.79 0.00
Peru GDP per capita 2,227.36 1,919.78 307.58 5,738.97 3,511.61Democracy 1.00 0.43 0.57 0.62 0.38Lower-primary education 36.52 39.43 2.92 36.49 0.02Urbanisation 67.54 62.50 5.04 61.60 5.94Population growth 2.27 2.02 0.25 2.11 0.16Conflict 0.64 0.11 0.52 0.18 0.46Mortality, T - 10 34.82 56.06 21.24 35.28 0.46Mortality, T - 5 32.72 53.22 20.50 32.84 0.12Mortality, T - 1 31.10 50.90 19.80 30.96 0.14
Philippines GDP per capita 901.25 1,920.03 1,018.78 1,718.48 817.23Democracy 0.27 0.33 0.06 0.66 0.38Lower-primary education 49.20 39.92 9.27 45.79 3.41Urbanisation 50.76 68.25 17.50 64.80 14.04Population growth 2.72 2.09 0.62 2.18 0.54Conflict 0.73 0.10 0.62 0.41 0.32Mortality, T - 10 63.37 56.92 6.44 63.32 0.05Mortality, T - 5 59.21 54.24 4.97 59.23 0.02Mortality, T - 1 54.67 51.98 2.69 54.67 0.01
Benin GDP per capita 367.64 1,964.31 1,596.67 1,323.19 955.55Democracy 0.00 0.42 0.42 0.02 0.02Lower-primary education 8.12 40.54 32.42 21.51 13.40Urbanisation 118.66 62.71 55.96 118.63 0.03Population growth 2.94 2.02 0.92 1.86 1.08Conflict 0.00 0.13 0.13 0.27 0.27
Mortality, T - 10 72.66 55.52 17.15 72.64 0.02Mortality, T - 5 69.20 52.79 16.41 69.22 0.02Mortality, T - 1 66.27 50.47 15.80 66.26 0.01
Poland GDP per capita 3,596.38 1,872.06 1,724.32 3,596.08 0.31Democracy 0.18 0.41 0.23 0.21 0.03Lower-primary education 53.72 39.23 14.48 53.72 0.00Urbanisation 17.98 65.58 47.60 37.79 19.81Population growth 0.71 2.08 1.37 0.71 0.00Conflict 0.00 0.13 0.13 0.00 0.00Mortality, T - 10 41.91 56.40 14.48 41.91 0.01Mortality, T - 5 40.06 53.63 13.57 40.10 0.04Mortality, T - 1 38.78 51.26 12.48 38.74 0.03
South Africa GDP per capita 2,530.39 1,911.12 619.26 2,530.62 0.24Democracy 1.00 0.43 0.57 0.56 0.44Lower-primary education 47.02 39.13 7.89 47.03 0.01Urbanisation 54.20 62.88 8.68 47.88 6.32Population growth 2.36 2.02 0.34 2.36 0.00Conflict 0.55 0.12 0.43 0.01 0.53Mortality, T - 10 51.41 55.59 4.18 51.60 0.19Mortality, T - 5 50.10 52.73 2.63 49.97 0.12Mortality, T - 1 47.96 50.42 2.46 48.05 0.09
Bolivia GDP per capita 987.41 1,991.52 1,004.11 1,480.87 493.46Democracy 0.36 0.29 0.08 0.05 0.31Lower-primary education 27.54 42.81 15.27 36.11 8.57Urbanisation 112.95 68.91 44.04 111.55 1.39Population growth 2.15 2.19 0.04 2.15 0.00Conflict 0.00 0.09 0.09 0.00 0.00

Mortality, T - 10 58.69 56.93 1.76 58.11 0.58Mortality, T - 5 54.55 54.23 0.32 54.41 0.14Mortality, T - 1 50.50 52.28 1.78 51.53 1.04
Uganda GDP per capita 169.53 1,891.73 1,722.21 236.76 67.23Democracy 0.46 0.33 0.12 0.04 0.42Lower-primary education 33.28 40.18 6.90 5.63 27.65Urbanisation 121.42 67.77 53.65 121.54 0.12Population growth 3.15 2.11 1.04 2.37 0.79Conflict 0.73 0.12 0.61 0.00 0.72Mortality, T - 10 92.72 57.10 35.62 92.98 0.26Mortality, T - 5 91.53 54.38 37.15 91.48 0.05Mortality, T - 1 90.12 52.06 38.06 90.13 0.01
Uruguay GDP per capita 2,784.92 1,895.24 889.68 7,004.14 4,219.22Democracy 0.55 0.40 0.15 0.85 0.31Lower-primary education 54.04 39.22 14.82 43.68 10.36Urbanisation 26.11 65.35 39.24 21.63 4.48Population growth 0.65 2.08 1.44 1.69 1.04Conflict 0.00 0.13 0.13 0.04 0.04Mortality, T - 10 14.61 57.18 42.57 14.49 0.12Mortality, T - 5 12.81 54.40 41.60 12.75 0.05Mortality, T - 1 11.37 52.04 40.67 11.71 0.34
Zambia GDP per capita 489.73 1,979.67 1,489.93 2,605.18 2,115.45Democracy 0.27 0.55 0.28 0.31 0.04Lower-primary education 39.55 38.76 0.79 53.47 13.93Urbanisation 109.34 58.17 51.17 42.40 66.93Population growth 2.96 1.95 1.00 -0.28 3.24Conflict 0.00 0.11 0.11 0.00 0.00

Mortality, T - 10 60.25 54.21 6.03 60.48 0.24Mortality, T - 5 60.49 51.21 9.28 60.77 0.27Mortality, T - 1 61.49 49.10 12.39 61.00 0.49
Botswana GDP per capita 602.73 2,261.02 1,658.29 242.47 360.27Democracy 1.00 0.43 0.57 0.00 1.00Lower-primary education 42.12 40.17 1.96 4.16 37.97Urbanisation 72.74 82.17 9.43 183.21 110.47Population growth 3.53 2.18 1.35 1.68 1.85Conflict 0.00 0.04 0.04 0.00 0.00Mortality, T - 10 93.19 58.19 35.00 86.03 7.16Mortality, T - 5 88.89 56.00 32.89 84.16 4.74Mortality, T - 1 85.51 54.33 31.19 82.46 3.05
Brazil GDP per capita 2,638.48 1,908.03 730.45 2,676.29 37.81Democracy 0.64 0.44 0.19 0.64 0.00Lower-primary education 58.14 38.81 19.33 49.68 8.47Urbanisation 59.79 62.72 2.93 38.73 21.07Population growth 2.04 2.02 0.02 1.98 0.06Conflict 0.00 0.13 0.13 0.00 0.00Mortality, T - 10 33.63 56.09 22.46 33.49 0.14Mortality, T - 5 29.30 53.32 24.02 29.51 0.21Mortality, T - 1 26.08 51.05 24.97 26.22 0.14
Bulgaria GDP per capita 2,490.96 1,912.25 578.72 2,486.31 4.65Democracy 0.18 0.46 0.27 0.18 0.00Lower-primary education 46.22 39.16 7.06 42.77 3.44Urbanisation 19.81 63.86 44.05 47.18 27.37Population growth -0.24 2.09 2.33 2.10 2.34Conflict 0.00 0.13 0.13 0.01 0.01
Mortality, T - 10 37.40 55.99 18.59 37.37 0.03Mortality, T - 5 35.00 53.16 18.16 35.03 0.03Mortality, T - 1 33.62 50.83 17.21 33.59 0.03

Appendix 3. Countries and year of liberalization Country Year Country YearAlbania 1992 Mexico 1986Cameroon 1993 Mozambique 1995Chile 1976 Nepal 1991Colombia 1986 Nicaragua 1991Costa Rica 1986 Niger 1994Ecuador 1991 Paraguay 1989El Salvador 1989 Peru 1991Argentina 1991 Philippines 1988Ghana 1985 Benin 1990Guatemala 1988 Poland 1990Guyana 1988 South Africa 1991Honduras 1991 Bolivia 1985Hungary 1990 Uganda 1988Israel 1985 Uruguay 1990Jamaica 1989 Zambia 1993Kenya 1993 Botswana 1979Mali 1988 Brazil 1991Mauritania 1995 Bulgaria 1991

Appendix 4. Alternative RMSPE cut-offs
Test Average effect of trade liberalization, %
95% confidence interval
RMSPE cut-off: mean pre-intervention RMSPE -0.15 -3.93 to 1.47
RMSPE cut-off: 3 x mean pre-intervention RMSPE -0.16 -4.21 to 1.58
Equal country weights -0.56 -2.04 to 2.18

Appendix 5. Un-weighted treatment effects and 95% confidence intervals
Notes: 95% confidence intervals are estimated from the (un-weighted) mean effect in 5,000 placebo experiments.

Appendix 6. Leave-one-out analysis of liberalisation effects by country in all donor-pool specifications
Notes: The RMSPE Ratio is the ratio of the pre-intervention RMSPE in the model using the specified comparison group (triangles=all countries, circles=same region) to the RMSPE in my original specification using all countries. Higher ratios indicate better model fit.

Appendix 7. Leave-one-out analysis of liberalisation effects by country: weighted mean across all alternative donor-pool specifications
Notes: The RMSPE Ratio is the ratio of the pre-intervention RMSPE in the model using the specified comparison group (triangles=all countries, circles=same region) to the RMSPE in my original specification using all countries. Higher ratios indicate better model fit.