appendix b 2013 dp water quality sampling reports
DESCRIPTION
ÂTRANSCRIPT

March 24, 2013 Report
Dudley Pond Water Quality Sampling Program Author - Toni Moores
This document is part of an ongoing Surface Water Quality Committee (SWQC) water quality sampling program initiated for Dudley Pond. The objectives of the Program are to gather Dudley Pond water quality data that will be used to:
Compare to similar water quality data gathered in the past at Dudley Pond.
Track the trophic index of Dudley Pond during the spring, summer and fall of each year. Summary
On March 24, 2013 water quality data was gathered at three sample points and at three depths at each sample point.
Water quality parameters such as, pH, oxidation – reduction potential (ORP), dissolved oxygen (DO), dissolved oxygen % saturation and temperature were measured at three depths at each of the three sample points by SWQC members using a YSI Multimeter. Water and Secchi depths were measured at each of the three sample points.
Samples were gathered by SWQC members and analyzed by Nashoba Analytical LLC.
Based on uniform values top to bottom the Pond was relatively well mixed and therefore it is assumed that the sampling occurred around the time of the spring turnover (water column mixing).
Based on a number of parameters shown below the water quality found on March 24, 2013 was better than the water quality found during the April 4, 2011 or the March 18, 2012.
Date TSI Chlorophyll a Secchi Depth Total Phosphorus
April 4, 2011 31 - 49 2.72 – 3.99 ppb 12’ 1” 10 – 40 ppb
March 18, 2012 39 - 47 1.98 – 4.62 ppb 12’ 6” 10 – 20 ppb
March 24, 2013 35 - 43 1.39 – 4.46 ppb 14’ 4” Non-detect
Background Historically Dudley Pond has been sampled most frequently at the “deep hole” (Sample Point 25) on Dudley Pond. In order to have data sets that are comparable to historical data, samples were gathered at locations 24, 25 and 27 as indicated in Figure 1. Two of these sample locations correspond to the sample locations used in the Larkin (1978) and IEP (1983) reports. Line-of-site intersections were used to locate sampling points.
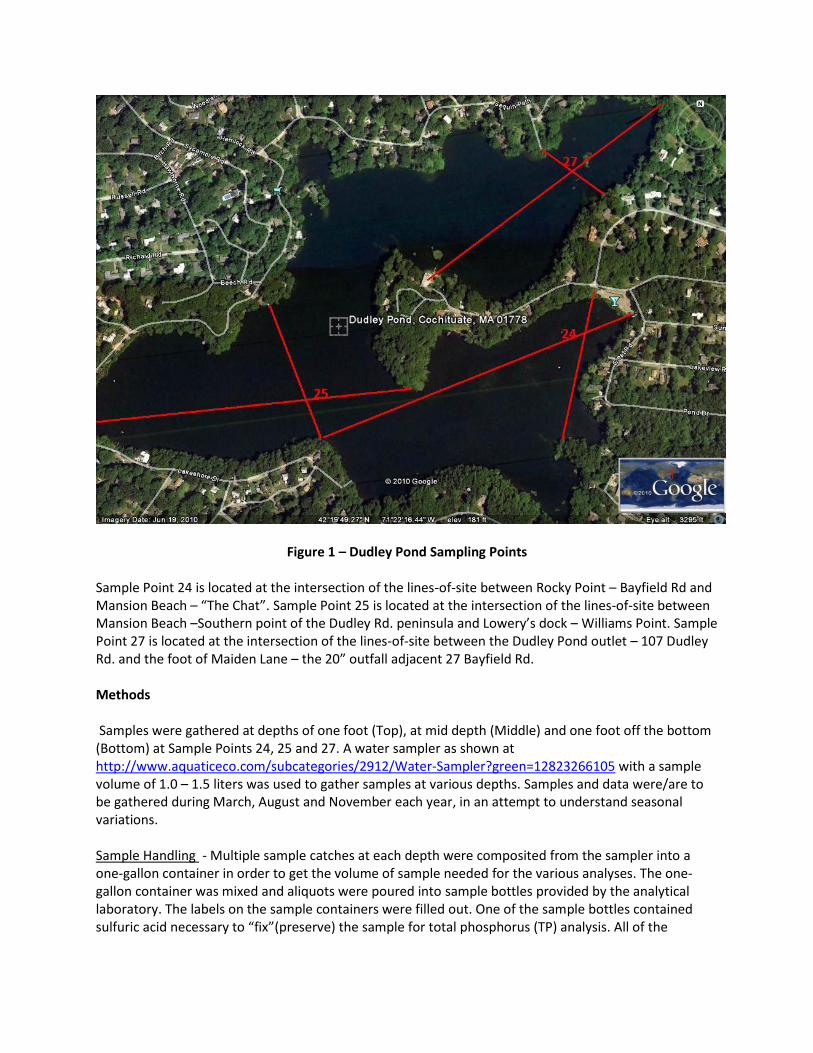
Figure 1 – Dudley Pond Sampling Points Sample Point 24 is located at the intersection of the lines-of-site between Rocky Point – Bayfield Rd and Mansion Beach – “The Chat”. Sample Point 25 is located at the intersection of the lines-of-site between Mansion Beach –Southern point of the Dudley Rd. peninsula and Lowery’s dock – Williams Point. Sample Point 27 is located at the intersection of the lines-of-site between the Dudley Pond outlet – 107 Dudley Rd. and the foot of Maiden Lane – the 20” outfall adjacent 27 Bayfield Rd. Methods Samples were gathered at depths of one foot (Top), at mid depth (Middle) and one foot off the bottom (Bottom) at Sample Points 24, 25 and 27. A water sampler as shown at http://www.aquaticeco.com/subcategories/2912/Water-Sampler?green=12823266105 with a sample volume of 1.0 – 1.5 liters was used to gather samples at various depths. Samples and data were/are to be gathered during March, August and November each year, in an attempt to understand seasonal variations. Sample Handling - Multiple sample catches at each depth were composited from the sampler into a one-gallon container in order to get the volume of sample needed for the various analyses. The one-gallon container was mixed and aliquots were poured into sample bottles provided by the analytical laboratory. The labels on the sample containers were filled out. One of the sample bottles contained sulfuric acid necessary to “fix”(preserve) the sample for total phosphorus (TP) analysis. All of the

samples were stored in a cooler containing ice and delivered with chain of custody documents to the analytical laboratory the day after the samples were gathered. Sample Analyses - A SWQC owned YSI 556 Multimeter was used to measure the following parameters at the same time that the samples are collected. Date Time Weather Barometric Pressure Location Depth pH ORP Dissolved Oxygen Dissolved Oxygen % Saturation Temperature Secchi Depth (http://water.epa.gov/type/rsl/monitoring/155.cfm) Nashoba Analytical, LLC was used to perform analyses of samples from Sample Points 24, 25 and 27. Analyses were performed by Nashoba Analytical, LLC for the following parameters. Total Phosphorus, ppm (as P) (Soluble + Insoluble) Orthophosphate, ppm (as P) (Soluble) Ammonia, ppm (as N) Nitrate/Nitrite, ppm (as N) Total Nitrogen, ppm (as N) Chlorophyll a, ug/l (ppb) Carlson Trophic State Index – TP concentrations, Chlorophyll a and Secchi depths were used to plot the Carlson Trophic State Index (TSI) for the three sample points in Dudley Pond. Since the Secchi Depths for Sample Points 24 and 27 were greater than the depth of the water, it was assumed that the Secchi Depths for all of the sample points were the same as Sample Point 25. In order to obtain an average TP concentration for each sample point the three Total Phosphorus concentrations for the sample point were averaged. In order to obtain an average Chlorophyll a concentrations for each sample location, the average of the chlorophyll a concentration at each sample point was calculated using the average of the chlorophyll a concentrations at the three depths. (see http://www.aslo.org/lo/toc/vol_22/issue_2/0361.pdf for information re Carlson Trophic State index) Results The results of the March 24, 2013 sampling are shown in Figure 2. The analytical data was plotted to determine the TSI and is shown in Figure 3.

Figure 2 – March 24, 2013 Dudley Pond Water Quality Data

Figure 3 – Carlson Trophic State Index Results for March 24, 2013, Sample Points 24, 25 & 27

Discussion YSI Measurements - Measurements taken with the YSI 556 Multimeter varied from location to location and by depth.
pH – The pH for all three sample points ranged from 6.09 to 7.07, without much variation from top to bottom, which indicates fairly good mixing within the water column.
DO and DO Percent Saturation – DO percent saturation measurements ranged from 106.6 % to 115 %. DO and DO Percent Saturation measurements were relatively uniform top to bottom at each sample point, which indicates relatively good mixing, without a lot of benthic photosynthesis despite good sunlight penetration.
Temperature – The temperature variation was 4.2 to 5.45 C, with bottom temperatures slightly lower than surface temperatures. The lack of significant temperature variation from top to bottom at each sample point indicates vertical mixing in the water column, which suggests that this sampling date was probably close to the spring turnover of the Pond.
Oxidation Reduction Potential (ORP) – The ORP ranged from 168 mv to 222 mv and was relatively uniform at each of the sample points, top to bottom. During past samplings relatively large negative ORPs have been measured at the bottom of Sample Point 25, which is indicative of temperatures above 4 C, active anaerobic decomposition, low dissolved oxygen and minimal mixing (below the thermocline). The relatively high ORP (196.4 mv) at the bottom of Sample Point 25 on March 24, 2013 was unusual and is probably due to water column mixing and low anaerobic biodegradation, a result of the relatively low temperature (4.2 C). Biological activity approaches zero when the temperature is 4 C or below.
Secchi Depths – Secchi depths (a measure of color, turbidity and suspended solids, such as algae) on March 24, 2013 was 14.33’ (4.34 m). Accurate Secchi depths at Sample Points 24 and 27 could not be obtained because the bottom was clearly visible implying the Secchi depth was greater than the bottom depth. Therefore it has been assumed that the Secchi depths at Sample Points 24 and 27 were similar to that at Sample Point 25, which was 14.34 feet (4.34 m). Phosphorus Concentrations – There was no phosphorus found at any of the sample points at any depths. Nitrogen Compounds – Nitrate concentrations ranged from 0.34 mg/l to 0.5 mg/l and were found at all depths at all sample points. The lack of ammonia and the presence of nitrate indicate that nitrification had occurred throughout the water column. Alpha Chlorophyll (Chlorophyll a) – On March 24, 2013 Chlorophyll a, an indirect measure of the algae concentration, ranged from 1.39 ug/l (ppb) to 4.46 ug/l (ppb). It is not clear why the Chlorophyll a measurement was much higher at the surface of Sample Point 25 than at any of the other locations. Carlson Trophic State Index – As Dudley Pond is primarily used for recreational purposes a TSI less than 50 is tolerable and less than 40 would be great. The TSI on March 24, 2013 for the three sample points ranged from 35 to 43 indicating that the Dudley Pond trophic index was in the high oligotrophic to low mesotrophic range. For the March 24, 2013 the TSI was based on Secchi and Chlorophyll a measurements, since there was no phosphorus contained in any of the samples gathered.

August 5, 2013 Report Dudley Pond Water Quality Sampling Program
Author - Toni Moores This document is part of an ongoing Surface Water Quality Committee (SWQC) water quality sampling program initiated for Dudley Pond. The objectives of the Program are to gather Dudley Pond water quality data that will be used to:
Compare to similar water quality data gathered in the past at Dudley Pond.
Track the trophic index of Dudley Pond during the spring, summer and fall of each year. Summary
On August 5, 2013 water quality data was gathered at three depths at three sample points.
Water quality parameters such as, pH, oxidation – reduction potential (ORP), dissolved oxygen (DO), dissolved oxygen % saturation and temperature were measured at three depths at each of the three sample points by SWQC members using a YSI Multimeter. Water and Secchi depths were measured at each of the three sample points.
Samples were gathered by SWQC members and analyzed by Nashoba Analytical LLC.
Based on a number of parameters shown below the water quality found on August 5, 2013 was much better than than August 24, 1981, better than the water quality found during the August 5, 2012 and about the same as the water quality on September 11, 2011.
Date TSI * Chlorophyll a * Secchi Depth Total Phosphorus*
August 24, 1981 49 - 54 7.0 2.1 30 ppb
Sept. 11, 2011 44 - 48 4.41 – 6.3 ppb 9.83’ ND
August 5, 2012 48 - 52 2.9 – 17.29 ppb 6.75’ ND
August 5, 2013 43 - 48 4.65 – 13.03** ppb 10.75’ 20** ppb
* Above the thermocline (~ 12 feet) **Contaminated sample Background Historically Dudley Pond has been sampled most frequently at the “deep hole” (Sample Point 25) on Dudley Pond. In order to have data sets that are comparable to historical data, samples were gathered at locations 24, 25 and 27 as indicated in Figure 1. Two of these sample locations correspond to the sample locations used in the Larkin (1978) and IEP (1983) reports. Line-of-site intersections were used to locate sampling points.

Figure 1 – Dudley Pond Sampling Points Sample Point 24 is located at the intersection of the lines-of-site between Rocky Point – Bayfield Rd and Mansion Beach – “The Chat”. Sample Point 25 is located at the intersection of the lines-of-site between Mansion Beach –Southern point of the Dudley Rd. peninsula and Lowery’s dock – Williams Point. Sample Point 27 is located at the intersection of the lines-of-site between the Dudley Pond outlet – 107 Dudley Rd. and the foot of Maiden Lane – the 20” outfall adjacent 27 Bayfield Rd. Methods Samples were gathered at depths of one foot (Top), at mid depth (Middle) and one foot off the bottom (Bottom) at Sample Points 24, 25 and 27. A water sampler as shown at http://www.aquaticeco.com/subcategories/2912/Water-Sampler?green=12823266105 with a sample volume of 1.0 – 1.5 liters was used to gather samples at various depths. Samples and data were/are to be gathered during March, August and November each year, in an attempt to understand seasonal variations. Sample Handling - Multiple sample catches at each depth were composited from the sampler into a one-gallon container in order to get the volume of sample needed for the various analyses. The one-gallon container was mixed and aliquots were poured into sample bottles provided by the analytical laboratory. The labels on the sample containers were filled out. One of the sample bottles contained sulfuric acid necessary to “fix”(preserve) the sample for total phosphorus (TP) analysis. All of the

samples were stored in a cooler containing ice and delivered with chain of custody documents to the analytical laboratory the day after the samples were gathered. Sample Analyses - A SWQC owned YSI 556 Multimeter was used to measure the following parameters at the same time that the samples are collected. Date Time Weather Barometric Pressure Location Depth pH ORP Dissolved Oxygen Dissolved Oxygen % Saturation Temperature Secchi Depth (http://water.epa.gov/type/rsl/monitoring/155.cfm) Nashoba Analytical, LLC was used to perform analyses of samples from Sample Points 24, 25 and 27. Analyses were performed by Nashoba Analytical, LLC for the following parameters. Total Phosphorus, ppm (as P) (Soluble + Insoluble) Orthophosphate, ppm (as P) (Soluble) Ammonia, ppm (as N) Nitrate/Nitrite, ppm (as N) Total Nitrogen, ppm (as N) Chlorophyll a, ug/l (ppb) Carlson Trophic State Index – TP concentrations, Chlorophyll a and Secchi depths were used to plot the Carlson Trophic State Index (TSI) for the three sample points in Dudley Pond. Since the Secchi Depths for Sample Points 24 and 27 were greater than the depth of the water, it was assumed that the Secchi Depths for all of the sample points were the same as Sample Point 25. In order to obtain an average TP concentration for each sample point the three Total Phosphorus concentrations for the sample point were averaged. In order to obtain an average Chlorophyll a concentrations for each sample location, the average of the chlorophyll a concentration at each sample point was calculated using the average of the chlorophyll a concentrations at the three depths. (see http://www.aslo.org/lo/toc/vol_22/issue_2/0361.pdf for information re Carlson Trophic State index) Results The results of the August 5, 2013 sampling are shown in Figure 2. The analytical data was plotted to determine the TSI and is shown in Figure 3.

Figure 2 – August 5, 2013 Dudley Pond Water Quality Data

Figure 3 – Carlson Trophic State Index Results for August 5, 2013, Sample Points 24, 25 & 27

Discussion YSI Measurements - Measurements taken with the YSI 556 Multimeter varied from location to location and by depth.
pH – The pH for all three sample points ranged from 6.79 to 8.07. The low pH of 6.79 was found in the deep hole (bottom) at Sample Point 25, which is not unusual and is probably due to bacterial decomposition of biomass and the absence of photosynthesis. The high pH of 8.07 was found at the mid-point of Sample Point 27 and is most likely due to a lack of good mixing and carbon dioxide, a weak acid, being consumed due to photosynthesis. The balance of the pH readings were similar without much variation, which could be the result of mixing within the water column.
DO and DO Percent Saturation – DO percent saturation measurements ranged from 0.8 % found at the bottom of Sample Point 25 to 110.7 % at 3 feet at Sample Point 27. DO Percent Saturation measurements increased with depth at Sample Points 24 and 27 indicating limited mixing, good light penetration and benthic photosynthesis. The DO percent saturation measurements at Sample Point 25 decreased with depth. The low DO percent saturation measurement at the bottom of Sample Point 25 indicates no photosynthesis, anoxic bacterial decomposition of biomass and a lack of mixing below the thermocline, which has been measured at about 12 feet in the past.
Temperature – The temperature ranged from 14.4 C at the bottom of Sample Point 25 to 25.82 C at the surface of Sample Point 27. In all cases bottom temperatures were lower than surface temperatures. The bottom temperature at Sample Point 25 was significantly less than the surface temperature due to the thermocline. The slight temperature decrease from top to bottom at each sample point down to a depth of 12 feet indicates some vertical mixing in the water column above 12 feet.
Oxidation Reduction Potential (ORP) – The ORP ranged from -20 mv at the bottom at Sample Point 25 to 193 mv at 3 feet at Sample Point 24. Above 12 feet the ORP was relatively uniform at each of the sample points, top to bottom. During past samplings negative ORPs have been measured at the bottom of Sample Point 25, which is indicative of active anoxic decomposition, no photosynthesis, low dissolved oxygen and minimal mixing (below the thermocline).
Secchi Depths – Secchi depths (a measure of color, turbidity and suspended solids, such as algae) on August 5, 2013 was 10.75 feet (3.26 m). Accurate Secchi depths at Sample Points 24 and 27 could not be obtained because the bottom was clearly visible implying the Secchi depth was greater than the bottom depth. Therefore it has been assumed that the Secchi depths at Sample Points 24 and 27 were similar to that at Sample Point 25, which was 10.75 feet (3.26 m).
Phosphorus Concentrations – Total phosphorus was found at two locations on August 5 - 0.03 ppm at 12 feet at Sample Point 25 and 0.02 ppm at the bottom at Sample Point 27. The sample taken at the bottom at Sample Point 27 contained suspended solids including algae, which may be the reason that phosphorus was found in the sample. Nitrogen Compounds – Nitrogen compounds were not present in the samples taken except the sample at the bottom of Sample Point 27. The sample taken at the bottom at Sample Point 27 contained suspended solids including algae, which may be the reason that the total nitrogen concentration was found to be 0.88 ppm. Alpha Chlorophyll (Chlorophyll a) – On August 5, 2013 Chlorophyll a, an indirect measure of the algae concentration, for sample points above the thermocline ranged from 4.65 ug/l (ppb) at one foot at

Sample Point 27 to 13.03 ug/l (ppb) at the bottom of Sample Point 27. Chlorophyll a concentrations appear to marginally increase with depth at all sample points. This may be due to gravity settling of algae and/or the influence of benthic algae. Historically the chlorophyll a concentration in the deep hole (bottom of Sample Point 25) has been much higher than other sample points. The reason for high chlorophyll a concentrations at the bottom of Sample point 25 is not known, although the increased chlorophyll a concentration may be due to gravity settling of algae facilitated by the lack of mixing below the thermocline. The elevated chlorophyll a concentration found at the bottom of Sample Point 27 may be due to the algae that was noted in the sample. Carlson Trophic State Index – As Dudley Pond is primarily used for recreational purposes a TSI less than 50 is tolerable and less than 40 would be great. The TSI on August 5, 2013 for the three sample points ranged from 43 to 53 indicating that the Dudley Pond trophic index was in the mesotrophic range. Only Chlorophyll a concentrations in samples taken at a depths of 12 feet and less were used in the determination of the Carlson Trophic Index for August 5, 2013. The 0.03 ppm total phosphorus analysis found at 12 feet at Sample Point 25 resulted in a TSI of 53. If the high total phosphorus reading of 0.03 ppm at 12 feet at Sample Point 25 is disregarded the TSI range for August 5, 2013 would be 43 – 48, which is solidly mesotrophic and indicates relatively good recreational water quality.

1
November 15, 2013 Report
Dudley Pond Water Quality Sampling Program Author - Toni Moores, January 2014
This document is part of an ongoing Surface Water Quality Committee (SWQC) water quality sampling program initiated for Dudley Pond. The objectives of the Program are to gather Dudley Pond water quality data that will be used to:
Compare to similar water quality data gathered in the past at Dudley Pond.
Track the trophic index of Dudley Pond during the spring, summer and fall of each year. Summary
On November 15, 2013 water quality data was gathered at three depths at three sample points.
Water quality parameters such as, pH, oxidation – reduction potential (ORP), dissolved oxygen (DO), dissolved oxygen % saturation and temperature were measured at three depths at each of the three sample points by SWQC members using a YSI Multimeter. Water and Secchi depths were measured at each of the three sample points.
Samples were gathered by SWQC members and analyzed by Nashoba Analytical LLC.
Based on the parameters shown below the water quality found on November 15, 2013 was worse than the two previous November samplings and worse than the Secchi depth on November 18, 2007. Historical November water quality data for comparison is rare for Dudley Pond.
Date TSI Chlorophyll a Secchi Depth Total Phosphorus
Nov 15, 2013 49 - 51 7.4 ppb 2.12 m ND
Nov 11, 2012 42 - 46 3.92 ppb 3.66 m ND
Nov 13, 2011 42 - 44 3.36 ppb 3.4 m ND
Nov 18, 2007 - - 2.85 m -
The water at Sample Point 27 was slightly colder, slightly more acidic and had a considerably higher (80%) ORP than Sample Points 24 and 25. The reason for this is not known; however, this may be due to groundwater inflow and/or surface water runoff.
Background Historically Dudley Pond has been sampled most frequently at the “deep hole” (Sample Point 25) on Dudley Pond. In order to have data sets that are comparable to historical data, samples were gathered at locations 24, 25 and 27 as indicated in Figure 1. Two of these sample locations correspond to the sample locations used in the Larkin (1978) and IEP (1983) reports. Line-of-site intersections were used to locate sampling points.

2
Figure 1 – Dudley Pond Sampling Points Sample Point 24 is located at the intersection of the lines-of-site between Rocky Point – Bayfield Rd and Mansion Beach – “The Chat”. Sample Point 25 is located at the intersection of the lines-of-site between Mansion Beach –Southern point of the Dudley Rd. peninsula and Lowery’s dock – Williams Point. Sample Point 27 is located at the intersection of the lines-of-site between the Dudley Pond outlet – 107 Dudley Rd. and the foot of Maiden Lane – the 20” outfall adjacent 27 Bayfield Rd. Methods Samples were gathered at depths of one foot (Top), at mid depth (Middle) and one foot off the bottom (Bottom) at Sample Points 24, 25 and 27. A water sampler as shown at http://www.aquaticeco.com/subcategories/2912/Water-Sampler?green=12823266105 with a sample volume of 1.0 – 1.5 liters was used to gather samples at various depths. Samples and data were/are to be gathered during March, August and November each year, in an attempt to understand seasonal variations. Sample Handling - Multiple sample catches at each depth were composited from the sampler into a one-gallon container in order to get the volume of sample needed for the various analyses. The one-gallon container was mixed and aliquots were poured into sample bottles provided by the analytical laboratory. The labels on the sample containers were filled out. One of the sample bottles contained sulfuric acid necessary to “fix”(preserve) the sample for total phosphorus (TP) analysis. All of the

3
samples were stored in a cooler containing ice and delivered with chain of custody documents to the analytical laboratory the day after the samples were gathered. Sample Analyses - A SWQC owned YSI 556 Multimeter was used to measure the following parameters at the same time that the samples are collected. Date Time Weather Barometric Pressure Location Depth pH ORP Dissolved Oxygen Dissolved Oxygen % Saturation Temperature Secchi Depth (http://water.epa.gov/type/rsl/monitoring/155.cfm) Nashoba Analytical, LLC was used to perform analyses of samples from Sample Points 24, 25 and 27. Analyses were performed by Nashoba Analytical, LLC for the following parameters. Total Phosphorus, ppm (as P) (Soluble + Insoluble) Orthophosphate, ppm (as P) (Soluble) Ammonia, ppm (as N) Nitrate/Nitrite, ppm (as N) Total Nitrogen, ppm (as N) Chlorophyll a, ug/l (ppb) Carlson Trophic State Index – TP concentrations, Chlorophyll a and Secchi depths were used to plot the Carlson Trophic State Index (TSI) for the three sample points in Dudley Pond. Since the Secchi Depths for Sample Points 24 and 27 were greater than the depth of the water, it was assumed that the Secchi Depths for all of the sample points were the same as Sample Point 25. In order to obtain an average TP concentration for each sample point the three Total Phosphorus concentrations for the sample point were averaged. In order to obtain an average Chlorophyll a concentrations for each sample location, the average of the chlorophyll a concentration at each sample point was calculated using the average of the chlorophyll a concentrations at the three depths. (see http://www.aslo.org/lo/toc/vol_22/issue_2/0361.pdf for information re Carlson Trophic State index) Results The results of the August 5, 2013 sampling are shown in Figure 2. The analytical data was plotted to determine the TSI and is shown in Figure 3.

4
Figure 2 – November 15, 2013 Dudley Pond Water Quality Data

5
Figure 3 – Carlson Trophic State Index Results for November 15, 2013, Sample Points 24, 25 & 27

6
Discussion YSI Measurements - Measurements taken with the YSI 556 Multimeter varied from location to location and by depth.
pH – The pH for all three sample points ranged from 5.85 to 7.63, which is thought to indicate low to moderate levels of photosynthesis. There was very little pH variation from top to bottom at each of the sample points; however, the pH at Sample Point 27 was lower than Sample Points 24 and 25. It is not clear why the pH at Sample Point 27 was lower than the other two sample points. The fact that there was very little variation in pH from top to bottom at any of the sample points indicates that the fall turnover and mixing of the Pond may have been occurring.
DO and DO Percent Saturation – DO percent saturation measurements ranged from a low of 99.4 % found at the bottom of Sample Point 25 to a high of 111.2 % at the bottom of Sample Point 24. DO Percent Saturation measurements increased with depth at Sample Points 24 and 27 indicating limited mixing, good light penetration and some photosynthesis. The DO percent saturation measurements at Sample Point 25 decreased somewhat with depth, but not nearly as much as during the August sampling. This finding could indicate that photosynthesis and mixing was occurring; however, the bacterial decomposition rate was relatively low at the bottom, which is supported by a near neutral pH at the bottom.
Temperature – The temperature ranged from 5.6 C at the bottom of Sample Point 27 to 7.18 C at the surface of Sample Point 25. In all cases bottom temperatures were lower than surface temperatures. The minimal temperature decrease from top to bottom at each sample point indicates vertical mixing in the water column.
Oxidation Reduction Potential (ORP) – The ORP ranged from 139.3 mv at the bottom at Sample Point 24 to 234.5 mv at the surface of Sample Point 27. The ORP readings were relatively uniform from top to bottom at each sample point, which indicates vertical mixing; however, the ORP readings varied from sample point to sample point. The average ORPs at Sample Points 24 and 25 were approximately the same; however, the average ORP at Sample Point 25 was 87 mv or 60% higher than the average ORP at Sample Points 24 and 25. It is not obvious why the ORP at Sample Point 27 was higher than at Sample Points 24 and 25; however, groundwater and/or surface water runoff may have been responsible.
Secchi Depths – Secchi depths (a measure of color, turbidity and suspended solids, such as algae) were unusual on November 15, 2013 in that they were relatively small (poor) at all sample points. At Sample Points 24 and 27 there was a diffuse layer of decomposing weeds at about 4 – 5 feet and 7 feet (2.1 m) at Sample Point 25. Fall Secchi depths were between 3 – 4 meters in 2011 and 2012. The reason for finding this diffuse layer and low Secchi depths is not known other than possibly mixing associated with the fall turnover. This diffuse layer of decomposing weeds so close to the surface has not been seen during previous samplings.
Phosphorus Concentrations – There was no phosphorus found in any of the samples taken on November 15, 2013, which is unusual because a few solids were present in the bottom samples at Sample Points 24 and 27 and biological solids usually have phosphorus associated with them. Nitrogen Compounds – Similar nitrate concentrations (0.06 – 0.07 ppm) were found throughout the water column at Sample Point 24, which indicates biological nitrification and mixing. Nitrate (0.05 ppm) was also found at the bottom of Sample Point 25, which is unusually high for this depth and is thought due to mixing of nitrate from upper, aerobic portions of the water column. Total Nitrogen, which is a measure of organically bound nitrogen compounds, was found at about the same concentration at

7
various depths at all three sample points. This may be the result of vertical mixing of decomposition products containing organic nitrogen compounds produced at the bottom of the Pond. Alpha Chlorophyll (Chlorophyll a) – On November 15, 2013 Chlorophyll a, an indirect measure of the algae concentration, ranged from 4.24 ug/l (ppb) at three feet at Sample Point 24 to 9.79 ug/l (ppb) at the bottom of Sample Point 24. The elevated chlorophyll a concentration found at the bottom of Sample Point 24 may be due to algae that in the sample. Carlson Trophic State Index – As Dudley Pond is primarily used for recreational purposes a TSI less than 50 is tolerable and less than 40 would be great. The TSI on November 15, 2013 for the three sample points ranged from 49 to 51 indicating that the Dudley Pond trophic index was at the high end of the mesotrophic range. The relatively high TSI found on November 15, 2013 was due to relatively high Chlorophyll a concentrations and low Secchi depts. Given TSI readings in the 49 – 51 range one would have expected to see phosphorus concentrations the 20 – 30 ppb range, but none was found.