appendix c - wordpress.com c: demographics + 2050 growth scenario 178 179 178 demographics 179 and...
TRANSCRIPT

APPENDIX C:DEMOGRAPHICS +
2050 GROWTH SCENARIO

179178

179178 DEMOGRAPHICS AND 2050 GROWTH SCENARIOThis appendix summarizes current socioeconomic conditions in the Greater Des Moines area and provides a forecast of future socioeconomic conditions, also known as a growth scenario.
Current Socioeconomic ConditionsThe Des Moines Area MPO collects and reviews a variety of socioeconomic datasets in order to analyze the MPA’s transportation needs. By collecting and analyzing socioeconomic data, the Des Moines Area MPO identifies where residents live, work, shop, and travel.
General Demographic Characteristics
Figure C1 identifies growth trends in the Des Moines-West Des Moines MSA counties from 1990 to 2013. Polk County continues to possess the largest population base in the Des Moines-West Des Moines MSA. Dallas County has experienced the largest percentage of population growth from 1990 to 2013. Additionally, as noted in Figure C2, the MPA accounts for approximately 16 percent of the State of Iowa’s 2010 population. Figure C3 provides a demographic profile of Dallas, Polk, and Warren Counties from the 2010 Census.
1990 2000 2010 2013 ESTIMATE
1990 – 2013 GROWTH
State of Iowa 2,776,755 2,926,324 3,046,355 3,090,416 313,661
Des Moines - West Des Moines MSA
416,346 481,394 569,633 599,789 183,443
Dallas Co. 29,755 40,750 66,135 74,641 44,886
Guthrie Co. 10,935 11,353 10,954 10,687 -248
Madison Co. 12,483 14,019 15,679 15,448 2,965
Polk Co. 327,140 374,601 430,640 451,677 124,537
FIGURE C1: HISTORICAL AND ESTIMATED POPULATION, 1990-2013
Source: US Census Bureau

181180
2010 PERCENT OF STATE
State of Iowa 3,046,355 100%
Des Moines-West Des Moines MSA 569,633 19%
Des Moines Area MPO MPA 479,866 16%
Dallas Co. Portion of MPA 38,947 1%
Guthrie Co. Portion of MPA 0 0%
Madison Co. Portion of MPA 193 0.01%
Polk Co. Portion of MPA 423,798 14%
Warren Co. Portion of MPA 16,928 1%
FIGURE C2 DES MOINES AREA MPO MPA POPULATION, 2010
Source: US Census Bureau
DALLAS COUNTY POLK COUNTY WARREN COUNTY
Total Population 66,135 430,640 46,225
Male 32,349 211,171 22,507
Female 33,786 219,469 23,718
Age
5 - 15 Years 10,925 60,308 6,962
16 - 64 Years 42,962 290,971 30,130
65 Years and Over 6,476 46,545 6,159
Race
White 61,884 374,062 45,428
Black or African American 1245 30,929 426
American Indian and Alaska Native 351 3474 264
Asian 1958 17,817 392
Native Hawaiian and Other Pacific Islander 82 601 40
Other 1,685 14,873 275
Two or More Races 726 8,094 456
FIGURE C3 GENERAL DEMOGRAPHIC CHARACTERISTICS OF DALLAS, POLK, AND WARREN COUNTIES, 2010
Source: US Census Bureau

181180Housing Characteristics
Figure C4 provides a housing profile of Dallas, Polk, and Warren Counties. Nearly 20 percent (45,067) of all housing units were built after 2000 and the region has a 94 percent occupancy rate. Approximately five percent of the three counties of the greater Des Moines metropolitan area’s occupied housing units (households) do not have access to a vehicle, and 19 percent of the households have access to more than three vehicles.
DALLAS COUNTY
MARGIN OF ERROR
POLK COUNTY
MARGIN OF ERROR
WARREN COUNTY
MARGIN OF ERROR
Housing Occupancy
Total Housing Units 27,182 53 183,029 257 18,385 97
Occupied Housing Units 25,561 312 171,227 952 17,265 254
Vacant Housing Units 1,621 313 11,802 889 1120 243
Homeowner Vacancy Rate 1.8 0.7 1.9 0.3 0.7 0.5
Rental Vacancy Rate 5.1 2.2 5 0.8 5 2.6
Year Built
Before 1959 6,055 655 63,604 2,270 4,686 522
1960 - 2000 10,366 1,184 88,275 3,527 10,543 1,067
After 2000 10,761 707 31,150 1,270 3,156 339
Vehicles Available
No Vehicles Available 665 152 10,501 543 519 116
1 Vehicle Available 6,805 460 55,401 1,297 4,111 257
2 Vehicles Available 12,318 530 72,556 1,437 6,980 340
3 or More Vehicles Available 5,773 354 32,769 994 5,655 301
Value
Median Household Income $182,700 $4,969 $153,600 $1,214 $154,600 $3,810
FIGURE C4: SELECTED HOUSING CHARACTERISTICS FOR DALLAS, POLK, AND WARREN COUNTIES
Source: US Census Bureau American Community Survey, 2008-2012 5-year Estimates

183182 Economic Characteristics
Figure C5 provides an economic profile of Dallas, Polk, and Warren Counties. The three counties of the greater Des Moines metropolitan area, Dallas, Polk, and Warren Counties, employ approximately 75 percent of the persons aged 16 years and over. Of the workers aged 16 years and over, 76 percent commute to work in a single-occupant car, truck, or van.
DALLAS COUNTY
MARGIN OF ERROR
POLK COUNTY
MARGIN OF ERROR
WARREN COUNTY
MARGIN OF ERROR
Employment Status
Population 16 Years and Over 49,514 181 332,916 450 35,600 149
In Labor Force 37,140 666 245,184 1,487 26,111 383
Civilian Labor Force 37,040 665 244,670 1,506 26,087 383
Employed 35,749 678 230,366 1,599 24,732 410
Unemployed 1,291 286 14,304 804 1,355 191
Armed Forces 100 56 514 189 24 19
Not in Labor Force 12,374 665 87,732 1,376 9,489 335
Commuting to Work
Workers 16 Years and Over 35,207 693 226,602 1,509 24,234 417
Car, Truck, or Van -- Drove Alone 30,033 740 184,876 1,931 19,750 517
Car, Truck, or Van -- Carpooled 2,830 378 23,455 1,274 2,271 325
Public Transportation (Excluding Taxicab) 100 63 3,484 392 112 78
Walked 282 83 3,867 495 542 140
Other Means 305 164 2,279 315 146 71
Worked at Home 1,657 274 8,641 618 1,413 220
Mean Travel Time to Work (Minutes) 20.6 0.6 18.7 0.2 25.3 0.9
FIGURE C5: ECONOMIC CHARACTERISTICS FOR DALLAS, POLK, AND WARREN COUNTIES

183182
Source: US Census Bureau American Community Survey, 2008-2012 5-year Estimates
DALLAS COUNTY
MARGIN OF ERROR
POLK COUNTY
MARGIN OF ERROR
WARREN COUNTY
MARGIN OF ERROR
Industry
Civilian Employed Population 16 Years and Over 35,749 678 230,366 1,599 24,732 410
Agriculture, Forestry, Fishing and Hunting, and Mining 766 150 2,723 442 288 82
Construction 2,287 343 12,744 945 2,091 258
Manufacturing 2,969 341 18,061 868 1,437 169
Wholesale Trade 1,246 235 7,346 549 736 148
Retail Trade 3,794 425 25,435 1,149 2,990 300
Transportation and Warehousing, and Utilities 1,089 219 9,645 624 1,178 198
Information 957 241 5,937 592 492 106Finance and Insurance, and Real Estate and Rental and
Leasing8,139 572 39,232 1,420 3,484 358
Professional, Scientific, and Management, and
Administrative and Waste Management Services
3,256 351 22,420 1,174 2,124 276
Educational Services, and Health Care and Social
Assistance7,109 532 47,386 1,451 6,182 398
Arts, Entertainment, and Recreation, and
Accommodation, and Food Services
1,618 308 19,705 1,111 1,465 220
Other Services, Except Public Administration 1,273 239 9,779 778 1,061 173
Public Administration 1,246 260 9,953 692 1,204 157
Income
Median Household Income (Dollars) 71,878 2,326 58,096 1,019 62,778 2,256
Mean Household Income (Dollars) 91,057 2,744 74,256 1,096 76,578 2,769
FIGURE C5: ECONOMIC CHARACTERISTICS FOR DALLAS, POLK, AND WARREN COUNTIES (CONTINUED)

185184 2050 Growth Scenario
Summary
Introduction and BackgroundA long-range transportation plan (LRTP) must project transportation demand for persons and goods over the period of the plan. To do this, the MPO must forecast population and employment growth out to the plan’s horizon year and also identify where this growth will occur. To accomplish this, the MPO undertakes a growth scenario process that identifies a number of alternatives for how this growth may occur.
There are two main components within the growth scenario process to which alternatives may be applied: the overall growth rate and the location of growth. The MPO’s overall rate of growth historically been assumed to be a continuation of past trends or, more recently, has been based off of the Regional Economic Models, Inc. (REMI) population and employment forecasts. REMI forecasts are provided by the Iowa Department of Transportation. The location of growth has had some degree of alternatives considered, most recently in the Horizon Year 2030 Long-Range Transportation. The Horizon Year 2035 Metropolitan Transportation Plan (MTP) did not explicitly consider alternative growth scenarios, although it did allocate the MPO’s overall growth to the subarea level at the same proportions used for the 2030 plan’s final scenario.
Growth Scenario in The Tomorrow Plan
As noted in the introduction to Mobilizing Tomorrow, the region developed The Tomorrow Plan between 2010 and 2013. Throughout The Tomorrow Plan development, both components of a 2050 growth scenario were developed to some extent. For the 2035 MTP, the MPO evaluated the REMI forecast methodology for accuracy and ultimately determined it to be the source for the MPO’s population and employment forecasts moving forward. The Tomorrow Plan continued with this precedent and used REMI when updating population and employment forecasts out to the year 2050.
The Tomorrow Plan also undertook a scenario planning exercise that looked at four possible scenarios for growth in the metropolitan area through the year 2050. Each of the four scenarios used the same population and employment control totals for both the MPO boundary and each of the seven subareas within the MPO boundary. The purpose of these four scenarios was not to predict with certainty how the region will or should develop at a local level, but rather to understand how the region could develop under different circumstances and policies and what the trade-offs and impacts of each scenario might be. The scenarios were developed using a geographic information system (GIS)-based growth raster model and were aggregated to the Traffic Analysis Zone (TAZ) level for use in the MPO’s travel demand model. The four scenarios developed included:
• Scenario 1: Business As Usual (growth continues as allowed by existing zoning regulations)
• Scenario 2: Business As Usual – Small Lots (growth continues as allowed by existing zoning regulations but will develop at the highest possible densities allowed)
• Scenario 3: Future Land Use (growth will occur as identified in local community comprehensive plans)
• Scenario 4: Regional Systems (growth will be directed toward vacant properties, along transit routes, and at higher densities, while no growth occurs in ecologically sensitive areas
Following the presentation of the four scenarios to The Tomorrow Plan steering committee, local community representatives, and the public, The Tomorrow Plan steering committee decided to move forward with crafting goals, strategies, and initiatives that provide a mix of Scenario 3 and Scenario 4. However, a detailed final growth allocation to geographies smaller than the seven subareas (such as TAZs) did not occur.
Development of a Final 2050 Growth Scenario
For purposes of travel demand modeling, the 2050 growth forecasts must be allocated to the TAZ level of geography. To be consistent with and to help implement The Tomorrow Plan, the MPO staff worked with the MPO’s Planning Subcommittee to develop a final scenario that fell somewhere between The Tomorrow Plan’s Scenario 3 and Scenario 4. In particular, the MPO Planning Subcommittee desired to have earlier years of the final scenario build off of investments already made by communities in support of their existing plans and to transition the

185184 growth in later years to reflect growth as advocated in The Tomorrow Plan.
Steps to Develop the 2050 Growth Scenario
The following steps were undertaken to develop the final 2050 Growth Scenario.
1. Established base-year population and employment data for MPO, subareas, and TAZs.
2. Determined employment growth allocations out to 2050 for each subarea following methodology used in The Tomorrow Plan.
3. Determined population growth allocations out to 2050 for each subarea following methodology used in The Tomorrow Plan.
4. Divided subarea control totals by jurisdictions based on an average allocation from The Tomorrow Plan’s Scenario 3 and 4.
5. Community representatives worked with MPO staff to assign their allocated growth using the Envision Tomorrow software.
6. Allocated growth aggregated to TAZs for use in the travel demand model
Detailed Information
The following section provides a more in-depth explanation of the process and methodology used to develop the final 2050 Growth Scenario.
GeographyThe 2050 Growth Scenario includes multiple steps that involves the collection, aggregation, and/or forecasting of data at a variety of geographic levels. The following is an explanation of the geographic levels used throughout the growth scenario process.
• Four-county level: the MPO’s Metropolitan Planning Area (MPA) resides is parts of Polk, Dallas, Warren, and Madison Counties, which are referred to throughout this document as the four-county level. REMI data is provided at the county level and, therefore, must be adjusted to provide Planning Area data.
• Metropolitan Planning Area (MPA): the MPA includes areas within Polk, Dallas, Warren, and Madison Counties that are expected to be urbanized by the year 2050.
• Subarea: the MPO’s MPA boundary is divided into seven subareas. These subareas were established during The Tomorrow Plan’s development based on interviews with real estate and community development/economic development communities, consideration of symbolic and physical boundaries, analysis of real estate supply data and development trends, and previous subareas used by the MPO.
• Traffic Analysis Zone: The MPA is divided into over 1,000 TAZ for use in travel demand modeling.
• Parcel-Based Geography: Base-year employment data and future year growth assignments were completed using parcel-based geography. These geographies were based upon land parcels. To limit the size of parcels, a five-acre grid was placed over the parcel map which resulted in the subdivision of some parcels.
Figures C6 and C7 illustrate the geographies from the above list.

187186
FIGURE C6: FOUR-COUNTY AREA AND MPA GEOGRAPHIES
FIGURE C7: MPA, SUBAREA, AND TAZ GEOGRAPHIES

187186
Step 1: Establish Base-Year Population and Employment Data
MPO staff collected data for population and employment that was current as of 2010, which serves at the base year. Population, housing unit, and household information was collected from the US Census Bureau’s 2010 Decennial Census. Census data at the block geographic level were aggregated to the TAZ level.
Employment was estimated following a parcel-based methodology. MPO staff collected GIS information for commercial and industrial use parcels within each county. Information collected included the parcel size, detailed occupancy, building area, height, and age of the building. The detailed occupancy information was used to categorize each parcel into one of ten categories, and a jobs per square foot ratio was applied to each building, as illustrated in Figure C8. Mixed use buildings were addressed as well by identifying parcels with a mix of uses and estimating the percentage of each building’s area attributed to each use. Employment for each parcel was calculated by taking the building area multiplied by the number of floors multiplied by the jobs/square foot ratio.
Finally, the estimated employment was indexed to the REMI control total for each subarea. This was accomplished by summarizing the estimated employment for each parcel, determining the percentage of the total employment each parcel represents, and then applying that percentage for each parcel to the REMI control total for the parcel’s respective subarea. This process changed employment on each parcel slightly yet results in the sum of all parcel employment equaling the REMI employment control total.
USE CATEGORY JOBS/SQUARE FOOT RATIO
Education 969
Hospital 385
Hotel 3,000
Manufacturing 750
Office 250
Public Assembly 1,400
Religious Worship 2,000
Retail 500
Senior Care 1,000
Warehouse/Flex 1,250
FIGURE C8: BUILDING USE AND JOBS/SF RATIO
Source: Des Moines Area MPO
Step 2: Determine Subarea Employment Forecasts
MPO staff used the methodology prescribed in the report Existing Conditions Analysis and Baseline Projections for The Tomorrow Plan, prepared by Gruen Gruen + Associates in November 2011, as a template for the 2050 Growth Scenario. This methodology is based upon analysis of REMI forecasts by county, historical employment trends by sector from Iowa Workforce Development, and current employment allocation.
REMI employment forecasts by North American Industry Classification System (NAICS) industry sector for the four-county area were obtained. NAICS sectors were aggregated into twelve primary classifications. Farm employment was not considered. Growth rates for each five-year time increment for each classification were calculated, as shown in Figure C9. A key assumption made was that the same industry classification growth rate forecasted at the county level also would be observed at the MPA level.
A determination of each county’s base-year employment within the MPA was then determined using ratios calculated during the HY 2035 MTP planning process. Work-from-home employment also was calculated by subtracting 0.95% of total employment, which was the percent determined during development of the HY 2035 MTP. Figure C10 summarizes the MPA’s base-year employment.
The 2010 to 2015 growth rate for each industry was applied to the base year employment for each sector to develop a 2015 employment figure for each sector. This process was repeated for each five-year increment out to 2050. Figure C11 summarizes forecasted employment by decade.
The next step was to subdivided employment to the subarea geography. To do this, each industry sector’s current distribution among the eight subareas was determined. Because the parcel-based base-year employment in Step 1 did not consider industry sectors, the MPO had to determine the current distribution using Iowa Workforce Development data. Iowa Workforce Development provided the MPO with the percentage of each subarea’s total employment comprised of each industry sector.

189188 INDUSTRY 2010-2015
2015-2020
2020-2025
2025-2030
2030-2035
2035-2040
2040-2045
2045-2050
Natural Resources and Construction 6.28% 1.93% 1.90% 1.27% 0.69% 0.68% 0.52% 0.07%
Manufacturing 0.12% -0.59% 0.07% 0.28% 0.29% 0.17% -0.27% -0.61%
Wholesale Trade 0.78% -0.08% 0.31% 0.24% 0.24% 0.05% -0.26% -0.60%
Retail Trade 0.59% -0.02% 0.55% 0.42% 0.61% 0.47% 0.49% 0.55%
Transportation and Utilities 1.85% 0.72% 1.10% 1.24% 1.38% 1.33% 1.11% 0.87%
Information 1.12% 1.26% -0.29% -0.63% -0.58% -0.76% -1.05% -1.34%
Financial Activities 0.80% 0.30% 0.44% 0.35% 0.39% 0.25% -0.11% -0.59%
Professional and Business Services 2.41% 1.16% 1.00% 1.05% 1.13% 1.04% 0.73% 0.29%
Educational and Health Services 3.00% 2.23% 1.54% 1.37% 1.39% 1.34% 1.29% 1.17%
Leisure and Hospitality 1.43% 0.34% 0.97% 0.99% 1.15% 1.13% 0.93% 0.51%
Other Services 1.74% 0.75% 0.75% 0.79% 0.99% 0.93% 0.76% 0.32%
Government 0.73% 1.11% 0.83% 0.78% 0.85% 0.81% 0.61% 0.29%
FIGURE C9: FIVE-YEAR GROWTH RATES BY INDUSTRY CLASSIFICATION, FOUR-COUNTY AREA
Source: REMI Policy Insight Mode, February 2011
INDUSTRY DALLAS COUNTY
MADISON COUNTY
POLK COUNTY
WARREN COUNTY
MPA TOTAL
Natural Resources and Construction 1,250 5 15,783 291 17,330
Manufacturing 1,182 3 14,060 148 15,394
Wholesale Trade 522 1 15,553 144 16,220
Retail Trade 3,111 7 30,979 544 34,639
Transportation and Utilities 676 1 9,874 64 10,615
Information 355 0 8,253 96 8,704
Financial Activities 4,321 3 43,448 162 47,934
Professional and Business Services 2,497 8 55,072 523 58,099
Educational and Health Services 1,825 6 41,440 727 43,998
Leisure and Hospitality 1,939 4 27,718 392 30,053
Other Services 1,272 4 15,948 262 17,487
Government 2,079 11 35,548 673 38,311
Total 21,028 53 313,676 4,026 338,784
FIGURE C10: BASE YEAR MPA EMPLOYMENT BY INDUSTRY (NON-FARM AND NON-WORK FROM HOME)
Source: REMI Policy Insight Mode, February 2011

189188 INDUSTRY 2010 2020 2030 2040 2050 2010-2050 GROWTH
Natural Resources and Construction 17,330 25,855 30,258 32,399 33,353 16,023
Manufacturing 15,394 15,032 15,294 15,652 14,976 -418
Wholesale Trade 16,220 16,801 17,268 17,518 16,777 556
Retail Trade 34,639 35,626 37,389 39,443 41,531 6,891
Transportation and Utilities 10,615 12,054 13,540 15,491 17,094 6,479
Information 8,704 9,795 9,352 8,743 7,752 -952
Financial Activities 47,934 50,640 52,683 54,385 52,503 4,569
Professional and Business Services 58,099 69,315 76,753 85,506 89,945 31,846
Educational and Health Services 43,998 56,949 65,804 75,356 85,153 41,155
Leisure and Hospitality 30,053 32,813 36,179 40,515 43,525 13,472
Other Services 17,487 19,786 21,364 23,501 24,805 7,319
Government 38,311 41,969 45,480 49,408 51,681 13,371
Total 338,784 386,634 421,364 457,918 479,094 140,311
FIGURE C11: MPA EMPLOYMENT GROWTH, 2010-2050
Source: REMI Policy Insight Mode, February 2011
INDUSTRY SUBAREA
1 2 3 4 5 6 7 TOTAL
Natural Resources and Construction 7% 24% 7% 17% 19% 5% 21% 100%
Manufacturing 16% 39% 1% 8% 11% 11% 14% 100%
Wholesale Trade 13% 27% 5% 8% 12% 3% 32% 100%
Retail Trade 12% 15% 2% 9% 37% 8% 17% 100%
Transportation and Utilities 9% 43% 5% 12% 13% 5% 14% 100%
Information 1% 2% 36% 17% 26% 5% 13% 100%
Financial Activities 1% 1% 30% 4% 50% 1% 12% 100%
Professional and Business Services 9% 8% 16% 12% 32% 7% 16% 100%
Educational and Health Services 8% 15% 14% 6% 19% 24% 13% 100%
Leisure and Hospitality 9% 19% 11% 9% 28% 10% 14% 100%
Other Services 11% 18% 12% 8% 27% 12% 11% 100%
Government 8% 6% 58% 5% 8% 4% 11% 100%
Total 8% 15% 16% 9% 27% 10% 15% 100%
FIGURE C12: BASE YEAR EMPLOYMENT DISTRIBUTION BY INDUSTRY SECTOR AND SUBAREA
Source: Iowa Workforce Development

191190
The final step to determine employment distribution by subarea was to subdivide the MPA employment forecasts to the subarea level. To do this, an assumption was made that the base year distribution of each industry sector would continue into the future. For example, Subarea 1 would continue to have 16 percent of all manufacturing jobs in future years as it does in the base year. Therefore, for each subarea, each industry sector’s future year employment at the MPA level was multiplied by each industry sector’s current distribution percentage and summarized to arrive at a total for the subarea. A calculation for Subarea 1 for the year 2020 is provided as an example in Figure C13. Applying this example to all subareas results in employment totals for each subarea, as shown in Figure C14.
INDUSTRY 2020 MPA TOTAL
(A)
SUBAREA 1 BASE YEAR DISTRIBUTION
(B)
SUBAREA 1 2020 TOTAL (A X B)
Natural Resources and Construction 25,855 7% 1,773
Manufacturing 15,032 16% 2,369
Wholesale Trade 16,801 13% 2,145
Retail Trade 35,626 12% 4,133
Transportation and Utilities 12,054 9% 1,091
Information 9,795 1% 130
Financial Activities 50,640 1% 636
Professional and Business Services 69,315 9% 5,982
Educational and Health Services 56,949 8% 4,792
Leisure and Hospitality 32,813 9% 3,022
Other Services 19,786 11% 2,154
Government 41,969 8% 3,341
Total 386,634 - 31,568
FIGURE C13: SUBAREA 1 FUTURE YEAR EMPLOYMENT TOTAL CALCULATION EXAMPLE
SUBAREA 2010 2020 2030 2040 2050 2010-2050 GROWTH
1 - North Suburbs 27,820 31,568 34,478 37,645 39,667 11,848
2 - East DM 47,571 54,473 59,747 65,207 68,703 21,133
3 - CBD 64,355 72,652 78,614 84,994 88,125 23,770
4 - South DM 29,539 34,403 37,660 40,914 42,769 13,230
5 - SW Suburbs 90,275 101,785 110,127 118,993 123,410 33,135
6 - NW Des Moines 28,969 34,260 38,103 42,330 45,723 16,754
7 - NW Suburbs 50,255 57,493 62,634 67,834 70,697 20,441
Total 338,784 386,634 421,364 457,918 479,094 140,311
FIGURE C14: SUBAREA EMPLOYMENT GROWTH, 2020-2050
Source: REMI Policy Insight Mode, February 2011

191190
Step 3: Determine Subarea Population Forecasts
As with Step 2, MPO staff used the methodology prescribed in the report Existing Conditions Analysis and Baseline Projections for The Tomorrow Plan, prepared by Gruen Gruen + Associates in November 2011, as a template for the 2050 Growth Scenario. This methodology also is based upon analysis of REMI forecasts by county and upon historical growth trends, as well as the relationship between employment growth and housing demand.
As with the employment forecast, the first step was to look at county-level population forecasts and adjust to develop a MPA forecast. REMI provided forecasts for each county out to 2050. In reviewing historical growth from 1990 to 2010, the four-county area saw an average annual rate of growth of 1.62 percent. This is slightly lower than growth observed in the MPA over the same timeframe, which had an average annual rate of growth of 1.71 percent, or 105.56 percent that of the four-county area. Therefore, the four-county area’s growth rates were adjusted by multiplying the five-year growth rate by 105.56 percent resulting in MPA growth rates. These rates were applied to the base year population and housing unit figures, which were derived from the 2010 Census. Figure C15 illustrates population forecast for the four-county area and the MPA.
YEAR DALLAS MADISON POLK WARREN 4-COUNTY TOTAL
COUNTY 5-YEAR
GROWTH RATES
MPA 5-YEAR
GROWTH RATE
MPA TOTAL
MPATOTAL
HOUSINGUNITS
2010 66,135 15,679 430,640 46,225 558,679 - - 480,266 202,419
2015 81,000 16,388 462,031 49,579 608,998 1.740% 1.836% 526,014 221,701
2020 91,583 16,857 483,257 52,147 643,844 1.119% 1.181% 557,823 235,107
2025 100,118 17,459 502,712 54,803 675,092 0.952% 1.005% 586,431 247,165
2030 107,311 18,215 522,727 57,353 705,606 0.888% 0.937% 614,438 258,969
2035 113,802 19,012 545,126 59,491 737,431 0.886% 0.935% 643,719 271,310
2040 120,506 19,812 571,353 61,409 773,080 0.949% 1.001% 676,601 285,169
2045 127,850 20,621 600,557 63,457 812,485 0.999% 1.055% 713,045 300,529
2050 135,758 21,534 630,203 66,012 853,507 0.990% 1.045% 751,088 316,563
FIGURE C15: POPULATION FORECAST, 2010-2050
Source: REMI Policy Insight Mode, February 2011; US Census Bureau
Once the MPA forecasts were determined, subarea forecasts could be calculated. Subarea population growth was determined as a factor of employment growth. A housing units created per job ratio was determined for each subarea. This ratio was developed in part based on a review of historical housing and job data at the community level with adjustments made based on interviews with representatives from MPO member communities. The units added per job ratio was used to develop an allocation factor for each subarea. This allocation factor was calculated by taking the subarea employment growth multiplied by the units added per job ratio, and dividing that product by the MPA’s total employment growth. The allocation percentage represents the percent of the total population allocated to each subarea for a given year, as illustrated in Figure C16. The allocation factors for each subarea and each time increment were then applied to the MPA forecasts for housing units and population, as shown in Figure C17.

193192SUBAREA UNITS
PER JOB
ALLOCATION PERCENTAGE BY YEAR
2010-2015
2015-2020
2020-2025
2025-2030
2030-2035
2035-2040
2040-2045
2045-2050
1 - North Suburbs 2.88 19% 20% 20% 21% 21% 22% 22% 26%
2 - East DM 1.44 19% 16% 19% 19% 18% 19% 19% 22%
3 - CBD 0.35 5% 7% 5% 5% 5% 5% 5% 4%
4 - South DM 1.44 13% 12% 12% 11% 11% 11% 11% 10%
5 - SW Suburbs 1.15 24% 24% 24% 24% 24% 24% 22% 17%
6 - NW Des Moines 0.48 4% 5% 5% 5% 5% 5% 6% 8%
7 - NW Suburbs 1.22 16% 16% 16% 15% 15% 15% 15% 13%
FIGURE C16: GROWTH ALLOCATION PERCENTAGE BY SUBAREA
SUBAREA 2010 2020 2030 2040 2050
UNITS POP. UNITS POP. UNITS POP. UNITS POP. UNITS POP.
1 - North Suburbs 22,296 55,916 28,712 71,353 33,650 83,068 39,273 96,410 46,797 114,260
2 - East DM 38,263 95,422 44,115 109,512 48,590 120,129 53,439 131,633 59,941 147,062
3 - CBD 4,877 7,435 6,652 11,697 7,883 14,617 9,261 17,886 10,575 21,004
4 - South DM 30,259 73,333 34,413 83,329 37,176 89,884 40,065 96,738 43,402 104,657
5 - SW Suburbs 42,010 95,794 49,876 114,721 55,537 128,153 61,826 143,074 67,985 157,689
6 - NW Des Moines 35,530 78,815 37,064 82,502 38,151 85,081 39,404 88,052 41,600 93,263
7 - NW Suburbs 29,020 72,067 34,274 84,710 37,981 93,506 41,902 102,809 46,262 113,153
Total 202,255 478,782 235,107 557,823 258,969 614,438 285,169 676,601 316,563 751,088
FIGURE C17: POPULATION AND HOUSING UNIT FORECAST BY SUBAREA, 2010-2050
Step 4: Subdivide Subarea Control Totals to Jurisdictions
To help subdivide subarea controls totals to TAZs, the MPO’s Planning Subcommittee recommended that the subarea totals first be allocated to each jurisdiction. To accomplish this, each TAZ was assigned to a city or county based on each jurisdiction’s future land use map. Note that TAZs do not always follow jurisdictional boundaries. Where a TAZ was split across two or more jurisdictions, the TAZ was assigned to the jurisdiction with a larger percentage of the TAZ.
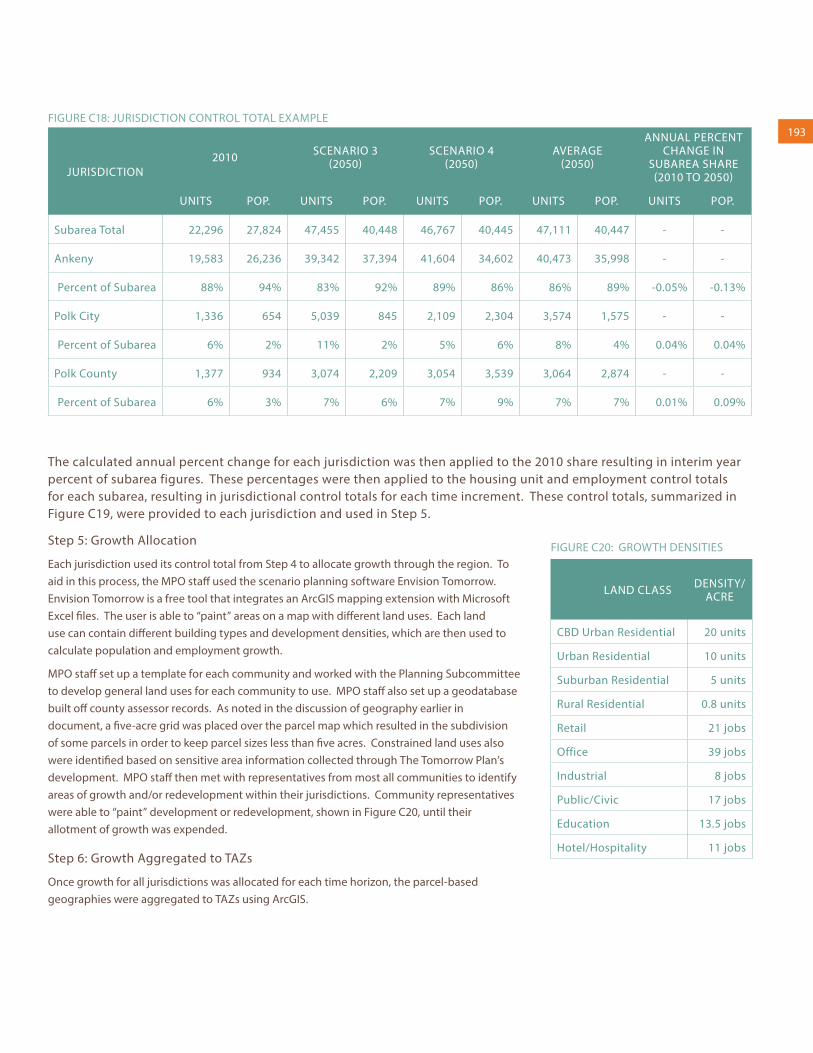
Once TAZs were assigned to jurisdictions, each jurisdiction’s share of each subarea’s base year housing units and employment was calculated. MPO staff then looked back at growth allocated in The Tomorrow Plan’s Scenarios 3 and 4 and determined each jurisdiction’s share of each subarea’s 2050 housing units and employment. Note that The Tomorrow Plan only forecast the year 2050 allocation with no interim year data provided. Each jurisdiction’s share of each subarea’s 2050 housing units and employment for Scenario 3 and Scenario 4 was averaged, and this percent was then applied to the updated 2050 control totals for each subarea (note that subarea totals changed slightly from The Tomorrow Plan growth scenarios to the Mobilizing Tomorrow growth scenario due to updates in base year employment data). The change in each jurisdiction’s share of the subarea total between 2010 and 2050 was then calculated and divided by 40 resulting in an annual percent change. An example from Subarea 1 is provided in Figure C18.
193192
JURISDICTION2010 SCENARIO 3
(2050)SCENARIO 4
(2050)AVERAGE
(2050)
ANNUAL PERCENTCHANGE IN
SUBAREA SHARE(2010 TO 2050)
UNITS POP. UNITS POP. UNITS POP. UNITS POP. UNITS POP.
Subarea Total 22,296 27,824 47,455 40,448 46,767 40,445 47,111 40,447 - -
Ankeny 19,583 26,236 39,342 37,394 41,604 34,602 40,473 35,998 - -
Percent of Subarea 88% 94% 83% 92% 89% 86% 86% 89% -0.05% -0.13%
Polk City 1,336 654 5,039 845 2,109 2,304 3,574 1,575 - -
Percent of Subarea 6% 2% 11% 2% 5% 6% 8% 4% 0.04% 0.04%
Polk County 1,377 934 3,074 2,209 3,054 3,539 3,064 2,874 - -
Percent of Subarea 6% 3% 7% 6% 7% 9% 7% 7% 0.01% 0.09%
FIGURE C18: JURISDICTION CONTROL TOTAL EXAMPLE
The calculated annual percent change for each jurisdiction was then applied to the 2010 share resulting in interim year percent of subarea figures. These percentages were then applied to the housing unit and employment control totals for each subarea, resulting in jurisdictional control totals for each time increment. These control totals, summarized in Figure C19, were provided to each jurisdiction and used in Step 5.
Industry LAND CLASS DENSITY/ACRE
CBD Urban Residential 20 units
Urban Residential 10 units
Suburban Residential 5 units
Rural Residential 0.8 units
Retail 21 jobs
Office 39 jobs
Industrial 8 jobs
Public/Civic 17 jobs
Education 13.5 jobs
Hotel/Hospitality 11 jobs
FIGURE C20: GROWTH DENSITIESStep 5: Growth Allocation
Each jurisdiction used its control total from Step 4 to allocate growth through the region. To aid in this process, the MPO staff used the scenario planning software Envision Tomorrow. Envision Tomorrow is a free tool that integrates an ArcGIS mapping extension with Microsoft Excel files. The user is able to “paint” areas on a map with different land uses. Each land use can contain different building types and development densities, which are then used to calculate population and employment growth.
MPO staff set up a template for each community and worked with the Planning Subcommittee to develop general land uses for each community to use. MPO staff also set up a geodatabase built off county assessor records. As noted in the discussion of geography earlier in document, a five-acre grid was placed over the parcel map which resulted in the subdivision of some parcels in order to keep parcel sizes less than five acres. Constrained land uses also were identified based on sensitive area information collected through The Tomorrow Plan’s development. MPO staff then met with representatives from most all communities to identify areas of growth and/or redevelopment within their jurisdictions. Community representatives were able to “paint” development or redevelopment, shown in Figure C20, until their allotment of growth was expended.
Step 6: Growth Aggregated to TAZs
Once growth for all jurisdictions was allocated for each time horizon, the parcel-based geographies were aggregated to TAZs using ArcGIS.

195194 JURISDICTION2010 2020 2030 2040 2050
UNITS JOBS UNITS JOBS UNITS JOBS UNITS JOBS UNITS JOBS
Altoona 6,175 8,504 7,201 9,217 8,055 9,537 8,995 9,783 10,242 9,649
Ankeny 19,583 26,236 25,081 29,348 29,232 31,598 33,928 34,003 40,203 35,304
Bondurant 1,788 1,141 2,131 1,403 2,433 1,645 2,770 1,911 3,213 2,135
Carlisle 1,775 1,540 2,074 2,125 2,299 2,689 2,542 3,316 2,823 3,878
Clive 6,652 16,007 7,880 18,054 8,754 19,535 9,714 21,106 10,674 21,890
Subarea 5 5,610 15,501 6,534 17,486 7,135 18,929 7,786 20,464 8,390 21,235
Subarea 7 1,042 506 1,346 567 1,619 605 1,927 642 2,283 655
Cumming 136 81 306 472 501 923 736 1,442 1,006 1,957
Dallas County 32 - 35 8 36 17 36 28 36 39
Des Moines 90,584 143,575 100,378 165,351 107,019 181,230 114,154 198,090 123,314 208,654
Subarea 2 22,948 25,572 25,954 29,994 28,157 33,674 30,494 37,599 33,673 40,507
Subarea 3 4,877 64,356 6,652 72,652 7,883 78,614 9,261 84,994 10,575 88,125
Subarea 4 26,675 26,775 30,120 30,632 32,303 32,933 34,559 35,127 37,164 36,039
Subarea 6 34,620 25,940 36,036 30,955 37,012 34,733 38,143 38,927 40,181 42,415
Subarea 7 1,464 932 1,615 1,119 1,664 1,276 1,697 1,443 1,720 1,569
Grimes 3,768 4,242 4,662 5,328 5,401 6,323 6,218 7,409 7,151 8,307
Johnston 6,562 15,744 7,596 17,060 8,247 17,548 8,911 17,883 9,630 17,467
Mitchellville 688 656 817 718 929 750 1,054 778 1,219 777
Norwalk 3,682 2,262 4,635 2,837 5,472 3,354 6,423 3,921 7,470 4,384
Subarea 4 1,622 1,228 2,016 1,599 2,362 1,934 2,745 2,302 3,190 2,616
Subarea 5 2,060 1,034 2,619 1,239 3,110 1,420 3,677 1,619 4,281 1,768
Pleasant Hill 4,455 3,222 5,176 3,990 5,770 4,706 6,420 5,495 7,286 6,168
Polk City 1,336 654 1,835 864 2,285 1,076 2,823 1,320 3,550 1,544
Polk County 4,804 12,431 5,829 13,854 6,703 14,700 7,688 15,515 8,989 15,800
Subarea 1 1,377 934 1,797 1,356 2,133 1,804 2,522 2,322 3,044 2,819
Subarea 2 2,373 8,469 2,836 9,151 3,246 9,435 3,705 9,641 4,308 9,466
Subarea 4 19 - 22 39 23 85 25 138 27 192
Subarea 6 910 3,028 1,028 3,306 1,139 3,370 1,260 3,403 1,419 3,308
Subarea 7 125 - 146 3 161 7 176 11 192 15
Urbandale 15,633 27,375 17,896 31,847 19,203 35,272 20,492 38,826 21,859 41,116
Warren County 174 - 189 10 195 21 201 34 207 48
Subarea 4 168 - 183 9 188 20 193 32 199 45
Subarea 5 6 - 7 1 7 1 8 2 8 3
Waukee 5,424 6,210 6,705 6,843 7,757 7,216 8,943 7,586 10,203 7,651
Subarea 5 5,030 4,753 5,728 5,282 6,108 5,631 6,498 5,994 6,813 6,122
Subarea 7 394 1,457 977 1,561 1,649 1,585 2,445 1,592 3,390 1,529
West Des Moines 27,175 66,085 32,468 74,128 36,381 79,790 40,755 85,766 45,095 88,487
Windsor Heights 1,993 2,822 2,213 3,178 2,295 3,434 2,365 3,705 2,393 3,838
Total 202,419 338,787 235,107 258,969 421,364 285,169 457,918 316,563
FIGURE C19: GROWTH TOTALS BY JURISDICTION

195194
2010 Population
2010 - 2020 Growth
2020 - 2030 Growth
2030 - 2040 Growth
2040 - 2050 Growth
1 dot = 100 people
Figures C20 and C21 illustrate the forecasted population and employment growth, respectively.
FIGURE C20: MAP OF POPULATION GROWTH , 2010-2050

197196
2010 Employment
2010 - 2020 Growth
2020 - 2030 Growth
2030 - 2040 Growth
2040 - 2050 Growth
1 dot = 100 jobs
FIGURE C21: MAP OF EMPLOYMENT GROWTH , 2010-2050

197196 Impact on Transportation
The Greater Des Moines region is growing. Population is projected to increase nearly 60 percent from 480,000 in 2010 to 751,000 by 2050, and employment is expected to increase by 40 percent by 2050. More critical to transportation, however, is the fact that the demographics of Greater Des Moines are shifting. The population over the age of 65 will increase from approximately 53,000 to 155,000, an increase of nearly 200 percent. This population will go from roughly 10 percent of the population to roughly 20 percent. As the region’s population ages, what will this mean for the transportation system? At the same time, Greater Des Moines must prepare for the XYZ factor. Those individuals aged 45 and younger – these population cohorts make up approximately two-thirds of our region’s population and exhibit different lifestyle choices and preferences then they have in the past.
They seek communities with a mix of uses within walking distance and many of them do not necessarily want to own an automobile. 1 A recent study showed that new car purchases dropped 30 percent from 2008-2012 for people aged 18-34 year old.2 Over time, Vehicle Miles Travelled (VMT) has steadily increased. However, around the turn of the century VMT peaked. Since the mid-2000s, VMT (per capita 2004 & Total 2007) have both declined.3 Young people, age 16-34, are driving this trend with a 23 percent drop in average VMT from 2001 to 2009. 4 In that same time period, biking trips increase 24 percent, walking trips increased 16 percent, and transit trip increased 40 percent in 16-34 year olds.5
These trends are likely to persist and have profound implications for our transportation system. For decades, transportation policy and investment was based on the assumption that automobile use will continue to increase indefinitely – this mind set persist today despite the increasing evidence that automobile use is in decline. However, this mind set is beginning to shift as is evident in recent statements from the Transportation Secretary of the U.S. Department of Transportation which emphasized moving people over moving cars.6
The demographic and economic circumstances driving the decline in automobile use present the region with an opportunity to use our limited resources to create a transportation system that will meet our needs 10, 20, and 40 years from now. Due to these reasons, Mobilizing Tomorrow recommends increased investment in maintenance and multimodal transportation options and reduced emphasis in the expansion of the roadway system.
1 Belden, Russonelo, & Stewart. The 2011 Community Preference Survey: What Americans Are Looking For When Deciding Where to Live. Research Report, National Association of Realtors, 2011.2 Hargreaves, S. Young Americans Ditch the Car. September 17, 2012. http://money.cnn.com/2012/09/17/news/economy/young-buying-cars/index.html3 http://www.ssti.us/2013/02/per-capita-vmt-ticks-down-for-eighth-straight-year/4 http://www.uspirg.org/sites/pirg/files/reports/Transportation%20%26%20the%20New%20Generation%20vUS_0.pdf5 http://www.uspirg.org/sites/pirg/files/reports/Transportation%20%26%20the%20New%20Generation%20vUS_0.pdf6 http://www.politico.com/story/2014/09/anthony-foxx-department-of-transportation-110656.html#ixzz3CjLXkpOZ
