appendix c: data tables for chapter 2 - oer home page ... · general biological sciences 61 3.3 66...
TRANSCRIPT

Appendix C. Data Tables for Chapter 2
Appendix Table C.1 Selected Characteristics of the NRSA Predoctoral Study Group by Cohort: Biomedical Sciences
C-1
Fiscal Year of Doctorate Group 1981-82
(n=1,866) 1983-84
(n=2,079) 1985-86
(n=2,062) 1987-88
(n=2,084) 1989-90
(n=2,100) 1991-92
(n=2,250) Total
(n=12,441) N % N % N % N % N % N % N %
Field of doctorate Anatomy 53 2.8 34 1.6 29 1.4 24 1.2 19 0.9 18 0.8 177 1.4 Biochemistry, immunology, microbiology, and cellular, developmental, or molecu-
lar biology 787 42.2 944 45.4 948 46.0 912 43.8 936 44.6 1,042 46.3 5,569 44.8Bioengineering 26 1.4 28 1.4 32 1.6 33 1.6 33 1.6 40 1.8 192 1.5General biological sciences 61 3.3 66 3.2 67 3.3 91 4.4 110 5.2 86 3.8 481 3.9Endocrinology 0 0.0 16 0.8 4 0.2 11 0.5 14 0.7 14 0.6 59 0.5Genetics 124 6.7 80 3.9 87 4.2 114 5.5 114 5.4 105 4.7 624 5.0Neurosciencesa 66 3.5 134 6.5 143 6.9 141 6.8 159 7.6 201 8.9 844 6.8Nursing 24 1.3 32 1.5 55 2.7 73 3.5 85 4.1 113 5.0 382 3.1Nutritional sciences 22 1.2 19 0.9 17 0.8 28 1.3 20 1.0 17 0.8 123 1.0Pathology 25 1.3 24 1.2 33 1.6 34 1.6 31 1.5 21 0.9 168 1.4Pharmacology/toxicology 219 11.7 267 12.8 264 12.8 257 12.3 238 11.3 226 10.0 1,471 11.8Physiology and biophysics 194 10.4 211 10.2 173 8.4 161 7.7 148 7.1 173 7.7 1,060 8.5Public health, epidemiol-ogy,and biostatistics 55 3.0 78 3.8 85 4.1 82 3.9 94 4.5 87 3.9 481 3.9Other biological sciencesb 147 7.9 108 5.2 87 4.2 90 4.3 76 3.6 74 3.3 819 6.6Other health sciencesc 66 3.5 38 1.8 38 1.8 33 1.6 23 1.1 33 1.5 231 1.9

Appendix C. Data Tables for Chapter 2
Appendix Table C.1 (continued) Selected Characteristics of the NRSA Predoctoral Study Group by Cohort: Biomedical Sciences
C-2
Fiscal Year of Doctorate Group 1981-82
(n=1,866) 1983-84
(n=2,079) 1985-86
(n=2,062) 1987-88
(n=2,084) 1989-90
(n=2,100) 1991-92
(n=2,250) Total
(n=12,441) N % N % N % N % N % N % N %
M.D./Ph.D. recipientd 203 10.9 220 10.6 208 10.1 230 11.0 258 12.3 200 8.9 1,319 10.6
Received MSTP supporte 168 9.0 193 9.3 168 8.2 202 9.7 197 9.4 176 7.8 1,104 8.9
Type of NRSA support Fellowship 50 2.7 49 2.4 73 3.5 88 4.2 96 4.6 127 5.6 483 3.9 Traineeship 1,809 97.0 2,017 97.0 1,971 95.6 1,974 94.7 1,977 94.1 2,099 93.3 11,847 95.2 Both 7 0.4 13 0.6 18 0.9 22 1.1 27 1.3 21 0.9 108 0.9
Months of supportf
9-12 months 141 7.6 162 7.8 219 10.6 236 11.3 275 13.1 296 13.2 1,329 10.7 13-24 months 345 18.5 360 17.3 358 17.4 356 17.1 406 19.3 447 19.9 2,272 18.3 25-36 months 590 31.6 588 28.3 564 27.4 560 26.9 551 26.2 609 27.1 3,462 27.8 37-48 months 364 19.5 423 20.4 427 20.7 422 20.2 376 17.9 425 18.9 2,437 19.6 49-60 months 254 13.6 330 15.9 334 16.2 311 14.9 297 14.1 310 13.8 1,836 14.8 More than 60 months 172 9.2 216 10.4 160 7.8 199 9.6 195 9.3 163 7.2 1,105 8.9
Median 36.0 36.0 36.0 36.0 36.0 36.0 36.0 Mean 38.3 39.6 38.1 38.6 37.5 36.9 38.1 Standard deviation 17.0 17.4 16.9 17.4 18.1 17.4 17.4

Appendix C. Data Tables for Chapter 2
Appendix Table C.1 (continued) Selected Characteristics of the NRSA Predoctoral Study Group by Cohort: Biomedical Sciences
C-3
Fiscal Year of Doctorate Group 1981-82
(n=1,867) 1983-84
(n=2,079) 1985-86
(n=2,062) 1987-88
(n=2,084) 1989-90
(n=2,100) 1991-92
(n=2,250) Total
(n=12,441) N % N % N % N % N % N % N %
Institute of supportg
NIA 4 0.2 8 0.4 7 0.3 8 0.4 9 0.4 28 1.2 64 0.5 NIAAA 8 0.4 2 0.1 7 0.3 3 0.1 12 0.6 7 0.3 39 0.3 NIAID 54 2.9 73 3.5 60 2.9 72 3.5 90 4.3 107 4.8 456 3.7 NIADDK (includes both NIAMS and NIDDK) 24 1.3 40 1.9 29 1.4 52 2.5 32 1.5 38 1.7 215 1.7
NCI 209 11.2 215 10.3 226 11.0 273 13.1 274 13.1 303 13.5 1,500 12.1 NICHD 87 4.7 70 3.4 81 3.9 76 3.7 83 4.0 119 5.3 516 4.2 NIDA 9 0.5 11 0.5 5 0.2 11 0.5 9 0.4 10 0.4 55 0.4 NIDR 6 0.3 9 0.4 1 0.1 6 0.3 3 0.1 7 0.3 32 0.3 NIEHS 62 3.3 106 5.1 120 5.8 128 6.1 120 5.7 114 5.1 650 5.2 NEI 12 0.6 11 0.5 12 0.6 13 0.6 16 0.8 19 0.8 83 0.7 NIGMS 1,154 61.8 1,283 61.7 1,213 58.8 1,113 53.4 1,084 51.6 1,114 49.5 6,961 56.0 NHLBI 112 6.0 125 6.0 126 6.1 129 6.2 143 6.8 125 5.6 760 6.1 NIMH 77 4.1 66 3.2 87 4.2 103 4.9 97 4.6 108 4.8 538 4.3 NINR 21 1.0 74 3.5 103 4.5 198 1.6 NINDS 15 0.8 18 0.9 26 1.3 27 1.3 40 1.9 40 1.8 166 1.3 DN/BHP 33 1.8 42 2.0 62 3.0 48 2.3 12 0.6 2 0.1 199 1.6 All other Institutesh 1 0.1 2 0.1 6 0.3 9 0.1

Appendix C. Data Tables for Chapter 2
Appendix Table C.1 (continued) Selected Characteristics of the NRSA Predoctoral Study Group: Biomedical Sciences
C-4
Fiscal Year of Doctorate Group 1981-82
(n=1,867) 1983-84
(n=2,079) 1985-86
(n=2,062) 1987-88
(n=2,084) 1989-90
(n=2,100) 1991-92
(n=2,250) Total
(n=12,441) N % N % N % N % N % N % N %
Supported by multiple training grantsi 103 5.6 192 9.2 237 11.4 286 13.7 273 13.0 330 14.7 1,421 11.4
Estimated timing of first support (trainees only)j
Within first 3 years of graduate program 1,515 81.2 1,719 82.7 1,674 81.2 1,688 81.0 1,633 77.8 1,722 76.5 9,951 80.0
In 4th or later years 344 18.4 357 17.2 370 17.9 387 18.6 453 21.6 507 22.5 2,418 19.4 Unknown 7 0.4 3 0.1 18 0.9 9 0.4 14 0.7 21 0.9 21 0.6
College/school in which training grant was located (trainees only) Medical school 996 54.9 1,151 56.7 1,126 56.6 1,151 57.7 1,156 57.7 1,196 56.4 6,776 56.7 Arts and sciences 622 34.3 635 31.2 657 33.0 612 30.6 593 29.6 642 30.2 3,761 31.5 Other health professional
school 118 6.5 154 7.6 141 6.7 134 6.7 151 7.5 167 7.9 858 7.2 Other 62 3.4 63 3.1 54 2.7 70 3.5 71 3.5 79 3.7 399 3.3 Unknown 18 1.0 27 1.3 18 0.9 29 1.5 33 1.7 36 1.7 161 1.4
Note. Data are from the NRC Doctorate Records File (1994), the NIH Trainee and Fellow File (1994), and the AMC Master Information System. Included are those who had at least nine months of F30, F31, or T32 Predoctoral support. Percentages may not total to 100.0 due to rounding.

Appendix C. Data Tables for Chapter 2 C-5
Footnotes to Appendix Table C.1 (continued) a Neuroscience was not listed as a separate field until the 1982 survey. b Other biological sciences include environmental sciences, medicinal chemistry, zoology, and fields not otherwise mentioned. c Other health sciences include such fields as environmental health, pharmacy, and veterinary medicine. d These individuals earned both an M.D. and a Ph.D. by 1992, with no more than four years having elapsed between receipt of the two degrees. e These individuals received at least 9 months of support from a Medical Scientist Training Program (MSTP) grant. f Although the majority of predoctoral support is NRSA support, some individuals also received other forms of predoctoral training support (i.e., training funded under
mechanisms that predated those of the NRSA). This was particularly true for those in the earliest cohorts. g Because some individuals received support from more than one Institute, this refers to the last Institute that provided NRSA predoctoral support. h Included here are doctorates in the relevant fields who were supported by the NIDCD (n = 3) and AHRQ (n = 6). i This refers to receiving support from two or more NRSA predoctoral training grants. J Because data are available only for the calendar year of entry into the first graduate program (which may or may not be the same as the program from which the person
earned the Ph.D.), the numbers are estimates.

Appendix C. Data Tables for Chapter 2
Appendix Table C.2 Selected Characteristics of the NRSA Predoctoral Study Group by Cohort: Behavioral Sciences
C-6
Fiscal Year of Doctorate Group 1981-82
(n=449) 1983-84 (n=451)
1985-86 (n=433)
1987-88 (n=352)
1989-90 (n=340)
1991-92 (n=415)
Total (n=2,440)
N % N % N % N % N % N % N %
Field of doctorate Anthropology 40 8.9 39 8.7 33 7.6 33 9.4 22 6.5 17 4.1 184 7.5 Psychology
Clinical, counseling, and school 24 5.4 32 7.1 38 8.8 39 11.1 47 13.8 75 18.1 255 10.5
Cognitivea 0 0.0 22 4.9 24 5.5 11 3.1 7 2.1 24 5.8 88 3.6 Comparative and physio-physiological 47 10.5 42 9.3 29 6.7 20 5.7 22 6.5 22 5.3 182 7.5
Developmental 56 12.5 75 16.6 68 15.7 57 16.2 50 14.7 66 15.9 372 15.3 Experimental 72 35.0 43 9.5 30 6.9 18 5.1 12 3.5 31 7.5 206 8.4 Social and personality 68 15.1 63 14.0 56 12.9 43 12.2 42 12.4 40 9.6 312 12.8 Psychology, general 25 5.6 15 3.3 18 4.2 21 6.0 32 9.4 25 6.0 136 5.6 Psychology, otherb 34 7.6 27 5.9 43 9.9 34 9.7 29 8.5 26 6.3 193 7.9
Sociology 76 16.9 88 19.5 92 21.3 69 19.6 73 21.5 84 20.2 482 19.8 Speech and hearing sciences 7 1.6 5 1.1 2 0.5 7 2.0 4 1.2 5 1.2 30 1.2
Type of NRSA support Fellowship 90 20.0 54 12.0 54 12.5 53 15.1 54 15.9 67 16.1 372 15.3 Traineeship 353 78.6 386 85.6 367 85.0 295 83.8 281 82.7 336 81.0 2,018 82.8 Both 6 1.3 10 2.2 11 2.6 4 1.1 5 1.5 12 2.9 48 2.0

Appendix C. Data Tables for Chapter 2
Appendix Table C.2 (continued) Selected Characteristics of the NRSA Predoctoral Study Group by Cohort: Behavioral Sciences
C-7
Fiscal Year of Doctorate Group 1981-82
(n=449) 1983-84 (n=451)
1985-86 (n=433)
1987-88 (n=352)
1989-90 (n=340)
1991-92 (n=415)
Total (n=2,440)
N % N % N % N % N % N % N %
Months of supportc
9-12 months 108 24.1 127 28.2 144 33.3 110 31.3 116 34.1 136 32.8 741 30.4 13-24 months 143 31.9 148 32.8 123 28.4 101 28.7 101 29.7 106 25.5 722 29.6 25-36 months 133 29.6 106 23.5 98 22.6 90 25.6 84 24.7 98 23.6 609 25.0 37-48 months 42 9.4 51 11.3 36 8.3 25 7.1 23 6.8 43 10.4 220 9.0 More than 48 months 23 5.1 19 4.2 32 7.4 26 7.3 16 4.7 32 7.7 148 6.1
Median 24.0 24.0 23.0 24.0 24.0 24.0 24.0 Mean 26.0 25.2 25.4 25.6 24.6 27.0 25.7 Standard deviation 12.8 13.1 14.9 14.1 13.6 15.9 14.1
Institute of supportd
NIA 15 3.3 23 5.1 24 5.5 28 8.0 21 6.2 28 6.8 139 5.7 NIAAA 18 4.0 11 2.4 10 2.3 7 2.0 3 0.9 9 2.2 58 2.4 NICHD 49 10.9 54 12.0 51 11.8 59 16.8 62 18.2 69 16.6 344 14.1 NIDA 6 1.3 1 0.2 3 0.7 2 0.6 10 2.9 12 2.9 34 1.3 NEI 4 0.9 3 0.7 4 0.9 2 0.6 2 0.6 2 0.5 17 0.7 NIGMS 15 3.3 6 1.3 11 2.5 7 2.0 4 1.2 4 1.0 47 1.9 NHLBI 4 0.9 7 1.6 11 2.5 4 1.1 7 0.3 11 2.7 44 1.8

Appendix C. Data Tables for Chapter 2
Appendix Table C.2 (continued) Selected Characteristics of the NRSA Predoctoral Study Group by Cohort: Behavioral Sciences
C-8
Fiscal Year of Doctorate Group 1981-82
(n=449) 1983-84 (n=451)
1985-86 (n=433)
1987-88 (n=352)
1989-90 (n=340)
1991-92 (n=415)
Total (n=2,440)
N % N % N % N % N % N % N %
Institute of support (continued)d
NIMH 318 70.8 330 73.2 306 70.7 226 64.2 220 64.7 264 63.6 1,664 68.2 NINR 3 0.9 5 1.5 8 1.9 16 0.7 NINDS 4 0.9 4 0.9 3 0.7 3 0.9 2 0.6 3 0.7 19 0.8 DN/BHP 14 3.1 11 2.4 10 2.3 7 2.0 2 0.6 1 0.2 45 1.8 All other Institutese 2 0.4 1 0.2 0 0.0 4 1.1 2 0.5 4 1.0 13 0.5
Supported by multiple training grantsf 17 6.6 16 5.0 15 4.5 18 6.6 18 6.6 14 4.1 98 5.5
Estimated timing of first support (trainees only)g
Within first 3 years of graduate program 241 53.7 272 60.3 304 70.2 220 62.5 227 66.8 278 67.0 1,542 63.2
In 4th or later years 205 45.7 175 38.8 126 29.1 130 36.9 113 33.2 133 32.1 882 36.2 Unknown 3 0.7 4 0.9 3 0.7 2 0.6 0 0.0 4 1.0 16 0.7

Appendix C. Data Tables for Chapter 2 C-9
Appendix Table C.2 (continued) Selected Characteristics of the NRSA Predoctoral Study Group by Cohort: Behavioral Sciences
Fiscal Year of Doctorate Group 1981-82
(n=449) 1983-84 (n=451)
1985-86 (n=433)
1987-88 (n=352)
1989-90 (n=340)
1991-92 (n=415)
Total (n=2,440)
N % N % N % N % N % N % N %
College/school in which training grant was located (trainees only) Medical school 30 8.4 37 9.3 41 10.9 32 10.7 44 15.4 54 15.5 238 11.5 Arts and sciences 302 84.1 338 85.4 320 84.7 253 84.6 215 75.2 265 76.2 1,693 82.0 Other health professional 2 0.6 4 1.0 2 0.5 1 0.3 3 1.1 3 7.9 15 0.7 Other 13 3.6 6 1.5 12 3.2 4 1.3 8 2.8 14 4.0 57 2.8 Unknown 12 3.3 11 2.8 3 0.8 9 3.0 16 5.6 12 3.5 63 3.1
Note. Data are from the NRC Doctorate Records File (1994) and the NIH Trainee and Fellow File (1994). Included are those who had at least nine months of F30, F31, or T32 predoctoral support. Percentages may not total to 100.0 due to rounding.
a Cognitive psychology was not listed as a separate field until the 1983 survey. b Other fields in psychology include educational, industrial-organizational, psychometrics, quantitative, and other fields not otherwise mentioned.
Although the majority of predoctoral support is NRSA support, some individuals also received other forms of predoctoral training support (i.e., training funded under mechanisms that predated those of the NRSA). This was particularly true for those in the earliest cohorts.
d Because some individuals received support from more than one Institute, this refers to the last Institute that provided NRSA predoctoral support. e Included here are doctorates in the relevant fields who were supported by the NCI (n = 5), NIDR (n = 5), NIDCD (n = 1), NIEHS (n = 1), and AHRQ (n = 1). f This refers to receiving support from two or more NRSA predoctoral training grants. g These are estimates, given that only the calendar year of entry into the first graduate program was known (which may not be the same as the program that awarded the Ph.D.).
c

Appendix C. Data Tables for Chapter 2
Appendix Table C.3 Biomedical Ph.D.s With Baccalaureate Degrees From Highly Selective Undergraduate Institutions
C-10
Fiscal Year of Doctorate
Group 1981-82 1983-84 1985-86 1987-88 1989-90 1991-92 Total
NRSA
Total N 1,866 2,079 2,062 2,084 2,100 2,250 12,441
BA from selective institution N 505 555 515 537 556 599 3,267
% 27.1 26.7 25.0 25.8 26.5 26.6 26.3
NIH training institutions
Total N 2,705 2,425 2,536 2,679 2,852 2,795 15,992
BA from selective institution N 389 316 320 357 385 373 2,140
% 14.4 13.0 12.6 13.3 13.5 13.3 13.4
Non-NIH training institutions
Total N 2,523 2,465 2,178 2,329 2,565 2,977 15,037
BA from selective institution N 196 207 151 178 167 202 1,101
% 7.8 8.4 6.9 7.6 6.5 6.8 7.3
Total, all groups
Total N 7,094 6,969 6,776 7,092 7,517 8,022 43,470
BA from selective institution N 1,090 1,078 986 1,072 1,108 1,174 6,508
% 15.4 15.5 14.6 15.1 14.7 14.6 15.0

Appendix C. Data Tables for Chapter 2
Appendix Table C.3 (continued) Biomedical Ph.D.s With Baccalaureate Degrees From Highly Selective Undergraduate Institutions
C-11
Fiscal Year of Doctorate
Group 1981-82 1983-84 1985-86 1987-88 1989-90 1991-92 Total
Effect sizes:
NRSA vs. NIH training institutions 0.32 0.35 0.32 0.32 0.33 0.34 0.33
NRSA vs. non-NIH training institutions 0.53 0.50 0.51 0.50 0.56 0.56 0.53
NIH vs. non-NIH training institutions 0.21 0.15 0.19 0.19 0.24 0.22 0.21
Note. Data are from the NRC Doctorate Records File (1994) and the NIH Trainee and Fellow File (1994). The NRSA group includes those who had at least nine months of F30, F31, or T32 predoctoral support. A selective undergraduate institution is one for which the average SAT/ACT score for incoming freshmen in 1991 was 1200 or higher (Astin, 1993). All pairwise group differences, based on the average scores for each institution, were statistically significant (p < 0.001). The use of italics indicates that the effect size represents a potentially meaningful difference considered small in magnitude (between |0.20| to |0.49|); bold typeface designates a potentially meaningful difference considered moderate in magnitude (between |0.50| to |0.79|), and both italics and bold typeface signify a potentially meaningful difference considered large (+_ 0.80 or larger).

Appendix C. Data Tables for Chapter 2
Appendix Table C.4 Behavioral Ph.D.s With Baccalaureate Degrees From Highly Selective Undergraduate Institutions
C-12
Fiscal Year of Doctorate
Group 1981-82 1983-84 1985-86 1987-88 1989-90 1991-92 Total
NRSA Total N 413 413 390 306 288 334 2,144 BA from selective institution N 77 92 74 57 51 52 403
% 18.6 22.3 19.0 18.6 17.7 15.6 18.8
NIH training institutions Total N 1,325 1,174 1,158 1,066 999 962 6,684 BA from selective institution N 218 193 165 166 150 176 1,068
% 16.5 16.4 14.2 15.6 15.0 18.3 16.0
Non-NIH training institutions Total N 2,671 2,614 2,311 2,212 2,194 2,386 14,388 BA from selective institution N 300 296 222 202 221 220 1,461
% 11.2 11.3 9.6 9.1 10.1 9.2 10.2
Total, all groups Total N 4,409 4,201 3,859 3,584 3,481 3,682 23,216 BA from selective institution N 595 581 461 425 422 448 2,932
% 13.5 13.8 11.9 11.9 12.1 12.2 12.6

Appendix C. Data Tables for Chapter 2
Appendix Table C.4 (continued) Behavioral Ph.D.s With Baccalaureate Degrees From Highly Selective Undergraduate Institutions
C-13
Fiscal Year of Doctorate
Group 1981-82 1983-84 1985-86 1987-88 1989-90 1991-92 Total
Effect sizes: NRSA vs. NIH training institutions 0.06 0.15b 0.13a 0.08 0.07 -0.07 0.07b
NRSA vs. non-NIH training institutions 0.21c 0.30c 0.27c 0.29c 0.22c 0.19c 0.25c
NIH vs. non-NIH training institutions 0.15c 0.15c 0.14c 0.20c 0.15c 0.27c 0.17c
Note. Data were from the NRC Doctorate Records File (1994) and the NIH Trainee and Fellow File (1994). The NRSA group includes those who had at least nine months of F30, F31, or T32 predoctoral support. Not included are doctorates in speech and hearing sciences and clinical, counseling, and school psychology, along with those who also received an M.D. A selective undergraduate institution is one for which the average SAT/ACT score for incoming freshmen in 1991 was 1200 or higher (Astin, 1993). The use of italics indicates that the effect size represents a potentially meaningful difference considered small in magnitude (between |0.20| to |0.49|); bold typeface designates a potentially meaningful difference considered moderate in magnitude (between |0.50| to |0.79|), and both italics and bold typeface signify a potentially meaningful difference considered large (+_ 0.80 or larger).
a p < 0.05 b p < 0.01 c p < 0.001

Appendix C. Data Tables for Chapter 2
Appendix Table C.5 Biomedical Ph.D.s Who Received their Doctorates from the Top Quartile
of Institutions with Doctoral Programs in the Biomedical Sciences
C-14
Fiscal Year of Doctorate
Group 1981-82 1983-84 1985-86 1987-88 1989-90 1991-92 Total
NRSA Total N 1,866 2,079 2,062 2,084 2,100 2,250 12,441 Doctoral degree from top quartile N 1,502 1,701 1,676 1,721 1,707 1,839 10,146
% 80.5 81.8 81.3 82.6 81.3 81.7 81.6 Doctoral degree from top 25 institutions % (55.2) (56.0) (55.4) (57.9) (59.0) (59.0) (57.1)
NIH training institutions Total N 2,705 2,425 2,536 2,679 2,852 2,795 15,992 Doctoral degree from top quartile N 1,759 1,474 1,549 1,703 1,806 1,809 10,100
% 65.0 60.8 61.1 63.6 63.3 64.7 63.2 Doctoral degree from top 25 institutions % (36.8) (34.2) (31.2) (31.3) (31.9) (32.9) (33.0)
Non-NIH training institutions Total N 2,523 2,465 2,178 2,329 2,565 2,977 15,037 Doctoral degree from top quartile N 414 435 334 310 384 480 2,357
% 16.4 17.6 15.3 13.3 15.0 16.1 15.7 Doctoral degree from top 25 institutions % (4.6) (4.4) (2.8) (3.2) (3.6) (3.6) (371)
Total, all groups Total N 7,094 6,969 6,776 7,092 7,517 8,022 43,470 Doctoral degree from top quartile N 3,675 3,610 3,559 3,734 3,897 4,128 22,603
% 51.8 51.8 52.5 52.7 51.8 51.5 52.0 Doctoral degree from top 25 institutions % (30.2) (30.2) (29.4) (29.9) (29.8) (29.3) (29.8)

Appendix C. Data Tables for Chapter 2
Appendix Table C.5 ( continued)Biomedical Ph.D.s Who Received their Doctorates from the Top Quartile
of Institutions with Doctoral Programs in the Biomedical Sciences
C-15
Fiscal Year of Doctorate
Group 1981-82 1983-84 1985-86 1987-88 1989-90 1991-92 Total
Effect sizes: For top quartile:
NRSA vs. NIH training institutions 0.35 0.47 0.45 0.43 0.41 0.39 0.42 NRSA vs. non-NIH training institutions 1.39 1.39 1.44 1.53 1.45 1.43 1.44 NIH vs. non-NIH training institutions 1.04 0.92 0.99 1.10 1.05 1.04 1.02
Effect sizes: For top 25 institutions:
NRSA vs. NIH training institutions 0.37 0.44 0.49 0.54 0.55 0.53 0.49 NRSA vs. non-NIH training institutions 1.24 1.27 1.34 1.37 1.37 1.37 1.33 NIH vs. non-NIH training institutions 0.87 0.83 0.95 0.83 0.82 0.84 0.83
Note. Data are from the NRC Doctorate Records File(1994) and the NIH Trainee and Fellow File (1994). The NRSA group includes those who had at least nine months of F30, F31, or T32 predoctoral support. Reputational ratings of institutions with biomedical science programs were derived, using the survey ratings from the study of Research Doctorate Programs in the United States (Goldberger, Maher, & Flattau, 1995). For each institution, the normalized scores for doctoral programs in six major biomedical science fields were averaged; programs included biochemistry and molecular biology, cell and developmental biology, molecular and general genetics, neuroscience, pharmacology, and physiology. All pairwise group differences, using the average score for each institution, were statistically significant (p < 0.001). The use of italics indicates that the effect size represents a potentially meaningful difference considered small in magnitude (between |0.20| to |0.49|); bold typeface designates a potentially meaningful difference considered moderate in magnitude (between |0.50| to |0.79|), and both italics and bold typeface signify a potentially meaningful difference considered large (+_ 0.80 or larger).

Appendix C. Data Tables for Chapter 2
Appendix Table 2.6 Behavioral Ph.D.s Who Received their Doctorates from the Top Quartile
of Institutions with Doctoral Programs in the Behavioral Sciences
C-16
Fiscal Year of Doctorate
Group 1981-82 1983-84 1985-86 1987-88 1989-90 1991-92 Total
NRSA Total N 413 413 390 306 288 334 2,144 Doctoral degree from top quartile N 281 293 280 200 212 220 1,486
% 68.0 70.9 71.8 65.4 73.6 65.9 69.3 Doctoral degree from top 25 institutions % (50.6) (52.8) (54.1) (49.3) (47.2) (43.4) (49.9)
NIH training institutions Total N 1,325 1,174 1,158 1,066 999 962 6,684 Doctoral degree from top quartile N 942 847 818 761 737 697 4,802
% 71.1 72.2 70.6 71.4 73.8 72.5 71.8 Doctoral degree from top 25 institutions % (44.2) (45.5) (44.6) (45.2) (46.6) (44.3) (45.0)
Non-NIH training institutions Total N 2,672 2,614 2,311 2,212 2,194 2,386 14,388 Doctoral degree from top quartile N 866 798 680 664 652 707 4,367
% 32.4 30.5 29.4 30.0 29.7 29.6 30.4 Doctoral degree from top 25 institutions % (18.2) (16.3) (16.1) (16.6) (18.0) (17.6) (17.1)
Total, all groups Total N 4,409 4,201 3,859 3,584 3,481 3,682 23,216 Doctoral degree from top quartile N 2,089 1,938 1,778 1,625 1,601 1,624 10,655
% 47.4 46.1 46.1 45.3 46.0 44.1 45.9 Doctoral degree from top 25 institutions % (29.0) (28.0) (28.5) (27.9) (28.7) (26.9) (28.2)

Appendix C. Data Tables for Chapter 2
Appendix Table C.6 ( continued) Behavioral Ph.D.s Who Received their Doctorates from the Top Quartile
of Institutions with Doctoral Programs in the Behavioral Sciences
C-17
Fiscal Year of Doctorate
Group 1981-82 1983-84 1985-86 1987-88 1989-90 1991-92 Total
Effect sizes: For top quartile:
NRSA vs. NIH training institutions -0.07 -0.03 0.03 -0.13c 0.00 -0.14a -0.06a
NRSA vs. non-NIH training institutions 0.73c 0.83c 0.88c 0.72c 0.91c 0.74c 0.72c
NIH vs. non-NIH training institutions 0.79c 0.86c 0.85c 0.85c 0.91c 0.89c 0.62c
Effect sizes: For top 25 institutions:
NRSA vs. NIH training institutions 0.12a 0.15a 0.19c 0.08 0.01 -0.02 0.10c
NRSA vs. non-NIH training institutions 0.70c 0.80c 0.83c 0.72c 0.64c 0.57c 0.72c
NIH vs. non-NIH training institutions 0.57c 0.65c 0.64c 0.64c 0.63c 0.59c 0.62c
Note. Data are from the NRC Doctorate Records File (1994) and the NIH Trainee and Fellow File (1994). The NRSA group includes those who had at least nine months of F30, F31, or T32 predoctoral support. Not included are doctorates in speech and hearing sciences and clinical, counseling, and school psychology, along with those who also received an M.D. Reputational ratings of institutions with behavioral science programs were derived, using the survey ratings from the study of Research Doctorate Programs in the United States (Goldberger, Maher, & Flattau, 1995). For each institution, the normalized scores for doctoral programs in psychology, sociology, and anthropology were averaged. The use of italics indicates that the effect size represents a potentially meaningful difference considered small in magnitude (between |0.20| to |0.49|); bold typeface designates a potentially meaningful difference considered moderate in magnitude (between |0.50| to |0.79|), and both italics and bold typeface signify a potentially meaningful difference considered large (+_ 0.80 or larger).
a p < 0.05 b p < 0.01 c p < 0.001
Appendix C. Data Tables for Chapter 2
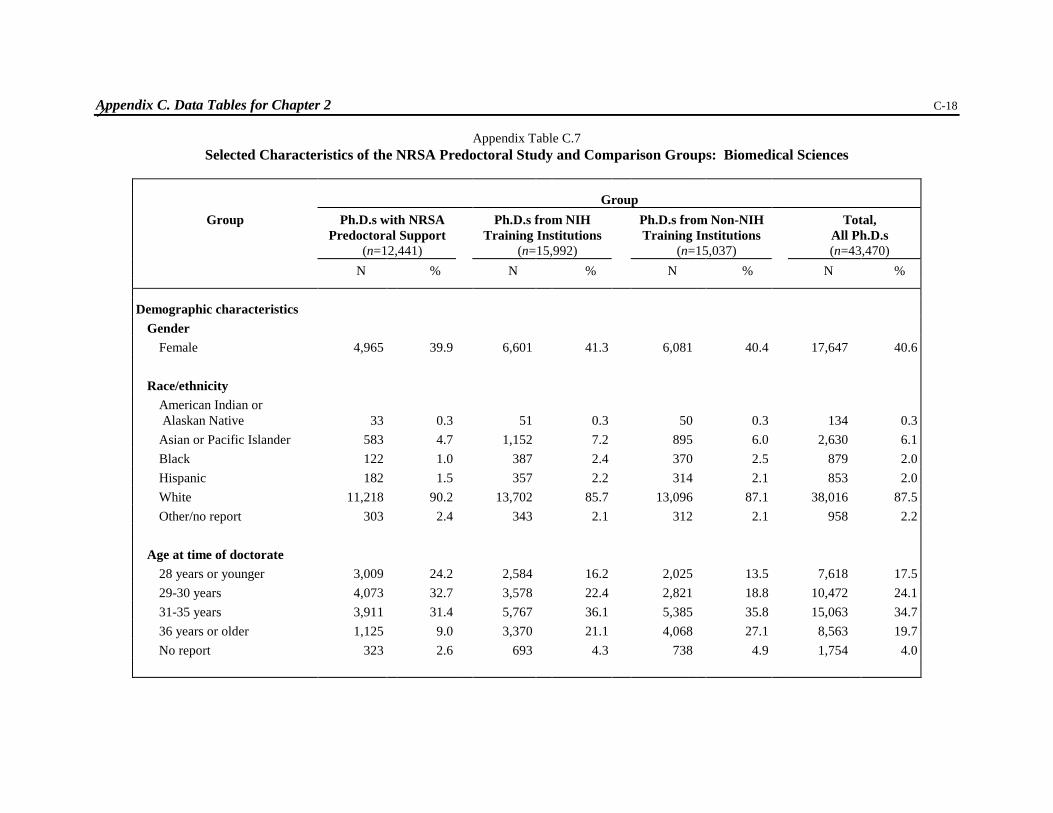
Appendix Table C.7 Selected Characteristics of the NRSA Predoctoral Study and Comparison Groups: Biomedical Sciences
C-18
Group Group Ph.D.s with NRSA
Predoctoral Support (n=12,441)
Ph.D.s from NIH Training Institutions
(n=15,992)
Ph.D.s from Non-NIH Training Institutions
(n=15,037)
Total, All Ph.D.s (n=43,470)
N % N % N % N %
Demographic characteristics Gender
Female 4,965 39.9 6,601 41.3 6,081 40.4 17,647 40.6
Race/ethnicity American Indian or Alaskan Native 33 0.3 51 0.3 50 0.3 134 0.3
Asian or Pacific Islander 583 4.7 1,152 7.2 895 6.0 2,630 6.1 Black 122 1.0 387 2.4 370 2.5 879 2.0 Hispanic 182 1.5 357 2.2 314 2.1 853 2.0 White 11,218 90.2 13,702 85.7 13,096 87.1 38,016 87.5 Other/no report 303 2.4 343 2.1 312 2.1 958 2.2
Age at time of doctorate 28 years or younger 3,009 24.2 2,584 16.2 2,025 13.5 7,618 17.5 29-30 years 4,073 32.7 3,578 22.4 2,821 18.8 10,472 24.1 31-35 years 3,911 31.4 5,767 36.1 5,385 35.8 15,063 34.7 36 years or older 1,125 9.0 3,370 21.1 4,068 27.1 8,563 19.7 No report 323 2.6 693 4.3 738 4.9 1,754 4.0

Appendix C. Data Tables for Chapter 2
Appendix Table C.7 (continued) Selected Characteristics of the NRSA Predoctoral Study and Comparison Groups: Biomedical Sciences
C-19
Group Group Ph.D.s with NRSA
Predoctoral Support (n=12,441)
Ph.D.s from NIH Training Institutions
(n=15,992)
Ph.D.s from Non-NIH Training Institutions
(n=15,037)
Total, All Ph.D.s (n=43,470)
N % N % N % N %
Age at time of doctorate Median 29.5 31.3 32.2 30.8 Mean 30.6 32.7 33.7 32.4 Standard deviation 3.9 5.5 6.0 5.5
Educational characteristics Field of doctorate
Anatomy 177 1.4 390 2.4 497 3.3 1,064 2.5 Biochemistry, cellular/ molecular biology, immun-
ology, and microbiology 5,569 44.8 6,183 38.7 4,363 29.0 16,115 37.1Bioengineering 192 1.5 352 2.2 269 1.8 813 1.9Endocrinology 59 0.5 49 0.3 83 0.6 191 0.4General biological sciences 481 3.9 708 4.4 880 5.9 2,069 4.8Genetics 624 5.0 298 1.9 350 2.3 1,272 2.9Neurosciences 844 6.8 507 3.2 247 1.6 1,598 3.7Nursing 382 3.1 786 4.9 1,229 8.2 2,397 5.5Nutritional sciences 123 1.0 321 2.0 655 4.4 1,099 2.5Pathology 168 1.4 503 3.2 356 2.4 1,027 2.4Pharmacology/toxicology 1,471 11.8 1,072 6.7 884 5.9 3,427 7.9Physiology and biophysics 1,060 8.5 1,234 7.7 1,205 8.0 3,499 8.1

Appendix C. Data Tables for Chapter 2 C-20
Appendix Table C.7 (continued) Selected Characteristics of the NRSA Predoctoral Study and Comparison Groups: Biomedical Sciences
Group Group Ph.D.s with NRSA
Predoctoral Support (n=12,441)
Ph.D.s from NIH Training Institutions
(n=15,992)
Ph.D.s from Non-NIH Training Institutions
(n=15,037)
Total, All Ph.D.s (n=43,470)
N % N % N % N %
Field of doctorate (continued) Public health, epidemi-ology, and biostatistics 481 3.9 1,364 8.5 476 3.2 2,321 5.3
Other biological sciencesa 679 5.5 1,395 8.7 1,980 13.2 3,856 9.3 Other health sciencesb 231 1.9 830 5.2 1,563 10.4 2,624 6.0
M.D./Ph.D. recipient Coterminousc 1,319 2.5 370 2.3 253 1.7 1,942 4.4 Not coterminous 122 1.0 178 1.1 111 0.7 411 0.9
Received a master====s degree Same institution as Ph.D. 1,841 14.8 3,557 22.2 3,902 26.0 9,300 21.4 Different institution than Ph.D. 2,230 17.9 4,627 28.9 5,550 36.9 12,407 28.5
Note. Data are from the NRC Doctorate Records File (1994), the NIH Trainee and Fellow File (1994), and Association of American Medical Colleges Master Information System (1994). The NRSA group are those who had at least nine months of F30, F31, or T32 predoctoral support. Percentages may not total to 100.0 due to rounding.
a Other biological sciences include environmental sciences, medicinal chemistry, zoology, and fields not otherwise mentioned. b Other health sciences include such fields as environmental health, pharmacy, and veterinary medicine. c These individuals earned both an M.D. and a Ph.D. by 1992, with no more than four years having elapsed between receipt of the two degrees.

Appendix C. Data Tables for Chapter 2
Appendix Table C.8 Selected Characteristics of the NRSA Predoctoral Study and Comparison Groups: Behavioral Sciences
C-21
Group Group Ph.D.s with NRSA
Predoctoral Support (n=2,144)
Ph.D.s from NIH Training Institutions
(n=6,684)
Ph.D.s from Non-NIH Training Institutions
(n=14,388)
Total, All Ph.D.s (n=23,216)
N % N % N % N %
Demographic characteristics Gender
Female 1,223 57.0 3,422 51.2 7,294 50.7 11,939 51.4
Race/ethnicity American Indian or Alaskan Native 9 0.4 31 0.5 51 0.4 91 0.4
Asian or Pacific Islander 50 2.3 189 2.8 305 2.1 544 2.3 Black 117 5.5 279 4.2 457 3.2 853 3.7 Hispanic 99 4.6 262 3.9 394 2.7 755 3.3 White 1,834 85.5 5,747 86.0 12,858 89.4 20,439 88.0 Other/no report 35 1.7 176 2.6 323 2.2 534 2.3
Age at time of doctorate 28 years or younger 333 15.5 626 9.4 1,317 9.2 2,276 9.8 29-30 years 446 20.8 920 13.8 1,984 13.8 3,350 14.4 31-35 years 794 37.0 2,400 35.9 4,680 32.5 7,874 33.9 36 years or older 482 22.5 2,353 35.2 5,601 38.9 8,436 36.3 No report 89 4.2 385 5.8 806 5.6 1,280 5.5

Appendix C. Data Tables for Chapter 2
Appendix Table C.8 (continued) Selected Characteristics of the NRSA Predoctoral Study and Comparison Groups: Behavioral Sciences
C-22
Group Group Ph.D.s with NRSA
Predoctoral Support (n=2,144)
Ph.D.s from NIH Training Institutions
(n=6,684)
Ph.D.s from Non-NIH Training Institutions
(n=14,388)
Total, All Ph.D.s (n=23,216)
N % N % N % N %
Age at time of doctorate Median 31.4 33.6 34.0 33.7 Mean 32.8 35.1 35.6 35.2 Standard deviation 5.5 6.6 7.1 6.9
Educational characteristics Field of doctorate
Anthropology 183 8.5 1,134 17.0 2,266 15.8 3,583 15.4 Psychology
Cognitivea 88 4.1 98 1.5 529 3.7 715 3.1 Comparative and physi-
ological 178 8.3 294 4.4 454 3.2 926 4.0 Developmental 371 17.3 654 9.8 1,055 7.3 2,080 9.0 Experimental 205 9.6 496 7.4 1,224 8.5 1,925 8.3 Social and personality 312 14.6 571 8.5 1,120 7.8 2,003 8.6 Psychology, general 133 6.2 646 9.7 1,820 12.7 2,599 11.2 Psychology, otherb 142 6.6 436 6.5 1,246 8.7 1,824 7.9
Sociology 481 22.4 2,137 32.0 2,073 14.4 4,691 20.2

Appendix C. Data Tables for Chapter 2 C-23
Appendix Table C.8 (continued) Selected Characteristics of the NRSA Predoctoral Study and Comparison Groups: Behavioral Sciences
Group Group Ph.D.s with NRSA
Predoctoral Support (n=2,144)
Ph.D.s from NIH Training Institutions
(n=6,684)
Ph.D.s from Non-NIH Training Institutions
(n=14,388)
Total, All Ph.D.s (n=23,216)
N % N % N % N %
Received a master====s degree Same institution as Ph.D. 1,013 47.3 3,139 47.0 6,638 46.1 10,790 46.5 Different institution than Ph.D. 643 30.0 2,323 34.8 5,802 40.3 8,768 37.8
Note. Data are from the NRC Doctorate Records File (1994) and the NIH Trainee and Fellow File (1994). The NRSA group includes those who had at least nine months of F30, F31, or T32 predoctoral support. Not included are doctorates in speech and hearing sciences and clinical, counseling, and school psychology, along with those who also received an M.D. Percentages may not total to 100.0 due to rounding.
a Cognitive psychology was not listed as a separate field until the 1983 survey.
b Other fields in psychology include educational, industrial-organizational, psychometrics, quantitative, and all other nonclinical fields not otherwise mentioned.