appendix c downstream water quality impacts of …
TRANSCRIPT

-'
'.~'
APPENDIX C
DOWNSTREAM WATER QUALITY IMPACTS
OF DIVERSIONS FROM SUDBURY RESERVOIR
w. w, WAL.r~",~ 1127 Lowell Road
.concord, MA. 01742

Downstream Water Quality Impacts of Diversions from Sudbury Reservoir - Data Analysis and Model Calibration
prepared for
Interdisciplinary Environmental Planning, Inc. Wayland. Massachusetts
Parsons Brinkerhoff Quade & Douglas. Inc. Boston. Massachusetts
Metropolitan District Commission Commonwealth of Massachusetts
by
William W. Walker. Jr. Environmental Engineer
1127 Lowell load Concord. Massachusetts 01742
February 1983

TABLE OF CONTENTS
WATER QUALITY MODELING
DA T A COMPILA nON
DATA ANALYSIS
MODEL DESCRIPTION
MODEL CALIBRA TION
REFERENCES
Page
1
1
2
6
6

LIST OF TABLES
After Page No.
1. Stations and River Kilometer Indices -Sudbury/Concord Rivers 2
2. Summary of Hydrologic and Climatologic Data for DEQE Intensive Survey Periods 2
3. Summary - Reach Definitions for QUAL2 Sudbury River MDC Dam III to Talbot Dam 8
4. Morphometric and Hydraulic Properties of QUAL-2 Model Reaches Derived from HEC Output 8
5. Parameter Values Derived Primarily from Calibration of Model to Observed Water Quality Profiles and Other Site-Specific Characteristics 9
6. Generalized Parameter Estimates Derived Primarily from the Literature 9
7. Results of Water Quality Impact Simulations 13
8. Summary of Simulated Chlorophyll-a Concentrations 13
9. Summary of Simulated Fecal Coliform Levels 13

LIST OF FIGURES
After Page no.
1. Elevation at Sherman Bridge vs. Flow at Lowell 2
2. River Hydrographs for DEQE Intensive Monitoring Periods 2
3. Distribution of Mean Monthly Flows Measured by the USGS at Lowell, 1959-1981 2
4. Spatial Variations in Daily Mean Oxygen Concentrations During DEQE Intensive Monitoring Periods 3
5. Spatial Variations in Daily Minimum Oxygen Concentrations DuringDEQE Intensive Monitoring Periods 3
6. Relationship between Flow at Lowell and Dissolved Oxygen at Route 117 Bridge by Season 3
7. Relationship between Flow at Lowell and Dissolved Oxygen Deficit at Route 117 Bridge by Season 3
8. Oxygen Violations Observed at the Route 117 Bridge as a Function of Flow at Lowell and River Temperature 3
9. Spatial Variations in Chlorophyll-a Concentrations During DEQE Intensive Monitoring Periods 4
10. Time Series of Total Coliform Measurements at Three Locations in the SuAsCo Basin Derived from Concord DNR Data 4
11. Spatial Variations in Total Coliform Measurements (11/100 ml> During Different Survey Periods 4
12. Spatial Variations in Fecal Coliform Measurements (11/100 ml> During Different Survey Periods 4
13. Correlation Between Total and Fecal Coliform Measurements 5
14. Control Pathways in QUAL-II 6
15. Schematic Map of QUAL2 Model Reaches QUAL2 Reach Map for Sudbury/Concord Rivers 7
16. Observed and Predicted Chlorophyll-a Profiles 10
17. Observed and Predicted Nitrate-Nitrogen Profiles 10
18. Observed and Predicted Daily-Mean Dissolved Oxygen Profiles 13
19. Observed and Predicted Daily-Minimum Dissolved Oxygen Profiles 13
20. Observed and Predicted Fecal Coliform Profile (June 1979) 13

Sum!rI
A mathematical model is developed and tested for the purpose of predicting the potential downstream water quality ~pacts of diversions from Sudbury Reservoir. The model s~ulates spatial variations in ~portant water quality components, including nutrients, algae, organic matter, dissolved oxygen, and coliform bacteria, from Framingham to Billerica. Model s~ulations and data analysis indicate that river water quality conditions are controlled primarily by the relatively low hydraulic gradient and interactions between the river and adjacent wetlands, especially during summer flooding events.
!!!tt Quality Modeling
This section describes the technical bases for the assessment of the potential impacts of diversion from the Upper Sudbury on downstream water quality with respect to dissolved oxygen, algae, and fecal coliform bacteria, and temperature. The assessment is based upon analysis of historical monitoring data and upon a mathematical model which has been calibrated and applied to predict downstream water quality profiles for various base flows, temperatures, and diversion strategies. In accordance with the hydraulic analysis, the ~pact assessment is focused on the 51-kilometer portion of the Sudbury and Concord Rivers between MOC Dam Number 1 at Winter Street, Framingham, and Talbot Dam in Billerica. This section is organized according the following topics:
Data Compilation Data Analysis Model Description Model Calibration
Results of model applications to assess potential diversion ~pacts are discussed in the Sudbury River Environmental Impact Report and summarized in Tables 7, 8, and 9 of this Appendix.
~ Compilation
An extensive effort was undertaken at the beginning of the study to compile and computerize pertinent hydrologic and water quality data from the study area, including:
(1) Monthly Iydrologic File: monthly mean discharges at three key gauging stations in the basin (Sudbury River at MDC Dam #1 in Framingham, Assabet River at Maynard, Concord River at Lowell). water years 1959 through 1981.
(2) R!i!I Hydrologic File: mean discharges at the above locations on and for two weeks preceeding the days of water quality sampling by the DEQE.
(3) Ilev.tiop Record ~ measured elevation. at Sherman Bridge and Stone Bridge, Wayland, and corresponding daily flows at the above three flow gauging station.;
(4) Concord R!& ~ QpalitI ~ monthly measurements at three

locations on the Assabet, Sudbury, and Concord Rivers conducted by tbe Concord Department of Natural Resources between 1973 and 1978;
(5) ~ ~ Quality File: data from intensive lurveys conducted by tbe Massachusetts Division of Water Pollution Control, Department of Environmental Quality Engineering, during 1965, 1973, 1977, and 1979,
A station coding system based upon river kilometer bas been deligned to permit lorting and merging of DEQE water quality data from different survey periods. Tbe Itation codes and river kilometer indicel in Table 1 provide a frame of reference for interpretation of tbe plots discussed below. Cl~atologic data pertinent to the modeling effort bave also been acquired and used in the analYlis, but not computerized.
The water quality data bases described above bave been subjected to a variety of statistical and graphical analyses in order to develop lome perspective on historical water quality conditions. Ipatial and temporal variations, and controlling factors. Key results are lummarized below witb respect to the variables of intere.t (oxygen. algae. and coliform bacteria).
Table 2 summarizes relevant hydrologic and cl~tologic data during DEQE monitoring periods. The most reliable water quality info~tion comes from the intensive DEQE surveys in July 1973, August 1973, July 1979, and August 1979. Tbe.e included three-day, diel sampling for dissolved oxygen and duplicate sampling for the other water quality variables. The remaining .urveys employed single. grab-Iampling only. Tbe August 1979 data are not useful for modeling purpose. because of wet weather (3.7-inch antecedent rainfall) and rising flow conditions de.cribed below.
Figure 1 depict. the relationlhip between vsrws elevation measurements at Sheraan Bridge (RKM 36.1) and USGS flow .easurements at Lowell (RXK 1.6). The correlation between these .ealurementI il attributed to tbe backwater effects of Talbot Dam, an ~portant hydrologic feature of the basin also indicated by BEC-II I~ulatioal. The plot and regre.sion equation are based upon daily measurementl during 1981 and 1982. Additional testing indicate. tbat Sherman Bridge elevations are le.s .trongly correlated witb upstream flowl (Saxonville or MDC11) and that tbe residuall from the regre •• ion equation in Figure 1 are independent of the ratio of floy at MDCI1 to tbe floy at Lowell.
Bydrographs for the periodl preceeding and during I .. pling are depicted in Figure 2. To provide some perspective on flow rangel, Figure 3 depicts leasonal variationl in .ean .oathly flOYI .ealured by th~ USGS at Lowell between 1959 and 1981. The Augult 1973 lurvey Yal representative of summer, low-flow conditionl, lince the average discharge at Lowell was 171 cfl, compared with the .edian Augult flow of 115 cf. and the U.S. Fish and Wildlife Service summer criterion of 185 cfl (.5 cfs/.i2). The other surveys were conducted during relatively high flow (673 - 760 cfs) periods in relation to "normalM summer flow regimes.
Despite the conditions varied shown in Figure
fact that average flows were .~ilar, hydrologic considerably among the three high-flow lurveys. AI
2. the July 1973 and June 1979 surveYI were conducted
-2-

-~'
Table 1 Stations and River Kilometer Indices - Sudbury/Concord Rivers
CODE Location
SOl Fruit St S02 Cordaville Road S03 Chestnut Street S04 Route 135 S05 Winter Street, above Dam #1
MDC Dam Number 1 S06 Central Street, first bridge S07 Central Street, above dam
Colonna Dam, Saxonville S08 Central Street, below dam S09 Elm Steet 510 Danforth Street Bridge 511 Stone Bridge Road S12 Pelham Island Road
Confluence Hop Brook 513 Route 20 S14 Route 27 SIS Lincoln Road/Sherman Bridge S16 Route 117 S17 Sudbury Road S18 Nashawtuc Road
Confluence Assabet S19 Lowell Road S20 Route 225 S21 River Street S22 Route 129 S23 Pollard Street S24 Above Talbot Dam S25 Route 495 S26 Lawrence Street S27 Rogers Street 528 Route 133 S29 Route 38/110
Confluence l-lerrimack River
Town
Hopkinton Ashland Ashland Ashland Framingham Framingham Framingham Framingham Framingham Framingham Framingham Framingham Fram./Wayland Wayland Wayland Wayland Wayland Lincoln/Sudb. Lincoln/Conc. Concord Concord Concord Concord Carlysle/Bedfd Billerica Billerica Billerica Billerica Lowell Lowell Lowell Lowell Lowell Lowell
Mile Kilometer
44.7 40.7 39.3 38.9 36.1 36.1 34.2 31.8 31.8 31.8 31.1 30.1 30.0 26.6 26.2 26.1 25.1 22.4 20.0 17.7 15.7 15.2 15.4 11.0 7.1 6.0 5.2 4.5 2.5 1.6 1.0 0.6 0.2 0.0
72.0 65.5 63.3 62.6 58.1 58.1 55.1 51.2 51.2 51.2 50.1 48.5 48.3 42.8 42.2 42.0 40.4 36.1 32.2 28.5 25.3 24.5 24.8 17 .7 11.4 9.7 8.4 -7.2 4.0 2.6 1.6 1.0 0.3 0.0

Table 2 Summary of Hydrologic and Climatologic Data for
DEQE Intensive Survey Periods
Survey 1 2 3 4
Year 73 73 79 79 Month 7 8 6 8 Days 10-12 28-30 10-13 13-15
Mean Flows (cfs) Concord R. @ Lowell 760 171 673 690 Assabet R. @ Maynard 183 58 84 300 Sudbury R. @ MDcftl 102 24 156 145
5-Day Antecedent Precipitation (in) .19 .10 .12 3.70
Water Temp (Deg. C) 24-25 24-25 19-21 17-18
Air Temp (Deg. C) 19-24 25-27 12-18 13-17
Cloud Cover (tenths) .4-1.0 .1-.8 .2-.6 .6-.9

118
111 ,..... ~ U)
~ 116 .. E-< ~ .......
115 ~ l!> 0 H 114 ~ p::)
~ 113 ~ :x: U) 112 E-< < z 111 0 H E-< < :> 110 ~ ~ ~
109 I I
0 300
Figure 1
Elevation at Sherman Bridge vs. Flow at Lowell
600 I I I , I
900 1200 1500 1800 2100
FLOW AT LOWELL (CFS)
r I
2400 2700
Regression Equation based upon 1981-82 measurements:
2 E = 112.55 + 3.845E-03 X - 1.216E-06 X
X = Q - 700
2 2 R = .992, SE = .031, n = 55
where,
3 + 2.482E ... 10 X
E = Elevation at Sherman Bridge (ft, msl)
Q = Flow at Lowell (cfs)

(
1500
en 1300 u.. u 1200
'" 1100 -' -' W
~
o -'
l-. <t:
~
0
-' u.. 200
(
June 79 3_3,,3 ............ I
lZ.3-....... . ,....1-1, 1'1 July 73 3)<1 ....... I! I 3,3-....... '-1-....,
/ 3-.3 ....... 3 L... 4
....... 3_3....,. "~,/ I 3_>~! / . 4 Aug 79 4 ........ ~/1. 4/oJ
1 .... 2-++- 2_ 2".., . . /
1- 1...,..2 4~Mf!f2""'i'l=l'2 2'1+.~ .... 2tl+ 2l!-+<2* 2 2-.+ 4 ....... "- 4-4- ~ I., Aug 73
• SURVE1 , , -12 -C} -6 -3 0 3
DAYS BEFORE SURVEY
~ .... < !II '1
::: '< 0. '1 o
OQ '1 C3
"1:j ::r QI
.... o '1
t:::1 rrl .0 rrl
H ::s .... !II ::s QI .... < !II
:3:: o ::s .... .... o '1 .... ::s en "1j !l) '1 .... o 0. til
~,
~ .... OQ c: '1 !II
N

Figure 3
Distribution of Mean Monthly Flows Measured by the USGS at Lowell, 1959-1981

during periods of falling discharge, and the August 1979 survey. during a period of rising discharge, attributed to a 3.7-inch rainstorm which began 3 days prior and ended on the second day of sampling. The major hydrologic difference between the July 1973 and JUDe 1979 .urvey. i. that the former followed a major summer storm, while flows were decreasing .easonally during the latter. The peak daily flow of 1200 cfs prior to the July 1973 survey was exceeded only three other times during July between 1937 and 1981. These hydrologic differences have ~portant effects on water quality conditions because of the wetland interactions discussed below.
Spatial variations in daily mean and daily min~um dis.olved oxygen concentrations are plotted in Figure 4 and 5, respectively. Violations of the 5 mg/liter Class B criterion are indicated for three out of the four DEQE surveys based upon mean dissolved oxygen. All .urveys indicated violations between Pelham Island Road (RKM 42.8) and Nashawtuc Road (RKM 25.3), just above the confluence of the Allabet, ba.ed upon daily minimum concentration. Thi. section of river il characterized by a low elevation gradient and large areas of adjacent wetlands.
Dissolved oxygen levels were clearly lower during the July 1973 sampling. Diel oxygen fluctuations below Stone Bridge Road (RKM 48.3) were also low compared with those measured during the other lurveys, indicating suppre.lion of photosynthesis. These severe conditions can be attributed primarily to death and decay of flooded wetland vegetation and subsequent loading of organic materials (oxygen demand) during the falling limb of the storm hydrograph. Correspondence on file with the Massachusetts Division of Fisheries and Wildlife contains evidence of even more severe water quality conditions occuring during 1938, following a larger July flood (3710 cfs). While the July 1973 and June 1979 flows were similar, the latter occurred relatively early in the growing season, when the surrounding wetlands would tend to be dominated by flood-tolerant vegetation and accumulated biomass would be relatively low.
Additional perspectives on oxygen variations in the Sudbury are provided by Figures 6, 7, and 8. These plots are based upon oxygen and temperature data taken at the Route 117 bridge (RKM 32.2) by the Concord DIR, between 1973 and 1978, and by the Mass. DEQE, between 1973 and 1979. Figure 6 shows dissolved oxygen concentrations at this location as a function of Concord River flow at Lowell. As described above, the elevation and morphometry of the Sudbury below Stone Bridge Road (RKM 48.3) are controlled more by the flow at Talbot dam (6 kilometers above the USGS gauging station at Lowell) than by the inflow at MDt#l because of backwater effects. During summer months, oxygen levels are negatively correlated with flow. This probably reflects increasing wetland impacts during summer high flows. Increased algal and/or aquatic plant photosynthesis during low flows is probably another contributing factor, since the diel oxygen fluctuation measured during the DEQE low-flow survey of August 1973 was relatively large ( 4 to 13 mg/liter). A similar flow/concentration relationship is not apparent for October-May samples, which are consistently above the 5 mg/liter criterion. This presumably reflect. lower water temperatures and less biological activity during the fall, winter, and spring months.
Corresponding plots of dissolved oxygen deficit vs. flow are given in Figure 7. The oxygen deficit is computed as the saturation concentration of oxygen at the river temperature minus the observed oxygen concentration. The oxygen deficit reflects the balance between oxygen inputs (attributed to aeration and photosynthesis) and outputs
-3-

'"' --' ......... c.!l
::E ....,
-0
-0
~
c:::(
w :E
10
9
8
7
6
5
4
3
2
1
0 I
60
Figure 4
Spatial Variations in Daily Mean Oxygen Concentrations During DEQE Intensive Monitoring Periods
li_
)July 73 /1---';"1 -1---1
I I I t I , , I , I ,
55 50. 45 40 35 30 25 20 15 10 5
RIVER KILOMETER

10 ----1 9 ........ l.!:) 8
E: 7 ........
- 6 0
- 5 0
:E: 4 => :E: 3
- 2 z: - 1 :E:
0 I
Figure 5
Spatial Variations in Daily Minimum Oxygen Concentrations During DEQE Intensive Monitoring Periods
fJU1y 73 1 -1
/~ ~l 1
I I I I I I I I I I I
60 55 50 45 40 35 30 25 20 15 10 5
R I V E R K I L 0 f1 E T E R

Figure (,
Relationship between Flow at Lowell and Dissolved Oxygen at Route 117 Bridge by Season
---I ....... UJ
::E:
o
.-.. --I ....... UJ
::E:
0
14.0
0 0
12.0 ~range of diel measurements
0 It
10.0 0 It
0 CI>
8.0
o
6.0 o o __ a ~_
4.0
o 0
June - Sept. 2.0
o • Concord DNR
It - Hass. DEQE 0 I O.O+�-----------+�---------~I----------;~~-------~I~·
1.7 2~1 2.5 2.9 3.3
LOG(FLOW"CFS)
14.0
0
12.0 0
0
10.0 CI> 0
8.0
0
6.0
4.0
2.0 . October - Hay Samples o • Concord DNR It - Mass. DEQE
0 ~
o 0
CI>
0 0
0 o IDOO
CI> 0
00
0
0
o 0
00 CI>
0 It
CI>
It
O.O+I--------~I __ ------~I~------~I--------_+I-· 1.7 2.1 2.5 2.9 3.3
lOG(FLOW"CFS)

Figure 7
Relationship between Flow at Lowell and Dissolved Oxygen Deficit at Route 117 Bridge by Season
10.0
- 8.0 -.J -U::J 6.0 ::E
4.0 t- o
o U 2.0 -;
LL-0.0
UJ
c:::a x
o o
o
o
o
o
o
o
i
I _ .-2.0 0 0 ~range of diel measurements
o x 0 June - Sept.
0 o s Concord DNR c:::a -4.0
-.J -C)
:s::
t-
U
LL-UJ
c:::a
0
c:::a
x .. tlass. DEQE
r r , -6.0~r ________ -+ ________ ~ ________ ~ ________ ~
1.7 2.1 2.S 2.9 3.3
10.0
8.0
6.0
4.0
2.0
0.0
-2.0
-4.0
LOG{FLOW1CFS)
0
o 00
o
0 0
----~-.Jl. _
o
October - .lay Samples
o .. Concord DNR x - Mass. DEQE
o
o
o
o 0 o
om
'b
o o
x
_0 __ 0 __
o o 0
o
-6.0~1 ________ -+r ________ -rr _________ r~ ______ ~r~·
1.7 2.1 2.S 2.9 3.3
lOG(FlOW1CFS)

Figure 8
Oxygen Violations Observed at the Route 117 Bridge as a Function of Flow at Lowell and River Temperature
3.5
0
3.2 8 0. - M G / L 0 .g 0 D. ,.....
00 m en as 0 LL 0 5 2 u 2.9 00 8 0 0
0 0 0 0 0
~G "\ 0
~ 0
a 0 o x + -I 2.6 .+
u... 0 + ........ 0
0 0 (.!) 2.3 0 0
a -I 0 0
0 0 0
2.0 0 0 0 0
0
0
1.7 I I I I I I I I I I 0.0 3.0 6.0 9.0 12.0 15.0 18.0 21.0 24.0 27.0.
T E f1 PER A TU R E (DEG-C)

(at~_iJ~ted to microbial respiration and decay of organic materials). A value of zero indicates that oxygen concentrations are at equ;l~brium with the atmosphere. Dominance of respiration or photosynthesis is indicated by positive or negative values, respectively. The summer plot shows that the balance is shifted toward oxygen sinks during high flows and toward oxygen sources during low flows. The importance of photosynthesis as an oxygen source is indicated by the negative deficits measured on several occasions during low-flow periods.
Figure 8 provides an alternative representation of the Route 117 data. ApproxVDate contours of 5 and 2 mg/liter oxygen measurements are indicated on a plot of flow against river temperature. This display clearly shows that violations of these criteria are typical of warm, wet periods. In a "normal" river system, oxygen concentrations would generally be lowest during warm, dry periods.
The steadily increasing oxygen concentrations between river kilometers 42 and 20 during the low-flow survey of August 1973 can be partially attributed to increasing algal concentrations, as shown in Figure 9. The peak algal popUlation of 30 mg Chlorophyll-a/m3 was roughly three times that observed during the high-flow survey of June 1979. The increased algal growth in July of 1973 can be attributed to higher temperatures (24 vs. 20 degrees C) and longer hydraulic residence time (approximately 21 days vs. 7 days). The lack of ortho-phosphorus data precludes direct assessment of growth-limiting nutrients, although total phosphorus data and model simulations (described below) indicate that phosphorus was probably not limiting during any of the survey periods. Nitrate and ammonia profiles indicate that nitrogen limitation may have developed at peak chlorophyll-a levels during the low-flow survey.
Total and fecal coliform data derived from surveys by Concord DNR (1973-1978). Mass. DEQE (1973-1979), and IEP (1982) are displayed in Figures 10-12. In interpreting the spatial displays (Figures 11 and 12), note that data from 1973 and 1979 are based upon replicate sampling and are therefore more reliable than data from other years.
Figure 10 shows time series of Concord DNR total coliform data at three locations in the basin between 1973 and 1978. Colifora counts are displayed in relation to 1000 organisms/100 ml, formerly the state criterion for Class B waters. Decreasing trends in the measurements are indicated at all three stations. The trend is most apparent at the Assabet station and probably reflects upstream point source abatements.
Spatial variations in total coliform levels measured during four different years are shown in Figure 11. Consistent with the trends noted in the Concord DNR data, the 1973 spatial profiles were generally higher than those measured in subsequent years. Concentrations tend to increase moving through the Framingham area (RKM 58 to 48) and probably reflect urban runoff and the effects of a leaking sewage pumping station between Saxonvil1e Dam and Elm Street, which was repaired prior to the 1979 surveys, according to DEQE sources. During the June 1979 survey, coliform levels declined below Framingham and increased at the mouth of the Assabet, while levels showed less spatial variation during other periods. Fecal coliform variations for 1977 and 1979 are shown in Figure 12 in relation the Class B criterion of 200 organisms/100 ml (monthly log-mean).
Interpretation of complicated by changes data, by inconsistencies one year the next. by
the total and fecal coliform profiles is in source conditions leading to trends in the
in the sampling freqencies and locations from possible seasonal effects on coliform loadings,
-4-

,...... I'i"\
:E , l.!)
:E ........
<I: I
-.J
::J::
u
30
25
·20
15
10
5
Figure 9
Spatial Variations in Chlorophyll-a Concentrations During DEQE Intensive Monitoring Periods
o +I--~I~--+I--~I----+I--~I~--+I--~I~--+I--~I~--+I--~I~--·
60 55 50 45 40 35 30 25 20 15 10 5
R I V E R K I L 0 M E·T E R

Figure:lO
Time Series of Total Coliform Measurements at Three Locations in the SUASCO Basin Derived from Concord DNR Data
Unit.: Oraan1s=. / 100 a1
LoS Scales Linear Scales
Sudbury River .. ~ Rte 117. Concord/Lincoln Line 6.0r-------------------..... 5.5
5.0
4.5
4.0
3.5
3.0
2.~
2.0
1.S
o o
o _~A _____ .----~-~-------____ _ o 00 0 0 0 0 0
o 0 0 00 0 0 0 o 0
0 0 0 0 0
o 0 0 0 CDCDOO 0 q, o o
CD
o 1.0,+-____________________ --______ --____________ -J
73.0
6.0
S.S
5.0
4.5
4.0
3.S
3.0
2.S
2.0
1.S
74.0 75.0 76.0
DAl'E
77 .0 78.0 79.0
A. •• bet liver @ Rte 62. Concord/Acton LiD.
o 0
0 0 0 0
0 o 0 00 0 0
0 0 0 00 0 0
0 0 o 0 00 0 0
0 0 0 0
0
- - - - - .. - 0- ...... - - -
o
• .0 0 0
0 -00-0- .... ~ .. -00
o 0
1.0~,--------~, ______ -+,------~,--------~,------________ ~,---. 73.0 74.0 75.0 76.0 77.0 78.0 79.0
6.0
S.S
5.0
4.S
4.0
DAn
Concord River @ ~numeDt Street. Concord
o o 0 0 0
o 00 0 OOCD 0 0
00 0 00 0 0 q,q, 0 CD 0
A----------------o~---o 0 0 00 o 00 0 0 0
o 0
100000
10000
1.000
100
100000
10000
1000
100
100000
10000
1000·
3.S
3.0
2.S
2.0
1.S
o ·100
_1.0~,--------.~------~ ______ ~, ________ ~,--____ _+,------~1 __ · 7~.C 74.0 75.0 76.0 77.0 78.0 79.0
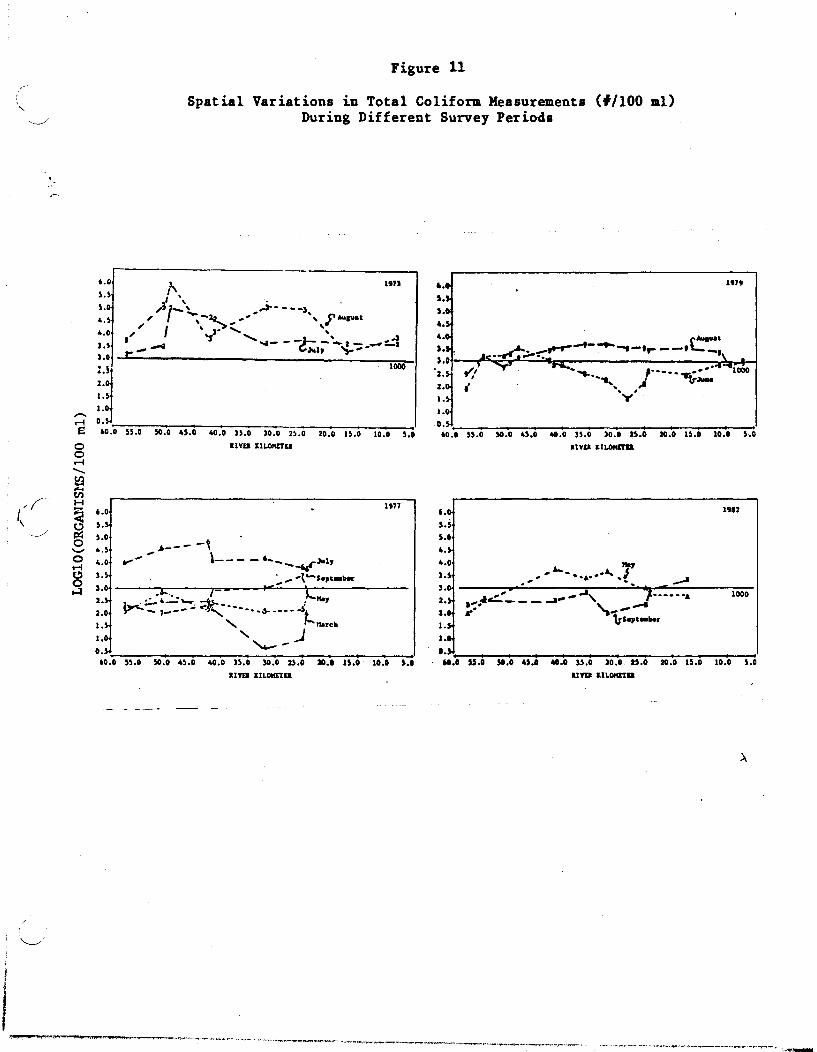
Figure 11
Spatial Variations in Total Coliform Measurements (#!lOO ml) During Different Survey Periods
'"'
•• 0
5.S
S.O ,.S •• 0
l.t 1.0
2.
1.
1.0
1971
l' I \ . . ";1-' ....,.----1
, ~ -lQ # ' ' '" F "'Iue, ~ I • >, '"
.~ ..; ....... ...,- - -I- -'-I - _::.:I _ - C;""l, "'- .... r 7"
1000
:.~ ~ O'S'~~~~~~~~~~~ __ ~'--______ ~'--______ '~~II
to.O SS.O 50.0 45.0 40.0 H.O )0.0 2S.0 20.0 U.O 10.0 5.0
o o ~ -5!3 .... tI.l H
~ ~
6.0
5.S
5.0
IIVD llJ.OItttD
'-' •• S ......... ~ 4.0 t!) 3.S o
1.0 6- I - po< r-...::I I.' .' '4~'- ~ .~Ma, ,I J~.-- . ~ _. • 2.0 y--7----· -----.s------5t. 1.50 .... ....!larch
1977
1.0 ',,- _..J D.S~_------~--____ ------~,----,----~I---+I--~I----,~--~I
60.0 5S.0 50.0 45.0 to.O n.o 30.0 n.o 20.0 15.0 10.0 S.D
IlYEI IlLOItETD
••• S.!
S.O
4.S
1.79
4.0 ('Au .... t
J.t. .......:-:. _,...--t--.- .... -.r- --.\.._., ) .ot--"f ......... "'··cir"t.;;-;....;·.:·c.:::r"------------::r.'~~---H , • Jl~' ----.... • ..• __ •• •· .. -iooo ::; ;' -'''''" J ~JuM 1.S ''1'' 1.0
O.S,.,--:~ __ ~,:", ~~, __ ":-':'--:~--~,:"I ---::-~, -::-'--::-:--C'~-:-:-"::' -:-!,' 60.0 5S.0 50.0 4S.0 40.0 3S.0 )0.0 IS.O 20.0 IS.O 10.0 5.0
6.0-
S.5-5.0
4.50
4.0 .. A... • .. MaS'
1912
'.So , ". • •••• ".... ____ 3.0- ----..,.....;.---....... ,----=--...... J..-~------:~ .. .. .... __ , r"--". 1000 1.~ :;.. ~ ___ -I '-__ ......
1.0 Us.pt .... r 1.S
1.0
D.S I I I I I I , , I
, 60.' 55.0 50.0 4'.1 ".0 n.D 20.0 U.O 10.0 5.0
~, ,------- ~ -=~ ... ----..-.-..--------~--.--~--~. -.. ~"-.,.,~--- - ~.-.---~-----.~.- .-~,-~ ...... -~ "

~ .' , «(
Figure ).~
Spatial Variations in Fecal Coliform Measurements (#/100 ml) During Different Survey Perio~s
3.r-~--------------------------~
-I.
" .. -,\ -..,6-- .,
, .," 6- _ _ 6.,-.Ja17 i"" .... -6-- _.
1977
_\.,.. • .,t __ ----------------------~~>~,~--=-~~1~-------------,2~A~·
"'" 1---" ~1::.-:. -.::.-! ". 4--, ~.7
.. ". ,' ... _. ~rCh ,. 1- - ::.. .. .-...-.....l
0.. . I , • I • • • • • • 60.0 5'.0 50.0 45.0 .0.0 35.0 30.0 25.0 20.0 15.0 10.0 5.0
3.
2.
1.
1.1
0.1
I t .......... --
" r . .... _9--9
UftIl t:lLOIfITD
1979
'II , 1-- ___ 1_ - --' .... or
,t 'JuAe 'a , " I .. ,
'y
o.s. I , I I I I I I I I I
60.0 55.0 50.0 45.0 60.0 35.0 30.0 25.0 20.0 15.0 10.0 5.0 IUD ULOMITII

and by the high variability which is inherent in these types of measurements. Figure 13 shows, however, that total and fecal coliform measurements are highly correlated. Generally, summer coliform profiles tend to be higher than those observed for other seasons. Higher summer counts may reflect (a) less dilution of coliform sources because of lower flows; (b) lower coliform decay rates attributed to higher algal concentrations and less light penetration; (c) possible growth of organisms in the river during periods of high temperature and organic matter concentration; (d) increased non-point loadings during the summer attributed to wildlife and/or other natural sources. Existing data do not permit sorting or ranking of these factors.
The measurements themselves are relative indicators and violations of the criteria do not necessarily suggest public health problems related to pathogenic bacteria. The significance of coliform levels and variations should be interpreted in relation to present and projected uses of the water for bathing and drinking. Interest and use for bathing is low; there are no "beaches" and the appeal is low because of natural water color and organic substrate. Billerica's drinking water supply is protected by routine filtration and chlorination procedures.
Regression analyses of DEQE and Concord DNR river temperature data from the Route 117 bridge have been performed in order to assess relationships with flow and clbDatologic variables. Air temperature is a major generally a major determinant of surface water temperatures (Linseley et al., 1968). Variations in flow may influence water temperature. because of changes in mean depth, velocity, .urface area, and residence tUne. The spillage of water over dams (MDC#1 and Saxonville) before entering the Lower Sudbury would tend to promote equilibration of water temperatures with ambient clUnatologic conditions and reduce temperature sensitivity to flow. Water temperatures between Kay and October are generally of primary concern with respect to dissolved oxygen, other water quality aspects, and fisheries.
The following regre.sion equations are based upon 27 water temperature measurements aade at the Route 117 bridge between Kay and October:
where,
2 Tv • 5.88 - .016 Qs + .84 Ta (R • .84,
2 Tv • 5.80 - .0033 Ql + .85 Ta (R • .84,
Tv· water temperature at route 117 (deg C) Ta • monthly-mean air temperature (deg C) Qs • flow at MDC#1 (cfs) Ql • flow at Lowell (cfs)
2 Se • 3.6)
2 Se • 3.7)
The regressions indicate that air temperature is the aajor controlling factor, although the flow terms are also statistically significant (p< .05) in both cases. Logarithmic transformations for the flow terms have also been tested, but found to explain leIS variance than the linear models. Using the regression with the highest flow coefficient (.016 vs. Qs). a diversion of 40.gd (64 cfs) would be expected to result in a temperature increase of 1.06 degrees C at the Route 117 bridge. Tbe
-5-

Figure 13.
( Correlation Between Total and Fecal Coliform Measurements
Units: Organis~s / 100 m1 .
3.5 ....
-. en .. - ,
E 3.0
!it"'
c::: 0
2.5 u.. ---J 0
0 2.0 0 Y - -.28+ .77 x u 2
- .79 .r
"' --J . 1.5 s.2 - .097 <C u
(( LLJ 1. 0 u..
.-./ - (II) to!:)
0 0 •. 5 --J
0.0 I I I I I I
0.0 1.0 2.0 3.0 4.0 5.0
LOG(TQTAL CO·L I FO RMS)

maximum feasible diversion under a median (based upon BEC-II s~ulations) would result Temperature changes of this scale would significant ~pacts on aquatic life or water
~ pescriptipn
August flow regime, 12 agd, in a .32 deg C increase. not be expected to have
quality.
A version of th~ OUAL-2 vater quality s~ulation model has been used to assess diversion options. QUAL-2 is a steady-state model which was originally developed for use in wasteload allocation studies (Water Resources Engineers, 1972). Many subsequent versions of the model bave followed (Roesner et al., 1981). The basic algorithm used here was developed and used in wasteload allocation studies of the Lower Winooski River in Vermont (Meta Systems, 1979, Veraont Department of Water Resources, 1982, VanBenschoten and Walker, 1982). Improvements over earlier versions especially important for this application include:
(1) addition of detrital organic nitrogen and organic phosphorus compartments;
(2) updated algal growth kinetics (self-shading, algal ammonia uptake, alternative (vs. multiplicative) nutrient limitation by nitrogen or phosphorus);
(3) provision for simulating diel variations in oxygen attributed to photosynthesis and respiration by algae and aquatic plants;
(4) improved .~ulation of longitudinal dispersion (Fischer et al., 1979);
(5) provision for nonlinear hydraulic geometries;
(6) modification of the numeric solution algorithm to permit application to systems with relatively long residence time.;
The program code bas been adapted for use on microcomputers and tested against the original code using input files for the Lower Winooski.
Control pathways in the model are shown in Figure 14. The model simulates the transport and transformations of water quality components in a one-dimensional system under steady-state hydraulic conditions. Boundary conditions are specified in terms of source and tributary flows and concentrations, day length, solar radiation, benthic sources and sinks, channel hydraulic geometry, and water temperatures. The model divides the river in to a series of computational element. and perfonas water and mass balances on each element, while taking into account sources, sinks, and transformations. All rate processes are temperature-dependent. The output is a longitudinal profile (concentration vs. river kilometer) for each water quality component at equilibrium with the specified boundary conditions.
Model £.libration
The uniqueness of each system and limitations in the state-of-theart require that the model be calibrated and tested in each application. Calibration involves selecting an appropriate set of parameters so that model predictions are in "reasonable" agreement with measured water
-6-

/
Figure 14
Control Pathways in QUAL-II
ORGANIC N
1 AMMONIA N
1, \ NITRITE
l' NITRATE
ATMOSPHERIC REAERATION
I / BENTHIC DEMAND
---.-" C-BOD --~
P

quality conditions. The parameters characterize various physical, chemical, and biological processes which influence water quality (e.g., organic matter oxidation rate, algal growth rate, etc.). Parameter estimates for the Winooski River and other systems (Zison et al., 1978) provide reasonable starting points for calibration of the model to the Sudbury. Testing involves demonstrating that the calibrated model can simulate water quality conditions during more than one survey period.
The first step in applying a model of this type is the definition of reaches with relatively uniform morphometric and hydraulic characteristics. Output from the BEC-2 hydraulic simulation model has been used for this purpose. The BEC-2 output consists of estimated hydraulic characteristics (flow cross-section, top width, velocity, etc.) at each of 278 locations along the length of the river between Talbot Dam and MDC Dam #1, under each of nine different hydrologic regimes which represent various seasons and diversion strategies.
Reach boundaries and morphometric characteristics have been assessed by integrating the cross-sectional areas and top widths with respect to distance moving upstream from Talbot Dam. The integrated values, representing cumulative volume and surface area, respectively, have been plotted against river kilometer for each hydrologic regime. Reach boundaries have been specified at river kilometers corresponding to changes in the average slopes of these curves. This procedure averages over high-frequency variations in cross-section (attributed to bridges, for example). A total of 11 reaches have been defined in this way, as identified in Table 3. Tributary and local drainage areas for each reach are also listed in Table 3. The total wetland area draining into each model reach has also been estimated from aerial photographs of the 1968 flood and topographic maps. A schematic reach map is given in Figure 15. In performing balance calculations, the model further divides each reach into a series of "computational elements" (nominal length .4 km), so that the final simulation represents the river as a series of about 170 linked segments.
Table 4 summarizes the morphometric and hydraulic characteristics of each reach based upon integration of the HEC-2 profiles for each hydrologic regime. The relatively large fluctuations in width in reaches 4-6 reflect flooding of adjacent wetlands under high flow conditions. Hydraulic geometries are specified in QUAL-2 using functions of the following form:
where,
F • 10gI0{Qi/Qri)
WI F + W2 F W • Wr 10
2
2 Al F + A2 F
A • Ar 10
F • relative flow (dimensionless) Qi • outflow from reach i (m3/sec - ems) Qri • reference flow for reach i (cms) W • top width Wr • top width at flow Qri em)
-7-

Figure 15
QUAL2 Reach Map for Sudbury/Concord Rivers
RKM SOURCES RKM REACHES
58.60 1 Upper Sudbury ---------> V 58.60 1 MDC Dam #1 I I I I V 53.30 2 Mass Turnpike I V 51.30 3 Saxonville Dam I I V 48.30 4 Stone Bridge Road I I I I I
42.20 2 Raytheon --------------> V 42.80 5 Pelham Island Road 42.20 3 Hop Brook -------------> I
I I I I V 36.00 6 Sherman Bridge I I I V 31.30 7 Above Fairhaven V 30.50 8 Below Fairhaven I I I I
25.10 4 Assabet River ---------> V 25.20 9 Above Assabet I
23.50 5 Concord STP ---------> I I I I I I I I
14.50 6 Billerica HOC ---------> V 15.30 10 Bedford/Carlylse Line I I I I I I V 7.60 11 Talbot School V 7.10 Talbot Dam

A = cross-section (m2) Ar = cross-section at flow Qri (m2) Al,A2,Wl,W2 - empirical parameters for each r~ach
The model p~rmits referencing of width and cross-section in given reach . to the flow 1n any other reach. In a "normal", free-flowing stream, morphometry is referenced to discharge within each reach. To represent the backwater effects in this system, the morphometries of segments 4 to 11 (below Stone Bridge Road) are referenced to the discharge at Talbot Dam (Reach 11). Regression analyses of HEC-2 output confirm that morphometric properties in these reaches are more strongly correlated to flows at Talbot Dam than to flows within the respective segments.
Regression analyses have been done to estimate the parameters Al,A2,Wl, and W2 for each reach based upon the data in Table 4. Because the model is not applied under extreme high-flow conditions, data from the spring flood simulation (Run 9) have not been used in these regressions. This improves the quality of the fit for the lower flow regimes. In all cases, the regressions explain more than 98% of the variance in the simulated widths and cross-sections, with a maximum standard error of 5% and median standard error of about 1%. The above relationships essentially permit interpolation of the HEC-2 output.
Final parameter estimates for the morphometric relationships are included in the model output listings which have been submitted as an addendum to this report and which are available for review by interested parties at the offices of Interdisciplinary Environmental Planning, Inc.. Observed stage-discharge relationships at Sherman Bridge and the Billerica Water Treatment Plant intake have been used in combination with the HEC-2 output to estimate the morphometric parameters of each model reach. Reference width and cross-section have been adjusted in Reach 7 (Fairhaven Bay) to reflect the single HEC-2 cross-section included in this area. The model requires estimates of Manning's n values for calculation of longitudinal dispersion rates within each reach; these values have been derived from the HEC-2 input file.
DEQE surveys in July 1973, August 1973, and June 1979 have been used for calibration and testing of the parameters used in simulating water quality transformation processes. The 1973 surveys did not include monitoring of point sources (Raytheon-Wayland, Concord STP, and Billerica House of Correction). Flows and concentrations from the 1979 survey have been used in these cases. Based upon information supplied by the Concord STP operator. discharge during the August 1973 survey was about 600,000 gallons/day, or about half that measured during the 1979 survey. Model simulations are relatively insensitive to point source loadings. Average concentrations measured at MDC Dam #1 during each survey have been used to characterize upstream inflow and local, ungauged inflows to each model reach. Measured concentrations have also been used for the two major tributaries, Hop Brook and Assabet River.
The water balance during each survey has been derived from average measured flows of the Sudbury at MDC Dam #1, Assabet at Maynard, and Concord at Lowell. Ungauged inflows have been estimated by difference from the above measured flows and distributed on a drainage area basis. Assabet flows measured at Maynard have been adjusted based upon drainage area to reflect flows at the confluence with the Sudbury. Hop Brook flows have been estimated using the average ungauged runoff rates for the basin, estimated by difference according to the above scheme. Detaila on the relative drainage areas are summarized in Table 3.
-8-

Table 3 Summary - Reach Definitions for QUAL2 Sudbury River MDC Dam #1 to Talbot Dam
Approximate Drainage Areas
Total Local Wetland Rch Upstream Boundary
River Index
km km2 km2 km2 ------------------------------------------------------
MDC Dam #1 58.6 193.9
01 48.4 .43
Mass Turnpike 53.3 242.3
02 10.0 .20
Saxonville Dam 51.3 252.3
03 24.3 .05
Stone Bridge 48.3 276.6
04 14.5 4.54
Pelham Island Road 42.8 291.1
Hop Brook --> 42.2 58.3
05 32.4 16.70
Sherman Bridge 36.0 381.8
06 17 .9 7.63
Above Fairhaven Bay 31.3 399.7
07 2.8 0.28
Below Fairhaven Bay 30.5 402.5
08 17.1 2.05
Above Assabet 25.2 419.6
Assabet ---> 25.1 458.8
09 53.6 10.94
Bedford/Carlysle 15.3 932.0
10 52.1 1.80
Talbot School 7.6 984.1
11 4.7 0.12
Talbot Dam 7.1 988.8

Table 4 Morphometric and Hydraulic Properties of QUAL-2 Model
Reaches Derived from HEC Output
RCH RUN ELEV QOUT XSEC WIDTH ZM VEL -----------------------------------------------1 1 149.29 3.4 48.2 51.6 0.93 0.070 1 2 149.77 22.4 78.4 60.3 1.30 0.286 1 3 150.16 41.4 94.0 57.2 1.64 0.440 1 4 150.41 62.4 123.3 66.0 1.87 0.506 1 5 150.74 93.3 151.0 71.0 2.13 0.618 1 6 150.64 82.9 141.9 69.8 2.03 0.584 1 7 151.19 144.1 197.0 84.9 2.32 0.732 1 8 151.63 206.0 242.6 97.4 2.49 0.849 1 9 152.34 331.5 291.9 110.2 2.65 1.136
2 1 144.48 3.5 760.1 229.4 3.31 0.005 2 2 145.00 22.5 1143.6 260.8 4.39 0.020 2 3 145.25 42.0 1160.2 261.5 4.44 0.036 2 4 145.48 62.9 1174.5 262.1 4.48 0.054 2 5 145.78 93.8 1193.1 262.9 4.54 0.079 2 6 145.69 83.0 1186.9 262.7 4.52 0.070 2 7 146.22 145.6 1220.9 264.1 4.62 0.119 2 8 146.67 207.5 1249.9 265.4 4.71 0.166 2 9 147.59 334.0 1303.4 267.6 4.87 0.256
3 1 143.32 5.8 50.4 44.4 1.14 0.115 3 2 144.89 24.8 70.1 51.3 1.37 0.354 3 3 144.95 54.0 88.8 55.7 1.59 0.608 3 4 145.01 87.0 108.8 58.2 1.87 0.799 3 5 145.07 118.0 125.1 60.1 2.08 0.943 3 6 145.05 108.0 119.8 59.5 2.01 0.902 3 7 145.17 204.7 -165.7 63.6 2.61 1.235 3 8 145.28 266.6 194.2 65.7 2.96 1.373 3 9 145.46 430.0 272.6 93.2 2.92 1.578
4 1 110.63 6.7 135.0 67.0 2.02 0.050 4 2 111.05 25.7 160.1 78.1 2.05 0.161 4 3 112.03 58.0 212.0 87.8 2.41 0.274 4 4 112.38 96.3 292.9 117.7 2.49 0.329 4 5 112.68 127.3 332.6 134.2 2.48 0.383 4 6 112.59 Il7.0 321.7 129.7 2.48 0.364 4 7 113.89 227.5 776.5 387.5 2.00 0.293 4 8 114.31 289.4 923.5 469.8 1.97 0.313 4 9 115.59 468.0 1828.1 788.0 2.32 0.256
5 1 109.42 10.3 249.5 83.0 3.01 0.041 5 2 109.60 29.3 261.5 85.2 3.07 0.112 5 3 110.25 77.0 310.6 97.9 3.17 0.248 5 4 111.10 133.1 417 .4 162.3 2.57 0.319 5 5 111.38 164.1 457.7 182.1 2.51 0.359 5 6 111.32 154.0 449.1 178.1 2.52 0.343 5 7 113.13 317.8 1036.7 643.8 1.61 0.307 5 8 113.45 379.7 1235.6 754.1 1.64 0.307 5 9 114.89 615.0 2606.4 1150.8 2.26 0.236
------------------------------------------------(cont inued)

Table 4 (continued>
RCH RUN ELEV QOUT XSEC WIDTH ZM VEL -----------------------------------------------
6 1 109.41 11.4 479.2 125.1 3.83 0.024 6 2 109.53 30.4 493.5 127.1 3.88 0.062 6 3 109.98 83.0 553.1 155.3 3.56 0.150 6 4 110.74 145.3 705.9 259.4 2.72 0.206 6 5 110.93 176.3 753.4 282.2 2.67 0.234 6 6 110.90 166.0 747.5 279.5 2.67 0.222 6 7 112.73 347.8 1513.8 553.2 2.74 0.230 6 8 112.99 409.7 1654.9 571. 5 2.90 0.248 6 9 114.47 664.0 2575.8 677.7 3.80 0.258
7 1 109.41 11.4 3739.0 622.8 6.00 0.003 7 2 109.52 30.4 3808.3 626.3 6.08 0.008 7 3 109.93 83.0 4068.3 640.9 6.35 0.020 7 4 110.65 145.3 4544.0 678.1 6.70 0.032 7 5 110.81 176.3 4653.7 687.8 6.77 0.038 7 6 110.80 166.0 4642.9 686.6 6.76 0.036 7 7 112.59 347.8 6122.1 976.3 6.27 0.057 7 8 112.82 409.7 6354.7 989.5 6.42 0.064 7 9 114.28 664.0 7855.5 1075.6 7.30 0.085
8 1 109.41 11.4 809.8 194.5 4.16 0.014 8 2 109.52 30.4 831.1 196.5 4.23 0.037 8 3 109.93 83.0 911.5 204.6 4.46 0.091 8 4 110.65 145.3 1069.1 229.4 4.66 0.136 8 5 110.81 176.3 1102.4 237.2 4.65 0.160 8 6 110.80 166.0 1101.7 236.9 4.65 0.151 8 7 112.59 347.8 1603.7 355.0 4.52 0.217 8 8 112.82 409.7 1683.0 367.1 4.58 0.243 8 9 114.27 664.0 2258.9 427.4 5.28 0.294
9 1 109.41 90.0 1819.4 405.6 4.49 0.049 9 2 109.51 109.0 1856.1 412.5 4.50 0.059 9 3 109.88 182.0 1986.3 441.3 4.50 0.092 9 4 110.55 332.0 2258.5 527.6 4.28 0.147 9 5 110.67 363.0 2314.6 546.1 4.24 0.157 9 6 110.67 363.0 2232.9 518.4 4.31 0.163 9 7 112.38 855.1 3275.0 802.2 4.08 0.261 9 8 112.57 917.0 3416.1 882.5 3.87 0.268 9 9 113.95 1452.0 47~0.2 1080.3 4.43 0.303
10 1 109.37 96.0 886.7 193.6 4.58 0.108 10 2 109.45 U5.0 902.2 195.4 4.62 0.127 10 3 109.74 185.0 953.1 201.8 4.72 0.194 10 4 110.28 338.1 1047.6 212.9 4.92 0.323 10 5 110.37 369.0 1064.7 214.9 4.96 0.347 10 6 110.38 370.0 1065.1 214.9 4.96 0.347 10 7 Ill. 76 873.1 1344.3 281.1 4.78 0.649 10 8 111.92 935.0 1381.4 283.0 4.88 0.677
~ 10 9 113.14 1480.0 1669.5 304.8 5.48 0.886 ------------------------------------------------continued>

Table 4 (continued)
RCH RUN ELEV QOUT XSEC WIDTH ZM VEL ------------------------------------------------11 1 109.32 96.0 617 .9 185.7 3.33 0.155 11 2 109.40 115.0 629.3 188.0 3.35 0.183 11 3 109.62 185.0 670.7 194.5 3.45 0.276 11 4 109.99 338.1 744.5 203.5 3.66 0.454 11 5 110.05 369.0 756.0 204.7 3.69 0.488 11 6 110.05 370.0 756.1 204.8 3.69 0.489 11 7 110.80 873.1 908.0 220.1 4.13 0.962 11 8 110.89 935.0 929.0 221.0 4.20 1.006 11 9 111.47 1480.0 1056.7 225.3 4.69 1.401
RCH = QUAL2 Model Reach (see Table 3) RUN = HEC Run ID Number:
Flows (cfs) Run MDC#1 Talbot Diversion
1 3.4 96.0 19.0 Summer 2 22.4 115.0 0.0 " 3 41.4 185.0 0.0 " 4 62.4 338.0 31.0 Fall 5 93.3 369.0 0.0 " 6 82.9 370.0 0.0 " 7 144.1 873.0 62.0 Spring 8 206.0 935.0 0.0 " 9 331.5 1480.0 0.0 "
QOUT = segment outflow (cfs) XSEC = mean cross-section (ft2) WIDTH = mean top width (ft) ZM = mean depth = XSEC/WIDTH (ft) VELOCITY = mean velocity = QOUT/XSEC (ft/sec)

Monitoring data from the August 1973 (low-flow) survey indicated significant increases in ammonia nitrogen, total phosphorus, and total coliform bacteria in the short river reach between Saxonville Dam (RKM 51.2) and Elm Street (RKM 50.1) in Framingham. Discussions with DEQE staff indicate that significant sewage loadings were probably entering this section of river during that period from a leaking pumping station. Since these loadings were not monitored, they have been estimated in the model calibration procedure and held constant for the July and August 1973 surveys. The situation was reportedly corrected prior to the June 1979 survey.
The estimation of parameters in a model of this complexity is a subjective exercise, aided by the following:
(1) literature studies which provide indications of typical values and feasible ranges for the parameters which describe various water quality transformations at the process level (e.g., algal growth rate, organic matter decay rate, etc.), based upon laboratory experiments, field experiments, and lor other modeling efforts;
(2) published empirical relationships which permit estimation of certain parameters as a function of other system characteristics (e.g., reaeration rate as a function of depth, velocity, and temperature);
(3) direct measurement of certain parameters in the system being studied (e.g., light extinction coefficients based upon Secchi depths);
(4) inference of certain parameters by empirical adjustment to optimize the fit between observed and predicted profiles;
Key parameter estimates and sources for the water quality simulation are summarized in Tables 5 and 6. Parameters are placed in two categories. The values in Table 5 are site-specific characteristics which have been estimated primarily by calibrating the model to observed water quality profiles; these are generally within the ranges reported in modeling Itudies of other systems (Zison et al., 1978). The values in Table 6 are generalized parameterl which describe various water quality transformations; these have been estimated primarily from literature data and empirical functions. Because the parameters in Table 6 describe more or less fundamental (process-level) reactions they tend to be more constant from one river basin to another than those in Table 5.
Model calibration has focused initially on nutrient and chlorophyll-a data from the August 1973 and June 1979 surveys. Observed and predicted chlorophyll-a profiles are compared in Figure 16. The maximum algal growth rate (2.3 l/day), respiration rate (.12 I/day). and settling velocity (.75 m/day) parameters used in limulating the chlorophyll-a profiles are identical to those used in the Lower Winooski model (Van Benschoten and Walker, 1982). The model simulates the peak observed chlorophyll-a concentrations of 30 and 10 mg/mJ for the two surveys. For the low-flow survey. chlorophyll-a concentrations are over-predicted below the Assabet. This may indicate violations of the steady-state assumption in the lower portions of the river during the August 1973 survey. since the total time of travel under these conditions (approximately 21 days) was long in relation to the survey
-9-

Table S Parameter Values Derived Primarily from Calibration of Model to
Observed Water Quality Profiles and Other Site-Specific Characteristics
Parameters
Benthic Photosynthesis
Value/Conunents
1.S - 10 g/m2-day channel 4 g/m2-day overbank
Benthic Plant Respiration assumed equal to benthic photosynthesis
Benthic Oxygen Demand
Benthic Sources/Sinks BOD-U Dissolved P Ammonia N
Nitrate N
1 - 3 g/m2-day channel + wetland impact 3 g/m2-day overbank
(g/m2-day) (negative values are sinks) 4 (reach 6) , 0 other reaches .OOS impounded reaches, 0 other reaches (1,3) .025 impounded reaches, 0 other reaches (1,3) -.OS overbank -.10 overbank
Wetland Export D.O.
Concentrations 4
(g/m3)
BOD-U Organic N Organic P Organics
S 3.5 .50 120 (expressed as benthic oxygen demand)
Non-Algal Light Extinction Coef. (11m) 1.4 reaches 1-9 2.6 reaches 10-11
-----------------------------------------------------------------------note: all biological rates and benthic fluxes input at 20 degrees C

Table 6
Generalized Parameter Estimates Derived Primarily from the Literature
Parameters Value/Conunents
Reaeration Rate O'Connor & Dobbins (1958) equation constrained to K2 > 1 / mean depth (Manhattan College, 1968, Banks, 1973)
Longitudinal Dispersion Rates Fischer et ale (1979) equation
Decay Rates BOD-U Anunonia N Nitrite N Organic N Organic P Fecal Coliforms
Algal Parameters Maximum Growth Rate Respiration Rate Settling Velocity Chlorophyll Content P Content N Content Light Extinction Ammonia Preference Factor Photo. Oxygen Equiv. Resp. Oxygen Equiv.
Half-Saturation Constants Algal Phosphorus Uptake Algal Nitrogen Uptake Algal Growth vs. Light Benthic 02 Demand Other Benthic Sinks Other Oxidation Rates
.2 l/day
.6 l/day 3.0 l/day .1 l/day .1 l/day 1.6 l/day
2.3 l/day .12 l/day .75 m/day
(calibrated)
(calibrated)
.010 mg Chl-a / mg Algae
.011 mg P / mg Algae
.080 mg N / mg Algae 43.2 m2/g Chl-a .9 1.6 mg 02 / mg algae 2.0 mg 02 / mg algae
.005 g/m3
.03 g/m3 1.5 calories/cm2-hr .5 g 02 / m3 .03 g / m3 1.0 g 02 / m3
Temperature Sensitivity Coefficients (THETA) Ammonia N Oxidation 1.080 Benthic Oxygen Demand 1.072 Rate at T (T-20) Other Benthic Sinks/Sources 1.047 ---------- = THETA Reaeration Rate 1.022 Rate at 20 Other Biological Rates 1.047
Longitudinal Dispersion Rates Fischer et ale (1979) equation
Solar Radiation Estimated from latitude, month, and cloud cover (Me Gaughey, 1968)
----------------------------------------------------------------------references: Zison et al •• 1978
Manhattan College. 1968 VanBenschoten and Walker, 1982
all biological rates input at 20 degrees C

period; i.e., algal populations measured in the lower reaches may have been influenced by higher flow periods previous to the monitoring period. Alte~n~t~ve explanations would include zooplankton grazing, increased turbldltles, or effects of floating duckweed (leading to increased light limitation) in the lower river. Non-algal turbidities have been increased in the last two river reaches to limit peak biomass levels.
Preliminary simulations of the high-flow surveys indicated relatively large over-predictions of observed nitrate concentrations below Pelham Island Road. The role of wetlands as nitrate links has been well-documented (Kadlec and Kadlec, 1978) and can be attributed to combined effects of nutrient uptake by plants and denitrification supported by organic substrates. Reasonable simulation of the observed nitrate profile. (Figure 17) has been achieved by .pecifying a nitrate 101. of .1 g/m2-day in overbank areas (defined below). A corresponding overbank loss of .05 g/m2-day bas been specified for ammonia nitrogen. These nutrient transforaations during high-flow periods provide a more complete description of the .ystem but are of little consequence to water quality with re.pect to algal populations or dissolved oxygen because algal populations are limited only by light and residence t~e during high-flow periods.
Calibration of the daily mean oxygen profiles was initially achieved by adjusting the benthic oxygen demand rates in each reach and using the O'Connor-Dobbins (1958) formulation to estimate reaeration rates. Benthic demands estimated in this procedure ranged from 1 to 8 g/m2-day and were found to correlate with the wetland areas tributary to each model segment and to be higher durin. t~ 'ligh-flow (June 1979) survey. Possible mechanisms for wetland impacts on benthic demands include:
(1) export of particulate organics from the wetland areas and subsequent settling and decay on the river bottom;
(2) percolation of water through organic swamp deposits, transport of dissolved organics with seepage into the river bed, and subsequent oxidation;
(3) increased benthic periods attributed materials ;
demand in overbank to the decay of
areas during accumulated
flooded organic
(4) reduced reaeration rates in overbank areas attributed to stagnation of water by aquatic vegetation;
The first two mechanisms would be flow-dependent and are reflected in the export model described below. The third mechanism is simulated by specifying a higher effective benthic demand (3 g/m2-day) in flooded areas adjacent to the channel. The effective channel width is estimated for each reach to correspond to USFWS summer flow criterion of 185 cfs, based upon review of HEC-2 model output which indicates minimal overbank flow under these conditions. Inflection pointe in the width and crosssection vs. discharge curves are also indicated in reaches with adjacent wetlands at approximately this flow value. This definition does not necessarily correspond to that used in the HEC-2 simulations. To some extent, the effects of vegetation on reaeration rate are implied in the hydraulic simulation, because overbank Manning's n values are higher and

I I
( -_./
'.
Figure 16
Observed and Predicted Chlorophyll-a Profiles
O ~.t 197): Chlorophyll .. ("a)
• 37 . • 035 SUM MER ~ LOW - FLO W .033 .031 .029 .0%7 .025 .023 .021 .019 .011 'S16 • 14 • 012 .010 • 001 .006 • .~ -+~+H~~~~ .002 .000
• .' . CHLOROPHYLL-A i
+�----~I~--~I~----·tr-----~t-----+t----~4----~t----__+.· 60.00 53.37 46.7S 40.12 33.50 26.87 20.25 13.62 7.00
Uver Iil_ter
July 1973: ChlorophJll-. C,/al) .037 .035 S U .... E R ~ FLOOD .033 .031 .029 .027 .025 .023 .021 .019 .018 .016 .014 .012 .0Uf .008 .006 .004 .002 .000
~,------·+t-----4t----~.r __ --~'~--~·~.=-~~~.~~~.~--~t 60.00 53.37' 46.75 40.12 33.50 26.87 20.25 13.62 7.00
liver r:il_tar
JUDe 1979: Chlorophyll-. (,/al) :g~~ l ATE S P R I N G , FLOOD .033 .031 .1129 .027 .025 .023 .021 .019 .018 .016 .014 .012 .• 010 • •• . .> I. ". I' ,. ,t • • 008 .~ • ~ .006 "- ., I I. .:t.. eJil ' , ' .004 •• ?'rll •• 11 'tl .-r .002 • • 000
t -. , t _·-_1------_-+.----... '1.00 53.37 46.75 40.12 33.50 26.87 20.25 13.62 7.00
ai".r lil_ter

....... C""I ~ -be
'-'"
Z
( .
~l (.')
0 . -....-/ tl:: H H Z
~ H <: tl:: f-: H Z
Figure 17
Observed and Predicted Nitrate-Nitrogen Profiles
AUIUlt 1973: Nitrate-N (,/al) .700 .663 SUM MER, LOW - FLO W .626 .Sl9 .553 .516 .479 .442 .405 .368 .332 .295 .258 .221 .184 • • 147 .111 .074 .037 .000
+1----+1----+---+ I 4- + 4 • 60.00 53.37 46.75 40.12 33.50 26.87 20.25 13.62 7.00
liver Kiloaeter
July 1973: .itrate-B (,/al) :l~ SUM MER, FLOOD .626 .589 .553 .516 .479 .442 .405 .368 .332 .295 • 258 .221 .184 • 147 .111 • .074 .037
• •
•• .000 ... __ ...... ~.
NITRATE-N
• • • •
+----~I~----+I-----+I------'I~--~+-------+I-----+I----~I 60.00 53.37 46.75 40.12 33.50 26.87 20.25 13.62 .7.00
liver Kil_ter
JUDe 1979: Bitrate-B (,/al) 700 .... .... :663 L ATE S P R I N G, FLOOD .626 .589 .553 .516 • 479 .442 .405 • 368 .332 .295 • 258 .221
• •
.184 • • • • 147 • qq. 51 III t ~
• •
.111 • • ................... '-III • 074
/" 0'.' ......
.037
• ••• II " ........ + ___ ...
........ II "1 1
• •
.000 +4------.I--------~I------_+I-------.I-----~I~----+I------+I-----__+I
60.00 53.37 46.75 40.12 33.50 26.87 20.25 13.62 7.00 I.iver Kit_ter

lead to greater flow resistence, greater depths, and lower velocities; the last two factors would, in turn, reduce reaeration rates calculated using O'Connor-Dobbins (1958) formula.
In general, alternative combinations of wetland export oxygen demand concentration, overbank benthic demand, and overbank reaeration rate reduction may give approximately the same oxygen profile s~ulation. for the various surveys and are thus indistinguishable based upon existing data. The selected parameter combination emphasizes the export component and is conservative for the simulation of diversion impacts because the export component of the organic loading to each model reach is dependent upon basin runoff and wetland area and is independent of upstream diversions (i.e., the organic matter from the wetlands reaches the river and is oxidized, regardless of upstream diversion or river elevation), whereas the overbank loading and reaeration mechanisms would be somewhat sensitive to diversions and elevations. Additional field studies and intensive monitoring would be required·to develop an adequate data base for detailed discr~ination among potential wetland impact mechanisms. Existing data support a conservative analysis based primarily upon export relationships of the type routinely used in modeling other types of land use/water quality relationships (Omernik, 1977, Meta Systems, 1982).
The wetland export model is based primarily upon a mass balance which relates the benthic oxygen demand and sources of organic nitrogen and organic phosphorus in each model reach to the tributary wetland drainage areas using a model of the following form:
where,
Lij • a Awj Cwi
Lij - loading of component i into reach j (g/sec) a - basin unit discharge (cms/km2) Awj - wetland area tributary to reach j (km2) Cwi - concentration of component i in wetland drainage (g/m3)
The model is consistent with higher wetland loadings during periods of higher unit discharge (a) and in segments with larger areas of tributary wetlands. Since the average export concentrations (Cwi) are calibrated, they implicity include any bias attributed to differences in unit discharge (a) between wetland and upland drainage areas in the basin. Lmpacts on benthic demands are estimated by dividing the wetland loadings by the water surface area within each reach.
The estimation of wetland export concentrations has been guided, in part, based upon reasonable values for the nutrient contents of plant detritus and measured values of productivity and detritus export in other wetland systems. The total oxygen demand export of 125 mg/liter (120 -a/liter expressed as as benthic demand and 5 -a/liter as suspended BOD-V) corresponds roughly to 117 -a/liter of organic matter (assuming that the organic matter has the oxidation state of carbohydrate or CH20). The export organic nitrogen and organic phosphorus concentrations of 3.5 mg/l and .5 mg/l correspond to detritus compositions of 3% nitrogen and .4% phosphorus, respectively, which are within the ranges of measurements for aquatic plants (Mackenthun, 1968).
At the average annual unit discharge of .016 cms/km2, the oxygen demand export concentration 125 -a/liter corresponds to an average
-11-

annual export of 2 g/km2-sec, .17 g/m2-day, or .63 metric tons/hectareyear. In contrast, estimates of annual net primary productivity for freshwater macrophytes on fertile sites in temperature regions range from 30 to 45 tons/hectare-year for emergent species and from 1 to 7 metric tons/hectare-year for submersed species (Wetzel, 1975). The above oxygen demand export corresponds to only 1.3-2.1 percent of the productivity range for emergent species. The net productivity numbers reflect the potential biomass generated within adjacent wetlands; only a fraction of this biomass would be exported and exert an oxygen demand on the receiving water body; the remainder would (a) accumulate in place; (b) be decomposed in place; (c) accumulate in the receiving water as undecomposed organic sediment; or (d) be flUShed downstream without decomposition (De la Cruz, 1978). Direct measurements of actual organic matter export from freshwater wetland systems are not readily available in the literature. Detritus exports of 3.4 tons/hectare-year were reported by De la Cruz (1965) for a Georgia salt marsh and 3.6 tons/hectare-year were reported by Heald (1969) for a mangrove estuary. Indirect export estimates from other wetland systems range from 0 to 50% of the annual net, above-ground primary productivity (De la Cruz, 1978). Thus, the calibrated export oxygen demand concentration of 125 mg/liter or equivalent annual export of .63 tons/ha-year is feasible in relation to literature values of wetland organic matter production and export.
A channel benthic BOD source of 4 g/m2-day has been included in Reach 6 (Sherman Bridge to Route 117) to account for increases in BOD concentrations between these locations, particularly during the lowflow, August 1973 survey. This increase may be attributed to unidentified point sources, sloughing of organics from benthic plants, or to wetland interactions not considered in the above export model.
The model includes a provision for simulating the effects of dam reaeration on oxygen levels. This option has been used for MDC#1 (RKM 58.5) for a small dam near th~ .~ss f'ike (53.3). Comparisons of data from above Saxonville Dam (Fv.:~l 51.2) and Elm Street (RKM 50.1) during the August 1973 and June 1979 indicated no increases in average oxygen concentrations, despite the considerable elevation drop over this short section (approximately 7 meters). Effects of intervening unmonitored sources, channelization for flood control, and/or diversions around the dam spillway may account for the apparent lack of reaeration in this section. Reasonable calibration to the oxygen profiles in this section was achieved without accounting for dam reaeration, although this has little effect on oxygen simulations below Pelham Island Road (RKM 42.3).
After calibration of the mean oxygen profile, benthic photosynthesis and respiration rates have been adjusted within reasonable ranges (Zison et al., 1978, Wetzel, 1975) to fit the observed daily minimum oxygen profiles. These rates reflect productivity by rooted aquatic plants, floating aquatic plants, periphyton, and aufwuchs communities. For lack of a better assumption, photosynthesis and respiration by these communities are assumed to be in balance under normal conditions; thus, the calibrated rates influence only the diel fluctuations of oxygen and not the daily mean values. Any impacts of the aquatic plant communities on the mean oxygen concentrations are implicit in the calibration of the net benthic demands discussed above. Calibrated photosynthesis and respiration rates range from 1.5 g/m2-day to 10 g/m2-day in the various reaches; the highest value is Fairhaven Bay, where aquatic plants are relatively abundant. A rate of 4 g/m2-day has been used for overbank areas to reflect productivity in the wetlands
-12-

and shallow marginal waters during flooded periods. Observed and predicted mean and minimum oxygen concentrations for
each of the three surveys are compared in Figures 18 and 19, respectively. The model calibration is based upon data from the summer low-flow survey of August 1973 and the late-spring flood survey of June 1979. Simulations of the summer flood (July 1973) employ the .ame .et of model parameter., with the exception that all benthic photo.ynthesi. i. inhibited; this is con.istent with our "working understanding" of the respon.e of the plant community to extreme summer floods, a. described in the previous section.
Replicate data from one .urvey (June 1979) are available for calibration of the fecal coliform sub-model. Thi. has involved adjustment of the effective decay rate and source concentrations in the Framingham area to match observed and predicted profiles, as shown in Figure 20. The calibrated decay rate (1.6/day) is within the range of literature values cited by Zison et al. (1978). The calibrated local drainage concentrations in the Framingham area (1000 5000 organisms/100 ml) probably reflect urban non-point sources. As indicated in Figure 20. observed fecal coliform levels are highly variable in the Billerica area (below river kilometer 13) and may al.o reflect urban impacts.
The calibrated model reproduces observed profiles with with reasonable accuracy and thus represents a u.eful tool for a.se.sing impacts of diversions on downstream water quality. One limitation i. that data from only one-low flow survey (Augu.t 1973) are available for model calibration and te.ting. It i. pos.ible that the wetland flooding event experienced in July of that year and/or effect. of poorly quantified sewage loading. from a leaking pumping .tation in Framingham could have had residual effects on oxygen profiles measured during August. Summer oxygen profiles during low-flow periods which are not preceded by wetland flooding events may show higher concentrations and fewer violations of the 5 ag/liter criterion. Because of these considerations, the calibrated model may provide a conservative assessment of baseline conditions and diversion impact. with respect to dissolved oxygen. Additional surveys would be required to teat this possibility. Another limitation is the lack of low-flow data for testing the fecal coliform model. Impact assessments indicate, however, that diversion strategies are more likely to be limited by dissolved oxygen Unpact. than by fecal coliform or chlorophyll-a Unpact.. Results of the simulations are summarized in Tables 7,8, and 9 and discus.ed in the main body of this report.
-13-

,/ I· \
( ~
Figure 18
Observed and Predicted Daily-Mean Dissolved.Oxygen Profiles
,-... ('f')
e -00 -Z f>.:I Co? >< I< 0
Q f>.:I :> ...:l 0 en en H Q
AUluat 1973: Mean Di'lolved Oxvlen (,/al) 11000 . I
, 10 :421 S U f1 f1 E R , LOW - FLO W 9.142 9.263 8.614 '.IOS • 7.526 ---6.9.7 • 6.368 5.789 5.211 4.632 4.053 3 •• 7. .. 2.89S 2.316 1.737 1.lS8
• •
:~ · •• ----~I-----+ +1-----+1-----1.------;1~----~1----_+.
60.00 53.37 46.75 40.12 33.SO 26.87 20.25 13.62 7.00 liver lilOlMter
~ly 1973: Hean Di •• olved OxYleR (,/al) 11.000 10.421 S U " ME R I FLOOD 9.842 9.263 '.614 8.105 7.526 6.9.7 6.368 5.789 5.211 4.632 4.053 3.47. 2.895 2.316 1.737 1.158 ..
.579 ..
MEAN D.O,
• • • ooo. _____ ~----~----~----~ __ --~----_+----~----~ llo I I I I I , I I
60.00 53.37 46.75 40.12 33.SO 26.87 20.25 13.62 7.00 liver lilOlMter
June 1979: 11.000 10.421 LA T E 9.142 9.263 8.684 8.10S • 7.526 • 6.947 6.368 5.789 5.211 4.632 4.053 3.474 2.895 2.316 1.737 1.158
.579
Hean Di.lolv.d Oxy,eR (,/al) SPRING,FLOOD
•
• •
• •• •
.OOO .. I----~I------1I----__1I __ --__1I~~ __ ~I~~~.~~~I~--~I 60.00 53.37 46.75 40.12 "{SO· 26.87 20.25 13.62 7.00
River It l_ter
..
- ---..,.

,
(
Figure 19
Observed and Predicted Daily-Min~um Dissolved. Oxygen Profiles
AUlult 1973: Mia Dillolve. Ox'I" (".3) 10.000 S 9.474 U M MER I LOW - FLO W 8.947 8.421 7.895 7.368 • 6.842 ........ --t 6.316 5.789 • 5.263 4.737 4.211 3.684 3.158 2.632 2.105 1.579 1.053
.526
.000
•
I I +-----+-----+-------+ M
E 60.00 53.37 46.75 40.12 33.50 26.87
liver ~ilometer -bD July 1973: MiD Dillo1ved Oxygea '-' 10.000 Z ::U~ SUM MER I FLOOD ~ 8.421 C!l 7.895 >' 7.368 ::< 6.842 o 6.316
5.789 Q 5.263 ~ 4.737
> ~:n! • c3 ~:t~ CIl 2.105 CIl 1.579 1-4 1.053 • Q .526 _
(I,al)
• •
20.25
•
•
•
•
I 4 13.62 7.00
D .0.
• • .000 _
+I------+I------+t-----~I~--~+t~--~I~--~I~--~I~--~. 60.00 53.37 46.75 40.12 33.SO 26.87 20.25 13.62 7.00
liver ~ilOINter
June 1979: HiD Dillolved OKrlea (1'.3) 10 000 - . -. ':474 LA T E S PR J N 6 I FLOOD 8.947 8.421 • 7.895 r-1 ..... _ ...... 7.368 • 6.842 6.316 5.789 • 5.263 • • • 4.737 i;IIoI ....... , 4.211 • ~_ .... _ ...... 3.684 • 3.158 • 2.632 • 2.105 1.579 1.053
.526
• ••• •
.000~1----_~.----~.--__ ~1 __ ~~1~~~1~~~1~~~1~--~I 60.00 53.37 46.75 40.12 33,SO 26.87 20.25 13.62 7.00
liver r:ll_ter
----......,-----~,'-~.,.....,.. .. ,...-.-~-...... ---........ ...-~ ... ~-" .. '-.-.. ---.~.-~- , ....... -,..

,- Figure 20
Observed and Predicted Fecal Coliform Profile
June 1979
-.-4 a
0 840.0 0 0 795.7 .-4 - 751.5 0 til - 707.3 ,.. c.o 663.1 H 0 z 618.9 0 0 < (!j 574.7 p:: 530.5 0 '-' 486.3 til 442.1 '-'
397.8 ..... ~ 0 353.6 ~ H 309.4
.,..;l 265.2 0 u 221.0 ,..;l 176.8 « 132.6 u
( f>.l 88.4 ~ .~ 44.2
.0 +-------+-------+-------+-------+-------+-------+-------+-------+
60.00 53.37 46.75 40.12 33.50 26.87 20.25 13.62 7.00
R.iver Kilometer
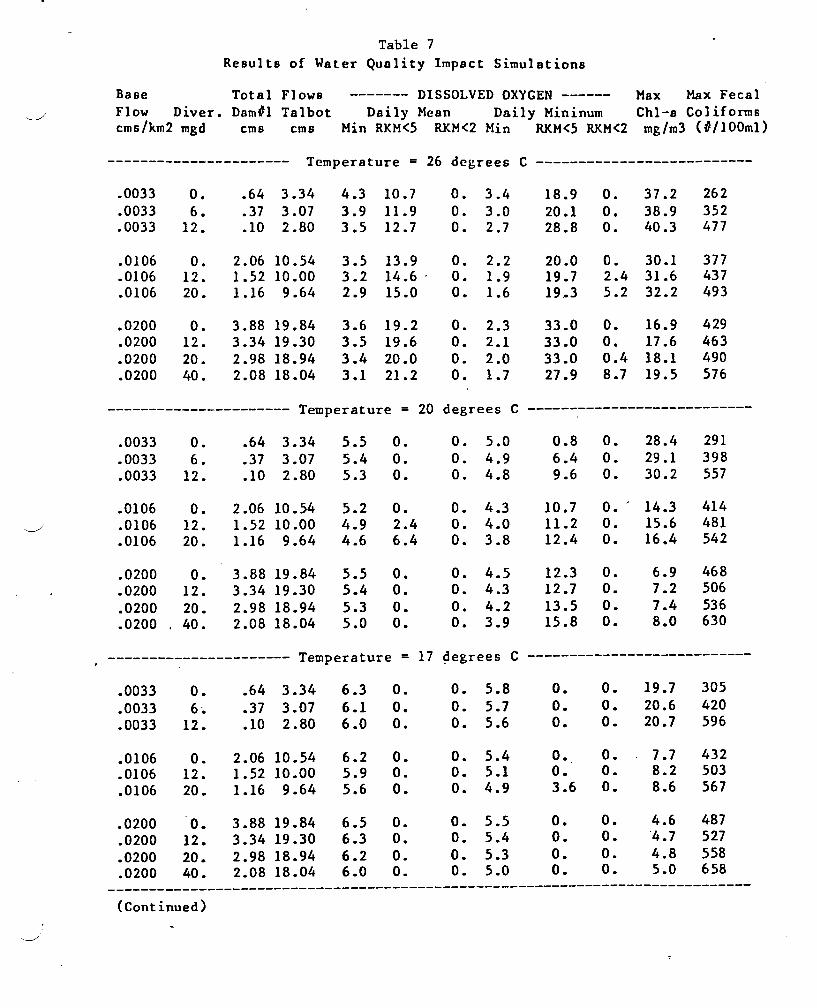
Table 7 Results of Water Quality Impact Simulations
Base Total Flows ------- DISSOLVED OXYGEN ------ Max Max Fecal Flow Diver. DamDl Talbot Daily Mean Daily Mininum Chl-a Col iforms cms/km2 mgd cms ems Min RKM<5 RKM<2 Min RKM<5 RKM<2 mg/m3 ( D/lOOml)
---------------------- Temperature = 26 degrees C --------------------------
.0033 O. .64 3.34 4.3 10.7 O. 3.4 18.9 O. 37.2 262
.0033 6. .37 3.07 3.9 11.9 O. 3.0 20.1 O. 38.9 352
.0033 12. .10 2.80 3.5 12.7 O. 2.7 28.8 O. 40.3 477
.0106 O. 2.06 10.54 3.5 13 .9 O. 2.2 20.0 O. 30.1 377
.0106 12. 1.52 10.00 3.2 14.6 . O. 1.9 19.7 2.4 31.6 437
.0106 20. 1.16 9.64 2.9 15.0 O. 1.6 19.3 5.2 32.2 493
.0200 O. 3.88 19.84 3.6 19.2 O. 2.3 33.0 O. 16.9 429
.0200 12. 3.34 19.30 3.5 19.6 O. 2.1 33.0 O. 17 .6 463
.0200 20. 2.98 18.94 3.4 20.0 O. 2.0 33.0 0.4 18.1 490
.0200 40. 2.08 18.04 3.1 21.2 O. 1.7 27.9 8.7 19.5 576
---------------------- Temperature = 20 degrees C ---------------------------
.0033 O. .64 3.34 5.5 o. O. 5.0 0.8 O. 28.4 291
.0033 6. .37 3.07 5.4 O. O. 4.9 6.4 O. 29.1 398
.0033 12. .10 2.80 5.3 O. O. 4.8 9.6 O. 30.2 557
.0106 O. 2.06 10.54 5.2 O. O. 4.3 10.7 O. 14.3 414 -..J .0106 12. 1.52 10.00 4.9 2.4 O. 4.0 11.2 O. 15.6 481
.0106 20. 1.16 9.64 4.6 6.4 O. 3.8 12.4 O. 16.4 542
.0200 O. 3.88 19.84 5.5 o. O. 4.5 12.3 O. 6.9 468
.0200 12. 3.34 19.30 5.4 O. O. 4.3 12.7 O. 7.2 506 • 0200 20. 2.98 18.94 5.3 O. O • 4.2 13.5 O. 7.4 536 • 0200 40. 2.08 18.04 5.0 o. o . 3.9 15.8 O. 8.0 630
--------~------------- Temperature = 17 ~egrees C ---------------------------
.0033 O. .64 3.34 6.3 O. O. 5.8 O. O. 19.7 305
.0033 6;. .37 3.07 6.1 O. O. 5.7 O. O. 20.6 420
.0033 12. .10 2.80 6.0 O. O. 5.6 O. 0.- 20.7 596
.0106 O. 2.06 10.54 6.2 O. O. 5.4 O. O. 7.7 432
.0106 12. 1.52 10.00 5.9 O. o. 5.1 o. O. 8.2 503
.0106 20. 1.16 9.64 5.6 O. O. 4.9 3.6 O. 8.6 567
.0200 O. 3.88 19.84 6.5 O. o. 5.5 o. O. 4.6 487
.0200 12. 3.34 19.30 6.3 O. O. 5.4 O. O. 4.7 527
.0200 20. 2.98 18.94 6.2 O. O. 5.3 O. O. 4.8 558
.0200 40. 2.08 18.04 6.0 O. o. 5.0 o. o. 5.0 658 -----------------------------------------------------------------------------
(Continued)
-____ J

Table 7 Results ot Water ~uality It:lpnct Simulations (Continued)
Base Total Flows ------- DISSOLVED OXYGEN ------ Max Max Fecal Flow Diver. Damtl1 Talbot Daily Mcan Daily Min.a.hum ChI-a Col iforms cms/km2 mgd cms emS Min RKM<5 RKM<2 Min RKM<5 RKM<2 mg/m3 (ti/100ml)
---------------------- Tcmperature .. 14 degrees C --------------------------
.0106 O. 2.06 10.54 7.1 O. O. 6.5 O. O • 4.4 451 • 0106 20. 1.16 9.64 6.6 O. O. 6.0 O. O • 4.7 592 • 0106 40. 0.26 8.74 5.8 O. O. 5.2 O. O. 5.3 852
.0200 O. 3.88 19.84 7.4 O. O. 6.6 O. O. 3.5 505 • 0200 20. 2.98 1B.94 7.2 O • O. 6.4 O. O. 3.6 5BO .0200 40. 2.0B 1B.04 7.0 O. O. 6.2 O. o. 3.7 685
----------- Temperature = 26 degrees C, No Plant Photosynthesis * -----------.0200 O. 3.88 19.84 0.4 47 .. 9 13.6 0.2 47.9 14.8 .0200 12. 3.34 19.30 0.3 47.9 14.B 0.1 47.9 .16.4 .0200 20. 2.9B 18.94 0.3 47.9 16.0 0.1 47.9 1B.0 .0200 40. 2.0B 18.04 0.3 47.9 19.2 0.0 4B.7 20.0
Notes:
All simulations assume plant photosynthesis/respiration = June 79/August 73 = "normal" conditions, except *, which assumes July 1973 conditions (summer flood) .
Base Flows: .0033 cms/km2 = median august flow (REC simulation) .0106 cms/km2 = median fall flow (REe simulation) .0200 cms/km2 = late spring/early summer flow
(approx. equal to June 79 calibration)
IB.1 1B.9 19.6 21.0
RKM<5 = total r1ver length violating oxygen criterion of 5 g/m3 RKM<2 = total r1ver length violating oxygen criterion of 2 g/m3
Minimum dissolved oxygen concentrations generally located: near Rte 20 for .0033 cms/km2 simulations near Sherman Bridge for .0106 cms/km2 simulations upstream of Rte 117 for .020 cms/km2 simulations
Maximum chlorophyll-a generally located below Assabet River {see Table 3 for additional details}
Maximum Fecal Coliform levels located at Stone Bridge Road {see Table 4 for additional details}
.-
429 463 497 576

Table 8
Sununary of Simulated Chlorophyll-a Concentrations
River Kilometer: 48.3 36.0 30.5 9.5 Location: Stone Shennan Below Billerica Chl-a Maximum Base Flow Diver. Bridge Bridge Fairhaven Water Intake Conc. Location* (cms/km2) (mgd) --------------------------------------------------------------------------
.0033 0 12.2 13 .7 20.7 23.1 37.2 18.8
.0033 6 12.0 13 .2 20.4 21.5 38.9 18.9
.0033 12 7.4 16.0 19.6 20.0 40.3 20.1
.0106 0 8.2 8.5 19.0 28.4 30.7 14.9
.0106 12 8.3 9.2 20.6 28.9 31.6 15.3
.0106 20 8.5 9.5 21.7 29.5 32.2 15.3
.0200 0 7.3 3.7 5.1 16.7 16.9 7.1
.0200 12 7.2 3.8 5.3 17 .3 17.6 7.1
.0200 20 7.1 3.8 5.5 18.0 18.1 7.1
.0200 40 6.8 3.9 6.0 19.4 19.5 7.1 --------------------------------------------------------------------------based upon 26 deg C simulations concentrations in mg/m3 * river kilometer of maximum chlorophyll concentration
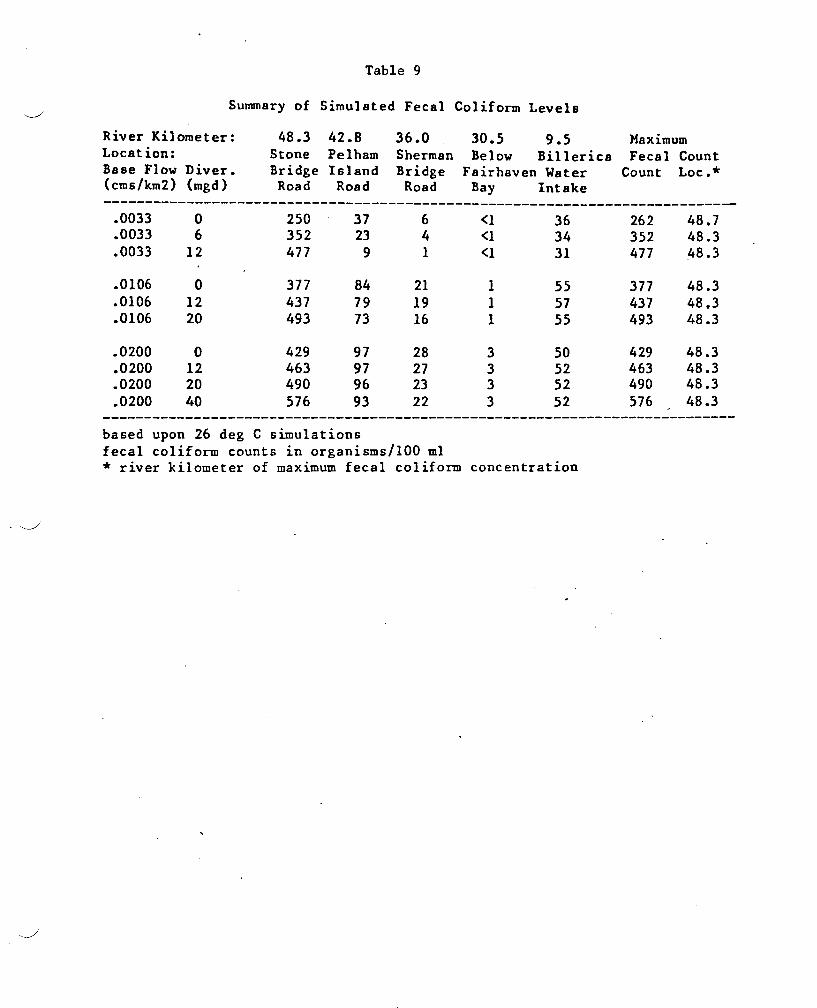
Table 9
~ Summary of Simulated Fecal Coliform Levels
River Kilometer: 48.3 42.8 36.0 30.5 9.5 Maximum Location: Stone Pelham Sherman Below Billerica Fecal Count Base Flow Diver. Bridge Island Bridge Fairhaven Water Count Loc.* (cms/km2) (mgd) Road Road Road Bay Intake ----------------------------------------------------------------------------
.0033 0 250 37 6 <1 36 262 48.7
.0033 6 352 23 4 <1 34 352 48.3
.0033 12 477 9 1 <1 31 477 48.3
.0106 0 377 84 21 1 55 377 48.3
.0106 12 437 79 19 1 57 437 48.3
.0106 20 493 73 16 1 55 493 48.3
.0200 0 429 97 28 3 50 429 48.3
.0200 12 463 97 27 3 52 463 48.3
.0200 20 490 96 23 3 52 490 48.3
.0200 40 576 93 22 3 52 576 48.3 ----------------------------------------------------------------------------based upon 26 deg C simulations fecal coliform counts in organisms/IOO ml * river kilometer of maximum fecal coliform concentration
.~

References
Banks, R.B., "Some Features of Wind Action on Shallow Lakes", Journal of the Environmental Engineering Division, ASCE, No. EE5, pp. 813-827, October 1975.
Concord Department of Natural Resources, "Concord River and Stream Water Quality Monitoring Project", Annual Reports, 1973-78.
De La Cruz, A.A., "A Study of Particulate Salt Marsh-Estuarine Ecosystem", Ph.D.
. Georgia, Athens, Georgia, 1965.
Organic Detritus in a Georgia Dissertation, University of
De La Cruz, A.A., "Production and Transport of Detritus in Wetlands", in Wetland Functions and Values: The State of Our Understanding, Americal Water Resources Association, pp. 162-174, November 1978.
Fischer, H.B., E.J. List, R.C.Y. Koh, J. Imberger, Mixing ~ Inland and Coastal Waters, Academic Press, New York, 1979.
Heald, E.J., "The Production of Organic Detritus in a South Florida Estuary", Ph.D. Dissertation, University of Miami, Florida, 1969.
Heald, E.J., "The Production of Organic Detritus in a South Florida Estuary", Ph.D. Dissertation, University of Miami, Florida, 1969.
Kadlec, R.H. and J.A. Kadlec, "Wetlands and Water Quality", Wetland Functions and Values: The State of Our Understanding, Americal Water Resources Association, pp. 436-456, November 1978.
Linsley, R.K., M.A. Kohler, J.L.H. Paulhus, Hydrology for Engineers, McGraw-Hill, New York, Second Edition, 1975.
Mackenthun, K.M., The Practice of Water Pollution Biology, U.S. Department of Interior, FWPCA, 1969.
Manhattan College, "Basic Models of Natural Water Systems", prepared for U.S. Environmental Protection Agency, Contract No. 68-01-5918, 1968.
Environmental Quality Engineering, "The 1973 Part A" Division of Water Pollution
Massachusetts Department of Concord and Sudbury Rivers Control, Westborough, May 1974.
Massachusetts Department of Environmental Quality Engineering, "Water Quality Monitoring Program of the Metropolitan Area Planning Council's 208 Management Area 1977 Data Report" Water Qua lity and Research Section, Division of Water Pollution Control, Westborough, May 1980.
Massachusetts Department of Environmental Quality Concord and Sudbury Rivers - 1979 Water Quality Data" Pollution Control, Westborough, May 1980.
Engineering, "The Division of Water

Massachusetts Department of Environmental Quality Engineering, "The Concord and Sudbury Rivers - 1979 Water Quality Data" Division of Water Pollution Control, Westborough, May 1980.
McGauhey, P.R., Engineering Management of Water Quality, McGraw-Hill, New York, 1968.
Meta Systems, Inc., "Documentation for the Meta Systems Version of the Qual-II Water Quality Simulation Model", prepared for U.S. Environmental Protection Agency, Water Planning Division, 1979.
Meta Systems, Inc., "Land Use/Water Quality Relationships in the West River System, Connecticut", final report, prepared for New Haven Water Company, Connecticut, 1982.
O'Connor, D.J. and W.E. Dobbins, "Mechanism of Reaeration 1n Natural Streams", Trans. ASCE, Vol. 123, 1958.
Omernik, J.M., "Nonpoint Source - Stream Nutrient Level Relationships: A Nationwide Study", EPA Ecological Research Series, Corvallis Environmental Research Laboratory, U.S. Environmental Protection Agency, Corvallis, Oregon, EPA-600/3-77-105, 1977.
Roesner, L.A., et al., "Computer Program Documentation for Stream Quality Model (QUAL-II)", U.S. Environmental Protection Agency, Center for Water Quality Modeling, Athens Environmental Research Laboratory, Georgia, EPA-600/9-81-014, 1981.
SAS Institute, "SAS Users Guide", Raleigh, NC, 1979.
Van Benschoten, J. and W. W. Walker, "Calibration and Application of QUAL-II to the Lower Winooski River", draft manuscript submitted to Water Resources Bulletin, American Water Resources Association, 1982.
Vermont Agency of Environmental Conservation, '~ower Winooski River Wasteload Allocation Study - Part B: Ma~hematical Modeling Report", Department of Water Resources and Environmental Engineering, Montpelier, January 1982.
Water Resources Engineers, Inc.~ "Progress Report on Contract No. 68-01-0713, Upper Mississippi River Basin Model Project", prepared for U.S. Environmental Protection Agency, September 1972.
Wetzel, R.G., Limnology, W.B. Sunders Company Philadelphia, 1975.
Zison, S.W., W.B. Mills, D. Deimer, C.W. Kinetics in Surface Water Quality Protection Agency, Athens Environmental EPA-600/3-78-105, December 1978.
Chen, "Rates, Constants, and Modeling", U.S. Environmental Research Laboratory, Georgia,