appendix c hydro-meteorology in the kone river...
TRANSCRIPT

Appendix C
Hydro-Meteorology in the Kone River Basin

i
Appendix C Hydro-Meteorology in the Kone River Basin
Table of Contents
Page
1. HYDRO-METEOROLOGICAL CONDITIONS .......................................... C-1 1.1 Location and Basin Definition ............................................................................ C-1 1.2 Hydro-meteorological Data................................................................................. C-2 1.3 Climate ................................................................................................................ C-3 1.3.1 Temperature......................................................................................................... C-3 1.3.2 Humidity.............................................................................................................. C-4 1.3.3 Evaporation ......................................................................................................... C-4 1.3.4 Precipitation ........................................................................................................ C-5 1.3.5 Typhoons and Tropical Depressions.................................................................... C-6
1.4 Hydrology............................................................................................................ C-7 1.4.1 Natural Runoff..................................................................................................... C-7 1.4.2 Flood Runoff ....................................................................................................... C-8 1.4.3 Sediments ............................................................................................................ C-9
2. RUNOFF ANALYSIS........................................................................................ C-11 2.1 Natural Runoff..................................................................................................... C-11 2.1.1 Objectives of the Runoff Analysis ...................................................................... C-11 2.1.2 Methodology ....................................................................................................... C-12 2.1.3 Result of the Runoff Analysis ............................................................................. C-20
2.2 High Flow Analysis ............................................................................................. C-20 2.2.1 Objectives of the High Flow Analysis................................................................. C-20 2.2.2 Methodology of High Flow Analysis .................................................................. C-21 2.2.3 Historical Floods ................................................................................................. C-25 2.2.4 Area Rainfall ....................................................................................................... C-36 2.2.5 Hydrographs for Flood Control Studies .............................................................. C-39 2.2.6 Flood Hydrographs for Design Purposes ............................................................ C-42
3. SEDIMENT ANALYSIS ................................................................................... C-49
ii
List of Tables Page Table C.1 10-Days Runoff Series at Respective Sub-catchment Area (1) Dinh Binh............................................................................................. CT-1 (2) Cay Muong .......................................................................................... CT-2 (3) Binh Thanh .......................................................................................... CT-3 (4) Nui Mot................................................................................................ CT-4 (5) La Vi.......................................................................................................... CT-5 (6) Ha Thanh................................................................................................... CT-6 (7) Estuary ...................................................................................................... CT-7
List of Figures Page
Figure C.1 Kone River Basin ................................................................................................ CF-1 Figure C.2 Kone River Basin and Hydrological Stations...................................................... CF-2 Figure C.3 Monthly Runoff(1978-2001 Generated) at Dinh Binh, Cay Muong, Binh
Thanh and Estuary............................................................................................... CF-3 Figure C.4 Monthly Runoff(1978-2001 Generated) at Ha Thanh, La Vi and Nui Mot ........ CF-4 Figure C.5 Probable 10 % Hydrograph: Main Flood at Dinh Binh, Cay Muong and Bing
Thanh................................................................................................................... CF-5 Figure C.6 Probable 1 % Hydrograph: Main Flood at Dinh Binh, Cay Muong and Bing
Thanh................................................................................................................... CF-6 Figure C.7 Probable 1 % Hydrograph: Early Flood at Dinh Binh, Cay Muong and Bing
Thanh................................................................................................................... CF-7 Figure C.8 Probable 10 % Hydrograph: Late Flood at Dinh Binh, Cay Muong and Bing
Thanh................................................................................................................... CF-8 Figure C.9 Probable 10 % Hydrograph: Main Flood at Nui Mot, La Vi and Ha Thanh ....... CF-9 Figure C.10 Probable 1 % Hydrograph: Main Flood at Nui Mot, La Vi and Ha Thanh ......... CF-9 Figure C.11 Probable 1 % Hydrograph: Early Flood at Nui Mot, La Vi and Ha Thanh......... CF-10 Figure C.12 Probable 10 % Hydrograph: Late Flood at Nui Mot, La Vi and Ha Thanh ........ CF-10 Figure C.13 Validation Synthetic Hydrograph ........................................................................ CF-11 Figure C.14 Hydrograph of Probable Maximum Flood at Dinh Binh .................................... CF-12

iii
Annex Rainfall Runoff Modeling
Table of Contents
Page 1 MODELLING AND MODEL CALIBRATION ............................................... CA-1 2. PROBABLE FLOOD SIMULATION .............................................................. CA-3

Study on Nationwide Water Resources Development and Management in the Socialist Republic of Vietnam
FINAL REPORT C-1 Supporting Report Phase 2-2
Appendix C Hydro-Meteorology in the Kone River Basin
1. HYDRO-METEOROLOGICAL CONDITIONS
1.1 Location and Basin Definition
The Kone river basin is situated in the south central Vietnam between 13o30’ to 14o42’ north latitude and 108o36’ to 109o15’ east longitude. The basin is almost entirely situated within the Binh Dinh province. The Kone basin is defined as the basin that discharges into the East Sea through the Quy Nhon Estuary. This basin is composed of the following sub-basins, see also Figure C.1.
- The upper and middle Kone basin, discharging at the Delta apex at Binh Thanh;
- The upper and middle Nui Mot basin located upstream of National Road No. 19;
- The upper and middle Ha Thanh basin located upstream of the National Road No.1;
- The upper and middle La Vi basin located upstream of Phu Cat and north of the Provincial Road 635;
- The lower basin or (flood prone) Delta area, located downstream of Binh Thanh and bordered by Road 635 in the north and Road 19 in the south.
The total basin area amounts to 3,640 km2 and the sub-basin areas are as follows:
Kone sub-basin upstream Binh Thanh:
Nui Mot sub-basin:
Ha Thanh sub-basin:
La Vi sub-basin:
Delta area:
2,250 km2
180 km2
590 km2
240 km2
380 km2
TOTAL BASIN AREA 3,640 km2
In addition to the division into sub-basins as indicated above, a further sub-division of the upper and middle Kone basin has been made in view of existing (Vinh Son Dam) and anticipated water management structures at Dinh Binh (dam site) and Cay Muong / Van Phong (diversion structure). This subdivision is as follows:
Study on Nationwide Water Resources Development and Management in the Socialist Republic of Vietnam
FINAL REPORT C-2 Supporting Report Phase 2-2
Kone sub-basin upstream Vinh Son:
Kone sub-basin upstream Dinh Binh:
Kone sub-basin upstream Cay Muong/Van Phong:
214 km2
1,040 km2
1,677 km2
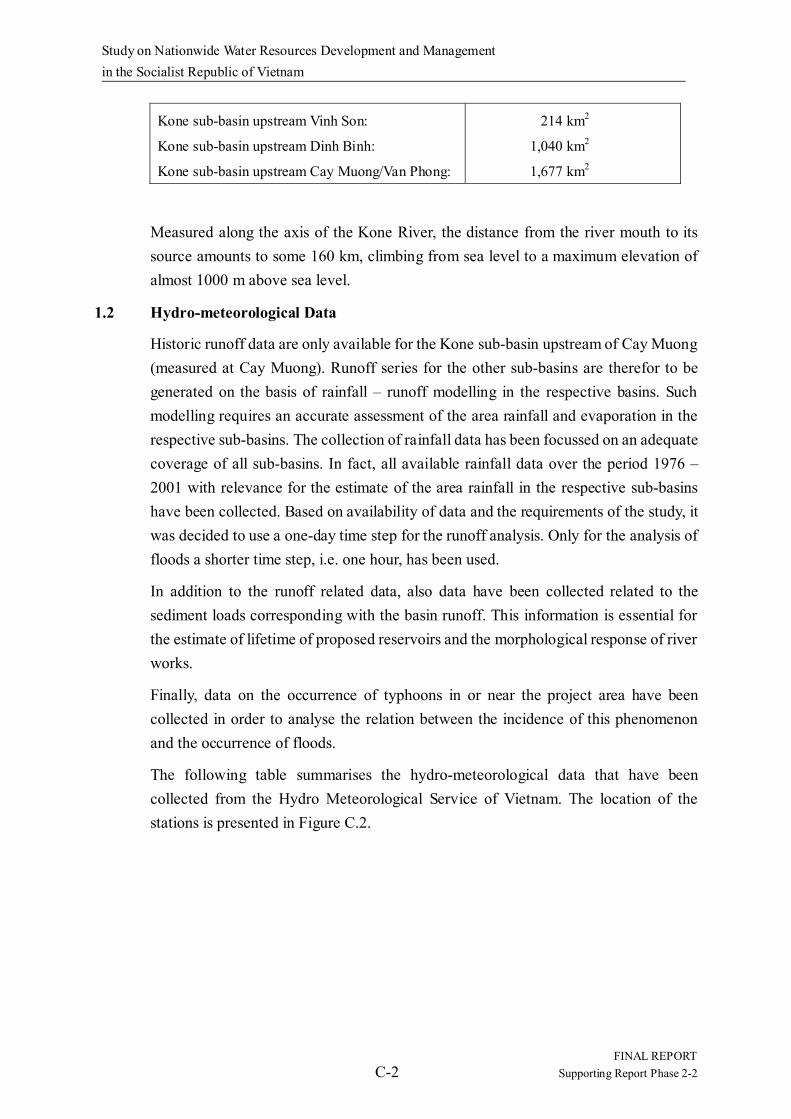
Measured along the axis of the Kone River, the distance from the river mouth to its source amounts to some 160 km, climbing from sea level to a maximum elevation of almost 1000 m above sea level.
1.2 Hydro-meteorological Data
Historic runoff data are only available for the Kone sub-basin upstream of Cay Muong (measured at Cay Muong). Runoff series for the other sub-basins are therefor to be generated on the basis of rainfall – runoff modelling in the respective basins. Such modelling requires an accurate assessment of the area rainfall and evaporation in the respective sub-basins. The collection of rainfall data has been focussed on an adequate coverage of all sub-basins. In fact, all available rainfall data over the period 1976 – 2001 with relevance for the estimate of the area rainfall in the respective sub-basins have been collected. Based on availability of data and the requirements of the study, it was decided to use a one-day time step for the runoff analysis. Only for the analysis of floods a shorter time step, i.e. one hour, has been used.
In addition to the runoff related data, also data have been collected related to the sediment loads corresponding with the basin runoff. This information is essential for the estimate of lifetime of proposed reservoirs and the morphological response of river works.
Finally, data on the occurrence of typhoons in or near the project area have been collected in order to analyse the relation between the incidence of this phenomenon and the occurrence of floods.
The following table summarises the hydro-meteorological data that have been collected from the Hydro Meteorological Service of Vietnam. The location of the stations is presented in Figure C.2.

Study on Nationwide Water Resources Development and Management in the Socialist Republic of Vietnam
FINAL REPORT C-3 Supporting Report Phase 2-2
Daily rainfall data Station Series
from To Ba To Gia Vuc Vinh Kim Binh Quang Binh Tuong (Cay Muong) Phu Cat Tan An Quy Nhon An Khe Hoai Nhon Van Canh
Jun 1976 Aug 1977 Aug 1982 Jan 1979 Jun 1976 Jun 1976 Jan 1977 Jan 1976 Jan 1977 Mar 1978 Jun 1976
Dec 2001 Dec 2001 Dec 2001 Dec 2000 Dec 2001 Dec 2001 Dec 1988 Dec 2001 Dec 2001 Dec 2001 Dec 2001
Daily Evaporation Data Station Series
from To Quy Nhon Jan 1976 Dec 2000
Daily Discharge Data
Station Series from To Cay Muong Jan 1976 Dec 2001
The complete list of daily data that have been collected and used in the present study is presented in Annex 1 to this report.
In addition to these daily data, hourly rainfall (Ba To, Hoai Nhon and Quy Nhon) and hourly discharge data (Cay Muong) have been made available of ten mayor flood events, i.e. the years 1978,1980, 1981, 1984, 1987, 1992, 1994, 1996, 1998 and 1999.
1.3 Climate
1.3.1 Temperature
The climate in the Kone Basin is characterized by an equable temperature over the year, ranging, in the lower part of the basin, from 23 oC on the average in January to almost 30 on the average in the period June – August. The day-night fluctuation of the temperature is greatest (7-9 oC) during the June-August period and smallest (4-6 oC) during the cooler period December – February.

Study on Nationwide Water Resources Development and Management in the Socialist Republic of Vietnam
FINAL REPORT C-4 Supporting Report Phase 2-2
In the upper part of the basin the temperature is, on the average, 1.5 oC lower than in the lower part.
1.3.2 Humidity
The humidity is lowest in the months with highest temperature (about 70% in July and August) and increases to a level of over 80% in the cooler months.
1.3.3 Evaporation
The annual evaporation in the lower basin, measured at Quy Nhon with “Piche”,over the period 1976 - 2000 amounts to 1041 mm on the average. A substantial variation in yearly evaporation has, however, been observed, from 776 mm in 1988 to 1,319 mm in 1997. The monthly variation is on the average as shown in the figure below, with highest values in the dry and hot July-August period. During the “winter” months the monthly evaporation can be as low as half the monthly values during the “summer”months.
On the basis of the 24 year of rainfall-runoff simulation, that has been carried out in this study, it is found that the actual basin wide evapotranspiration amounts to some 565 mm per year on the average.
Average Monthly Relative Humidity at Quy Nhon
60.0
65.0
70.0
75.0
80.0
85.0
Jan Feb Mar Apr May Jun Jul Aug Sep Oct Nov Dec
rela
tive
hum
idit
y (%
)

Study on Nationwide Water Resources Development and Management in the Socialist Republic of Vietnam
FINAL REPORT C-5 Supporting Report Phase 2-2
Average Monthly Basin Rainfall
0
100
200
300
400
500
600
Jan Feb Mar Apr May Jun Jul Aug Sep Oct Nov Dec
area
rai
nfal
l mm
per
mon
th
1.3.4 Precipitation
The yearly basin rainfall, averaged over the last 25 years (1977 – 2001) amounts to 2,120 mm. From this amount some 63%, or 1,333 mm falls on the average in the period September – November. The average monthly basin rainfall is as follows:
The spatial distribution of the rainfall in the Kone basin indicates that the rainfall increases from the lower delta area to the upper area upstream of Binh Dinh. The yearly average precipitation in the Delta area amounts to 1,857 mm, while in the upper
Average Monthly Evaporation at Quy Nhon
0.0
20.0
40.0
60.0
80.0
100.0
120.0
140.0
160.0
Jan Feb Mar Apr May Jun Jul Aug Sep O ct Nov Dec
pich
e ev
apor
atio
n (m
m)

Study on Nationwide Water Resources Development and Management in the Socialist Republic of Vietnam
FINAL REPORT C-6 Supporting Report Phase 2-2
catchment the rainfall is as high as 2,590 mm per year on the average.
In Chapter 2, a detailed analysis of the rainfall intensities and spatial distribution in the Kone basin is presented.
1.3.5 Typhoons and Tropical Depressions
An inventory has been made of typhoons and tropical storms that made landfall during the period 1976 – 2000 at or near the Kone basin (between Na Trang and Da Nang or between 12oN and 16oN). A summary of this inventory is presented in the table overleaf. The inventory was made for the mentioned period in order to evaluate the coincidence of these storms with the occurrence of floods in the Kone basin.
A total number of 34 relevant storms were identified, of which 28 toke place during October-November, two during the Minor flood season (May – June) and four during the Early flood season in September.
Although there is a clear (and obvious) indication that there is a relation between the occurrence of the tropical storms and the occurrence of floods, it is also clear that not all storms that were identified caused exceptional peak discharges. About 50% of the identified storms created peak discharges with a yearly probability of exceedance of 90% or less. The other 50% of these storms did not have an exceptional effect on the Cay Muong discharges. On the other hand, yearly peak discharges in Cay Muong coincided in only 8 years out of the 25 with the occurrence of a typhoon or tropical storm. That is to say that the observed yearly maximum discharges are not related to typhoons or tropical storms (at least not the identified ones) in some 70% of the cases.

Study on Nationwide Water Resources Development and Management in the Socialist Republic of Vietnam
FINAL REPORT C-7 Supporting Report Phase 2-2
1.4 Hydrology
1.4.1 Natural Runoff
Long series of discharge observations are available at Cay Muong only. This hydrological station covers 1677 km2, or 46%, of the total basin area that discharges at the Quy Nhon estuary. Moreover, the observed runoff at Cay Muong refers to the runoff of surface water only. It is estimated that the surface runoff corresponds with about 70% of the total basin runoff, including the subsurface flow. This estimate is based on the results of the rainfall-runoff simulation in the basin.
From the 1976 – 2001 daily discharge data at Cay Muong, it is derived that the average runoff at that location amounts to 68.2 m3/s. This corresponds to 1283 mm on a yearly basis or 54% of the average yearly rainfall, calculated at 2368 mm for the area upstream of Cay Muong.
Storm date PA1day prob. PA2days prob. PA3days prob. QdayCM prob. Qpeak prob. Qmaxyearno 26 30-Oct-78 43 75 77 256no 27 03-Nov-78 128 160 173 812 1475 0.8 1475no 19 15-Oct-79 187 0.4 242 295 1050 1780 0.8 2380no 22 02-Nov-80 172 0.5 330 0.2 362 0.3 1390 4280no 23 14-Oct-81 137 226 235 1020 4140no 12 09-Oct-83 94 136 146 353 2770no 20 12-Oct-84 212 0.2 311 0.2 317 0.4 995 1380 0.8 3480no 23 01-Nov-84 85 144 221 771 3480no 24 07-Nov-84 91 179 181 2040 0.3 3480 0.2 3480no 25 25-Nov-85 181 0.4 219 224 1020 2450 0.5 2450no 22 22-Oct-86 132 161 166 612 1410 0.8 2850no 23 11-Nov-86 38 68 82 77 2850no 21 18-Nov-87 228 0.05 289 0.3 348 0.3 4010 0.02 6340 0.016 6340no 25 09-Oct-88 148 243 256 800 2050no 30 06-Nov-88 81 108 205 1020 1680 0.8 2050no 22 03-Oct-90 156 193 205 598 3210no 24 18-Oct-90 171 0.5 192 202 1360 3210no 26 12-Nov-90 175 0.5 311 0.2 334 0.4 1540 0.5 2840 0.4 3210
20-Oct-94 175 0.5 266 0.4 276 1270 2330 0.6 2330Yvette 26-Oct-95 172 0.5 186 197 989 2560 0.5 2690Zack 01-Nov-95 67 77 113 932 2690 0.4 2690Abel 17-Oct-96 49 92 138 189 3460Linda 01-Nov-97 151 204 327 0.4 1210 2480 0.5 2480
11-Nov-98 192 0.3 315 0.2 366 0.3 1520 0.5 435019-Nov-98 177 0.4 300 0.3 402 0.2 2460 0.17 4350 0.11 435024-Nov-98 139 165 165 1970 0.3 435016-Oct-99 82 155 172 1110 2100 0.6 368015-Dec-99 95 102 111 753 3680
Minor Flood date PA1day prob. PA2days prob. PA3days prob. QdayCM prob. Qpeak prob. Qmaxyearno 5 30-Jun-78 58 0.2 94 0.1 94 0.17 60 0.6 77 0.6 77no 1 10-Jun-84 97 0.016 127 0.02 131 0.035 312 0.026 763 0.006 763
Early Flood date PA1day prob. PA2days prob. PA3days prob. QdayCM prob. Qpeak prob. Qmaxyearno 12 25-Sep-77 162 0.005 282 0.003 307 0.0035 778 0.004 978 0.008 978no 16 06-Sep-82 22 0.9 32 0.9 42 0.9 48 0.7 55 0.8 55no 14 28-Sep-84 26 0.8 36 0.8 48 0.8 30 0.8 37Fritz 25-Sep-97 108 0.05 165 0.07 192 0.06 110 0.56 212 0.5 212
Sources 1976-1990 :1991-2000 :
:
Coincidence of landfall of Typhoons and Tropical Depressions and Area Rainfall anf flood discharges in the Kone basin
Tropical Cyclone Tracks in the Western North Pacific, Japan Meteorological Agency, 1992Annual Tropical Cyclone Report, Naval Pacific Meteorology and Oceanography Centre / Joint Typhoon Warning CentreHydro-Meterology Forecast Centre of Binh Dinh

Study on Nationwide Water Resources Development and Management in the Socialist Republic of Vietnam
FINAL REPORT C-8 Supporting Report Phase 2-2
The average monthly discharges at Cay Muong are as follows:
In Chapter 2, a comprehensive analysis is presented of the basin runoff and the runoff of the different sub-basins.
1.4.2 Flood Runoff
In the Kone basin a distinction is made between the Main Floods, Early Floods, Minor Floods and Late Floods. Main floods occur in the period October-November or, exceptionally, in December. These floods are often the result of tropical depressions, tropical storms or typhoons that land at the Vietnamese coast near the Kone Basin causing high rainfall intensities in the order of 200 – 400 mm in one day. An early arrival of storms, generally with lower intensities in the order of 50 – 100 mm in one day may cause the so-called Early Floods during the months August - September. Minor Floods may occur in the months May – June, corresponding with rainfall that is similar to the Early Flood rainfall. Late floods are floods that may occur in December after the main floods have passed, these floods tend to go together with rainfall intensities in the order 200 mm in one day.
From the analysis of historical floods at Cay Muong it is learned that the duration of the Main Floods varies between one and four days, and go together with area rainfalls in the order of some 300 mm in two days up to 500 mm in three days. The maximum yearly flood volumes (in the order of 200 – 400 Mm3) correspond, on the average,
A ve rage M o nthly Discharge at Cay M uo ng
0
50
100
150
200
250
300
Jan Fe b M ar Apr M ay Jun J ul Aug Se p O ct No v D e c
Disc
harg
e(m
3/s)

Study on Nationwide Water Resources Development and Management in the Socialist Republic of Vietnam
FINAL REPORT C-9 Supporting Report Phase 2-2
with about 65% of the rainfall volumes. The floods have a flashy character, reaching the peak discharge normally within 12 hours.
The highest discharge at Cay Muong has been observed in 1987 and amounted to 6,340 m3/s. This peak discharge has an estimated return period of about 100 years (113 years when a Pearson3 distribution is assumed and 77 years only when a Gumble distribution is assumed). The estimated probable peak discharges of the various floods are indicated below:
Annual Peak Discharges at Cay Muong (m3/s)
Probability (% per year)
50% 20% 10% 5% 2% 1%
Main Flood Peak Discharge
Late Flood Peak Discharge (December)
Minor Flood Peak Discharge (May – June)
Early Flood Peak Discharge (August –September)
2,530
250
120
180
3,700
900
250
360
4,400
1,530
360
500
5,020
2,200
460
660
5,750
3,330
610
880
6,270
4,380
720
1,070
In Chapter 2, a comprehensive analysis of the flood runoff of the different sub-catchments of the Kone Basin are presented.
1.4.3 Sediments
The runoff of sediments is measured at Cay Muong only. Daily data on the concentration of suspended sediments at that location have been collected for the period 1980 – 2000. These data are compiled in the Appedix 1 to this report.
Sediment concentrations at Cay Muong vary from practically zero in the low flow period to values of over 500 – 1,000 gr/m3 (ppm) during the floods in October – November. As a consequence most of the sediment load occurs during the flood season. The distribution of the average suspended load of some 320,000 tonnes per year is shown in the figure below:

Study on Nationwide Water Resources Development and Management in the Socialist Republic of Vietnam
FINAL REPORT C-10 Supporting Report Phase 2-2
Almost 80% of the transport of suspended sediments take place during October – November.
Yearly Distribution of Sediment Load at Cay Muong
0
20000
40000
60000
80000
100000
120000
140000
160000
180000
Jan Feb Mar Apr May Jun Jul Aug Sep Oct Nov Dec
tonn
es/m
onth

Study on Nationwide Water Resources Development and Management in the Socialist Republic of Vietnam
FINAL REPORT C-11 Supporting Report Phase 2-2
2. RUNOFF ANALYSIS
2.1 Natural Runoff
2.1.1 Objectives of the Runoff Analysis
The formulation of a comprehensive river basin plan for the Kone Basin requires an accurate assessment of the water resources potential of this basin. The water resources potential is defined as the volume of water, with an adequate quality, that can be made available for satisfying water demands. These demands can be related to agricultural, domestic and industrial water requirements but also to hydropower, navigation, wetland development and conservation, fish and wildlife, recreation and waste assimilation.
The formulation of the comprehensive plan for the Kone Basin essentially considers only the availability of surface water resources within the basin. Two other potential sources that could be considered are: (i) groundwater and (ii) the import of surface water from neighbouring basins.
An estimated 20% of the rainfall volume on the basin runs off via groundwater flow. The potential use of this groundwater is limited as a consequence of the absence of subsurface aquifers from where this water could be subtracted in an cost-effective way. For the supply of drinking water to urban areas in the basin, other sources then groundwater are being sought to safeguard the satisfaction of future demands.
The transfer of water from the projected An Khe reservoir in the Ba basin towards the Kone river is a promising option to increase the availability of water in the Kone basin. This option, however, is considered as a potential supplement to the available Kone basin waters, rather then as an alternative for the use of Kone basin waters. The basin plan will, therefor, primarily be based on the available resources in the Kone basin itself.
For the formulation of the comprehensive basin plan the natural flow regime of the Kone basin will be taken as starting point. The plan will consider the construction of reservoirs for several purposes: (i) storage for satisfying demands under natural low flow conditions, (ii) retention of flood waves and (iii) hydro-power. The water balance, will be an essential tool in the assessment of the need for such storage capacity.
The principal objective of the runoff analysis is to provide the input for detailed water balance studies and to allow the assessment in terms of time and location of the availability of surface water in the several sub-catchments of the Kone basin.
In view of the location of the areas with potential water demands and potential storage reservoirs, the runoff analysis should assess the availability of water at the following
Study on Nationwide Water Resources Development and Management in the Socialist Republic of Vietnam
FINAL REPORT C-12 Supporting Report Phase 2-2
locations in the basin:
- at Dinh Binh / Vinh Thanh, where the creation of storage capacity is envisaged and the supply of water for the Vinh Tanh irrigation scheme;
- at Cay Muong / Van Phong, where the supply of water for the Van Phong scheme is envisaged;
- at Binh Than (the apex of the Kone Delta), where the distribution of water over the several branches takes place;
- at the river mouth, where a minimum discharge is to be maintained.
In addition to these control points along the main stem of the Kone river, also the runoff of the Nui Mot, La Vi and Ha Thanh sub-basins should be known for the assessment of the water balance within these sub-basins.
The irrigation water demand is by far the most important demand in quantitative terms. Since this demand is normally expressed in the demand per decade of days, also the water availability should be known with the same time step.
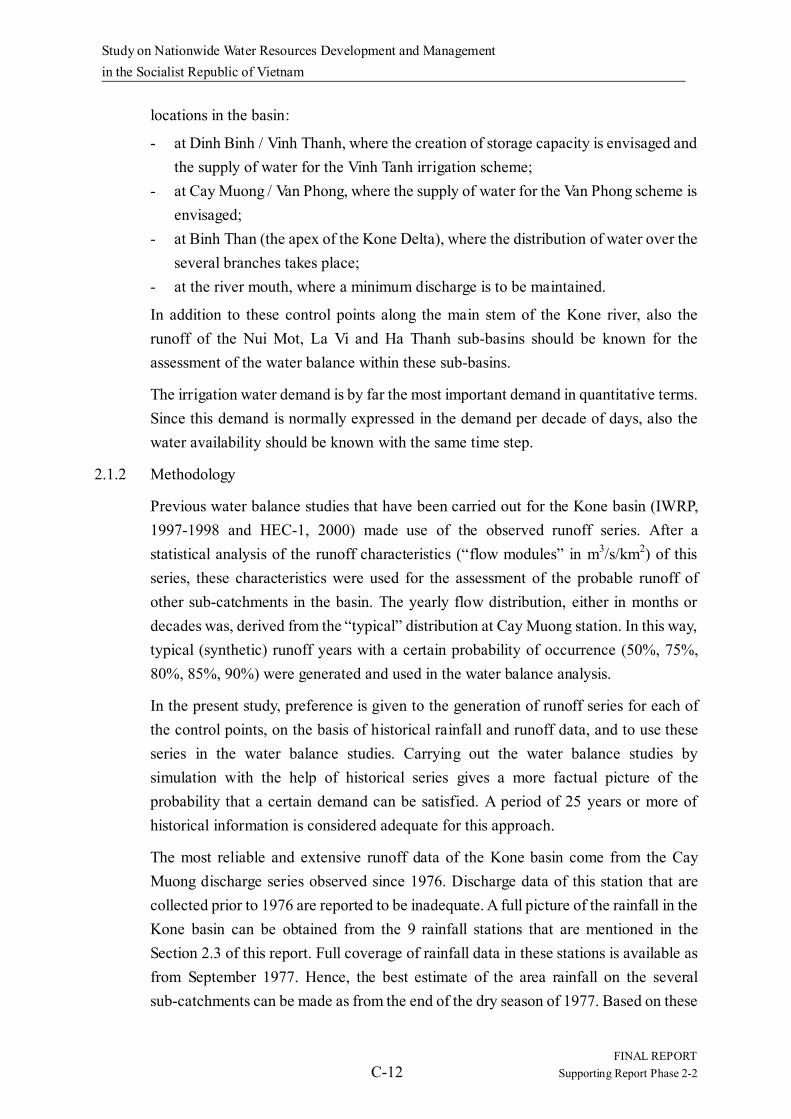
2.1.2 Methodology
Previous water balance studies that have been carried out for the Kone basin (IWRP, 1997-1998 and HEC-1, 2000) made use of the observed runoff series. After a statistical analysis of the runoff characteristics (“flow modules” in m3/s/km2) of this series, these characteristics were used for the assessment of the probable runoff of other sub-catchments in the basin. The yearly flow distribution, either in months or decades was, derived from the “typical” distribution at Cay Muong station. In this way, typical (synthetic) runoff years with a certain probability of occurrence (50%, 75%, 80%, 85%, 90%) were generated and used in the water balance analysis.
In the present study, preference is given to the generation of runoff series for each of the control points, on the basis of historical rainfall and runoff data, and to use these series in the water balance studies. Carrying out the water balance studies by simulation with the help of historical series gives a more factual picture of the probability that a certain demand can be satisfied. A period of 25 years or more of historical information is considered adequate for this approach.
The most reliable and extensive runoff data of the Kone basin come from the Cay Muong discharge series observed since 1976. Discharge data of this station that are collected prior to 1976 are reported to be inadequate. A full picture of the rainfall in the Kone basin can be obtained from the 9 rainfall stations that are mentioned in the Section 2.3 of this report. Full coverage of rainfall data in these stations is available as from September 1977. Hence, the best estimate of the area rainfall on the several sub-catchments can be made as from the end of the dry season of 1977. Based on these

Study on Nationwide Water Resources Development and Management in the Socialist Republic of Vietnam
FINAL REPORT C-13 Supporting Report Phase 2-2
considerations it has been decided to generate the runoff series at the respective control points for the period September 1977 – December 2001.
Sufficient information is available for an adequate modelling, calibration and verification of the rainfall – runoff process in the Cay Muong sub-basin. With the help of such model, the runoff series can be generated. For the estimate of the area rainfall, the Thiessen method has been applied. From the measurement of the respective areas belonging to a certain rainfall station, the following area weights have been derived:
Area Weights (%) used in the Calculation of Area Rainfall according to Thiessen
Catchment km2 BaT G V V K B Q B T P C Q N AnK V C
u/s VinhSon Dam (214) 0.0 41.0 59.0 0.0 0.0 0.0 0.0 0.0 0.0 100
u/s Dinh Binh (1040) 6.4 34.7 58.9 0.0 0.0 0.0 0.0 0.0 0.0 100
u/s CayMuong (1677) 4.3 23.6 48.7 15.3 7.1 0.0 0.0 0.9 0.0 100
u/s Binh Thanh 2250 3.2 17.6 36.4 13.8 20.9 4.0 0.0 0.7 3.4 100
NuiMot 180 0.0 0.0 0.0 0.0 13.7 20.7 11.0 0.0 54.7 100
LaVi 240 0.0 0.0 0.0 0.0 0.0 100 0.0 0.0 0.0 100
HaThanh 590 0.0 0.0 0.0 0.0 0.0 0.0 31.9 0.0 68.1 100
Delta 380 0.0 0.0 0.0 0.0 0.0 55.0 45.0 0.0 0.0 100
3640 NuiMot Catchment area: upstream of National Road No.19 LaVi Catchment area: upstream of Railway bridge HaThanh Catchment area: upstream of National Road no.1 GV: GiaVuc, VK: VinhKim, BQ: BinhQuang, BT: BinhTuong (CayMuong), PC: PhuCat, QN: Quy Nhon (Qui Nhon), VC: Van Canh
The Terms of Reference of the present study call for the use of the MIKE 11 modelling system for the simulation of the rainfall – runoff process. In the present study the NAM module of this system is used for the generation of runoff series. Also the TANK model has been used in order to examine whether this model would give a better reproduction of the rainfall – runoff process in the Kone basin.
The Rainfall- Runoff module NAM of the MIKE-11 software is a lumped conceptual rainfall-runoff model, that simulates overland flow, interflow and base flow as a function of the moisture content in each of four mutually interrelated storages. In the absence of snow storage, the following three storages are relevant for the modelling of the runoff in the Huong Basin, as shown below schematically:
- Surface storage - Lowe zone or root zone storage

Study on Nationwide Water Resources Development and Management in the Socialist Republic of Vietnam
FINAL REPORT C-14 Supporting Report Phase 2-2
The model allows to add a second groundwater storage to enable a more accurate description of the base flow, consisting of a “fast” responding component and a “slow” responding component. This feature appeared to be essential for a proper simulation of the receding runoff after the flood season.
Since Cay Muong is the sole station with adequate discharge series, the model calibration could only be done for the catchment upstream of this station. A five year series (September 1982 – August 1987) with full coverage of discharge and rainfall data has been used for model calibration. In the calibration process emphasis was put on the calibration of the recession part of the hydrograph after the flood season. An accurate calibration of this part is decisive for a correct reproduction of the low flow conditions.
For the generation of the runoff series in the respective sub-basins of the Kone basin area rainfall series have been compiled for the period September 1977 – December 2001 on the basis of the daily rainfall data described before.
Potential evapo-transpiration data of Quy Nhon according to the Hydrological Atlas were used for the entire basin for model calibration as well as for the generation of the runoff series.
The NAM Model
Base flow
LOWER ZONE (ROOT ZONE)
STORAGE
SURFACE STORAGE
Overland flow
Inter flow Uma
Lma
Ep
Ea
QO
QIF
OF IF
CK 1.2
GROUNDWATER STORAGE
Study on Nationwide Water Resources Development and Management in the Socialist Republic of Vietnam
FINAL REPORT C-15 Supporting Report Phase 2-2
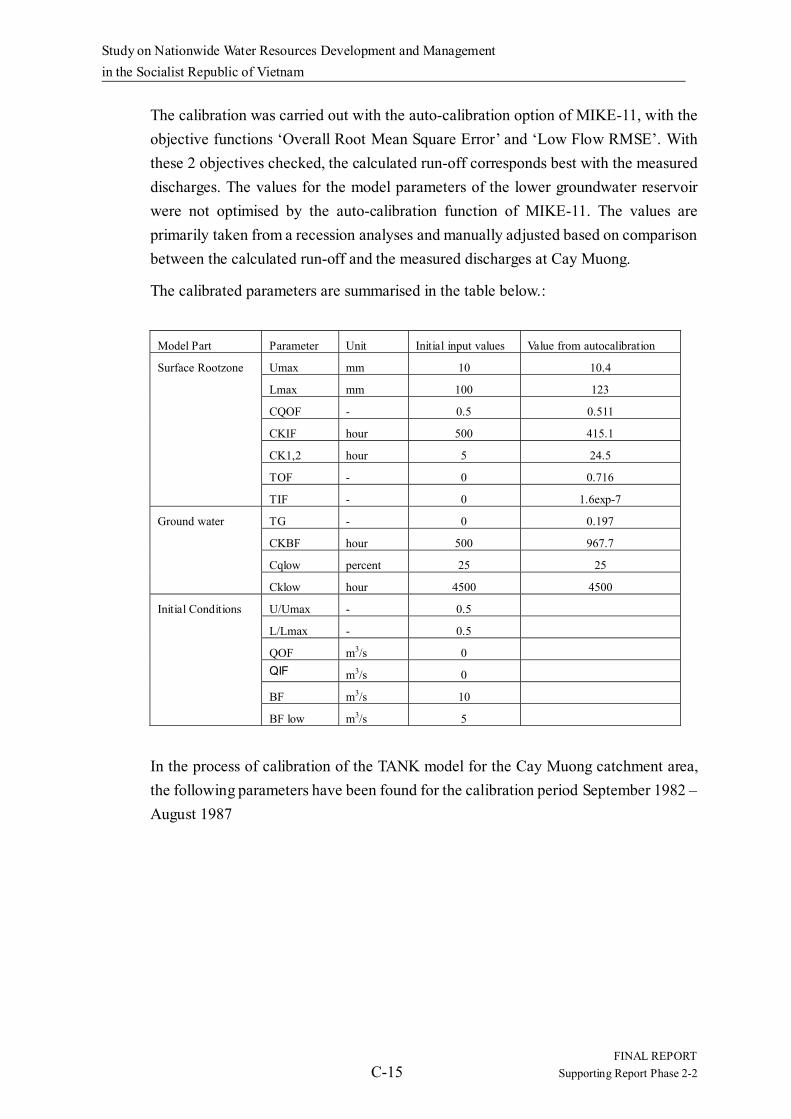
The calibration was carried out with the auto-calibration option of MIKE-11, with the objective functions ‘Overall Root Mean Square Error’ and ‘Low Flow RMSE’. With these 2 objectives checked, the calculated run-off corresponds best with the measured discharges. The values for the model parameters of the lower groundwater reservoir were not optimised by the auto-calibration function of MIKE-11. The values are primarily taken from a recession analyses and manually adjusted based on comparison between the calculated run-off and the measured discharges at Cay Muong.
The calibrated parameters are summarised in the table below.:
Model Part Parameter Unit Initial input values Value from autocalibration
Umax mm 10 10.4
Lmax mm 100 123
CQOF - 0.5 0.511
CKIF hour 500 415.1
CK1,2 hour 5 24.5
TOF - 0 0.716
Surface Rootzone
TIF - 0 1.6exp-7
TG - 0 0.197
CKBF hour 500 967.7
Cqlow percent 25 25
Ground water
Cklow hour 4500 4500
U/Umax - 0.5
L/Lmax - 0.5
QOF m3/s 0 QIF m3/s 0
BF m3/s 10
Initial Conditions
BF low m3/s 5
In the process of calibration of the TANK model for the Cay Muong catchment area, the following parameters have been found for the calibration period September 1982 – August 1987

Study on Nationwide Water Resources Development and Management in the Socialist Republic of Vietnam
FINAL REPORT C-16 Supporting Report Phase 2-2
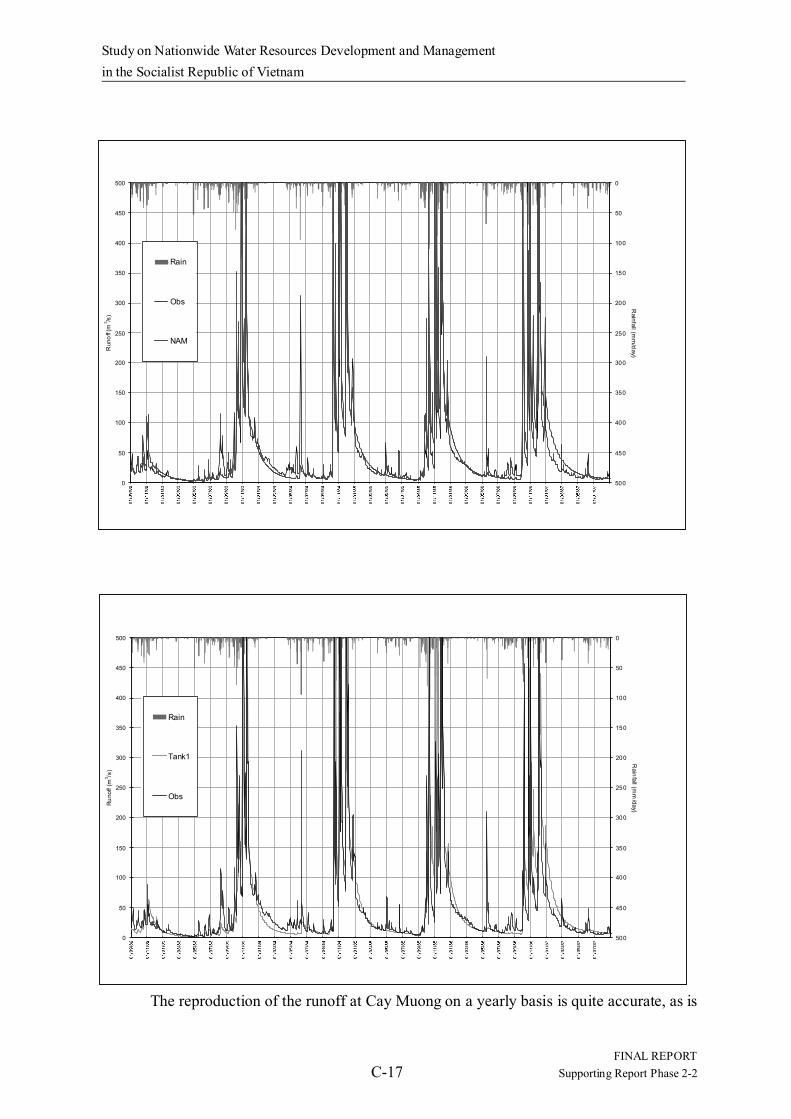
Comparison of the two TANK calibrations revealed better results for the manual calibration.
The calibration results of both the NAM and the TANK model are shown in the figures overleaf. The results are quite similar and no clear preference for the use of one of the models can be derived from these results. Both models describe satisfactorily the recession curve after the rainy season and give an acceptable reproduction of the low flow conditions. Based on these results it was concluded that it is possible to describe satisfactorily the rainfall- runoff process in the area under study with the help of both models. Wit reference to the greater familiarity that the MARD has with MIKE11-NAM model, it has been decided to use the results of this model in the further analysis.
Manual calibration Auto calibrationFocussing on low f low regime andregression curve
Minimising dif ferences w ith observedlow f lows (January – September)
Initial storage height 0 mm Init ial storage height 0 mm
60 mm 0.450 1-2 55.4 mm 0.262 1-2
10 mm 0.150 1-1 8.2 mm 0.040 1-1
0.3500 0.4546
Initial storage height 30 mm Init ial storage height 0 mm
0 mm 0.003 2-2
0 mm 0.0300 2-1 0 mm 0.0250 2-1
0.0350 0.0144
Initial storage height 20 mm Init ial storage height 22.56 mm
0 mm 0.000 3-2
0 mm 0.0120 3-1 0 mm 0.0095 3-1
0.0030 0.0032
Initial storage height 10 mm Init ial storage height 10.24 mm
0 mm 0.000 4-2
0 mm 0.01200 4-1 0 mm 0.00927 4-1
Study on Nationwide Water Resources Development and Management in the Socialist Republic of Vietnam
FINAL REPORT C-17 Supporting Report Phase 2-2
The reproduction of the runoff at Cay Muong on a yearly basis is quite accurate, as is
0
50
100
150
200
250
300
350
400
450
500
Runo
ff (m
3 /s)
0
50
100
150
200
250
300
350
400
450
500
Rainfall (m
m/day)
Rain
Tank1
Obs
0
50
100
150
200
250
300
350
400
450
500
Run
off (
m3 /s
)
0
50
100
150
200
250
300
350
400
450
500
Rainfall (m
m/day)
Rain
Obs
NAM

Study on Nationwide Water Resources Development and Management in the Socialist Republic of Vietnam
FINAL REPORT C-18 Supporting Report Phase 2-2
shown in the following table:
Average Yearly Runoff at Cay Muong (m3/s) Probability of Exceeding (assuming LN3 distribution)
50% 75% 90%
Historic Series 1978 - 2001 66.4 46.5 31.0 Generated Series 1978 - 2001 65.4 45.6 29.3
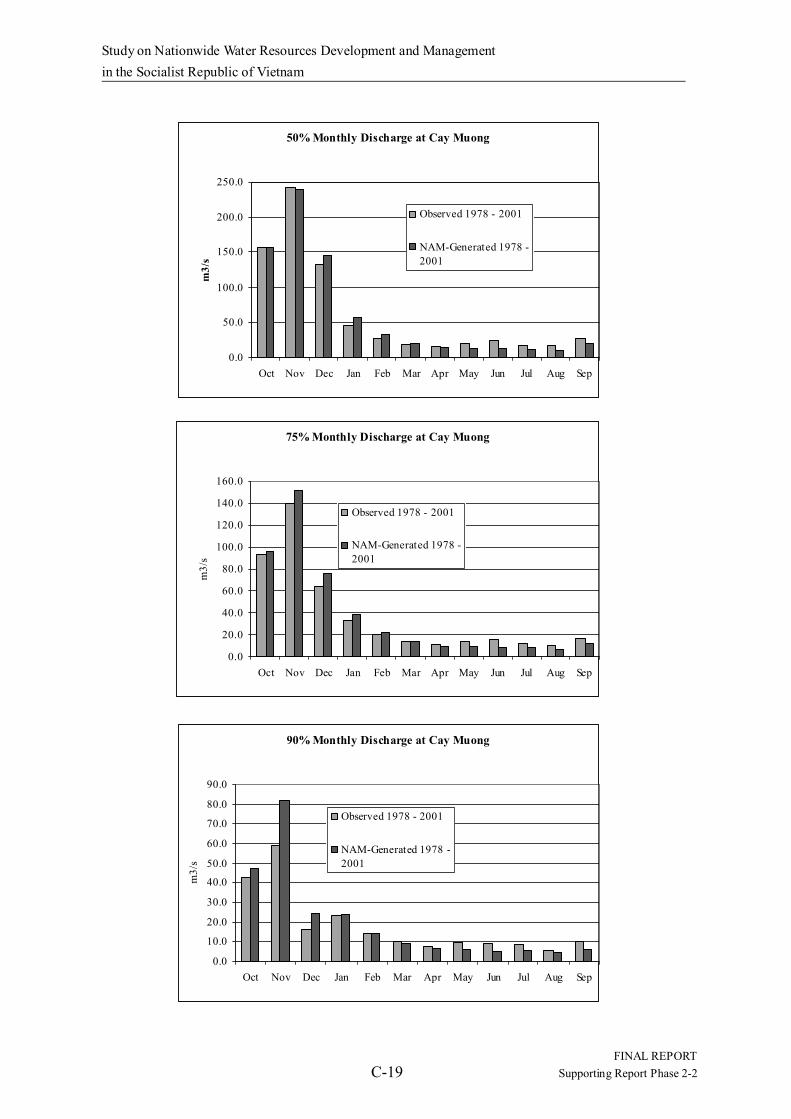
It is noted that the minor floods that tend to occur in the May – June period are not well reproduced by neither of the models. This phenomena is most probably caused by the fact that in running the models, use has been made of the daily area rainfall data. These minor floods are likely to be the result local intensive storms of short duration. Spreading such short intensive rain over a full day hardly generates a noticeable peak runoff.
These minor floods, however, have a noticeable impact on the average monthly or decade runoff. This impact is not reproduced adequately in the models. As a consequence, the average monthly or decade discharges generated by the models show an underestimate of the natural runoff during especially the months May and June. Therefor, the discharges generated for the months of May and June from the sub-catchments have been corrected in accordance with the deviation between the observed runoff and the generated runoff at Cay Muong during the months May and June. This deviation is presented in the figures overleaf.
In the absence of available runoff data and corresponding rainfall data of other (sub-) catchments in the Kone basin, it has not been possible to validate the calibration results of the Cay Muong catchment in other catchments. Therefore, the assumption that the Cay Muong calibration results can be used for the generation of runoff series in the different control points and sub-catchments could not be verified.
Study on Nationwide Water Resources Development and Management in the Socialist Republic of Vietnam
FINAL REPORT C-19 Supporting Report Phase 2-2
50% Monthly Discharge at Cay Muong
0.0
50.0
100.0
150.0
200.0
250.0
Oct Nov Dec Jan Feb Mar Apr May Jun Jul Aug Sep
m3/
sObserved 1978 - 2001
NAM-Generated 1978 -2001
75% Monthly Discharge at Cay Muong
0.0
20.0
40.0
60.0
80.0
100.0
120.0
140.0
160.0
Oct Nov Dec Jan Feb Mar Apr May Jun Jul Aug Sep
m3/
s
Observed 1978 - 2001
NAM-Generated 1978 -2001
90% Monthly Discharge at Cay Muong
0.0
10.0
20.0
30.0
40.0
50.0
60.0
70.0
80.0
90.0
Oct Nov Dec Jan Feb Mar Apr May Jun Jul Aug Sep
m3/
s
Observed 1978 - 2001
NAM-Generated 1978 -2001

Study on Nationwide Water Resources Development and Management in the Socialist Republic of Vietnam
FINAL REPORT C-20 Supporting Report Phase 2-2
2.1.3 Result of the Runoff Analysis
In the present study, the water balance in the respective sub-catchment areas is analysed on the basis of the 25 years of historic 10-days runoff series. These series have been generated in accordance with the methodology described in the previous section and are presented in the Table C.1.
The results have been summarised for the relevant low flow months for all control points in Figure C3 and C.4.
2.2 High Flow Analysis
2.2.1 Objectives of the High Flow Analysis
Flood damage mitigation is one of the main subjects in the preparation of the comprehensive management plan for the Kone basin. A proper description of the natural flood phenomena in the basin is essential for the formulation of measures for the mitigation of the flood damages. Moreover, regulation works for water management, like dams, weirs, dikes, etc, need to be designed in such a way that they are safe under most, if not all, flood conditions.
From the point of view of the mitigation of flood damages, it is essential that a flood protection level is adopted that is optimal from the socio-economic and environmental point of view.
Actually, the MARD is applying the following flood protection criteria for the Kone basin:
- protection against the once in 10 years main flood, and - protection against the once in 100 years early flood.
The MARD distinguishes the following types of flood in the Kone basin:
- the main flood: occurring during October – November; - the late flood : occurring during December – January; - the minor flood: occurring during May – June;the early flood: occurring during
August – September.
The Binh Dinh provincial authorities tend to accept the occurrence of the main flood, provided that the late floods occurring just after the October-November main flood season will not damage the newly planted winter-spring crop. A protection level of 5% (once in the 20 years on the average) is aimed at.
The present flood analysis aims at the assessment of peak discharges and the corresponding flood volumes for the flood events with return periods of 2 years, 5 years, 10 years, 20 years, 50 years and 100 years in the different flood periods. These

Study on Nationwide Water Resources Development and Management in the Socialist Republic of Vietnam
FINAL REPORT C-21 Supporting Report Phase 2-2
flood events need to be estimated at the locations where the implementation of flood control measures are envisaged, as well just upstream of the flood prone area.
The implementation of flood control measures upstream of the flood prone area is envisaged at:
- Dinh Binh (reservoir) - Cay Muong (retarding basin)
The flood prone area has been defined as follows:
The lower basin or Delta area, located downstream of Binh Thanh (Apex) and bordered by Road 635 in the north and Road 19 in the south.
Consequently, flood runoff of the following sub-basins is to be estimated:
- The upper and middle Kone basin, discharging at the Delta apex at Binh Thanh; - The upper and middle Nui Mot basin located upstream of National Road No. 19; - The upper and middle Ha Thanh basin located upstream of the National Road
No.1; - The upper and middle La Vi basin located upstream of Phu Cat and north of the
Provincial Road 635;
In this report a distinction is made between probable floods and design floods. Probable floods are the floods that have been derived on the basis of a frequency analysis of historic events, considering the validity of certain probability distribution functions.
Design floods are the floods to be used in designing the hydraulic works and that, therefor, include a certain safety margin as compared to the estimated probable floods. This distinction is made since the Vietnamese practice tend to assess the so-called probable floods with a safety margin included that is related to the length of the series and the standard deviation the observed extreme events. As a consequence, the so-called probable floods as assessed by the Vietnamese parties is always at the higher side than the probable floods calculated with the help of an accepted probability distribution function.
2.2.2 Methodology of the High Flow Analysis
For the assessment of the flood runoff at the various locations in the Kone basin, two different approaches have been followed. Both based on the available historical hydro-meteorological data of the basin. The first method aiming at a reliable and detailed description of rainfall-runoff relations, allowing the conversion of the (abundantly available) rainfall series into runoff series. The second method seeks the estimation of flood runoff from the statistical analysis of runoff data and empirical

Study on Nationwide Water Resources Development and Management in the Socialist Republic of Vietnam
FINAL REPORT C-22 Supporting Report Phase 2-2
methods for the construction of the flood hydrograph and its conversion from one sub-basin to another.
As has been mentioned already before, discharges in the Kone basin are observed in Cay Muong only. The discharge measurements that have been initiated in the framework of the present project at Dinh Binh have not yet produced sufficient results for the compilation of a rating curve that could serve for the conversion of observed water levels at Dinh Binh into discharges. Discharges observed at Vinh Son, Nui Mot and Thuan Ninh refer to reservoir releases and cannot be considered as natural runoff from the respective sub-basins.
Available rainfall data allow for an accurate estimate of the area rainfall on the respective sub-catchments in the basin. These rainfall data, however, are generally available on a daily basis only. The absence of sufficient hourly rainfall information hampers seriously an accurate calibration of rainfall-runoff relations under flood conditions. The very rapid response of the various sub-basins on the occurrence of storms, (in the order of a few hours) makes it necessary that very accurate hourly area rainfall information is required for calibration and verification of rainfall-runoff models for the simulation of flood runoff of the different sub-catchments. The hourly rainfall data within the Kone basin is only available at Quy Nhon, at the downstream edge of the basin. At the upstream side of the basin, the nearest by station with hourly rainfall data is at Ba To. In the coastal area between these two stations hourly rainfall data were obtained from Hoai Nhon. The geographical spacing of these stations does not allow, however, to assess accurately the hourly distribution of the area rainfall on the several sub-catchments of the Kone basin.
Nevertheless, an attempt has been made to reproduce a number historical floods with the help of the Sacramento model. The results of this exercise are described in the Annex 2 to this report. An acceptable model calibration could be achieved.
However, it would be rather arbitrary to apply the model for the generation of designs floods without a profound analysis of the probability of occurrence of certain storm events with certain time (hours) and spatial distribution. Such a profound analysis, however, is only possible with adequate time series of hourly rainfall within the Kone basin and its respective sub-basins. Such time series were not available in the present study.

Study on Nationwide Water Resources Development and Management in the Socialist Republic of Vietnam
FINAL REPORT C-23 Supporting Report Phase 2-2
During the Phase-1 hydrological studies of the present project, similar problems were encountered in the flood
analysis in the Huong Basin. In that basin a better spatial distribution of hourly rainfall information allowed
for a reasonably accurate reproduction of the response of the different sub-basins to the storms. However, the
definition of a design storm appeared to be critical . A different hourly distribution of the same peak daily
rainfall can generate peak flows that can easily differ from each other by 30%.
For the Kone basin, the 1987 flood and corresponding hourly rainfall distribution has been used to estimate
tentatively the 10% and 1% flood hydrographs at Binh Dinh. The results are given in Annex 1 and indicate that
these results are consistent with those obtained with the synthetic hydrograph approach that is presented
below.
It is concluded that insufficient data is available in the Kone basin for a proper calibration and subsequent use of an advanced rainfall-runoff model for the different sub-catchments of the Kone basin. Hence, it is considered a proper approach to derive from the historical observed flood events an appropriate synthetic hydrograph that can be used for the different sub-catchment areas.
The approach that has been followed for the generation of the flood hydrographs to be used in the formulation and subsequent design of the flood protection measures starts from the basic principle: “a p% flood is generated by a p% (area) rainfall”
Basic (single peak) synthetic hydrograph is given by: )1(
pTtm
m
ppt e
TtQQ
−∗
= (1)
where: Qt = Runoff at time t [m3/s] Qp = Peak runoff [m3/s], at time Tp t = time elapsed [h] Tp = time to peak of hydrograph [h] m = determines the shape of the hydrograph. For m = 3,
this hydrograph matches the USDA SCS dimensionless hydrograph closely.(In physical terms, m = the number of reservoirs in the so-called Nash reservoir cascade)
Thus, for each catchment, Qp,Tp, and m are to be determined, such that:
a) Qp equals the observed, or statistically determined peak flow
b) Tp matches the observed times to peak during historical floods
c) m is selected such that the synthetic hydrograph shape is similar to the observed ones

Study on Nationwide Water Resources Development and Management in the Socialist Republic of Vietnam
FINAL REPORT C-24 Supporting Report Phase 2-2
d) the total runoff during the flood period, Va, is the same as that of the corresponding catchment rainfall, Pa, times an average runoff factor, Ca, times the catchment area, Fa.
Or aaaa FCPV = (2)
where: Va = total runoff volume during flood, including baseflow [m3/s]
Pa = catchment rainfall [mm], determined by averaging weighted rainfall from a number of rainfall gauges in the catchment by the Thiessen method
Ca = runoff co-efficient, calculated from observed flood situations [-]
Fa = catchment area [km2]
The transposing of flood peaks and base flows from the gauged (Cay Muong) catchment to the ungauged catchment is carried out as follows, with the associated catchment rainfall being derived using the Thiessen method.
1) determine the transpose coefficient at the gauged catchment as follows: )1(
max,n
app FAQ −= (3)
Or )1(max,
na
pp F
QA −=
(4)
where: Qmax,p = Flood peak with an associated probability of p%, including baseflow [m3/s]
Ap = Corresponding transpose factor [-]
Fa = Gauged catchment area [km2] n = Regionalised factor determined by experience, for
Southern Central Region of Vietnam, n = 0.35 [-]. A “n” value of 0.55 would give similar results as the Creager Formula (giving the envelop for maximum peak discharges).
2) The flood peak at the ungauged location is calculated using (3), with Ap calculated in the previous step, Fa being the ungauged catchment area, for n an intermediate value between 0.35 and 0.55.has been assumed at 0.45.
3) The baseflow at the ungauged catchment is calculated as:

Study on Nationwide Water Resources Development and Management in the Socialist Republic of Vietnam
FINAL REPORT C-25 Supporting Report Phase 2-2
gbga
uaub Q
FF
Q ,,
,, =
(5)
where Q and F are baseflow and catchment area respectively and indices u and g refer to ungauged and gauged catchments respectively.
For Cay Muong the average baseflow during flood periods is taken as the 10% wet season (oct-dec) flow, calculated at: 324 m3/s
2.2.3 Historical Floods
(1) Main Floods
The maximum yearly (instantaneous) peak discharges at Cay Muong have been analysed for the different periods that are considered relevant for the flood damage assessments.
The straightforward approach has been followed in which a number of distribution functions have been tried out to find the distribution function that best fits the series of 26 observed instantaneous peak discharges. That distribution function has subsequently been used to estimate the peak discharges with return periods up to 100 years.
The main flood is, according to the MARD definition, the flood that occurs in the months October – November. Out of the 26 years of observation three annual maximum discharges took place, however, in December and one in September. These “late and early floods” have been included in the analysis of the probability distribution of main floods.
The following instantaneous main flood peak discharges have been identified:

Study on Nationwide Water Resources Development and Management in the Socialist Republic of Vietnam
FINAL REPORT C-26 Supporting Report Phase 2-2
Historical Instantaneous Main Flood Peak Discharges (m3/s)
Year Peak Discharge Date
1976
1977
1978
1979
1980
1981
1982
1983
1984
1985
1986
1987
1988
1989
1990
1991
1992
1993
1994
1995
1996
1997
1998
1999
2000
2001
1,466
2,751
1,475
2,280
4,280
4,140
106
2,770
3,480
2,450
2,860
6,340
2,050
553
3,210
2,340
3,220
1,510
2,330
2,690
3,460
2,480
4,350
3,680
1,800
1,740
November 14
November 10
November 4
November 18
November 17
November 9
November 4
October 30
November 8
November 25
December 3
November 19
October 15
September 18
October 15
October 24
October 23
October 4
October 21
November 1
December 1
November 4
November 22
December 3
November 17
November 12

Study on Nationwide Water Resources Development and Management in the Socialist Republic of Vietnam
FINAL REPORT C-27 Supporting Report Phase 2-2
Before the observed peak discharges were analysed, a brief validation exercise was carried out on the available
data. Since Cay Muong is the only discharge measurement station in the Kone basin, there is no possibility of data
validation through comparison with other discharge series. Besides a visual check of time series graphs, a
validation of flood discharges has been carried out by comparison of the water level – discharge relations in the
different years.
Most of the “observed” peak discharges are derived from rating curves, rather than actually measured. (No
hysteresis loop is found in the water level discharge relations during floods, although such phenomena is
anticipated as a result of the flashy character of the floods.)
From the comparison it is learned that there is an increasing scatter of observed discharges at higher water levels.
Since this scatter is relatively small at the lower water levels, it is not likely that the deviations at the higher levels
are due to morphological changes in the river channel.
An evaluation with a calculated level discharge relation at Cay Muong, applying the Manning formulae, makes it
likely that the 1987 peak discharge has been overestimated. The extrapolation of the1987 rating curve, leading to
the maximum “observed” discharge of 6,340 m3/s, seems moreover not to be underpinned with measurements. A
tentative correction of the 1987 peak discharge would lead to probable peak discharges that are 6-8% lower than
the probable peak discharges that are calculated when the “observed “ 1987 peak discharge is not corrected.
Such correction has, however, not been made in the present study for the sake of safety.
Q-H floods Cay Muong
0
1000
2000
3000
4000
5000
6000
7000
2100 2200 2300 2400 2500 2600 2700
Water Le vel (cm )
Q (m
3/s)
1987 1980 1998 1996 qh Manning

Study on Nationwide Water Resources Development and Management in the Socialist Republic of Vietnam
FINAL REPORT C-28 Supporting Report Phase 2-2
For the annual main flood peak discharge, the following distribution functions have been examined:
GEV Log-Normal (3 parameters)) Log Pearson (3 parameters) Pearson 3 (3 parameters) Gumble Type 1 (2 parameters) Raleigh Goodrich
The results are summarised below:
Annual Peak Discharges Main Flood at Cay Muong (m3/s)
Probability (% per year) Distribution
Function 50% 20% 10% 5% 2% 1% 0.5%
GEV
Log Normal 3
Log Pearson 3
Pearson 3
Gumble
Raleigh
Goodrich
2526
2541
2497
2536
2452
2511
2561
3704
3698
3905
3706
3603
3772
3753
4409
4384
4653
4396
4364
4491
4402
5035
5020
5237
5007
5095
5108
4953
5777
5739
5829
5738
6041
5822
5560
6286
6269
6176
6253
6750
6309
5971
6851
6613
6746
7456
6759
6364
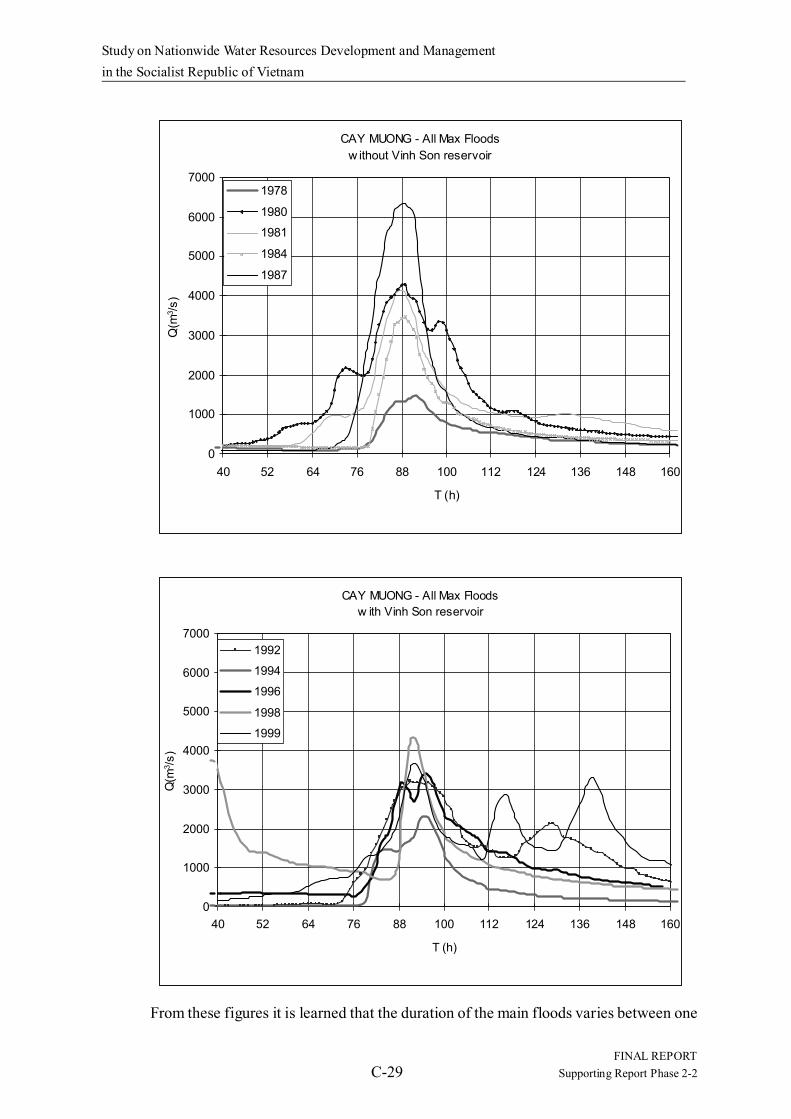
In addition to the analysis of the probability of peak discharges, also the shape and volume of the 10 main floods that have occurred in the period 1976 – 2001 have been examined. Under the assumption that the construction of Vinh Son reservoir has an impact on the shape of the flood hydrograph that passes at Cay Muong, a distinction has been made between the flood events prior to and after the construction of Vinh Son. It is anticipated that the assumed impact of Vinh Son will be minor, since the higher flood peaks of the major floods can pass the (ungated) Vinh Son spillway without any retention.
The 10 major floods are shown in the figures overleaf. The floods are presented in such a way that the peak of all floods coincide. This facilitates the comparison between these floods.
Study on Nationwide Water Resources Development and Management in the Socialist Republic of Vietnam
FINAL REPORT C-29 Supporting Report Phase 2-2
From these figures it is learned that the duration of the main floods varies between one
CAY MUONG - All Max Floodsw ithout Vinh Son reservoir
0
1000
2000
3000
4000
5000
6000
7000
40 52 64 76 88 100 112 124 136 148 160
T (h)
Q(m
3 /s)
1978
19801981
1984
1987
CAY MUONG - All Max Floodsw ith Vinh Son reservoir
0
1000
2000
3000
4000
5000
6000
7000
40 52 64 76 88 100 112 124 136 148 160
T (h)
Q(m
3 /s)
1992
1994
1996
1998
1999

Study on Nationwide Water Resources Development and Management in the Socialist Republic of Vietnam
FINAL REPORT C-30 Supporting Report Phase 2-2
and four days. Taking respectively two and three days as typical duration of the floods, the following characterisation of the historical floods have been derived:
Historical Flood Characteristics, considering 2-day flood duration
Year 1978 1980 1981 1984 1987 1992 1994 1996 1998 1999
Qp (m3/s) 1,475 4280 4140 3480 6340 3,220 2,330 3,30 4,350 3,680
Return Period (Qp-LN3) (yrs) 1.2 8.9 7.7 4.1 101.9 3.3 1.8 4.0 10 5
Corresponding 2-days area rain (mm) 166 292 312 190 313 380 267 314 331 354
Return Period rainfall (Pda-LN3) (yrs) 1.1 2.8 3.7 1.2 3.8 14.6 2.1 3.8 5.1 8.1
Volume of main peak (Mm3) 136 447 334 245 426 378 175 335 330 377
Return Period Volume (Vol-LN3) (yrs) 1.3 32.4 5.6 2.3 22.8 10.7 1.5 5.9 5.6 10.5
Overall Runoff Factor 0.5 0.9 0.6 0.8 0.8 0.6 0.4 0.6 0.6 0.6
Time to peak (hrs) 12 20 19 9 14 8 15 13 7 31
Average Overall Flood Runoff Factor 0.65
Average Time to Peak (hrs) 14.8
Historical Flood Characteristics, considering 3-day flood duration
Year 1978 1980 1981 1984 1987 1992 1994 1996 1998 1999
Qp (m3/s) 1,475 4,280 4,140 3,480 6,340 3,220 2,330 3,430 4,350 3,680
Return Period (Qp-LN3) (yrs) 1.2 8.9 7.7 4.1 101.9 3.3 1.8 4.0 10 5
Corresponding 3-days area rain (mm) 357 359 329 191 358 511 280 380 456 520
Return Period rainfall (Pda-LN3) (yrs) 7 7 6 1.1 7 14 1.6 3.4 7 15
Volume of main peak (Mm3) 164 520 416 279 459 494 192 396 480 549
Return Period Volume (Vol-LN3) (yrs) 1.3 18.1 6 2.1 9.2 13.5 1.4 5 12 26
Overall Runoff Factor 0.3 0.9 0.8 0.9 0.8 0.6 0.4 0.6 0.6 0.6
Time to peak (hrs) 13 20 20 9 16 12 15 15 7 30
Average Overall Flood Runoff Factor 0.65
Average Time to Peak (hrs) 15.7
It is noted that the “Overall Runoff Factor” tends to be lower after the construction of Vinh Son reservoir than it was before. This points to the possibility that the fraction of the flood volume that is stored in the Vinh Son reservoir is substantial. It is recommended not to reckon with the retarding effect of this reservoir, in line with the suggestion made above that the retarding effect of this reservoir could be neglected. Neglecting the retarding effect would lead to an average overall runoff factor of about

Study on Nationwide Water Resources Development and Management in the Socialist Republic of Vietnam
FINAL REPORT C-31 Supporting Report Phase 2-2
0.7.
(2) Late Floods
Following the main floods that usually occur in the period October - November, preparations are made for planting the so-called winter-spring crop. Once land preparation and planting has started, agricultural damage can be caused by flooding. Floods that occur after the main flood season, and after the preparation for the winter-spring crop has started, are indicated as the so called Late Floods. Protection against these floods is one of the options for flood damage mitigation measures in the flood prone area.
The following practice is assumed for the lower floodprone Delta area:
- The last decade of November is waited for to decide whether preparation will start in the first decade of December. When flooding takes place during the last November decade (QCay Muong>350 m3/s), then the decision is postponed until the first decade of December.
- In case the decision in the last November decade is positive, then preparation will start in the first decade of December, provided that at the start of that decade the main flood has sufficiently receded (QCay Muong<350 m3/s). If not, preparation is postponed until the second decade.
- - Actual start of preparation in the second decade of December will only be done when at the beginning of that decade the flood has sufficiently receded. Otherwise, preparation is postponed until the next decade, and so on.The late flood is defined as the peak discharge that occurs during or after the decade in which the preparation is started.
Following above described approach, the following late flood peak discharges have been observed or estimated:

Study on Nationwide Water Resources Development and Management in the Socialist Republic of Vietnam
FINAL REPORT C-32 Supporting Report Phase 2-2
Historical Late Flood Peak Discharges (m3/s)
Year Planting Decade Peak Discharge Date 1976 1977 1978 1979 1980 1981 1982 1983 1984 1985 1986 1987 1988 1989 1990 1991 1992 1993 1994 1995 1996 1997 1998 1999 2000 2001
December-1 December-1 December-1 December-1 December-1 December-2 December-1 December-1 December-2 December-2 December-1 December-2 December-1 December-1 December-1 December-2 December-1 December-2 December-1 December-1 December-1 December-1 December-2 December-1 December-2 December-1
85 64
240 129 134
274/348*
31 115
206/248*
156/174*
2850 81 87 99
151 193 109 835
135 428
1,550
209 1,830 3,680
450 254
3-December 3-December 7-December 3-December 1-December 11-December 9-December 19-December 25-December 21-December 3-December 10-December 5-December 1-December 5-December 14-December 25-December 16-December 22-December 26-December 20-December 3-December 11-December 3-December 28-December 11-December
* instantaneous peak flows derived from the peak average day discharge, using the relation Q^ = 1.47 Qday –55, that
was found for the late flood peak discharges.
On the basis of the above derived late flood peak discharges frequency analyses have been carried out for different distribution functions. It is noted that for most functions a rather poor fit was achieved. The following results have been calculated:
Annual Late Flood Peak Discharges (m3/s)
Probability (% per year) Distribution Funtion
50% 20% 10% 5% 2% 1%
Log Normal 3
Log Pearson 3
Pearson 3
Gumble
Raleigh
Goodrich
320
221
229
407
452
235
1,068
695
1,034
1,217
1,314
798
1,652
1,250
1,704
1,752
1,805
1,523
2,290
2,045
2,389
2,266
2,227
2,064
3,175
3,657
3,346
2,931
2,716
3,131
3,918
5,499
4,075
3,430
3,048
4,036
In order to assess the allowable Dinh Binh reservoir level in the last two decades

Study on Nationwide Water Resources Development and Management in the Socialist Republic of Vietnam
FINAL REPORT C-33 Supporting Report Phase 2-2
of December, an estimate has been made of the probable floods that may occur during the periods 11 December – 31 December and 21 December – 31 December.
For this purpose the maximum daily discharges at Cay Muong have been analysed and the probabilities estimated (it appeared that the Pearson-3 distribution function gave a reasonable fit, and better than other distribution functions). The following probable maximum discharges at Cay Muong were found, estimating the instantaneous peak discharges at 1.5 times the daily peak discharges, in accordance with above mentioned relation between maximum daily and instantaneous peak discharges.
Probable maximum discharge at Cay Muong during late December (m3/s)
Period 50% 20% 10% 5% 2% 1%
December 11–December 31
December 21–December 31
240
170
740
350
1,130
480
1,515
600
2,060
750
2,460
870
(3) Early Floods
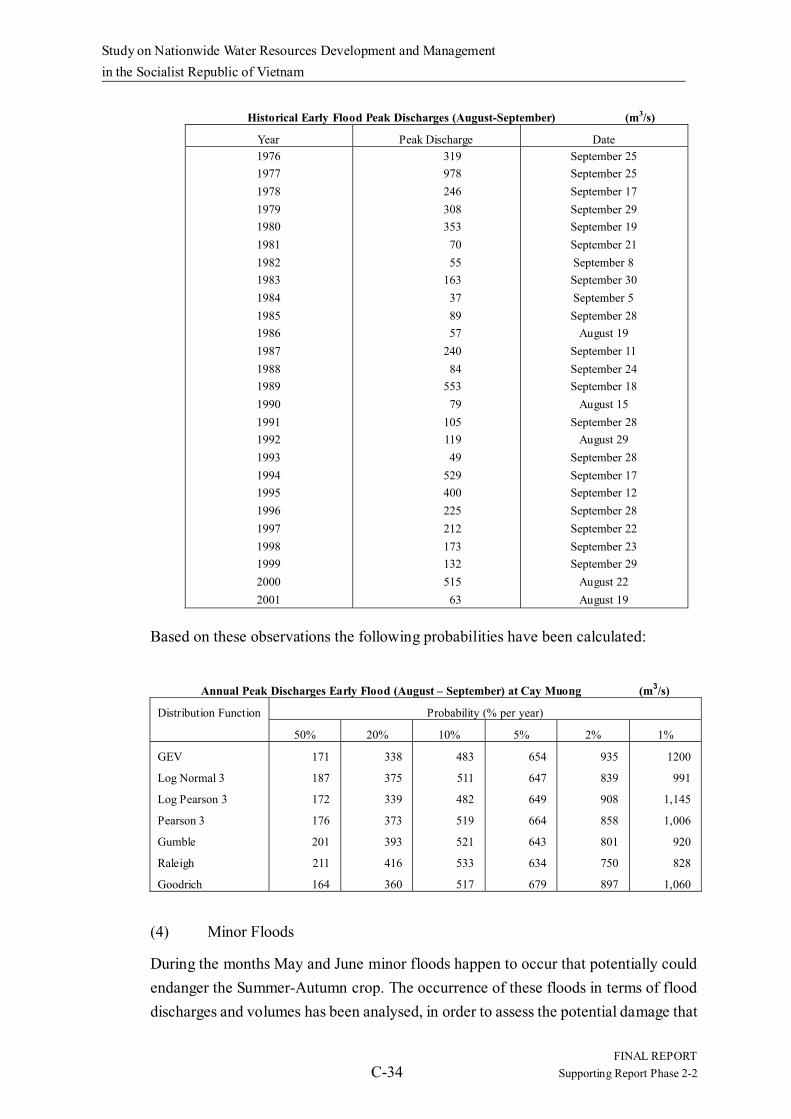
The same distribution functions have been examined for the annual early flood peak discharges. These floods happen to occur during August-September and could potentially endanger the Seasonal crops. The occurrence of these floods in terms of flood discharges and volumes has been analysed, in order to assess the potential damage that can be caused by these floods under the present and future land use and water management conditions.
The following historical instantaneous peak discharges have been identified for the months August-September.
Study on Nationwide Water Resources Development and Management in the Socialist Republic of Vietnam
FINAL REPORT C-34 Supporting Report Phase 2-2
Historical Early Flood Peak Discharges (August-September) (m3/s)
Year Peak Discharge Date 1976 1977 1978 1979 1980 1981 1982 1983 1984 1985 1986 1987 1988 1989 1990 1991 1992 1993 1994 1995 1996 1997 1998 1999 2000 2001
319 978 246 308 353 70 55
163 37 89 57
240 84
553 79
105 119 49
529 400 225 212 173 132 515 63
September 25 September 25 September 17 September 29 September 19 September 21 September 8 September 30 September 5 September 28
August 19 September 11 September 24 September 18
August 15 September 28
August 29 September 28 September 17 September 12 September 28 September 22 September 23 September 29
August 22 August 19
Based on these observations the following probabilities have been calculated:
Annual Peak Discharges Early Flood (August – September) at Cay Muong (m3/s)
Probability (% per year) Distribution Function
50% 20% 10% 5% 2% 1%
GEV
Log Normal 3
Log Pearson 3
Pearson 3
Gumble
Raleigh
Goodrich
171
187
172
176
201
211
164
338
375
339
373
393
416
360
483
511
482
519
521
533
517
654
647
649
664
643
634
679
935
839
908
858
801
750
897
1200
991
1,145
1,006
920
828
1,060
(4) Minor Floods
During the months May and June minor floods happen to occur that potentially could endanger the Summer-Autumn crop. The occurrence of these floods in terms of flood discharges and volumes has been analysed, in order to assess the potential damage that

Study on Nationwide Water Resources Development and Management in the Socialist Republic of Vietnam
FINAL REPORT C-35 Supporting Report Phase 2-2
can be caused by these floods under the present and future land use and water management conditions.
For the analysis of the minor floods it is considered appropriate to take into account the maximum discharges and corresponding rainfall that have been observed during the full Summer-Autumn crop period that spans the month April – July. Although the minor floods use to happen in May – June, also exceptional events that could occur in April or July are to be considered.
The following instantaneous peak discharges have been identified:
Historical Instantaneous Peak Discharges during Summer Autumn (m3/s)
Year Peak Discharge Date 1976 1977 1978 1979 1980 1981 1982 1983 1984 1985 1986 1987 1988 1989 1990 1991 1992 1993 1994 1995 1996 1997 1998 1999 2000 2001
36 16 45
189 118 174 64 52 80
147 420 66 41
142 812 60 54 23
133 59
387 112 136 236 232 130
May 24 May 25
May 13-14 May 23 June 24 June 17 June 17 June 26 May 26 May 1 May 19 June 10 July 18 July 17 June 15 July 11 June 14 June 24 June 29 June 1 May 18 May 30 June 30 June 15 June 1 May 14
Study on Nationwide Water Resources Development and Management in the Socialist Republic of Vietnam
FINAL REPORT C-36 Supporting Report Phase 2-2
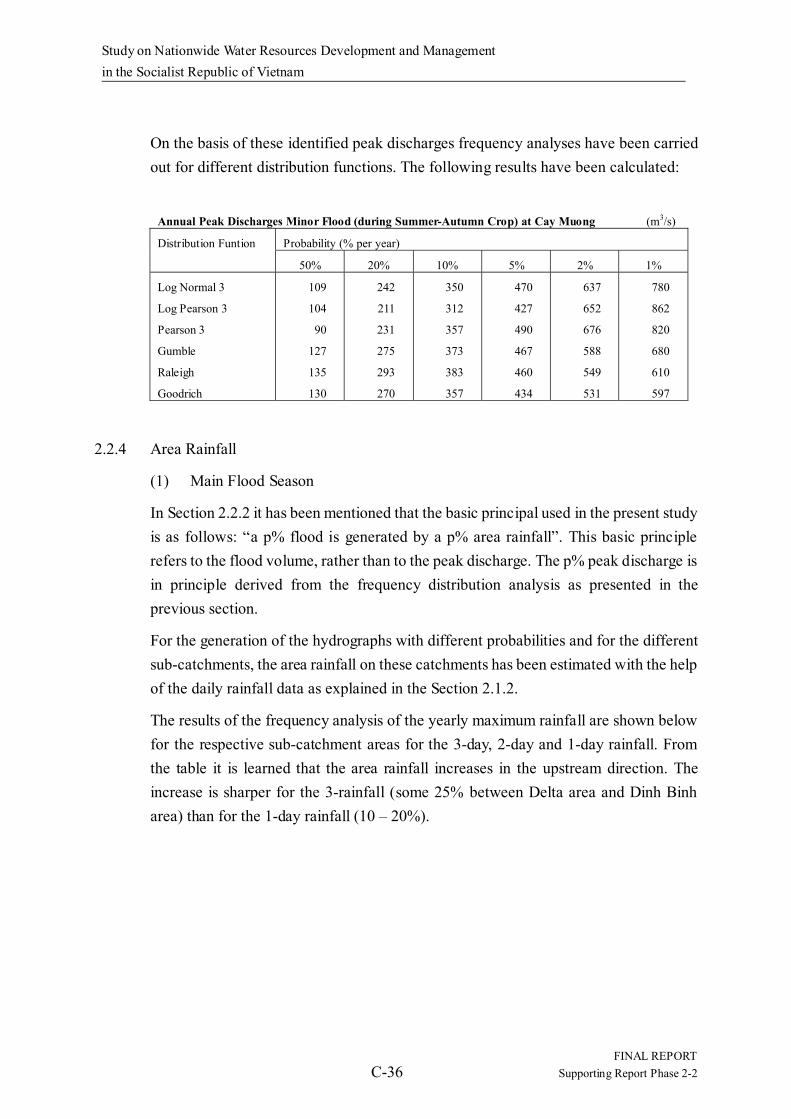
On the basis of these identified peak discharges frequency analyses have been carried out for different distribution functions. The following results have been calculated:
Annual Peak Discharges Minor Flood (during Summer-Autumn Crop) at Cay Muong (m3/s)
Probability (% per year) Distribution Funtion
50% 20% 10% 5% 2% 1%
Log Normal 3
Log Pearson 3
Pearson 3
Gumble
Raleigh
Goodrich
109
104
90
127
135
130
242
211
231
275
293
270
350
312
357
373
383
357
470
427
490
467
460
434
637
652
676
588
549
531
780
862
820
680
610
597
2.2.4 Area Rainfall
(1) Main Flood Season
In Section 2.2.2 it has been mentioned that the basic principal used in the present study is as follows: “a p% flood is generated by a p% area rainfall”. This basic principle refers to the flood volume, rather than to the peak discharge. The p% peak discharge is in principle derived from the frequency distribution analysis as presented in the previous section.
For the generation of the hydrographs with different probabilities and for the different sub-catchments, the area rainfall on these catchments has been estimated with the help of the daily rainfall data as explained in the Section 2.1.2.
The results of the frequency analysis of the yearly maximum rainfall are shown below for the respective sub-catchment areas for the 3-day, 2-day and 1-day rainfall. From the table it is learned that the area rainfall increases in the upstream direction. The increase is sharper for the 3-rainfall (some 25% between Delta area and Dinh Binh area) than for the 1-day rainfall (10 – 20%).

Study on Nationwide Water Resources Development and Management in the Socialist Republic of Vietnam
FINAL REPORT C-37 Supporting Report Phase 2-2
Maximum 3-Day Catchment Rainfall (Gumbel Distribution)
Sub-catchment Area P3da,50% P3da,20% P3da,10% P3da,5% P3da,2% P3da,1%
(km2) (mm) (mm) (mm) (mm) (mm) (mm)
Dinh Binh 1,040 349 474 557 636 739 816
The 0.5% maximum 3-day Dinh Binh catchment rainfall has been calculated at 893 mm
Cay Muong 1,677 316 424 496 565 654 721
Intermediate area 637 268 348 401 452 518 567
Binh Thanh 2,250 299 397 461 524 604 665
Nui Mot 180 280 358 410 460 524 572
La Vi 240 312 428 505 579 674 745
Ha Tanh 590 283 368 423 477 546 598
Delta 380 282 378 441 502 581 640
Maximum 2-Day Catchment Rainfall (Gumbel Distribution)
Sub-catchment Area P2da,50% P2da,20% P2da,10% P2da,5% P2da,2% P2da,1%
(km2) (mm) (mm) (mm) (mm) (mm) (mm)
Dinh Binh 1,040 289 382 444 503 580 637
The 0.5% maximum 2-day Dinh Binh catchment rainfall has been calculated at: 694 mm
Cay Muong 1,677 262 345 399 451 519 570
Intermediate area 637 229 298 343 387 443 486
Binh Thanh 2,250 249 324 374 422 483 530
Nui Mot 180 238 300 340 380 430 468
La Vi 240 274 372 437 499 580 640
Ha Tanh 590 247 313 357 399 453 493
Delta 380 244 327 382 435 503 555
Maximum 1-Day Catchment Rainfall (Gumbel Distribution)
Sub-catchment Area P1da,50% P1da,20% P1da,10% P1da,5% P1da,2% P1da,1%
(km2) (mm) (mm) (mm) (mm) (mm) (mm)
Dinh Binh 1,040 193 255 296 336 387 425
The 0.5% maximum 1-day Dinh Binh catchment rainfall has been calculated at: 463 mm
Cay Muong 1,677 176 231 267 302 348 382
Intermediate area 637 160 210 243 275 315 346
Binh Thanh 2,250 168 217 250 282 323 353
Nui Mot 180 170 224 260 295 339 373
La Vi 240 180 253 301 348 407 452
Ha Tanh 590 185 243 282 319 367 403
Delta 380 159 218 258 296 345 382

Study on Nationwide Water Resources Development and Management in the Socialist Republic of Vietnam
FINAL REPORT C-38 Supporting Report Phase 2-2
(2) Late Flood Season Area Rainfall
For the estimate of the volumes of the late floods, the probable area rainfall during the month of December has been calculated (using the Log-Normal distribution) for different durations. The results are as follows:
Maximum Kone Basin Area Rainfall during December (mm)
50% 20% 10% 5% 2% 1%
1-day rainfall
2-day rainfall
3-day rainfall
46
71
82
109
167
196
156
239
283
203
313
379
269
417
503
322
502
608
For the evaluation of future reservoir operation alternatives, the probability of the 2-day rainfall in the two last and the last decade of December has been calculated as follows:
Probable Kone Basin Area Rainfall u/s Dinh Binh during the later December decades (mm)
Period 50% 20% 10% 5% 2% 1%
December 11 – December 31
December 21 – December 31
48
25
102
52
142
69
184
86
243
107
291
123
(3) Early Flood Season Area Rainfall
The area rainfall in the early flood season has been estimated similarly for the entire basin as follows.
Maximum Kone Basin Area Rainfall during August- September (mm)
50% 20% 10% 5% 2% 1% 1-day rainfall
2-day rainfall 3-day rainfall
40
70
80
70
110
120
90 140
160
100
180
200
130
220
250
160
270
300
(4) Minor Flood Season Area Rainfall.
For the estimate of the volumes of the minor floods, the probable area rainfall during the Summer – Autumn crop period has been calculated (using the Log-Normal distribution) for different durations. The results are as follows:

Study on Nationwide Water Resources Development and Management in the Socialist Republic of Vietnam
FINAL REPORT C-39 Supporting Report Phase 2-2
Maximum Kone Basin Area Rainfall during Summer-Autumn Crop season (mm)
50% 20% 10% 5% 2% 1%
1-day rainfall
2-day rainfall
3-day rainfall
50
60
70
60
80
90
70
90
100
80
100
120
90
120
130
100
130
140
(5) Delta Area Rainfall
The previously calculated probable rainfall intensities refer to the occurrence of floods in the river system. Besides that, flooding is also anticipated as the consequence of impeded drainage, especially in the low lying and flat delta area. The probable rainfall intensities in the delta region have been estimated for the main flood season under the sub-section (1) above. However, when (river) flooding is accepted during the main flood season and flood protection aims at the rest of the year, then also the drainage system in the delta area should be able to cope with the rainfall on this area during the rest of the year.
The delta area rainfall outside of the main October-November flood season has been estimated as follows:
Maximum Delta Area Rainfall outside the Main Flood season (mm)
50% 20% 10% 5% 2% 1%
1-day rainfall
2-day rainfall
3-day rainfall
77
109
129
109
155
184
134
185
222
157
216
259
190
254
306
216
284
342
2.2.5 Hydrographs for Flood Control Studies
Following the approach as described in Section 2.2.2 and based on the analysis of the historical floods and area rainfall in the sections 2.2.3 and 2.2.4, hydrographs with different estimated probabilities have been generated for the different sub-catchments of the Kone basin. These hydrographs are principally meant for the evaluation of flood mitigation alternatives. For the design of the flood protection works, it is essential to realize that the series that are available for the estimate of probable peak discharges are rather short, and that, consequently, a safety margin is to be taken into account.
In the process of the generation of flood hydrographs, the following assumptions have been made:
1. for the estimate of peak discharges at Cay Muong, with different return periods, the average value of the best fitting distribution has been adopted for both the instantaneous maximum peak discharges. The respective estimates are as follows:

Study on Nationwide Water Resources Development and Management in the Socialist Republic of Vietnam
FINAL REPORT C-40 Supporting Report Phase 2-2
Probable Peak Discharges at Cay Muong (m3/s)
Return Period (in years) 2 5 10 20 50 100 200 Main flood
Late flood
Early flood
Minor flood
2,530
250
180
120
3,700
900
360
250
4,400
1,530
500
360
5,20
2,200
660
460
5,50
3,330
880
610
6,270
4,380
1,070
720
6,740
2. for the estimate of the probable peak discharges of non-gauged sub catchment areas, an “n” value (see equation (4) in section 2.2.2) of 0.45 has been adopted, being the average value between the regional factor for the Southern Central Region of Vietnam (0.35) and the approximate Creager value (0.55) describing the envelop of maximum peak discharges. Consequently, the probable peak discharges of the respective sub-catchments are as follows:
Probable Yearly Maximum Peak Discharges of ungauged sub-catchments (m3/s)
Return Period (in years) Area (km2) 2 5 10 20 50 100 200
Dinh Binh
Binh Thanh
Intermediate
Nui Mot
La Vi
Ha Thanh
1,040
2,250
637
180
240
590
1,950
2,970
1,490
740
870
1,420
2,850
4,350
2,170
1,080
1,270
2,080
3,380
5,170
2,580
1,290
1,510
2,480
3,860
5,900
2,950
1,470
1,720
2,830
4,420
6,760
3,380
1,690
1,970
3,240
4,820
7,370
3,680
1,840
2,150
3,530
5,180
Probable Late Flood Peak Discharges of ungauged sub-catchments (m3/s)
Return Period (in years) Area (km2) 2 5 10 20 50 100 Dinh Binh Binh Thanh Intermediate Nui Mot La Vi Ha Thanh
1,040 2,250
640 180 240 590
190 290 150 70 90
140
690 1,060
530 260 310 510
1,180 1,800
900 450 530 860
1,690 2,590 1,290
650 760
1,240
2,560 3,910 1,960
980 1,140 1,880
3,370 5,150 2,570 1,280 1,500 2,470

Study on Nationwide Water Resources Development and Management in the Socialist Republic of Vietnam
FINAL REPORT C-41 Supporting Report Phase 2-2
Probable Early (August September) Peak Discharges of ungauged sub-catchments (m3/s)
Return Period (in years) Area (km2) 2 5 10 20 50 100 Dinh Binh Binh Thanh Intermediate Nui Mot La Vi Ha Thanh
1,040 2,250
637 180 240 590
140 210 110 50 60
100
280 420 210 110 120 200
380 590 290 150 170 280
510 780 390 190 230 370
680 1,030
520 260 300 500
820 1,260
630 310 370 600
Comparison of the peak discharges and corresponding rainfall of the Minor (Summer-Autumn) floods with those of the Early floods indicate that the Summer-Autumn floods are both in peak and volume of the order of 70% of the Early floods. It is considered justified to use the 70% reduced design early floods for the evaluation of potential damages due to these floods under present and future water management and land use conditions.
3. for the estimate of the flood volumes the three day rainfall volumes have been taken as starting point for the Main Floods. For the rainfall runoff factor a value of 0.7 has been adopted, in line with the recommendation made in section 2.2.3. For the Early Flood a lower rainfall-runoff factor is considered more appropriate: a value of 0.5 has been adopted, while the one-day probable rainfall has been assumed to produce the runoff volume of the corresponding probable flood. For the Late Floods a rainfall runoff factor of 0.6 has been adopted, assuming that the catchment is still partly saturated after the main floods. For the Late Flood volumes the 2-day probable rainfall has been adopted as starting point, after comparing the calculated probable peak discharges with the historical late floods and corresponding rainfall data.
4. the time to peak of the Cay Muong synthetic hydrograph is assumed to be of the order of 15 – 20 hours. The times to peak of hydrographs generated in other sub-catchments are assumed to be in the ratio of the length of the respective catchments. The actual time to peak has been adjusted in the process of “calibration” of the synthetic hydrographs.
This estimate of time-to-peak (in hours) is in line with the result of the Kirpich formula that says:
385..0
77.0
00013.0SLtc =
With L is the length of the basin in feet along the watercourse from the gauging station to the upstream
limit of the basin, and S the average river slope upstream of the station.

Study on Nationwide Water Resources Development and Management in the Socialist Republic of Vietnam
FINAL REPORT C-42 Supporting Report Phase 2-2
Applying this formula for the different locations along the Kone river gives the following results
tc-Dinh Binh: 10 hours
tc-Cay Muong: 15.3 hours
tc-Binh Thanh: 18.5 hours
5. The base flow during the passage of the flood hydrograph is assumed to be the 10% wet season discharge ( = discharge that on the average is exceeded in 1 out of ten years) during the respective early, main and late flood seasons.
Based on the above starting points and applying the methodology presented in the Section 2.2.2, the probable flood hydrographs have been generated for several types of flood and several probabilities Detailed results are presented in Appendix 3. Several probable main, early and late floods are presented in the Figures C.5 to C.12.
Validation of the synthetic hydrographs has been carried out by comparison the generated hydrograph of a catchment area with of the sum of generated hydrographs of the composing sub-catchments. An example of the result is shown in Figure C.13.
2.2.6 Flood Hydrographs for Design Purposes
(1) Evaluation of previous results
In this section the results of the present flood analysis are compared with the results of previous studies. The purpose of this comparison is to facilitate the selection of the appropriate approach for the development of flood protection measures in the Kone basin.
Earlier studies have, among others, been carried out by IWRP (1997) for the Water Use Planning in the basin, and by HEC-1 (2000) in the framework of the feasibility study of the Dinh Binh Reservoir.
The results of these studies can be summarized as follows (only flood events with an estimated return period shorter than 100 years is considered here, because the impact of events with lower frequency on the economics of flood control is considered marginal)

Study on Nationwide Water Resources Development and Management in the Socialist Republic of Vietnam
FINAL REPORT C-43 Supporting Report Phase 2-2
Peak Discharges at Cay Muong Estimated from Frequency analysis
Return Period
10 years 100 years 200years
IWRP (series 1976 – 1996, distribution function Pearson-3)
HEC-1 (series 1976 – 1998, distribution function Pearson-3)
JICA (series 1976 – 2001, several distribution functions)
4,917 m3/s
4,860 m3/s
4,400 m3/s
7,778 m3/s
7,860 m3/s
6,270 m3/s
8,720 m3/s
6,740 m3/s
Observation: The IWRP and HEC-1 results are quite similar, certainly when the different length of the observation period is taken into account. The present analysis, however, produces much lower values. It is anticipated that the values calculated by both IWRP and HEC-1 include a “confidence margin”. Such margin is relevant in a risk (safety) analysis. In the present planning study, however, is such margin not appropriate, as it creates a biased picture of the economic feasibility of the flood protection measures. It is recommended to use in this phase the results of the present analysis, certainly because most of the examined distribution functions give a picture that is consistent with these results.
Estimated Peak Discharges at Dinh Binh
Return Period
10 years 100 years 200 years
IWRP (Flow Cutting Module)
HEC-1 (Integrated Water Concentration Model)
JICA (Flow Cutting – Creager))
3,604 m3/s
3,380 m3/s
5,702 m3/s
7,300 m3/s
4,820 m3/s
8,080 m3/s
5,180 m3/s
Observation: The transpose function used by IWRP to convert Cay Muong discharges into Dinh Binh discharges gives a more pronounced difference between these two stations, than a Creager approach does. The more conservative Creager approach is included in the present JICA analysis.
The approach followed by HEC-1 seems to aim at safety, rather than at the accuracy of the estimated peak flows.

Study on Nationwide Water Resources Development and Management in the Socialist Republic of Vietnam
FINAL REPORT C-44 Supporting Report Phase 2-2
Estimated Flood Volume at Dinh Binh
Return Period
10 years 100 years
IWRP (3-day)
HEC-1
JICA (3-day)
278 Mm3
405 Mm3
386 Mm3
614 Mm3
590 Mm3/s
Observation: It seems that the IWRP results are an underestimate, taking into account the area rainfall volumes on the sub-basin upstream of Dinh Binh. The 100-years three-day area rainfall has been calculated at 816 mm. The volume estimated by IWRP corresponds with only 45% of the rainfall volume. Historical data, however point at runoff coefficients of 0.65 on the average.
(2) Design Peak Discharges
It has been mentioned above that the estimates of the probable peak discharges by IWRP and HEC-1 include a safety margin. Such safety margin is considered essential when the estimated probable peak discharges are to be used for the design of the hydraulic works. In a probabilistic design approach, the risk should be estimated that the actual probable peak discharges are higher then the calculated values. Such risk depends, among other factors, on the length of the series that is used in the probability analysis and tends to increase when the series are shorter.
In case the designs are made on the basis of a deterministic approach, then it is important to make an estimate of the “possible underestimate” of the calculated probable peak discharges. For this estimate, use can be made of the confidence margins that are calculated together with the estimate of probable peak discharges for different probability distribution functions. In that case, it is to be decided which level of confidence is aimed at.
In the approach that is followed by IWRP for the estimate of the possible “underestimate”, the following formula is applied:
=∆
∧∧
n
QaEQ p
pp
in which “a” is a factor ranging between 0.7 and 1.5, depending on the length of the series,
( )pCfE vp ,=

Study on Nationwide Water Resources Development and Management in the Socialist Republic of Vietnam
FINAL REPORT C-45 Supporting Report Phase 2-2
in which “Cv” refers to the Coefficient of Variation of the series and “p” to the probability.
For the 1976 – 2001 series of the yearly instantaneous peak discharges in Cay Muong, this formula leads to safety factors of 1.13 and 1.21 for the 10% and 1% probable peak discharges respectively.
This result corresponds with the upper limit of the 80% confidence interval when the Pearson-3 probability function is assumed.
Under application of these safety factors, for all types of floods, the design peak discharges have been assessed as follows (for the 5% probable peak a safety factor of 1.16 has been applied):
Design Discharges at Cay Muong (m3/s)
Return Period Type of Flood
10 years 20 years 100 years 200 years
Main Flood
Late Flood
Early Flood
Minor Flood
4,970
1,730
570
410
5,820
2,550
770
540
7,590
5,300
1,300
870
8,320
(3) Design Hydrographs
Hydraulic structures for water resources management and flood control are envisaged at Dinh Binh (dam site), Van Phong (weir and irrigation water intake) and in the flood prone river delta. For the design of these structures the respective probable peak discharges and hydrographs need to be estimated. The design hydrographs have been prepared for the 10%, 5% 1% and 0.5% estimated design peak discharges, in accordance with the methodology as presented under section 2.2.5. (the 0.5% hydrograph has been prepared for the Dinh Binh dam only). The design hydrographs are summarized below.
For the design of the Dinh Binh dam, also design hydrographs with lower probabilities are to be considered. These exceptional floods are described in the following paragraph.
For the design of the flood control works the following flood characteristics have been assessed.

Study on Nationwide Water Resources Development and Management in the Socialist Republic of Vietnam
FINAL REPORT C-46 Supporting Report Phase 2-2
Design characteristics Main Floods
Probability 10% 5% 1%
Parameter Q (m3/s) Vol (Mm3) Q (m3/s) Vol (Mm3) Q (m3/s) Vol (Mm3)
Station Area (km2)
Dinh Binh 1,040 3,821 405 4,475 463 5,836 594
Cay Muong 1,677 4,970 583 5,820 665 7,590 847
Binh Thanh 2,250 5,842 726 6,841 825 8,922 1,047
Nui Mot 180 1,456 52 1,705 58 2,224 72
La Vi 240 1,706 85 1,998 98 2,605 125
Ha Thanh 590 2,798 175 3,276 197 4,273 248
Design characteristics 0.5% Main Flood at Dinh Binh
Probability 0.5%
Parameter Q (m3/s) Vol (Mm3)
Station Area (km2)
Dinh Binh 1040 6397 650
Design characteristics Late Floods
Probability 10% 5% 1%
Parameter Q (m3/s) Vol (Mm3) Q (m3/s) Vol (Mm3) Q (m3/s) Vol (Mm3)
Station Area (km2)
Dinh Binh 1,040 1,330 149 1,961 196 4,075 313
Cay Muong 1,677 1,730 240 2,550 315 5,300 505
Binh Thanh 2,250 2,034 323 2,997 423 6,230 677
Nui Mot 180 507 26 747 34 1,553 54
La Vi 240 594 34 875 45 1,819 72
Ha Tanh 590 974 85 1,436 111 2,984 178
(4) Probable Maximum Flood
In addition to the Design Hydrographs for the hydraulic works, an estimate has been made of the Maximum Probable Flood at the Dinh Binh dam site. In the absence of detailed meteorological and streamflow information in the Dinh Binh catchment area, a simplified approach has been followed to estimate the Probable Maximum Precipitation on this catchment. In this approach the PMP is calculated with the help of the formula (Hershfield):

Study on Nationwide Water Resources Development and Management in the Socialist Republic of Vietnam
FINAL REPORT C-47 Supporting Report Phase 2-2
PKSPPMP +=
in which P refers to the mean annual maximum rainfall and SP corresponds with the standard deviation of the series of annual maximum rainfall. The factor K depends on rainfall duration and the mean of annual series and can be estimated for the 1-day rainfall with the help of the following relation:
PK 000965.01019 −⋅=
The area rainfall of the Dinh Binh area has been calculated with the help of the 1977 – 2001 series of daily rainfall data of the stations Ba To, Gia Vuc and Vinh Kim following the Thiessen method. The following characteristics of the area rainfall series have been assessed:
Basic Statistics of Annual Maximum Dinh Binh Area Rainfall series (mm)
Series Maximum Mean Annual Maximum ( P )
Standard Deviation Annual Maximum (SP)
1-day rainfall
2-days rainfall
3-days rainfall
406
626
732
204
307
372
70.5
105
141
Applying the above formula for the PMP and assuming a Gumble distribution of the annual maximum values, the following probable extreme rainfall has been estimated. For the 2- and 3-day PMP it has been assumed that they are proportionately similar as the 10.000 years rainfall is:
Probable Extreme Dinh Binh Area Rainfall (mm)
r.p.=10.000 years (Gumble) PMP
1-day rainfall
2-days rainfall
3-days rainfall
679
1,016
1,324
1,055
1,575
2,050
For the estimate of the corresponding Probable Maximum Flood, it has been assumed that the frequency distribution of the extreme peak discharges is similar to the frequency distribution of the extreme rainfall events. As a consequence, it has been assumed that the probability of the PMF is similar to the probability of the PMP.
After transposing the calculated probable peak discharges (according to Gumble) from
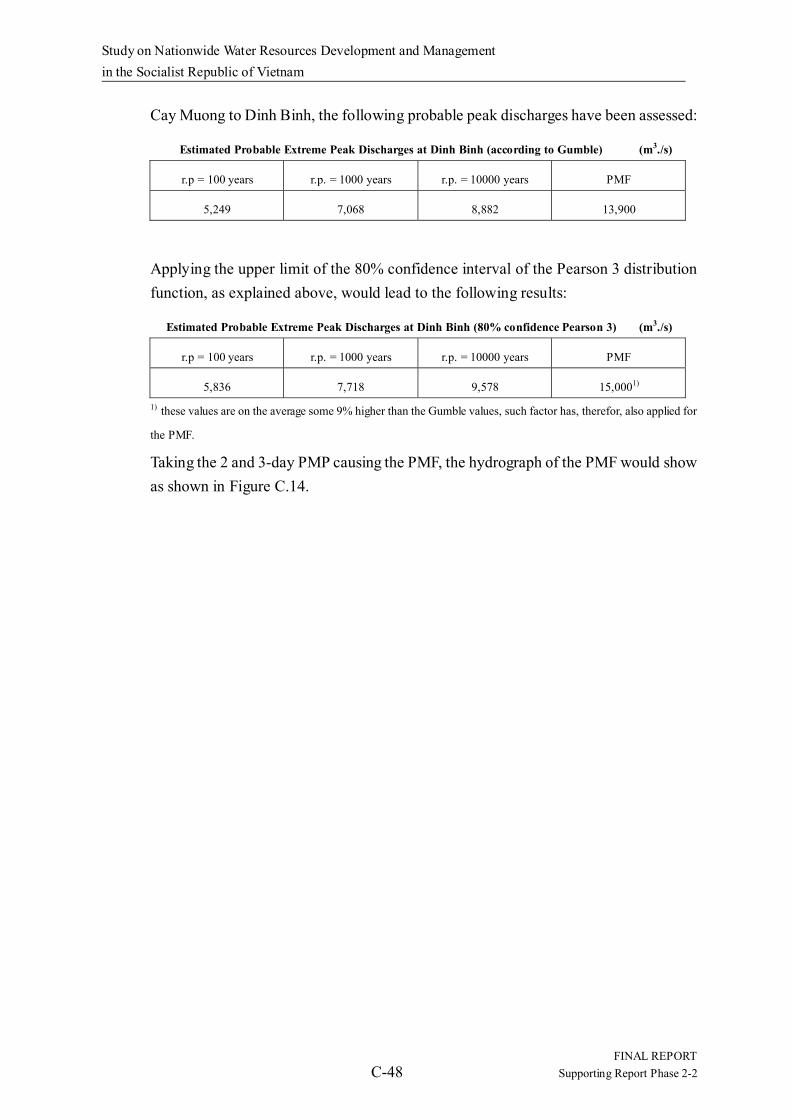
Study on Nationwide Water Resources Development and Management in the Socialist Republic of Vietnam
FINAL REPORT C-48 Supporting Report Phase 2-2
Cay Muong to Dinh Binh, the following probable peak discharges have been assessed:
Estimated Probable Extreme Peak Discharges at Dinh Binh (according to Gumble) (m3./s)
r.p = 100 years r.p. = 1000 years r.p. = 10000 years PMF
5,249 7,068 8,882 13,900
Applying the upper limit of the 80% confidence interval of the Pearson 3 distribution function, as explained above, would lead to the following results:
Estimated Probable Extreme Peak Discharges at Dinh Binh (80% confidence Pearson 3) (m3./s)
r.p = 100 years r.p. = 1000 years r.p. = 10000 years PMF
5,836 7,718 9,578 15,0001) 1) these values are on the average some 9% higher than the Gumble values, such factor has, therefor, also applied for
the PMF.
Taking the 2 and 3-day PMP causing the PMF, the hydrograph of the PMF would show as shown in Figure C.14.
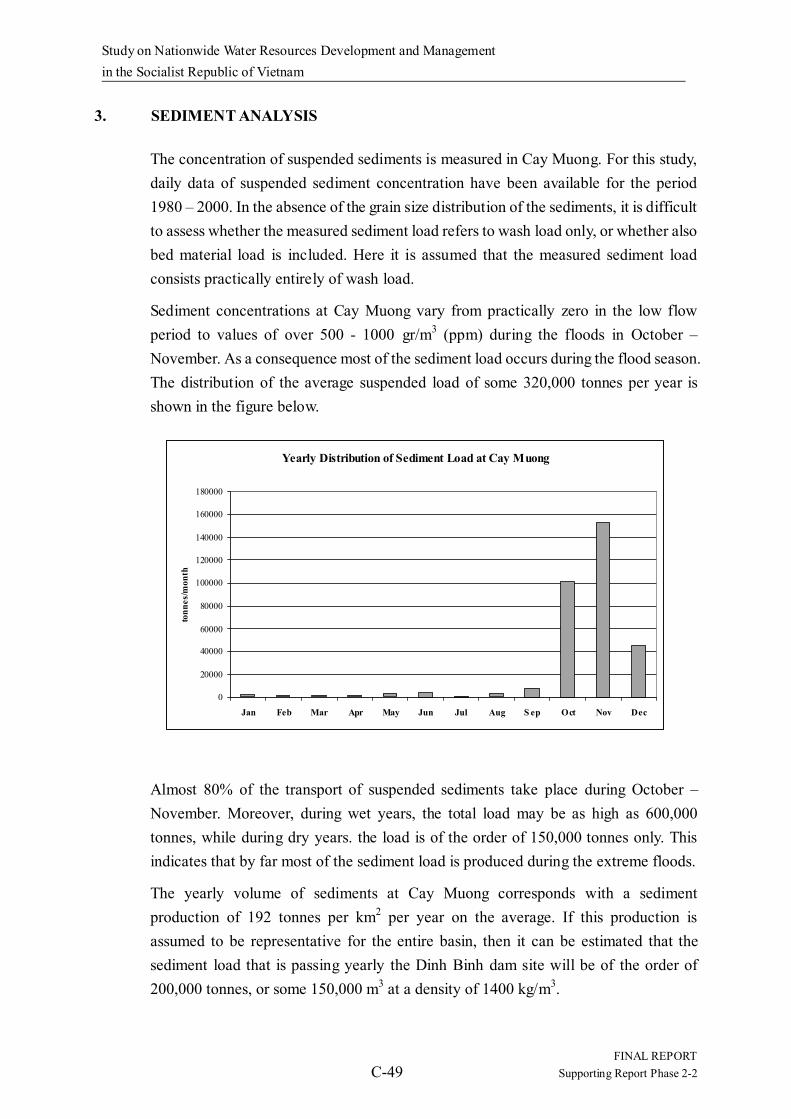
Study on Nationwide Water Resources Development and Management in the Socialist Republic of Vietnam
FINAL REPORT C-49 Supporting Report Phase 2-2
3. SEDIMENT ANALYSIS
The concentration of suspended sediments is measured in Cay Muong. For this study, daily data of suspended sediment concentration have been available for the period 1980 – 2000. In the absence of the grain size distribution of the sediments, it is difficult to assess whether the measured sediment load refers to wash load only, or whether also bed material load is included. Here it is assumed that the measured sediment load consists practically entirely of wash load.
Sediment concentrations at Cay Muong vary from practically zero in the low flow period to values of over 500 - 1000 gr/m3 (ppm) during the floods in October – November. As a consequence most of the sediment load occurs during the flood season. The distribution of the average suspended load of some 320,000 tonnes per year is shown in the figure below.
Almost 80% of the transport of suspended sediments take place during October – November. Moreover, during wet years, the total load may be as high as 600,000 tonnes, while during dry years. the load is of the order of 150,000 tonnes only. This indicates that by far most of the sediment load is produced during the extreme floods.
The yearly volume of sediments at Cay Muong corresponds with a sediment production of 192 tonnes per km2 per year on the average. If this production is assumed to be representative for the entire basin, then it can be estimated that the sediment load that is passing yearly the Dinh Binh dam site will be of the order of 200,000 tonnes, or some 150,000 m3 at a density of 1400 kg/m3.
Yearly Distribution of Sediment Load at Cay Muong
0
20000
40000
60000
80000
100000
120000
140000
160000
180000
Jan Feb Mar Apr May Jun Jul Aug S ep Oct Nov Dec
tonn
es/m
onth

Study on Nationwide Water Resources Development and Management in the Socialist Republic of Vietnam
FINAL REPORT C-50 Supporting Report Phase 2-2
It is anticipated that the trap efficiency of a future Dinh Binh reservoir will be relatively low. Most of the floodwaters that enter the reservoir in October – November will be discharged almost immediately, without allowing the wash load to settle. The volume of suspended load that enters the reservoir in December and the subsequent months (about 20% of the yearly volume on the average) could most likely settle in the reservoir.
It is assumed that in addition to the suspended sediments there will be some bed load with a volume corresponding with some 10% of the suspended load. Assuming that all these sediments will be trapped in the reservoir, then it is roughly estimated that on a yearly basis sedimentation could take place in the reservoir in the order of maximum 100,000 m3 on the average.
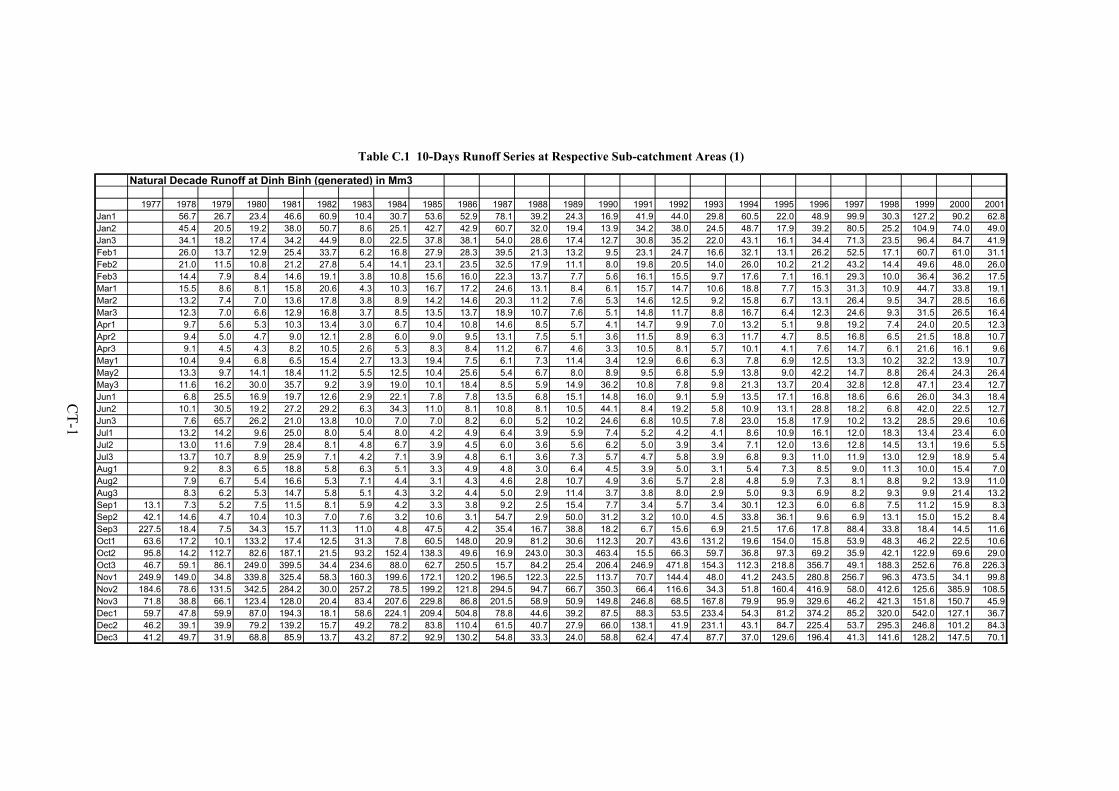
Table C.1 10-Days Runoff Series at Respective Sub-catchment Areas (1)
Natural Decade Runoff at Dinh Binh (generated) in Mm3
1977 1978 1979 1980 1981 1982 1983 1984 1985 1986 1987 1988 1989 1990 1991 1992 1993 1994 1995 1996 1997 1998 1999 2000 2001Jan1 56.7 26.7 23.4 46.6 60.9 10.4 30.7 53.6 52.9 78.1 39.2 24.3 16.9 41.9 44.0 29.8 60.5 22.0 48.9 99.9 30.3 127.2 90.2 62.8Jan2 45.4 20.5 19.2 38.0 50.7 8.6 25.1 42.7 42.9 60.7 32.0 19.4 13.9 34.2 38.0 24.5 48.7 17.9 39.2 80.5 25.2 104.9 74.0 49.0Jan3 34.1 18.2 17.4 34.2 44.9 8.0 22.5 37.8 38.1 54.0 28.6 17.4 12.7 30.8 35.2 22.0 43.1 16.1 34.4 71.3 23.5 96.4 84.7 41.9Feb1 26.0 13.7 12.9 25.4 33.7 6.2 16.8 27.9 28.3 39.5 21.3 13.2 9.5 23.1 24.7 16.6 32.1 13.1 26.2 52.5 17.1 60.7 61.0 31.1Feb2 21.0 11.5 10.8 21.2 27.8 5.4 14.1 23.1 23.5 32.5 17.9 11.1 8.0 19.8 20.5 14.0 26.0 10.2 21.2 43.2 14.4 49.6 48.0 26.0Feb3 14.4 7.9 8.4 14.6 19.1 3.8 10.8 15.6 16.0 22.3 13.7 7.7 5.6 16.1 15.5 9.7 17.6 7.1 16.1 29.3 10.0 36.4 36.2 17.5Mar1 15.5 8.6 8.1 15.8 20.6 4.3 10.3 16.7 17.2 24.6 13.1 8.4 6.1 15.7 14.7 10.6 18.8 7.7 15.3 31.3 10.9 44.7 33.8 19.1Mar2 13.2 7.4 7.0 13.6 17.8 3.8 8.9 14.2 14.6 20.3 11.2 7.6 5.3 14.6 12.5 9.2 15.8 6.7 13.1 26.4 9.5 34.7 28.5 16.6Mar3 12.3 7.0 6.6 12.9 16.8 3.7 8.5 13.5 13.7 18.9 10.7 7.6 5.1 14.8 11.7 8.8 16.7 6.4 12.3 24.6 9.3 31.5 26.5 16.4Apr1 9.7 5.6 5.3 10.3 13.4 3.0 6.7 10.4 10.8 14.6 8.5 5.7 4.1 14.7 9.9 7.0 13.2 5.1 9.8 19.2 7.4 24.0 20.5 12.3Apr2 9.4 5.0 4.7 9.0 12.1 2.8 6.0 9.0 9.5 13.1 7.5 5.1 3.6 11.5 8.9 6.3 11.7 4.7 8.5 16.8 6.5 21.5 18.8 10.7Apr3 9.1 4.5 4.3 8.2 10.5 2.6 5.3 8.3 8.4 11.2 6.7 4.6 3.3 10.5 8.1 5.7 10.1 4.1 7.6 14.7 6.1 21.6 16.1 9.6May1 10.4 9.4 6.8 6.5 15.4 2.7 13.3 19.4 7.5 6.1 7.3 11.4 3.4 12.9 6.6 6.3 7.8 6.9 12.5 13.3 10.2 32.2 13.9 10.7May2 13.3 9.7 14.1 18.4 11.2 5.5 12.5 10.4 25.6 5.4 6.7 8.0 8.9 9.5 6.8 5.9 13.8 9.0 42.2 14.7 8.8 26.4 24.3 26.4May3 11.6 16.2 30.0 35.7 9.2 3.9 19.0 10.1 18.4 8.5 5.9 14.9 36.2 10.8 7.8 9.8 21.3 13.7 20.4 32.8 12.8 47.1 23.4 12.7Jun1 6.8 25.5 16.9 19.7 12.6 2.9 22.1 7.8 7.8 13.5 6.8 15.1 14.8 16.0 9.1 5.9 13.5 17.1 16.8 18.6 6.6 26.0 34.3 18.4Jun2 10.1 30.5 19.2 27.2 29.2 6.3 34.3 11.0 8.1 10.8 8.1 10.5 44.1 8.4 19.2 5.8 10.9 13.1 28.8 18.2 6.8 42.0 22.5 12.7Jun3 7.6 65.7 26.2 21.0 13.8 10.0 7.0 7.0 8.2 6.0 5.2 10.2 24.6 6.8 10.5 7.8 23.0 15.8 17.9 10.2 13.2 28.5 29.6 10.6Jul1 13.2 14.2 9.6 25.0 8.0 5.4 8.0 4.2 4.9 6.4 3.9 5.9 7.4 5.2 4.2 4.1 8.6 10.9 16.1 12.0 18.3 13.4 23.4 6.0Jul2 13.0 11.6 7.9 28.4 8.1 4.8 6.7 3.9 4.5 6.0 3.6 5.6 6.2 5.0 3.9 3.4 7.1 12.0 13.6 12.8 14.5 13.1 19.6 5.5Jul3 13.7 10.7 8.9 25.9 7.1 4.2 7.1 3.9 4.8 6.1 3.6 7.3 5.7 4.7 5.8 3.9 6.8 9.3 11.0 11.9 13.0 12.9 18.9 5.4Aug1 9.2 8.3 6.5 18.8 5.8 6.3 5.1 3.3 4.9 4.8 3.0 6.4 4.5 3.9 5.0 3.1 5.4 7.3 8.5 9.0 11.3 10.0 15.4 7.0Aug2 7.9 6.7 5.4 16.6 5.3 7.1 4.4 3.1 4.3 4.6 2.8 10.7 4.9 3.6 5.7 2.8 4.8 5.9 7.3 8.1 8.8 9.2 13.9 11.0Aug3 8.3 6.2 5.3 14.7 5.8 5.1 4.3 3.2 4.4 5.0 2.9 11.4 3.7 3.8 8.0 2.9 5.0 9.3 6.9 8.2 9.3 9.9 21.4 13.2Sep1 13.1 7.3 5.2 7.5 11.5 8.1 5.9 4.2 3.3 3.8 9.2 2.5 15.4 7.7 3.4 5.7 3.4 30.1 12.3 6.0 6.8 7.5 11.2 15.9 8.3Sep2 42.1 14.6 4.7 10.4 10.3 7.0 7.6 3.2 10.6 3.1 54.7 2.9 50.0 31.2 3.2 10.0 4.5 33.8 36.1 9.6 6.9 13.1 15.0 15.2 8.4Sep3 227.5 18.4 7.5 34.3 15.7 11.3 11.0 4.8 47.5 4.2 35.4 16.7 38.8 18.2 6.7 15.6 6.9 21.5 17.6 17.8 88.4 33.8 18.4 14.5 11.6Oct1 63.6 17.2 10.1 133.2 17.4 12.5 31.3 7.8 60.5 148.0 20.9 81.2 30.6 112.3 20.7 43.6 131.2 19.6 154.0 15.8 53.9 48.3 46.2 22.5 10.6Oct2 95.8 14.2 112.7 82.6 187.1 21.5 93.2 152.4 138.3 49.6 16.9 243.0 30.3 463.4 15.5 66.3 59.7 36.8 97.3 69.2 35.9 42.1 122.9 69.6 29.0Oct3 46.7 59.1 86.1 249.0 399.5 34.4 234.6 88.0 62.7 250.5 15.7 84.2 25.4 206.4 246.9 471.8 154.3 112.3 218.8 356.7 49.1 188.3 252.6 76.8 226.3Nov1 249.9 149.0 34.8 339.8 325.4 58.3 160.3 199.6 172.1 120.2 196.5 122.3 22.5 113.7 70.7 144.4 48.0 41.2 243.5 280.8 256.7 96.3 473.5 34.1 99.8Nov2 184.6 78.6 131.5 342.5 284.2 30.0 257.2 78.5 199.2 121.8 294.5 94.7 66.7 350.3 66.4 116.6 34.3 51.8 160.4 416.9 58.0 412.6 125.6 385.9 108.5Nov3 71.8 38.8 66.1 123.4 128.0 20.4 83.4 207.6 229.8 86.8 201.5 58.9 50.9 149.8 246.8 68.5 167.8 79.9 95.9 329.6 46.2 421.3 151.8 150.7 45.9Dec1 59.7 47.8 59.9 87.0 194.3 18.1 58.6 224.1 209.4 504.8 78.8 44.6 39.2 87.5 88.3 53.5 233.4 54.3 81.2 374.2 85.2 320.0 542.0 127.1 36.7Dec2 46.2 39.1 39.9 79.2 139.2 15.7 49.2 78.2 83.8 110.4 61.5 40.7 27.9 66.0 138.1 41.9 231.1 43.1 84.7 225.4 53.7 295.3 246.8 101.2 84.3Dec3 41.2 49.7 31.9 68.8 85.9 13.7 43.2 87.2 92.9 130.2 54.8 33.3 24.0 58.8 62.4 47.4 87.7 37.0 129.6 196.4 41.3 141.6 128.2 147.5 70.1
CT-1

Table C.1 10-Days Runoff Series at Respective Sub-catchment Areas (2)
Observed Decade Runoff at Cay Muong (observed) in Mm3
1976 1977 1978 1979 1980 1981 1982 1983 1984 1985 1986 1987 1988 1989 1990 1991 1992 1993 1994 1995 1996 1997 1998 1999 2000 2001Jan1 28.7 35.2 43.2 38.6 31.2 45.6 66.0 8.6 49.5 59.8 48.4 61.3 37.8 54.3 20.1 40.0 36.5 34.7 69.6 40.8 82.8 89.6 21.6 109.8 76.9 86.5Jan2 26.4 30.0 28.1 30.2 26.7 35.8 55.8 10.3 38.2 44.5 41.2 42.5 37.9 37.4 18.2 32.1 36.1 28.6 44.3 29.9 55.3 63.0 19.7 96.4 54.4 59.0Jan3 36.1 26.9 20.8 25.2 24.4 34.6 51.6 12.7 37.9 41.5 39.0 38.8 31.8 35.5 18.9 28.5 38.0 26.2 36.6 25.5 43.3 48.9 21.5 114.7 103.3 44.4Feb1 27.8 22.3 17.5 18.9 20.2 28.6 42.4 6.9 33.6 35.9 31.6 29.6 20.6 26.3 13.9 23.8 23.3 19.0 28.1 38.1 50.8 37.1 16.9 59.4 68.0 32.6Feb2 24.0 22.3 13.6 15.9 21.0 22.1 36.4 5.7 28.5 26.1 28.9 22.5 18.4 19.9 11.1 19.7 18.2 15.5 22.4 21.9 33.6 33.3 10.8 50.0 48.3 33.5Feb3 18.8 18.0 10.7 10.6 17.3 14.1 25.8 4.2 20.4 16.7 22.0 13.2 21.8 13.7 8.0 24.9 15.4 9.6 14.7 13.6 25.6 24.5 8.2 40.7 35.8 21.5Mar1 17.5 24.2 13.4 11.6 18.4 14.5 28.7 4.6 20.0 17.8 24.6 26.5 17.0 15.9 8.6 18.8 14.6 11.8 17.1 18.0 24.9 25.7 8.6 53.5 31.9 25.1Mar2 15.1 17.0 14.7 11.5 13.1 11.7 24.9 4.3 16.3 15.2 20.1 15.8 15.7 19.4 7.9 20.6 12.5 11.1 13.9 14.9 21.9 22.8 7.2 36.5 29.6 25.5Mar3 15.2 16.2 11.7 10.1 11.9 10.4 26.4 4.1 14.8 16.3 18.1 14.7 12.0 26.0 8.7 17.8 12.5 11.9 24.3 14.6 21.1 23.1 9.7 33.8 24.2 32.5Apr1 12.2 10.9 9.1 9.8 9.6 8.3 26.5 3.3 13.3 13.5 13.6 11.1 8.9 14.6 8.7 24.7 12.5 7.5 14.4 12.8 18.7 19.3 10.8 29.6 21.6 20.7Apr2 13.3 9.5 12.2 7.9 12.2 11.8 25.4 2.4 13.2 13.1 11.9 11.7 11.1 13.9 6.3 15.4 9.6 8.3 13.0 10.5 18.6 24.6 10.5 24.0 35.6 17.8Apr3 10.1 7.5 11.7 8.8 12.2 12.2 25.6 1.6 20.7 13.2 10.3 8.6 10.2 11.0 6.0 14.6 8.5 8.7 10.5 10.4 16.2 18.1 12.5 37.3 21.9 17.5May1 15.1 6.4 15.0 11.0 9.8 8.8 22.3 3.6 18.9 26.5 10.4 8.1 10.4 19.3 4.9 15.3 8.7 9.0 10.0 9.8 17.0 18.4 14.1 41.0 19.2 14.5May2 15.3 5.1 18.2 10.3 21.0 18.2 16.3 7.9 17.6 14.6 35.3 7.1 9.5 12.8 13.1 11.2 8.9 8.4 17.9 12.8 61.3 20.9 11.5 33.0 34.9 36.0May3 16.7 8.9 14.8 15.0 44.0 32.4 13.4 5.4 28.8 14.2 28.0 11.4 8.3 24.1 56.1 12.6 10.3 14.3 25.1 17.7 29.0 44.0 14.9 62.0 33.3 17.1Jun1 9.3 4.5 9.0 26.6 23.8 18.6 18.5 3.9 35.0 10.9 11.4 17.4 9.4 25.2 21.0 19.1 12.1 8.5 14.8 21.9 22.2 25.0 7.8 37.4 49.8 22.4Jun2 12.6 5.6 13.6 28.0 29.3 37.2 39.3 7.9 64.5 15.7 11.8 13.0 11.8 17.7 84.1 10.2 25.6 8.3 12.0 14.2 39.8 24.6 8.1 63.8 30.0 15.5Jun3 17.3 3.7 10.2 60.4 43.4 31.4 18.1 11.8 13.1 10.0 12.0 7.3 7.0 18.2 51.6 8.3 13.6 11.4 27.0 17.4 23.8 13.8 15.8 41.0 35.8 13.1Jul1 8.2 4.0 21.2 20.7 28.2 14.4 14.2 6.7 15.7 8.4 8.5 5.8 11.9 31.6 24.4 13.8 7.9 7.7 15.5 21.1 20.4 10.4 17.3 50.4 36.9 9.6Jul2 19.7 7.9 15.9 12.5 16.3 34.4 14.5 8.1 11.5 10.8 8.9 6.0 20.8 27.6 19.8 16.7 7.6 8.7 10.4 21.4 24.4 21.5 8.6 33.9 23.9 10.0Jul3 22.3 4.3 17.9 10.6 21.0 18.5 13.1 8.1 12.6 7.9 10.7 6.5 14.3 39.7 21.6 10.7 14.4 9.3 12.2 17.9 19.2 16.0 7.6 28.4 31.6 10.6Aug1 9.6 5.7 8.6 9.7 23.1 18.4 8.6 39.6 8.0 6.5 17.9 5.8 7.1 21.0 16.3 12.5 9.4 5.9 10.7 14.2 13.4 10.9 15.1 20.8 26.4 18.3Aug2 10.5 5.5 7.8 7.4 31.4 12.7 7.7 51.5 7.1 4.3 19.1 6.8 5.6 30.6 31.3 8.0 15.9 4.1 11.3 14.3 12.5 8.6 8.9 21.3 25.3 20.7Aug3 26.3 12.9 13.6 6.8 59.2 8.4 13.8 18.3 7.8 4.6 21.0 12.4 6.8 36.9 12.9 9.0 23.9 6.6 19.6 31.2 11.9 8.7 18.4 25.2 89.0 22.1Sep1 23.3 14.6 20.5 9.0 59.7 6.9 26.2 23.1 11.8 5.0 16.2 10.0 5.5 39.0 21.3 8.2 10.8 10.1 46.9 28.4 13.8 7.1 16.1 22.2 28.1 11.3Sep2 28.2 39.2 61.1 6.9 85.1 7.6 15.5 18.5 6.5 12.2 10.9 35.2 8.9 141.2 19.7 11.4 15.5 15.0 82.6 66.4 29.2 7.7 21.7 24.6 29.3 13.4Sep3 52.4 200.0 47.8 30.5 93.6 20.6 20.9 27.8 9.3 30.5 10.6 25.5 41.0 73.4 12.9 33.5 24.7 19.9 35.0 36.9 48.3 54.8 44.2 28.2 32.7 20.6Oct1 50.2 45.0 34.5 18.9 252.1 25.7 20.1 91.8 14.3 68.7 121.2 15.2 116.7 53.1 118.6 56.7 34.8 200.8 33.9 180.8 28.5 29.2 61.8 33.7 70.4 15.4Oct2 171.1 72.3 23.2 186.0 138.4 297.2 20.4 147.2 215.0 163.2 36.3 9.8 411.6 58.2 605.1 28.1 70.5 41.1 79.7 127.3 61.2 22.1 60.4 175.7 191.3 29.4Oct3 73.9 34.3 90.5 130.4 420.8 712.9 27.5 336.7 97.6 39.7 237.3 9.3 160.3 38.0 225.6 346.3 895.1 151.5 219.6 336.2 291.9 37.4 378.3 357.9 130.2 275.6Nov1 79.1 413.9 267.1 35.6 540.4 657.2 37.7 358.6 464.5 115.4 125.6 124.8 249.4 33.4 111.9 84.1 210.5 50.5 55.5 396.8 452.2 285.1 120.5 729.4 69.4 60.7Nov2 284.2 365.9 107.3 274.3 693.8 488.6 21.6 287.1 158.7 155.6 59.6 548.6 124.7 68.7 502.9 58.1 150.2 27.5 36.3 238.7 624.6 53.6 611.4 178.2 488.1 166.2Nov3 104.6 73.1 54.2 129.1 182.0 164.5 19.5 126.0 279.8 366.0 63.2 308.4 84.7 61.6 152.0 93.0 81.7 307.0 61.6 121.4 520.0 35.6 803.9 152.9 257.5 45.7Dec1 59.7 46.0 77.1 86.7 94.0 309.9 16.4 69.9 275.3 264.0 577.6 96.8 61.7 47.3 90.1 58.3 56.9 283.0 63.8 93.5 574.4 56.5 345.3 905.5 172.5 28.4Dec2 41.6 30.5 60.5 56.4 74.6 197.9 15.4 71.1 113.1 92.0 118.6 59.7 57.7 33.6 62.9 112.4 41.1 311.0 58.9 91.1 249.3 39.8 490.3 368.4 139.3 84.0Dec3 39.2 24.5 65.8 41.2 68.5 113.4 12.1 64.4 136.8 93.0 93.7 49.2 48.5 28.2 52.1 56.4 50.7 142.3 72.5 196.4 233.0 32.5 129.2 167.4 175.7 77.5
CT-2

Table C.1 10-Days Runoff Series at Respective Sub-catchment Areas (3)
Natural Decade Runoff at Binh Thanh (generated) in Mm3
1977 1978 1979 1980 1981 1982 1983 1984 1985 1986 1987 1988 1989 1990 1991 1992 1993 1994 1995 1996 1997 1998 1999 2000 2001Jan1 87.0 36.6 43.6 78.7 113.8 15.9 57.4 94.7 91.9 123.7 72.6 44.6 27.9 69.1 73.5 55.2 101.0 41.5 80.1 166.2 48.3 203.9 158.9 101.9Jan2 73.9 29.5 35.6 64.3 93.4 13.3 46.9 76.0 74.6 96.9 59.1 36.3 23.0 56.3 61.7 45.2 81.9 33.6 64.4 134.1 40.8 174.2 129.5 80.0Jan3 60.4 26.3 32.1 57.9 83.3 12.4 42.0 67.5 66.4 85.8 52.7 32.8 21.0 50.8 57.3 40.7 72.0 30.2 57.4 118.6 37.7 154.0 132.3 68.4Feb1 46.9 19.8 23.9 43.2 62.3 9.6 31.4 49.9 49.2 63.0 39.2 24.7 15.8 38.2 40.2 30.6 53.3 24.3 43.5 87.3 27.6 104.7 99.4 50.7Feb2 37.8 16.7 20.1 36.2 51.8 8.4 26.3 41.4 40.9 52.0 32.7 21.0 13.4 32.5 33.4 25.7 43.6 19.0 35.0 71.9 23.3 84.9 79.8 42.2Feb3 26.0 11.6 15.4 24.9 35.6 5.9 20.1 28.2 27.9 35.5 25.7 14.6 9.3 26.9 25.4 17.8 29.5 13.1 26.6 48.7 16.2 62.6 60.2 28.9Mar1 28.2 12.6 14.9 27.0 38.5 6.7 19.2 30.2 30.0 38.7 23.8 15.9 10.3 25.8 24.1 19.4 31.5 14.2 25.2 52.0 17.7 73.0 56.5 31.5Mar2 24.2 10.9 12.7 23.3 33.1 5.9 16.6 25.7 25.6 32.0 20.4 14.9 9.0 24.9 20.6 16.8 26.5 12.3 21.5 43.9 15.4 57.5 47.7 27.4Mar3 22.8 10.4 12.1 22.1 31.5 5.9 15.7 24.4 24.1 29.8 19.3 16.9 8.6 24.0 19.4 16.0 26.5 11.7 20.3 41.0 15.0 52.6 44.4 27.0Apr1 18.0 8.4 9.7 17.5 25.1 4.8 12.5 19.0 19.0 23.2 15.2 11.6 6.9 20.7 15.9 12.8 20.2 9.3 16.0 31.9 12.0 40.4 34.6 20.1Apr2 16.4 7.5 8.6 15.6 22.2 4.4 11.1 16.6 16.6 20.4 13.4 10.3 6.2 16.5 13.8 11.4 17.4 8.3 14.1 28.5 10.6 35.2 32.5 17.6Apr3 15.6 6.7 7.7 14.0 19.6 4.0 9.9 14.9 14.8 17.7 12.0 9.2 5.6 14.7 12.1 10.2 15.1 7.4 12.5 24.5 9.7 33.8 27.0 15.8May1 18.3 12.9 12.4 10.8 28.6 4.0 25.6 34.3 13.3 9.6 13.1 28.2 5.9 18.1 10.4 11.3 12.0 12.2 20.2 22.4 16.7 47.2 23.4 17.6May2 21.4 11.7 26.6 18.0 20.8 9.8 23.2 19.0 43.4 8.5 12.0 18.2 15.3 13.1 10.7 10.5 22.2 16.4 70.1 26.5 13.7 38.3 45.9 44.4May3 17.0 16.1 61.4 30.8 17.1 6.8 41.0 18.7 32.6 13.6 10.4 34.4 62.7 14.4 12.2 17.6 28.2 22.2 30.6 52.7 16.0 74.6 42.8 20.7Jun1 10.7 28.4 32.6 13.2 23.7 5.0 56.4 14.0 13.5 20.4 11.2 31.9 21.2 23.5 14.7 10.9 15.7 26.3 23.9 28.8 8.8 48.9 63.6 24.9Jun2 16.0 26.5 40.5 29.1 44.7 8.9 103.3 20.1 14.3 15.1 14.5 21.8 114.2 12.1 29.2 10.5 13.1 14.9 43.7 29.2 9.3 82.0 36.2 17.9Jun3 12.1 60.1 59.8 31.1 20.5 13.7 20.3 12.9 14.4 8.5 8.3 20.4 79.5 9.9 15.2 14.2 30.9 18.1 24.2 16.0 15.4 49.5 41.3 15.2Jul1 24.2 13.3 22.3 37.1 11.9 8.6 19.3 7.6 8.7 9.3 6.5 15.6 22.6 8.1 6.3 6.5 12.1 9.7 19.6 19.0 16.3 23.8 35.2 9.0Jul2 20.5 11.1 18.2 50.3 11.3 7.2 15.5 7.3 8.0 9.1 7.0 13.4 19.3 7.5 5.8 5.7 10.1 8.3 16.1 18.3 13.4 22.7 29.8 8.4Jul3 19.3 10.8 17.8 50.6 10.9 6.4 16.2 7.2 8.8 9.1 6.4 16.3 17.5 7.2 9.1 5.8 9.8 7.1 14.6 17.6 11.5 22.1 31.7 8.4Aug1 13.4 8.5 13.2 36.5 9.2 12.9 11.4 6.1 8.2 7.3 5.2 13.0 13.9 6.2 7.8 4.6 7.9 5.6 11.6 13.4 13.8 17.2 24.5 9.2Aug2 11.6 6.8 10.9 29.6 8.5 14.6 9.7 5.8 8.2 6.9 4.9 24.1 16.0 5.7 6.7 4.3 7.2 5.2 9.9 12.2 9.9 16.7 21.7 11.0Aug3 11.6 6.4 10.9 25.8 10.0 11.1 9.2 5.9 7.6 7.5 5.0 25.0 11.3 5.9 8.0 4.5 7.5 13.9 9.6 12.3 10.8 17.3 37.9 11.0Sep1 26.8 10.2 5.4 13.7 20.4 11.0 10.9 8.9 5.5 6.9 8.9 4.3 27.9 16.2 5.1 5.4 4.1 25.1 16.0 8.4 10.2 9.1 17.9 26.8 7.0Sep2 69.7 19.0 4.9 18.4 18.5 8.7 13.1 6.8 11.4 5.6 41.0 4.6 84.6 33.5 5.3 8.8 4.5 42.9 45.9 13.5 9.7 17.9 24.5 26.4 7.2Sep3 497.5 23.5 11.2 50.0 35.1 13.3 16.6 13.5 45.9 7.6 37.7 24.6 59.3 26.0 18.6 18.4 7.4 32.6 29.5 25.5 102.3 44.0 28.3 25.2 11.1Oct1 140.2 21.1 17.1 238.5 36.5 12.4 81.9 20.7 129.4 188.0 26.3 122.0 59.9 158.2 62.9 41.5 196.2 38.3 249.4 25.0 70.8 77.4 67.4 41.8 11.2Oct2 216.1 19.7 208.8 144.6 326.7 23.8 198.6 297.1 275.8 66.5 20.3 490.8 63.4 795.9 43.0 99.0 94.2 80.3 143.0 121.7 50.4 66.5 207.4 194.9 28.6Oct3 102.3 79.2 179.4 458.5 748.3 37.3 430.2 159.6 117.9 336.8 19.5 190.8 51.2 332.8 466.1 861.2 261.9 252.3 389.0 529.5 71.8 400.1 473.7 154.3 380.4Nov1 452.7 235.6 68.2 618.1 635.5 71.5 291.4 454.9 258.4 194.5 310.2 259.3 40.7 196.0 160.7 246.9 78.8 75.4 371.1 468.5 426.0 185.0 842.8 72.1 171.7Nov2 387.2 103.9 235.8 558.1 552.0 43.1 435.0 154.2 317.9 154.2 546.3 185.9 94.5 596.2 133.3 200.0 57.5 71.7 257.7 712.4 102.7 731.9 239.1 583.6 197.2Nov3 145.0 60.3 124.3 215.1 251.0 35.1 149.3 341.5 495.9 125.6 397.8 106.7 74.3 218.5 352.5 130.6 283.7 110.3 153.8 535.0 81.1 797.1 286.8 263.0 80.3Dec1 116.8 64.9 108.5 150.7 382.8 28.2 104.8 348.0 344.1 790.2 147.2 80.5 60.3 136.6 139.6 97.8 377.4 106.4 125.9 658.6 110.7 494.7 887.2 231.7 64.3Dec2 93.5 52.5 69.6 130.6 239.4 24.1 90.1 142.5 143.1 178.2 114.9 70.9 47.2 108.2 204.3 75.8 367.0 82.2 111.2 330.5 81.9 546.6 453.2 165.9 118.0Dec3 82.7 62.8 59.7 114.2 159.6 20.9 80.7 147.1 151.0 193.7 100.2 61.1 39.7 99.1 101.4 79.8 145.8 72.6 179.4 321.9 65.8 244.8 226.2 217.0 105.9
CT-3

Table C.1 10-Days Runoff Series at Respective Sub-catchment Areas (4)
Natural Decade Runoff Nui Mot (generated) in Mm3
1977 1978 1979 1980 1981 1982 1983 1984 1985 1986 1987 1988 1989 1990 1991 1992 1993 1994 1995 1996 1997 1998 1999 2000 2001Jan1 7.1 3.3 3.7 4.4 9.2 1.8 5.5 7.5 7.8 8.0 6.0 5.0 3.3 6.3 4.7 3.6 8.4 3.4 5.9 11.6 3.2 11.6 10.5 6.9Jan2 5.4 2.7 3.0 3.5 7.5 1.6 3.9 6.0 6.3 6.4 4.9 3.8 2.7 4.8 3.8 2.9 6.9 2.8 4.7 9.4 2.7 9.9 8.4 5.4Jan3 4.5 2.4 2.7 3.2 6.7 1.4 3.5 5.5 5.6 5.7 4.4 3.5 2.4 4.3 3.4 2.6 5.9 2.5 4.5 8.3 2.5 8.5 8.3 4.7Feb1 3.7 1.8 2.0 2.4 5.0 1.0 2.6 4.0 4.1 4.1 3.2 2.6 1.8 3.2 2.5 2.0 4.4 1.9 3.9 6.1 1.9 6.4 6.0 3.5Feb2 3.0 1.5 1.7 2.0 4.1 0.9 2.2 3.3 3.4 3.4 2.7 2.2 1.5 2.7 2.1 1.7 3.6 1.6 3.0 5.1 1.6 5.2 4.8 2.9Feb3 2.0 1.1 1.3 1.4 2.8 0.6 1.7 2.2 2.5 2.4 2.1 1.5 1.1 2.1 1.6 1.1 2.4 1.1 2.2 3.4 1.1 3.7 3.7 2.0Mar1 2.2 1.2 1.2 1.5 3.0 0.7 1.6 2.4 2.5 2.7 1.9 1.7 1.1 2.1 1.6 1.2 2.6 1.2 2.1 3.7 1.2 3.9 3.4 2.2Mar2 1.9 1.0 1.1 1.3 2.6 0.6 1.3 2.0 2.2 2.2 1.7 2.1 1.0 2.1 1.3 1.1 2.2 1.0 1.8 3.1 1.0 3.2 3.0 1.9Mar3 1.8 1.0 1.0 1.2 2.5 0.6 1.3 1.9 2.0 2.0 1.6 3.0 0.9 1.9 1.3 1.0 2.1 1.0 1.7 2.9 1.0 3.0 2.7 2.3Apr1 1.4 0.8 0.8 1.0 1.9 0.5 1.0 1.5 1.6 1.6 1.2 2.1 0.7 1.7 1.0 0.8 1.6 0.8 1.3 2.3 0.8 2.3 2.2 2.0Apr2 1.2 0.7 0.7 0.9 1.7 0.4 0.9 1.3 1.4 1.4 1.1 1.8 0.7 1.3 0.9 0.7 1.4 0.7 1.3 2.1 0.7 2.0 2.1 1.6Apr3 1.1 0.6 0.6 0.8 1.5 0.4 0.8 1.2 1.2 1.2 1.0 1.5 0.6 1.3 0.8 0.6 1.2 0.6 1.1 1.7 0.6 1.8 1.7 1.4May1 1.2 1.2 1.0 0.6 2.2 0.3 2.1 5.0 1.1 0.7 1.1 3.1 0.6 1.5 0.7 0.7 1.0 1.0 1.6 1.6 1.1 2.2 1.5 1.5May2 1.3 0.8 2.5 0.8 1.6 0.6 1.8 2.8 3.4 0.6 1.0 2.1 1.9 1.0 0.8 0.6 2.1 1.4 4.8 1.8 0.9 1.9 2.6 3.6May3 0.9 0.7 7.7 0.9 1.4 0.5 2.8 3.2 2.1 0.9 0.8 3.3 3.8 1.1 0.8 1.4 1.7 1.4 1.5 2.3 1.1 3.7 2.4 1.6Jun1 0.6 1.2 2.6 0.3 1.8 0.3 4.9 2.0 0.9 1.3 0.9 2.9 1.0 2.8 1.1 0.9 1.1 1.5 1.3 1.1 0.6 2.3 3.1 1.6Jun2 0.9 1.3 3.9 0.3 2.5 0.3 9.2 2.8 1.0 1.0 1.1 2.1 8.0 1.4 2.0 0.9 1.0 0.8 1.9 1.2 0.6 3.3 1.9 1.3Jun3 0.6 2.3 8.4 0.4 1.4 0.5 1.7 1.7 1.0 0.6 0.6 1.5 6.3 1.1 1.0 1.0 2.6 0.8 1.1 0.7 0.8 2.0 1.9 1.1Jul1 2.0 0.5 2.8 0.6 0.8 0.4 1.5 1.0 0.6 0.6 0.5 1.1 1.8 0.8 0.4 0.4 1.3 0.3 0.9 0.9 0.6 1.0 1.6 0.7Jul2 1.5 0.5 2.3 0.9 0.7 0.3 1.3 0.9 0.6 0.6 0.8 0.9 1.5 0.8 0.4 0.4 1.1 0.3 0.8 0.8 0.4 0.9 1.2 0.6Jul3 1.3 0.5 2.1 0.7 0.8 0.3 1.2 0.8 0.7 0.6 0.8 0.9 1.8 0.7 0.6 0.4 1.0 0.3 0.7 0.8 0.4 0.9 1.5 0.6Aug1 1.0 0.3 1.5 0.6 0.6 0.4 0.9 0.7 0.6 0.5 0.6 0.7 1.5 0.6 0.5 0.3 0.8 0.3 0.6 0.7 0.4 0.7 1.1 0.5Aug2 0.9 0.3 1.3 0.5 0.6 0.5 0.8 0.6 0.6 0.4 0.5 1.1 1.5 0.5 0.5 0.3 0.7 0.3 0.5 0.7 0.3 0.7 0.9 0.5Aug3 0.9 0.3 1.2 0.5 0.6 0.4 0.7 0.6 0.5 0.5 0.5 0.9 1.2 0.6 0.5 0.3 0.7 0.4 0.6 0.7 0.3 0.8 1.6 0.5Sep1 1.7 0.7 0.3 1.0 0.4 0.6 0.3 0.6 0.5 0.4 0.4 0.4 0.7 1.1 0.5 0.3 0.3 0.8 0.4 0.5 0.6 0.3 0.6 1.1 0.4Sep2 2.1 1.3 0.3 1.2 0.4 0.5 0.3 0.5 0.6 0.4 0.8 0.8 0.9 1.2 0.8 0.3 0.3 1.9 2.0 1.0 0.7 0.4 0.6 1.0 0.4Sep3 23.9 2.4 0.4 1.8 1.8 0.6 1.3 1.0 2.1 0.8 0.6 1.7 1.1 1.0 3.6 0.4 0.8 3.3 4.9 3.6 5.8 1.0 0.7 0.9 0.4Oct1 10.3 2.9 0.9 10.9 2.0 0.6 9.5 1.1 7.6 9.8 1.0 14.3 2.9 5.4 10.6 0.4 25.3 6.2 19.3 5.2 3.0 1.7 1.6 2.8 0.5Oct2 18.8 2.6 17.4 6.4 24.5 3.4 13.3 18.2 17.8 4.1 1.0 56.9 9.3 54.4 7.0 2.2 8.6 5.9 9.6 27.8 2.6 2.9 5.7 24.2 1.1Oct3 7.7 12.2 15.2 18.9 57.4 6.9 23.7 11.3 6.3 13.4 1.1 17.4 8.3 23.5 32.0 47.9 18.8 17.2 28.3 34.2 6.0 35.5 39.6 15.4 19.4Nov1 31.1 28.4 5.5 31.2 47.7 8.6 22.7 44.3 16.6 11.9 37.6 37.0 8.1 13.2 17.9 12.5 7.0 7.7 17.0 28.7 30.4 19.2 51.3 7.2 10.9Nov2 26.3 9.6 18.0 31.7 48.0 4.1 28.9 12.6 23.2 6.7 41.0 15.8 16.3 37.7 12.9 14.0 4.8 4.7 14.3 51.4 7.6 48.4 17.6 37.2 17.1Nov3 9.7 6.2 9.6 12.3 21.5 4.3 10.1 27.8 44.5 9.6 31.2 11.9 10.7 11.2 10.8 9.9 24.6 3.9 10.6 37.9 6.0 50.4 26.3 21.3 5.8Dec1 7.9 6.5 13.5 8.1 34.4 3.2 7.4 23.4 31.8 53.4 12.3 8.9 7.5 11.2 8.4 6.8 35.4 6.3 8.1 44.7 6.2 24.2 42.9 22.0 4.4Dec2 6.2 5.2 6.3 6.5 17.5 2.7 7.5 10.8 13.0 11.9 9.8 7.3 6.2 8.2 9.5 5.0 27.6 5.9 6.1 17.9 5.4 43.5 34.5 11.8 8.8Dec3 5.5 5.0 5.1 5.7 13.0 2.4 7.3 11.8 12.4 12.1 8.3 6.4 4.8 13.0 6.4 5.1 12.2 6.7 13.3 26.2 4.4 16.2 14.8 11.3 6.3
CT-4

Table C.1 10-Days Runoff Series at Respective Sub-catchment Areas (5)
Natural Decade Runoff La Vi (generated) in Mm3
1977 1978 1979 1980 1981 1982 1983 1984 1985 1986 1987 1988 1989 1990 1991 1992 1993 1994 1995 1996 1997 1998 1999 2000 2001Jan1 10.9 5.1 4.6 5.8 13.1 3.0 8.2 8.5 9.6 8.7 8.6 6.9 0.9 8.2 4.9 5.1 9.3 4.7 6.6 9.9 5.1 15.7 12.6 6.6Jan2 7.7 4.2 3.8 4.8 10.7 2.5 6.2 6.9 7.8 7.0 6.9 5.2 0.8 6.7 4.1 4.2 7.6 3.8 5.3 8.2 4.5 15.7 10.2 5.8Jan3 6.8 3.8 3.4 4.3 9.5 2.3 5.5 6.2 6.9 6.2 6.2 4.7 0.8 6.0 3.7 3.8 6.7 3.5 4.7 7.4 3.9 12.2 10.3 4.9Feb1 5.2 2.9 2.6 3.2 7.1 1.7 4.1 4.6 5.2 4.6 4.5 3.5 0.6 4.5 2.7 2.8 5.0 2.6 6.0 5.6 2.9 8.9 7.8 3.7Feb2 4.2 2.5 2.2 2.7 5.9 1.5 3.4 3.8 4.3 3.8 3.8 3.0 0.6 3.8 2.3 2.4 4.1 2.2 4.6 4.7 2.5 7.5 6.3 3.1Feb3 2.9 1.7 1.7 1.9 4.0 1.0 2.6 2.7 3.1 2.6 3.2 2.0 0.4 3.0 1.8 1.7 2.8 1.5 3.4 3.3 1.7 5.1 4.8 2.1Mar1 3.1 1.9 1.6 2.1 4.3 1.1 2.5 2.9 3.2 2.8 2.9 2.3 0.5 3.0 1.7 1.8 3.0 1.6 3.2 3.6 1.9 5.3 4.5 2.3Mar2 2.7 1.7 1.4 1.8 3.7 1.0 2.2 2.4 2.7 2.4 2.4 6.1 0.4 3.2 1.5 1.6 2.6 1.4 2.6 3.2 1.6 4.4 3.8 2.1Mar3 2.5 1.6 1.3 1.7 3.5 0.9 2.0 2.3 2.6 2.2 2.3 7.8 0.4 3.2 1.4 1.5 2.5 1.3 2.4 3.0 1.5 4.1 3.6 2.9Apr1 2.0 1.3 1.1 1.4 2.7 0.8 1.6 1.8 2.0 1.7 1.8 4.4 0.3 3.2 1.1 1.2 1.9 1.0 1.9 2.4 1.2 3.2 2.8 2.6Apr2 1.7 1.2 1.0 1.3 2.4 0.7 1.4 1.6 1.8 1.5 1.5 3.7 1.0 2.4 1.0 1.1 1.7 0.9 2.0 2.2 1.1 2.7 2.4 2.1Apr3 1.5 1.1 0.8 1.1 2.2 0.6 1.3 1.5 1.6 1.3 1.4 3.1 1.3 2.1 0.9 1.0 1.5 0.8 2.0 2.0 1.0 2.6 2.1 1.8May1 2.6 1.9 1.4 0.8 3.1 0.6 3.6 3.2 1.4 0.7 1.5 6.2 1.2 2.5 0.8 1.1 1.2 1.4 2.9 1.8 1.7 3.1 1.9 2.0May2 3.1 1.4 2.6 1.1 2.3 0.9 3.2 1.8 5.1 0.7 1.4 4.0 2.5 1.7 0.8 1.0 1.9 3.4 3.8 2.0 1.3 2.7 5.7 4.4May3 2.6 1.2 2.5 1.1 1.8 0.8 5.7 2.0 3.4 1.1 1.1 5.7 18.0 1.9 1.8 2.5 1.6 3.1 1.2 2.6 1.9 5.4 5.8 2.1Jun1 1.7 1.8 1.4 0.4 2.5 0.4 38.6 1.4 1.5 1.9 1.2 4.8 5.3 3.6 3.5 2.2 1.0 3.2 1.1 1.3 1.0 3.5 10.0 2.3Jun2 2.0 1.8 2.1 0.5 3.5 0.5 52.6 2.3 1.5 1.3 1.5 3.3 109.2 1.8 5.7 2.0 1.0 1.7 1.5 1.5 1.0 5.1 4.8 1.7Jun3 1.6 2.3 3.4 0.4 1.9 1.0 5.8 1.5 1.6 0.8 0.9 2.4 23.4 1.5 2.7 2.3 2.0 1.8 0.9 0.9 1.3 3.2 4.6 1.5Jul1 2.8 0.6 1.4 0.8 1.1 0.8 5.0 0.9 1.0 0.8 0.7 1.3 6.8 1.5 1.1 1.1 0.8 0.6 0.8 1.1 0.7 1.5 3.8 0.8Jul2 2.5 0.6 1.1 1.0 1.1 0.8 4.1 0.8 0.9 1.1 0.9 1.1 5.5 1.3 1.0 1.0 0.7 0.6 0.7 1.1 0.6 1.3 3.0 0.8Jul3 2.8 0.6 1.1 0.8 1.0 0.7 3.7 0.8 0.9 1.1 2.0 1.2 4.8 1.2 0.9 0.9 0.7 0.6 0.7 1.5 0.6 1.3 3.3 0.8Aug1 2.0 0.6 0.9 0.7 1.0 1.0 2.7 0.8 0.7 0.8 1.5 1.4 3.5 1.0 0.7 0.8 0.6 0.4 2.3 1.1 0.6 1.1 2.4 0.9Aug2 1.7 0.5 0.8 0.6 0.8 1.7 2.3 0.6 0.7 0.8 1.3 10.0 2.9 0.8 0.6 0.6 0.6 0.4 2.4 1.0 0.7 1.0 2.1 1.3Aug3 2.5 0.5 0.9 0.6 0.9 1.6 2.1 0.7 0.7 0.8 1.2 5.2 2.8 0.9 0.7 0.6 0.6 0.5 6.6 1.0 0.6 1.0 5.0 1.8Sep1 2.2 2.2 0.5 1.0 0.5 1.6 1.2 1.7 0.7 0.6 0.6 0.9 3.7 2.4 1.2 0.5 0.7 1.0 0.5 4.9 0.8 0.5 0.8 3.4 1.4Sep2 2.2 2.7 0.4 2.4 0.5 1.7 1.2 1.4 1.1 0.5 1.1 1.0 3.0 2.9 1.3 0.6 1.6 2.8 1.6 24.7 0.9 1.1 0.8 3.2 1.3Sep3 41.4 7.6 0.6 1.8 2.2 1.5 1.6 1.4 5.1 0.7 0.8 2.8 2.5 2.3 2.1 0.8 3.1 3.5 1.4 38.3 9.6 2.9 0.8 2.6 1.2Oct1 13.6 8.1 2.2 22.9 2.1 1.8 17.6 1.4 12.3 13.2 0.9 20.9 2.6 17.6 4.0 1.3 40.1 8.3 18.6 43.1 5.0 5.4 1.4 6.4 2.7Oct2 30.8 6.3 26.7 20.0 27.2 4.1 26.4 30.3 31.2 5.5 1.0 63.1 2.9 86.4 4.8 8.2 12.7 5.2 9.5 113.3 3.9 5.3 7.5 28.4 5.0Oct3 12.2 54.6 21.2 41.9 74.6 4.3 41.6 17.7 11.8 31.9 1.1 26.7 3.3 23.3 36.6 72.5 27.6 13.1 34.5 58.1 12.1 41.4 54.4 25.1 65.4Nov1 47.0 38.9 8.2 40.6 83.1 8.4 37.3 55.2 22.5 15.5 32.3 33.7 2.4 14.4 11.4 19.6 11.7 9.4 24.5 41.9 48.3 22.1 75.5 10.2 16.5Nov2 34.1 15.9 12.9 33.0 65.5 4.6 52.4 18.6 33.2 10.6 61.9 17.6 2.0 42.5 10.6 17.0 8.5 5.6 17.0 24.1 12.0 57.9 23.2 24.9 28.3Nov3 14.5 11.6 12.6 16.2 47.2 8.6 16.8 22.0 52.1 10.5 38.2 13.0 1.7 15.9 8.6 14.3 27.3 5.3 13.8 43.3 9.4 72.6 34.5 18.8 12.1Dec1 12.1 9.9 14.6 11.1 39.9 5.8 12.6 22.8 35.2 49.2 15.6 10.2 1.4 14.5 7.7 10.4 27.0 5.8 10.2 19.0 9.6 30.4 48.1 14.4 9.4Dec2 9.5 7.7 7.3 9.3 24.4 4.8 11.7 12.3 16.0 13.6 14.1 8.7 1.2 12.8 9.4 7.9 29.5 5.8 7.5 15.2 8.3 51.2 35.5 9.5 9.8Dec3 8.4 6.9 6.4 8.0 18.2 4.1 10.6 12.5 14.1 12.8 11.9 7.9 1.1 13.5 6.8 7.0 13.7 8.0 10.9 13.5 6.9 21.0 17.6 7.9 8.8
CT-5

Table C.1 10-Days Runoff Series at Respective Sub-catchment Areas (6)
Natural Decade Runoff Ha Thanh (generated) in Mm3
1977 1978 1979 1980 1981 1982 1983 1984 1985 1986 1987 1988 1989 1990 1991 1992 1993 1994 1995 1996 1997 1998 1999 2000 2001Jan1 21.0 12.7 13.3 14.3 30.9 6.5 18.7 25.3 27.1 27.7 20.8 17.1 14.3 23.6 17.2 11.9 30.8 12.1 20.9 43.7 11.2 39.1 36.7 24.5Jan2 17.4 9.5 10.8 11.4 25.4 5.8 12.9 20.7 21.9 22.0 17.1 13.4 11.8 17.6 14.6 9.8 25.3 9.9 16.7 35.2 9.3 32.3 29.5 19.4Jan3 13.9 8.5 9.7 10.3 22.4 5.2 11.6 18.7 19.5 19.6 15.0 12.6 10.7 15.8 13.4 8.8 21.8 8.9 16.7 31.1 8.6 27.8 29.5 16.9Feb1 12.6 6.4 7.2 8.0 16.6 3.8 8.5 13.8 14.4 14.3 11.1 9.2 7.8 11.7 9.5 6.6 16.0 6.7 14.1 22.8 6.5 21.0 21.1 12.6Feb2 10.3 5.4 6.0 6.5 13.8 3.3 7.1 11.2 11.9 11.8 9.3 7.8 6.5 9.7 7.9 5.6 13.2 5.6 10.5 18.8 5.4 17.1 17.0 10.5Feb3 7.0 3.7 4.6 4.5 9.5 2.3 5.4 7.6 9.0 8.2 7.1 5.4 4.5 7.4 6.1 3.8 8.9 3.8 7.9 12.7 3.8 12.7 12.8 7.2Mar1 7.4 4.0 4.4 4.9 10.2 2.5 5.1 8.1 9.0 10.0 6.7 6.1 4.9 7.4 5.8 4.2 9.5 4.3 7.4 13.5 4.1 12.8 12.0 7.7Mar2 6.3 3.7 3.8 4.3 8.7 2.2 4.4 6.9 7.7 7.8 5.7 7.0 4.2 7.2 5.0 3.6 8.0 3.6 6.7 11.4 3.6 10.7 10.8 6.8Mar3 5.9 3.4 3.6 4.1 8.2 2.2 4.1 6.5 7.2 7.3 5.4 9.1 4.0 6.5 4.8 3.4 7.5 3.4 6.0 10.6 3.5 10.0 9.7 8.1Apr1 4.6 2.7 2.8 3.2 6.5 1.8 3.2 5.1 5.6 5.6 4.3 6.3 3.1 5.7 3.9 2.7 5.8 2.7 4.8 8.3 2.8 7.9 7.6 7.2Apr2 4.0 2.4 2.5 2.9 5.7 1.6 2.8 4.5 4.9 4.9 3.8 5.4 2.8 4.6 3.4 2.4 5.0 2.4 4.9 7.7 2.5 6.7 7.4 5.9Apr3 3.6 2.2 2.3 2.6 5.1 1.4 2.5 4.1 4.3 4.3 3.3 4.7 2.6 4.7 3.0 2.2 4.4 2.2 4.0 6.4 2.2 6.1 6.0 5.3May1 3.8 3.9 3.6 2.0 7.3 1.3 6.3 22.8 3.9 2.3 3.6 9.6 2.6 6.0 2.7 2.4 3.5 3.6 6.2 5.8 3.8 7.3 5.2 5.7May2 4.3 2.6 9.8 2.5 5.3 2.2 5.9 14.9 11.7 2.0 3.3 6.6 7.7 3.9 2.8 2.2 8.1 4.9 19.4 6.1 3.6 6.5 8.5 12.4May3 3.0 2.4 32.7 3.0 4.7 1.9 7.7 16.7 7.4 3.2 2.9 10.6 9.2 4.3 3.0 4.2 6.8 4.6 6.4 7.7 5.0 11.4 7.3 5.7Jun1 2.0 4.3 9.7 0.9 6.2 1.0 9.7 10.5 3.3 4.6 3.0 10.5 3.0 11.4 3.9 2.5 4.4 5.0 5.4 3.8 2.6 6.8 9.5 5.9Jun2 2.7 4.8 15.5 1.3 8.6 1.2 12.9 13.7 3.6 3.3 4.0 8.0 14.2 6.0 7.5 2.6 3.8 2.9 8.3 4.2 2.6 9.4 6.3 4.8Jun3 2.1 8.9 36.6 1.6 4.6 1.5 2.6 8.2 3.6 1.9 2.2 5.6 9.8 4.5 3.7 2.9 10.0 3.0 4.6 2.5 3.3 6.2 6.2 4.1Jul1 7.5 2.2 11.5 2.3 2.7 1.1 2.5 4.6 2.2 2.1 1.9 3.8 2.9 3.3 1.7 1.3 5.0 1.2 3.7 3.1 3.0 3.0 5.1 2.4Jul2 5.3 1.9 9.3 3.6 2.5 1.0 2.1 4.1 2.1 2.0 2.7 3.2 2.6 3.1 1.5 1.2 4.2 1.1 3.3 2.9 2.0 2.7 4.0 2.4Jul3 4.9 1.8 8.4 2.9 2.6 1.0 2.0 3.7 2.4 2.0 2.3 3.1 4.5 2.8 2.4 1.2 3.9 1.1 3.0 3.0 1.9 2.7 4.7 2.3Aug1 3.7 1.4 6.2 2.3 2.2 1.1 1.6 3.0 2.7 1.7 1.8 2.4 4.0 2.4 1.9 1.0 3.0 1.0 2.4 2.5 1.7 2.3 3.5 2.0Aug2 3.2 1.3 5.1 1.9 2.0 1.2 1.4 2.6 2.4 1.6 1.7 2.3 4.7 2.0 2.1 1.0 2.7 0.9 2.1 2.3 1.4 2.2 3.1 1.8Aug3 3.0 1.3 4.7 1.9 2.1 1.0 1.4 2.6 2.0 1.6 1.7 2.2 4.2 2.1 2.3 1.0 2.9 1.2 2.1 2.4 1.4 2.7 4.5 1.8Sep1 5.6 2.5 1.0 4.0 1.5 2.2 0.9 1.2 2.2 1.6 1.4 1.4 1.9 3.9 1.7 1.6 0.8 2.7 1.7 1.9 2.0 1.3 2.2 3.1 1.6Sep2 7.1 4.5 1.0 4.3 1.5 1.8 0.7 1.1 2.4 1.7 2.9 2.7 2.7 3.9 3.6 1.4 1.0 5.7 7.9 2.1 2.9 1.4 1.9 2.7 1.6Sep3 59.9 7.2 1.4 7.7 6.0 2.1 5.7 2.5 8.4 3.6 2.2 5.9 4.3 3.0 14.3 1.4 3.3 12.4 28.8 6.0 25.1 3.1 2.4 2.6 1.6Oct1 36.2 10.3 2.6 35.7 7.3 1.9 28.1 2.7 24.7 41.3 3.7 53.2 17.0 14.4 47.3 1.7 105.1 23.1 64.4 7.5 11.5 6.4 6.3 11.2 1.7Oct2 57.2 9.2 57.9 16.3 81.9 14.8 36.8 56.4 53.1 15.2 4.5 209.0 44.2 173.1 26.9 9.7 39.1 20.4 34.8 42.8 11.6 13.4 21.2 84.4 4.2Oct3 26.3 24.0 54.2 46.2 185.1 31.7 64.5 35.4 19.1 40.9 5.3 56.3 35.7 89.9 111.8 157.5 62.5 59.4 90.4 99.9 27.0 130.4 130.9 50.5 45.4Nov1 96.4 94.1 19.0 86.5 147.2 33.8 69.9 143.5 49.6 42.2 152.2 129.8 39.8 45.8 76.0 40.0 25.9 28.8 54.7 97.8 102.4 71.1 154.3 24.0 34.6Nov2 78.0 35.3 72.7 104.7 166.4 16.0 85.5 39.8 79.8 23.1 132.5 55.7 75.7 119.1 49.5 50.1 18.0 17.1 47.6 199.5 25.8 170.5 54.5 138.9 53.6Nov3 28.4 20.4 31.9 39.8 62.7 14.1 31.1 101.3 146.5 38.0 106.7 42.5 48.5 38.6 40.2 31.8 90.9 13.2 36.9 133.8 20.4 161.7 88.3 73.1 17.5Dec1 23.1 23.1 52.5 25.8 108.5 11.8 22.3 80.0 117.8 188.1 42.9 31.6 32.1 40.6 31.1 22.2 138.8 22.5 28.6 170.2 21.3 83.3 143.6 81.8 13.5Dec2 18.5 18.9 24.3 20.7 60.1 10.0 23.7 35.9 46.7 41.0 33.0 25.8 28.2 28.5 33.5 16.6 98.8 22.8 21.6 68.6 18.9 147.0 130.2 45.8 29.8Dec3 16.3 18.5 18.4 18.3 43.9 8.7 23.9 40.4 44.1 41.3 28.6 22.6 22.0 52.1 23.1 17.0 46.0 23.9 50.7 109.7 15.3 54.6 52.0 42.0 19.8
CT-6

Table C.1 10-Days Runoff Series at Respective Sub-catchment Areas (7)
Natural Decade Runoff at Estuary (generated) in Mm3
1977 1978 1979 1980 1981 1982 1983 1984 1985 1986 1987 1988 1989 1990 1991 1992 1993 1994 1995 1996 1997 1998 1999 2000 2001Jan1 126.0 57.6 65.2 103.1 167.0 27.2 89.8 135.9 136.3 168.2 108.0 73.6 46.4 107.3 100.4 75.8 149.6 61.8 113.5 231.4 67.9 270.3 220.6 139.8Jan2 104.3 45.8 53.3 83.9 137.0 23.2 69.8 109.6 110.6 132.3 88.1 58.7 38.2 85.4 84.2 62.0 121.6 50.1 91.0 186.8 57.2 232.0 179.4 110.6Jan3 85.6 41.0 47.9 75.6 121.9 21.2 62.6 97.9 98.4 117.3 78.3 53.5 34.9 77.0 77.8 56.0 106.4 45.0 83.3 165.4 52.7 202.5 182.3 94.9Feb1 68.4 30.9 35.8 56.8 90.9 16.2 46.6 72.4 73.0 86.1 58.1 40.0 26.0 57.6 54.9 42.0 78.7 35.4 67.5 121.8 38.8 141.0 134.3 70.4Feb2 55.3 26.2 30.0 47.5 75.7 14.0 38.9 59.7 60.6 71.0 48.4 33.9 22.1 48.7 45.8 35.4 64.5 28.3 53.0 100.6 32.8 114.7 107.9 58.7Feb3 37.9 18.1 23.0 32.7 51.9 9.9 29.8 40.7 42.5 48.6 38.1 23.5 15.3 39.4 34.9 24.4 43.6 19.5 40.2 68.1 22.8 84.1 81.4 40.2Mar1 41.0 19.7 22.1 35.5 56.0 11.0 28.4 43.6 44.8 54.2 35.3 30.5 16.7 38.3 33.2 26.6 46.6 21.2 37.9 72.8 24.9 94.9 76.4 43.8Mar2 35.0 17.4 19.0 30.6 48.1 9.7 24.4 37.1 38.2 44.4 30.2 34.5 14.6 37.3 28.4 23.0 39.3 18.2 32.8 61.6 21.7 75.8 65.4 38.3Mar3 33.0 16.4 18.1 29.1 45.7 9.6 23.1 35.1 35.9 41.3 28.5 41.7 13.9 35.7 26.9 22.0 38.6 17.3 30.4 57.5 21.1 69.7 60.4 40.3Apr1 25.9 13.1 14.3 23.1 36.2 7.8 18.3 27.4 28.2 32.1 22.5 24.4 11.1 31.2 22.0 17.5 29.5 13.7 24.0 44.8 16.8 53.9 47.1 31.9Apr2 23.3 11.7 12.7 20.7 32.0 7.1 16.2 24.0 24.7 28.1 19.8 21.1 10.7 24.9 19.1 15.7 25.5 12.3 22.3 40.4 14.9 46.6 44.5 27.2Apr3 21.8 10.6 11.4 18.6 28.4 6.5 14.5 21.6 21.9 24.5 17.6 18.4 10.1 22.9 16.8 14.0 22.2 10.9 19.6 34.6 13.6 44.3 36.9 24.4May1 25.8 20.0 18.3 14.2 41.2 6.2 37.5 65.3 19.7 13.3 19.3 47.2 10.4 28.1 14.6 15.5 17.6 18.1 31.0 31.6 23.3 59.8 44.4 26.9May2 30.2 16.5 41.5 22.4 30.0 13.6 34.1 38.6 63.6 11.8 17.7 30.9 27.4 19.8 15.1 14.3 34.4 26.0 98.1 36.4 19.5 49.4 83.4 64.7May3 23.6 20.4 104.4 35.7 25.0 10.0 57.2 40.6 45.6 18.8 15.2 54.0 93.7 21.8 17.9 25.7 38.3 31.4 39.8 65.3 23.9 95.1 76.0 30.1Jun1 15.0 35.8 46.2 14.7 34.3 6.7 113.0 28.0 19.2 28.2 16.3 50.2 41.8 41.4 23.2 16.5 22.3 35.9 31.7 35.0 13.0 61.4 86.2 34.7Jun2 21.7 34.4 62.0 31.2 59.2 10.9 180.8 38.9 20.5 20.7 21.1 35.2 274.4 21.3 44.4 16.0 18.9 20.3 55.4 36.1 13.5 99.7 49.3 25.8Jun3 16.5 73.6 108.2 33.6 28.4 16.6 31.1 24.3 20.6 11.8 12.0 29.8 135.7 17.0 22.6 20.3 45.5 23.7 30.9 20.2 20.7 60.9 54.0 21.9Jul1 36.6 16.6 38.0 40.8 16.6 10.9 28.2 14.2 12.6 12.8 9.7 21.7 34.1 13.7 9.5 9.2 19.2 11.9 25.0 24.1 20.7 29.4 45.6 12.9Jul2 29.8 14.0 30.9 55.8 15.6 9.4 22.9 13.1 11.6 12.7 11.4 18.6 28.9 12.7 8.7 8.3 16.1 10.3 20.9 23.1 16.4 27.5 38.0 12.2Jul3 28.3 13.7 29.4 55.0 15.3 8.4 23.1 12.7 12.8 12.7 11.4 21.5 28.7 11.9 13.0 8.3 15.4 9.1 19.0 22.9 14.4 27.1 41.2 12.1Aug1 20.1 10.9 21.7 40.0 12.9 15.4 16.6 10.6 12.3 10.2 9.1 17.5 22.9 10.1 11.0 6.8 12.3 7.2 17.3 17.7 16.5 21.4 31.4 12.6Aug2 17.4 9.0 18.0 32.6 12.0 18.0 14.2 9.6 11.9 9.6 8.4 37.5 25.1 9.1 9.9 6.2 11.1 6.8 15.4 16.2 12.4 20.6 27.9 14.6Aug3 18.0 8.5 17.7 28.7 13.6 14.0 13.5 9.8 10.9 10.4 8.4 33.3 19.6 9.4 11.5 6.4 11.7 16.0 19.3 16.4 13.2 21.8 49.0 15.1Sep1 80.1 18.0 7.2 22.5 22.8 15.4 15.3 12.4 25.8 9.6 11.3 9.1 34.1 23.6 19.0 7.9 16.6 32.1 28.3 64.5 33.6 13.3 21.5 34.4 10.4Sep2 124.9 30.0 6.5 29.1 21.0 12.7 17.3 9.8 32.3 8.3 45.8 11.2 91.1 41.5 21.5 11.1 18.0 55.8 67.1 90.0 34.2 22.7 27.8 33.3 10.5Sep3 666.5 43.1 13.6 64.2 45.1 17.6 27.3 18.3 78.5 12.7 41.3 37.1 67.2 32.3 49.1 20.9 25.4 54.3 74.3 122.2 162.7 53.0 32.2 31.3 14.3Oct1 225.9 85.4 66.7 378.5 150.8 36.2 205.4 69.5 210.3 307.1 40.1 302.2 89.3 299.9 182.5 132.7 446.7 104.8 402.2 183.5 122.0 149.7 144.6 115.7 77.1Oct2 348.6 81.0 354.7 257.7 563.1 65.5 343.3 445.7 414.3 146.1 35.0 911.4 126.8 1213.9 139.2 206.8 234.7 140.7 247.6 408.5 100.1 147.1 309.7 385.4 99.9Oct3 176.8 217.4 318.3 643.0 1178.4 101.6 635.0 272.0 195.2 483.3 36.0 392.1 106.1 584.1 709.9 1235.6 458.8 373.7 597.9 834.9 151.7 672.2 773.4 304.2 577.7Nov1 671.8 419.2 123.8 818.2 1021.2 134.1 464.2 775.4 432.0 271.5 657.4 482.2 96.8 301.1 287.9 331.0 154.8 121.8 492.4 704.3 632.3 421.6 1195.9 144.5 249.4Nov2 570.1 186.9 362.3 769.1 939.7 79.6 644.8 302.6 539.0 202.0 906.7 297.4 194.3 827.3 228.2 293.1 120.3 99.5 361.8 1054.8 173.3 1132.9 406.4 815.6 312.1Nov3 242.1 120.6 201.4 325.0 490.1 73.9 250.3 570.0 823.9 191.2 699.0 196.6 141.1 315.9 434.0 198.6 457.9 133.2 240.2 817.4 142.1 1206.1 507.9 407.1 131.4Dec1 159.8 104.4 192.5 195.8 581.4 49.0 151.3 476.4 545.4 1122.6 218.0 131.3 101.4 215.5 188.5 137.2 614.9 157.2 175.8 901.3 150.6 667.6 1178.2 358.0 93.9Dec2 127.8 84.3 110.9 167.1 357.4 41.6 137.3 203.7 235.3 286.2 171.8 112.7 82.7 170.5 258.4 105.3 559.2 132.9 149.4 441.1 117.2 823.3 709.8 241.1 168.7Dec3 113.0 93.1 93.4 146.2 252.3 36.0 127.1 214.2 239.7 305.6 149.0 98.1 67.6 191.8 139.6 108.8 257.6 129.0 257.6 481.0 95.3 375.1 372.8 287.2 143.3
CT-7

CF-1

CF-2

Figure C.3 Monthly Runoff (1978-2001 Generated) at Dinh Binh, Cay Muong, Binh Thanh, and Estuary
50% Monthly Runoff (1978 -2001 Generated)Dinh Binh, Cay Muong, Binh Thanh and Estuary
0.0
20.0
40.0
60.0
80.0
100.0
120.0
Jan Feb Mar Apr May Jun Jul Aug Sep
m3/
sDinh Binh
Cay Muong
Binh Thanh
Estuary
75% Monthly Runoff (1978 -2001 Generated)Dinh Binh, Cay Muong, Binh Thanh and Estuary
0.0
10.0
20.0
30.0
40.0
50.0
60.0
70.0
80.0
Jan Feb Mar Apr May Jun Jul Aug Sep
m3/
s
Dinh Binh
Cay Muong
Binh Thanh
Estuary
90% Monthly Runoff (1978 -2001 Generated)Dinh Binh, Cay Muong, Binh Thanh and Estuary
0.0
5.0
10.0
15.0
20.0
25.0
30.0
35.0
40.0
45.0
50.0
Jan Feb Mar Apr May Jun Jul Aug Sep
m3/
s
Dinh Binh
Cay Muong
Binh Thanh
Estuary
CF-3

Figure C.4 Monthly Runoff (1978-2001 Generated) at Ha Thanh, La Vi, and Nui Mot
50% Monthly Runoff (1978 -2001 Generated)Ha Thanh, La Vi and Nui Mot
0.0
2.0
4.0
6.0
8.0
10.0
12.0
14.0
16.0
18.0
20.0
Jan Feb Mar Apr May Jun Jul Aug Sep
Ha Thanh
La Vi
Nui Mot
75% Monthly Runoff (1978 -2001 Generated)Ha Thanh, La Vi and Nui Mot
0.0
2.0
4.0
6.0
8.0
10.0
12.0
14.0
Jan Feb Mar Apr May Jun Jul Aug Sep
Ha Thanh
La Vi
Nui Mot
90% Monthly Runoff (1978 -2001 Generated)Ha Thanh, La Vi and Nui Mot
0.0
1.0
2.0
3.0
4.0
5.0
6.0
7.0
8.0
9.0
10.0
Jan Feb Mar Apr May Jun Jul Aug Sep
Ha Thanh
La Vi
Nui Mot
CF-4

Figure C.5 Probable 10% Hydrograph Main Flood at Dinh Binh, Cay Muong and Binh Thanh
Probable10% Main Flood Dinh BinhPeak Discharge: 3383 m3/s, Volume: 405 Mm3
0500
1000150020002500300035004000450050005500
0.00 10.00 20.00 30.00 40.00 50.00 60.00 70.00 80.00
time (hours)
disc
harg
e (m
3/s)
Probable 10% Main Flood Cay MuongPeak Discharge: 4400 m3/s, Volume: 580 Mm3
0500
1000150020002500300035004000450050005500
0.00 10.00 20.00 30.00 40.00 50.00 60.00 70.00 80.00
time (hours)
disc
harg
e (m
3/s)
Probable 10% Main Flood Binh ThanhPeak Discharge: 5172 m3/s, Volume: 727 Mm3
0500
1000150020002500300035004000450050005500
0.00 10.00 20.00 30.00 40.00 50.00 60.00 70.00 80.00
time (hours)
disc
harg
e (m
3/s)
CF-5

Figure C.6 Probable 1% Hydrograph Main Flood at Dinh Binh, Cay Muong and Binh Thanh
Probable 1% Main Flood Dinh BinhPeak Discharge: 4821 m3/s, Volume: 590 Mm3
0500
10001500200025003000350040004500500055006000650070007500
0.00 10.00 20.00 30.00 40.00 50.00 60.00 70.00 80.00
time (hours)
disc
harg
e (m
3/s)
Probable 1% Main Flood Cay MuongPeak Discharge: 6270 m3/s, Volume:840 Mm3
0500
10001500200025003000350040004500500055006000650070007500
0.00 10.00 20.00 30.00 40.00 50.00 60.00 70.00 80.00
time (hours)
disc
harg
e (m
3/s)
1987 Historical Flood
Probable 1%Main Flood Binh ThanhPeak Discharge: 7370 m3/s, Volume: 1050 Mm3
0500
10001500200025003000350040004500500055006000650070007500
0.00 10.00 20.00 30.00 40.00 50.00 60.00 70.00 80.00
time (hours)
disc
harg
e (m
3/s)
CF-6

Figure C.7 Probable 1% Hydrograph Early Flood at Dinh Binh, Cay Muong and Binh Thanh
Probable 1% Early Flood Dinh BinhPeak Discharge: 823 m3/s, Volume: 83 Mm3
0
200
400
600
800
1000
1200
1400
0 10 20 30 40 50 60 70 80
time (hours)
disc
harg
e (m
3/s)
Probable 1% Early Flood Cay MuongPeak Discharge: 1070 m3/s, Volume: 134 Mm3
0
200
400
600
800
1000
1200
1400
0 10 20 30 40 50 60 70 80
time (hours)
disc
harg
e (m
3/s)
Probable 1% Early Flood Binh ThanhPeak Discharge: 1258 m3/s, Volume: 180 Mm3
0
200
400
600
800
1000
1200
1400
0 10 20 30 40 50 60 70 80
time (hours)
disc
harg
e (m
3/s)
CF-7

Figure C.8 Probable 10% Hydrograph Late Flood at Dinh Binh, Cay Muong and Binh Thanh
Probable 10% Late Flood Binh ThanhPeak Discharge: 1,800 m3/s, Volume: 324 Mm3
0200400600800100012001400160018002000
0 10 20 30 40 50 60 70 80
time (hours)
disc
harg
e (m
3/s)
Probable 10% Late Flood Dinh BinhPeak Discharge: 1180 m3/s, Volume: 148 Mm3
0200400600800100012001400160018002000
0 10 20 30 40 50 60 70 80
time (hours)
disc
harg
e (m
3/s)
Probable 10% Late Flood Cay MuongPeak Discharge: 1530 m3/s, Volume: 241 Mm3
0200400600800100012001400160018002000
0 10 20 30 40 50 60 70 80
time (hours)
disc
harg
e (m
3/s)
CF-8

Figure C.9 Probable 10% Hydrograph Main Flood at Nui Mot, La Vi and Ha Thanh
Figure C.10 Probable 1% Hydrograph Main Flood at Nui Mot, La Vi, and Ha Thanh
Probable 10% Main Flood Nui Mot (1289 m3/s, V=52 Mm3), La Vi (1510m3/s, V=85 Mm3) and Ha Thanh (2477 m3/s, V=175 Mm3))
0
500
1000
1500
2000
2500
3000
0.00 10.00 20.00 30.00 40.00 50.00 60.00 70.00 80.00
Time (hours)
Dis
char
ge (m
3/s)
Ha Thanh
La ViNui Mot
Probable 1%Main Flood Nui Mot (1837 m3/s, V=72 Mm3), La Vi (2152m3/s, V=125 Mm3) and Ha Thanh (3530 m3/s, V=250 Mm3))
0
500
1000
1500
2000
2500
3000
3500
4000
0.00 10.00 20.00 30.00 40.00 50.00 60.00 70.00 80.00
Time (hours)
Dis
char
ge (m
3/s)
Ha Thanh
La ViNui Mot
CF-9

Figure C.12 Probable 10% Hydrograph Early Flood at Nui Mot, Ha Thanh and La Vi
Figure C.11 Probable 1% Hydrograph Early Flood at Nui Mot, Ha Thanh and La Vi
Probable 1%Early Flood NuiMot (314 m3/s, V=15 Mm3), Ha Thanh (602 m3/s, V=47 Mm3) and LaVi (367 m3/s, V=19 Mm3)
0
200
400
600
800
0 20 40 60 80
time (hours)
disc
harg
e (m
3/s)
HaThanh
La Vi
Nui Mot
Probable 10% Early Flood NuiMot (147 m3/s, V=8 Mm3), Ha Thanh (281 m3/s, V=27 Mm3) and LaVi 172 m3/s, V=11 Mm3)
0
50
100
150
200
250
300
0 20 40 60 80
time (hours)
disc
harg
e (m
3/s)
HaThanh
La Vi
Nui Mot
CF-10

Figure C.13 Validation Synthetic Hydrographs
Validation Synthetic Hydrographs
0
1000
2000
3000
4000
5000
1 21 41 61
time (hours)
disc
harg
e (m
3/s)
10% DinhBinh Hydrograph
10% IntermediateArea Hydrograph
10% DinhBinh+10% IntermediateArea
10% CayMuong Hydrograph
CF-11

Figure C.14 Hydrograph of Probable Maximum Flood at Dinh Binh
PMF Dinh BinhPeak Discharge: 15,000 m3/s, Volumes: 1,150 Mm3 (2-day PMP), 1,490 Mm3 (3-day
PMP)
0
2000
4000
6000
8000
10000
12000
14000
16000
0.00 10.00 20.00 30.00 40.00 50.00 60.00 70.00 80.00
time (hours)
disc
harg
e (m
3/s)
2-day PMP3-day PMP
CF-12

Study on Nationwide Water Resources Development and Management in the Socialist Republic of Vietnam
FINAL REPORT CA-1 Supporting Report Phase 2-2
ANNEX RAINFALL RUNOFF MODELING
1 MODELLING AND MODEL CALIBRATION
For the estimate of probable peak discharges at different locations in the Kone basin, an attempt has been made to calibrate a model that reproduces accurately the basin flood runoff as a result of the area rainfall on the respective sub-catchments. For this purpose use has been made of the SACRAMENTO model.
The concept of the Sacramento model was developed by Burnash et al as far back as in1973. The simulation of the runoff process by the Sacramento model distinguishes the land-phase and the channel-phase. The land-phase is represented by an explicit moisture accounting lumped parameter model. The propagation and attenuation of the outflow floodwaves from the land-phase segments into the channel is simulated with the Standard Muskingum method.
The land-phase component of the model distinguishes the pervious and the impervious part of the catchment (see the figure below). From the impervious areas, precipitation immediately discharges to the channel. The drainage system of the pervious part is divided onto:
- an upper zone, representing the catchment surface system;
- a lower zone, representing the catchment groundwater reservoir system.
Both zones have a tension and a free water storage element. Tension water is considered as the water closely bound to soil particles. Generally first the tension water requirements are fulfilled before water is entering the free water storage. Two lower zone free water storages (groundwater) are distinguished representing a slow
T h e S A C R A M E N T O M o d e l
T E N S I O N W A T E R S T O R A G E
F R E E W A T E R S T O R A G E
P R I M A R Y
F R E E W A T E R
S T O R A G E
S U P P L E M T A R Y
F R E E W A T E R
S T O R A G E
T E N S I O NW A T E RS T O R A G E
T E N S I O NW A T E RS T O R A G E
U P P E R
Z O N E
L O W E R
Z O N E
D I R E C T R U N O F F
S U R F A C E R U N O F F
I N T E R F L O W
B A S E F L O W
S U B S U R F A C E O U T F L O W

Study on Nationwide Water Resources Development and Management in the Socialist Republic of Vietnam
FINAL REPORT CA-2 Supporting Report Phase 2-2
and a fast groundwater flow component respectively.
With the help of hourly discharge data at Cay Muong and simultaneous hourly rainfall data from Quy Nhon, Ba To and Hoai Nhon for a number of historic floods it has been possible to calibrate and verify the SACRAMENTO. As a consequence of the geographical position of the rainfall stations with respect to the catchment area upstream of Cay Muong, it appeared that for some floods the Ba Tho rainfall was representative for the basin rainfall, while for floods a combined Quy Nhon – Ba To gave better results. In most cases, however, the use of the Ba To rainfall gave the best results. Some of these results are presented hereunder
These results were obtained with the following model parameters:
Results 1984 Flood Simulation with SACRAMENTO-model (average Ba To-QuyNhon rainfal l )
0
500
1000
1500
2000
2500
3000
3500
4000
84/1
1/04
84/1
1/05
84/1
1/06
84/1
1/07
84/1
1/08
84/1
1/09
84/1
1/10
84/1
1/11
84/1
1/12
m3/
s at
Cay
Muo
ng
sim
his
Results 1998 Flood Simulation with SACRAMENTO -model (Ba To rainfall)
0.0
500.0
1000.0
1500.0
2000.0
2500.0
3000.0
3500.0
4000.0
4500.0
5000.0
98/1
0/27
98/1
1/01
98/1
1/06
98/1
1/11
98/1
1/16
98/1
1/21
98/1
1/26
98/1
2/01
98/1
2/06
m3/
s at
Cay
Mu
ong
his
sim

Study on Nationwide Water Resources Development and Management in the Socialist Republic of Vietnam
FINAL REPORT CA-3 Supporting Report Phase 2-2
Parameter Initial conditions
Upper zone tension water (capacity)
Upper zone free water (capacity)
Lower zone tension water (capacity)
Lower zone free water (fast draining) (capacity)
Lower zone free water (slow draining) (capacity)
Upper zone lateral drainage rate
Lower zone drainage rate (fast)
Lower zone drainage rate (slow)
Other parameters
ZPERC (percolation parameter)
REXP (percolation parameter)
PFREE (percolation parameter)
RSERV (lower zone free water not available for transpiration)
PCTIM (permanent impervious fraction)
ADIMP (additional impervious fraction)
10mm
100mm
175mm
200mm
600mm
0.5/day
0.8/day
0.06/day
40
1.5
0.2
0.2
0.1
0.2
0
0
75
0
100-400
For routing of the sub-basin land-phase runoff to the respective locations the following Muskingum parameters have been used:
Sub-basin Location Muskingum parameter
K (hours) X
Kone basin u/s Cay Muong
Kone basin u/s Dinh Binh
Cay Muong
Dinh Binh
6
4
0.2
0.2
2 PROBABLE FLOOD SIMULATION
An attempt has been made to use the above described model for the generation of probable floods. The decisive factor in such exercise is the assessment of the probable rainfall distributions in time (hours) and location. Such assessment is not possible with the available rainfall data.
Alternatively, a historic flood has been selected that could be used as a base case for the development of the probable floods. For this purpose the highest observed flood at Cay Muong has been selected, i.e. the 19-20 November 1987 flood. Although the reliability of the reported discharges is not beyond any doubt (reference is made to section 2.2.3), it was found that appropriate to use this flood for further analysis.
The rainfall that caused the flood was measured in Ba To at 549.2 mm in two days. This amount has been evaluated at the probability of 0.013 and 0.029 for the

Study on Nationwide Water Resources Development and Management in the Socialist Republic of Vietnam
FINAL REPORT CA-4 Supporting Report Phase 2-2
two-day rainfall on the Cay Muong and Dinh Binh sub-catchment areas respectively. The probability of the Cay Muong 1987 peak discharge of 6340 m3/s was estimated at a probability of 0.009, which is well in line with the probability of the two-day rainfall on the corresponding sub-catchment.
The two-day rainfall on the Binh Dinh sub-catchment with probabilities of 0.1 and 0.01 have been estimated at 444 mm and 637 mm respectively, this corresponds with 81% and 116% of the 19-20 November 1987 rainfall. Consequently, the actual 19-20 November 1987 hourly rainfall at Ba To has been multiplied with these factors and the calibrated SACRAMENTO model was run with these assumed 10 year and 100 year rainfall for the Dinh Binh sub-catchment in order to arrive at an estimate of the corresponding discharges.
The results of this flood runoff simulation are shown overleaf.
The shape of the simulated flood does not correspond fully with the shape of the observed Cay Muong flood. This is most probably due to the fact that the hourly area rainfall distribution that generated the flood is not completely the same as the observed distribution at Ba To.
The simulated peak discharges and flood volumes are as follows:
Simulated Flood Peak discharge Volume Runoff-coeff.
1987
10%
1%
4281
3222
5673
352
271
427
0.73
0.71
0.75
Comparison of these values with the estimated probable and design peak discharges at Dinh Binh shows the following:
Estimated Probable Flood Calculated Design Flood
Flood Peak discharge Volume Peak discharge Volume
10%
1%
3383
4821
405
594
3821
5836
405
594
It appears that the simulated 10% peak discharge corresponds rather well with the estimated probable 10% peak discharge, while the simulated 1% peak discharge is more in accordance with the calculated 1% design discharge.
The volumes of the design floods are larges than the simulated volumes. This is due to the fact that for the design hydrograph the 3-day rainfall has been taken, while the

Study on Nationwide Water Resources Development and Management in the Socialist Republic of Vietnam
FINAL REPORT CA-5 Supporting Report Phase 2-2
simulated hydrograph is the result of a 2-day rainfall.
Dinh Binh probable floods derived from 1987 flood with SACRAMENTO
0
1000
2000
3000
4000
5000
6000
11/17/87
11/18/87
11/18/87
11/19/87
11/19/87
11/20/87
11/20/87
11/21/87
11/21/87
11/22/87
11/22/87
m3/
s
simulated 1987 Dinh Binh floodsimulated 10%Dinh Binh floodsimulated 1%Dinh Binh flood