appendix c – part 2
TRANSCRIPT

APPENDIX C – PART 2

APPENDIX 2 Detailed Air Quality
Dispersion Modelling Plan

PACIFIC NORTHWEST LNG Detailed Air Quality Dispersion Modelling Plan
Prepared for: Pacific NorthWest LNG Limited Partnership
Oceanic Plaza, Suite 1900 - 1066 West Hastings Street Vancouver, BC V6E 3X1
Tel: (778) 372-4700 | Fax: (604) 630-3181
FINAL Prepared by: Stantec Consulting Ltd. 4370 Dominion Street, Suite 500 Burnaby, BC V5G 4L7 Tel: (604) 436-3014 | Fax: (604) 436-3752
Project No.: 1231-10537
Date: August 12, 2013

Pacific Northwest LNG Detailed Air Quality Dispersion Modelling Plan
Final Table of Contents
August 12, 2013
Project No. 1231-10537
i
TABLE OF CONTENTS 1 General .................................................................................................................................... 1
1.1 Introduction .................................................................................................................... 1 1.2 Regulatory Setting .......................................................................................................... 1 1.3 Level of Assessment ...................................................................................................... 1 1.4 Document Overview ....................................................................................................... 2
2 Emission Sources .................................................................................................................. 2 2.1 Project Overview ............................................................................................................ 2 2.2 Project Emissions ........................................................................................................... 2 2.3 Flaring ............................................................................................................................ 5 2.4 Acid Deposition .............................................................................................................. 5
3 Site Description ...................................................................................................................... 5 3.1 Topography .................................................................................................................... 6 3.2 Meteorology ................................................................................................................... 6 3.3 Background Ambient Air Quality .................................................................................... 8
4 Methods .................................................................................................................................. 9 4.1 Modelling ........................................................................................................................ 9
4.1.1 Selected Model ................................................................................................ 9 4.1.2 CALPUFF configurations ................................................................................. 9 4.1.3 Modeling Domain........................................................................................... 10
4.2 Input Data ..................................................................................................................... 10 4.2.1 Meteorological Data ...................................................................................... 10 4.2.2 Terrain and Building Downwash .................................................................... 10
4.3 Output Data—Results .................................................................................................. 11
5 Data Presentation ................................................................................................................ 11 5.1 Tables........................................................................................................................... 11 5.2 Figures ......................................................................................................................... 11
6 Review by Regulatory Agencies ........................................................................................ 12
7 Quality Management Program ............................................................................................ 12
8 Closure .................................................................................................................................. 13
9 References ............................................................................................................................ 14
10 Figures .................................................................................................................................. 15

Pacific Northwest LNG Detailed Air Quality Dispersion Modelling Plan
Final Table of Contents
August 12, 2013
Project No. 1231-10537 ii
List of Tables Table 1: Selected Substances and Basis for Emissions .......................................................... 4
Table 2: Nearest Representative Meteorological Stations ....................................................... 7
Table 3: Wind Speed Summary Statistics Observed in the Assessment Area ........................ 8
Table 4: Nearest Representative Air Quality Measurements ................................................... 9
List of Figures Figure 1: Location of Meteorological and Ambient Air Quality Monitoring Station in the
Regional Assessment Area ...................................................................................... 16
Figure 2: Wind Roses for Prince Rupert Airport and Holland Rock ......................................... 17
Figure 3: Model Receptor Grid ................................................................................................. 18
List of Appendices Appendix A: Comparison of the Modelled CALMET Wind Field to Observed
Meteorological Data
[File Name and Path: \\Cd1183-f04\workgroup\1231\active\EM\123110537\disc_folders\air_quality\model_plan\rpt_123110537_dmp_20130815.docx]

Pacific Northwest LNG Detailed Air Quality Dispersion Modelling Plan
Final Section 1: General
August 12, 2013
Project No. 1231-10537
1
1 GENERAL
1.1 Introduction Pacific NorthWest LNG Limited Partnership (PNW LNG) proposes to construct and operate a liquid natural gas (LNG) facility near Port Edward, British Columbia (BC). The Pacific NorthWest LNG Project (Project) will be located on Lelu Island within the lands and waters under the jurisdiction of the Prince Rupert Port Authority (PRPA). The Project is a greenfield LNG development that will convert natural gas from reserves in the Montney area natural gas fields in northeast BC to LNG for export to Pacific Rim markets in Asia.
At full build-out, the Project will receive approximately 3 billion standard cubic feet per day (Bscfd) of pipeline grade natural gas and produce up to 18 million tonnes per annum (MTPA) of liquefied natural gas (LNG). The Project will consist of three identical 6 MTPA trains. It is anticipated that the Project will be constructed in two phases with the first phase having a design capacity of 12 MTPA of LNG with an additional 6 MTPA of capacity to be developed as market demand requires. Construction would begin after environmental approvals are granted and last approximately 52 months. The first phase of the facility is expected to be operational by late 2018. Within this document, “the Project” refers to all of the phases of the project.
1.2 Regulatory Setting The Project is anticipated to require an environmental assessment under the Canadian Environmental Assessment Act, 2012 (CEAA 2012) and is subject to review under the BC Environmental Assessment Act (BCEAA). The Project will be located on federal crown, terrestrial and sub-tidal land administered by the federally owned Prince Rupert Port Authority (PRPA). Canada through the Major Projects Management Office (Natural Resources Canada), the Canadian Environmental Assessment Agency, and Transport Canada (Policy Branch) are engaged with the Province of British Columbia to develop a regulatory framework agreement for the Project. That agreement will address the application of provincial regulatory requirements for the Project.
Potential effects on air quality will be determined based on dispersion modelling results which will be presented in the Technical Data Report accompanying the Environmental Assessment application.
1.3 Level of Assessment Dispersion modelling of air emissions will be conducted in accordance with the BC Ministry of Environment (BC MOE) Guidelines for Air Quality Dispersion Modelling in British Columbia (2008). The Guidelines call for the development of a Detailed Model Plan (this document). The Plan is submitted to the BC Ministry of Environment (MOE) for approval. Based on available Project information, a detailed Level 3 assessment (Section 2.2.3 of the Guidelines) is recommended for this Project and is adopted in this model plan. This level of assessment is most rigorous and accounts for multiple source types and effects associated with complex topography.

Pacific Northwest LNG Detailed Air Quality Dispersion Modelling Plan Final Section 2: Emission Sources
August 12, 2013
Project No. 1231-10537
2
1.4 Document Overview This document describes the proposed modelling plan consistent with Level 3 assessments and considers aspects of the emissions (Section 2), the site (Section 3), methods (Section 4), data presentation (Section 5), review by regulatory agencies (Section 6) and the quality management program (Section 7).
2 EMISSION SOURCES
2.1 Project Overview Raw natural gas will be extracted from PNW reserves in the Montney Play Region and adjacent fields near Fort St. John, BC, processed and injected into high-pressure pipelines that transport the gas from the processing area to the Project in Prince Rupert, approximately 650 km away. The pipeline grade gas will enter the Project facility from the mainland at a rate of 3 billion standard cubic feet per day (Bscfd). Average standard pipeline composition will contain less than 4 ppm H2S in mole percent. Hydrogen sulphide (H2S), carbon dioxide (CO2), mercury and water will be removed from the feed gas by means of the thermal oxidizer, acid gas removal, dehydration and mercury removal units, producing a natural gas stream ready for the liquefaction process. Following pre-treatment, natural gas will be cooled to -162ºC to convert it to liquid form, reducing its volume by a factor of about 600. Each refrigerant compressor train will use a configuration of compressors driven by two gas turbines with continuously operating electric starter/helper motors. The process will include an end flash system and liquid expanders to achieve maximum product production of 6 MTPA per train for three trains.
LNG will be loaded onto specialized cargo ships that have the capacity to carry up to 217,000 cubic metres of LNG. At full build-out, twin berths will accommodate berthing of a LNG carrier each. LNG will be loaded at a rate of 15,000 cubic metres (m3) per hour to the ship, by means of three liquid loading arms and one vapour return arm.
2.2 Project Emissions The facility will consist of the following components—raw gas reception, gas pre-treatment, liquefaction, utility, off-site trestle, product storage/loading and infrastructure facilities. Table 1 lists the processing equipment for the full facility build-out.
Dispersion modelling will be used to determine the potential effects on air quality for the full build-out (three trains). The following substances of interest will be assessed:
Inhalable particulate matter (PM10, particulate matter less than 10 µm in diameter)
Respirable particulate matter (PM2.5, particulate matter less than 2.5 µm in diameter)
Sulphur dioxide (SO2)
Hydrogen sulphide (H2S)

Pacific Northwest LNG Detailed Air Quality Dispersion Modelling Plan
Final Section 2: Emission Sources
August 12, 2013
Project No. 1231-10537
3
Nitrogen dioxide (NO2)
Carbon monoxide (CO)
There are no regulatory objectives for ambient volatile organic compounds (VOCs), hazardous air pollutants (HAPs) in BC or Canada. These emissions will be quantified as part of the assessment but will not be modelled.
BC Hydro has indicated it has not advanced its infrastructure planning to a level that would allow it to meet the Project’s electricity needs by the commissioning date (approximately 2018). For this reason, the Project will rely on natural gas-fired turbines, fueled by the inlet natural gas, to power the facility. The design will allow for connection to external sources of renewable energy, should they become feasible in the future.
Cargo ships used to transport LNG to the overseas markets will rely on clean fuel that is compliant with the International Marine Organization (IMO) North American Emission Control Area (ECA) emission standards adopted under Annex VI to the International Convention for the Prevention of Pollution from Ships (MARPOL 2008).
Vessels within the ECA will be required to meet the new emissions targets aimed at prevention, reduction and control of NOx, SO2 and particulate matter emissions. Between 2012 and 2015, vessels operating in the ECA will be required to use fuel with a maximum sulphur target of 1.0 wt%. Beginning in 2015, the sulphur limit will drop further to 0.1 wt%, requiring vessels to switch to lighter distillate fuel or install appropriate emission control technology which ensures emission targets are met. In the context of this Project, SO2 emissions generated by operation of LNG cargo ships are expected to be insubstantial.

Pacific Northwest LNG Detailed Air Quality Dispersion Modelling Plan Final Section 2: Emission Sources
August 12, 2013
Project No. 1231-10537
4
Table 1: Selected Substances and Basis for Emissions
Source Type Substances Emitted Basis of Emissions
Thermal Oxidizer (three)
Point source (continuous)
NOx, CO, PM10, PM2.5, SO2, H2S
Emission factors and facility engineering design estimates
Mixed Refrigerant Compressor Turbine Drivers (six)
Point source (continuous)
NOx, CO, PM10, PM2.5, SO2
Gas Turbine Generators (multiple)
Point source (continuous)
NOx, CO, PM10, PM2.5, SO2
Warm, Cold and Low Pressure Flare (three)c
Point source (continuous and periodic a)
NOx, CO, SO2, H2S
Emergency Diesel Generators (multiple)
Point source (periodic a)
NOx, CO, PM10, PM2.5, SO2
Fresh Water Diesel Fire Water Pump (multiple)
Point source (periodic a)
NOx, CO, PM10, PM2.5, SO2
Seawater Diesel Fire Water Pump (multiple)
Point source (periodic a)
NOx, CO, PM10, PM2.5, SO2
LNG Carriers Point source (continuous and periodic b)
NOx, CO, PM10, PM2.5, SO2
Tugboats Area source (continuous and periodic b)
NOx, CO, PM10, PM2.5, SO2
NOTES: All on-land fired equipment is fueled by sales-quality natural gas. The flare stacks will flare a mixture of acid and processed feed gas. The composition of feed gas will vary between routine and upset flaring scenarios. PM emissions are the sum of the filterable and condensable. a In addition to continuous emission sources, periodic emissions will originate from routine maintenance and readiness testing of backup and emergency equipment. Unplanned periodic emissions will also be generated by the identified sources in the event of an emergency. b Emissions from the LNG carriers and tugboats will be continuous for the short term and periodic for the long term. c Smokeless flares will be used. PM emissions are negligible.

Pacific Northwest LNG Detailed Air Quality Dispersion Modelling Plan
Final Section 3: Site Description
August 12, 2013
Project No. 1231-10537
5
2.3 Flaring The Project will include three flares for reliable and safe disposal of hydrocarbon streams that result from normal operating and upset conditions. The Warm flare will handle warm/wet hydrocarbon releases routed from the front end of the LNG process train. The Cold flare will handle cold/dry hydrocarbon releases from the Liquefaction and Refrigeration areas. The Low Pressure (LP) flare will handle cold vapour releases from the LNG storage areas.
During normal operations, vent gases are not expected to be routed to the flares and flare emissions will be limited to combustion of pilot and purge gas only. Low pressure fuel gas will serve as the pilot and purge gas for the flares. The fuel gas will constitute a mixture of gases from different sources. Air emissions associated with routine flare options will be determined as a function of the combined fuel gas composition. During routine flaring, a 100% conversion efficiency of H2S to SO2 will be assumed.
Blowdown of the entire LNG train will be an extremely rare event as facility design will include safeguards which allow for a safe shutdown of all ingoing and outgoing gas streams without the need to blowdown any or all of the systems. If an emergency condition occurs such as a potentially dangerous process upset or a major fire, a specific sequence will be followed to blow down designated sections of the facility. Warm flare will handle the release of the gas stream from the front end of the train whereas the cold flare will handle release from the Liquefaction and Refrigeration areas. An emergency/unplanned controlled shutdown (all three trains) will be assessed through dispersion modelling. A conversion efficiency of 99.53% (ERCB 2013) will be assumed for the H2S to SO2 upset lit scenario.
2.4 Acid Deposition Potential Acid Input (PAI) is a measure of acid deposition due to precursor SO2 and NOx emissions. Dispersion modelling results will be used to assess the Project’s potential effects of acidifying emissions on aquatic and terrestrial ecosystems.
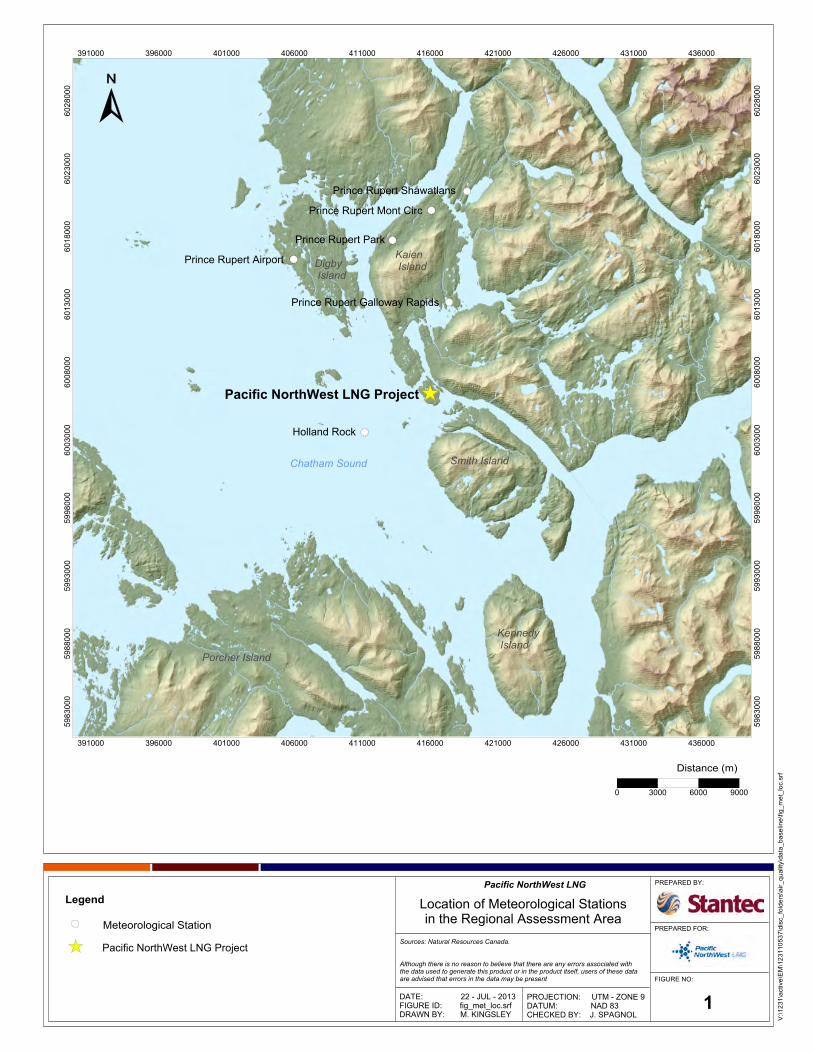
3 SITE DESCRIPTION The Project will be located on Lelu Island, within the District of Port Edward, BC (see Figure 1). The site has a current cover of forest, scrub vegetation, and muskeg. The UTM coordinates are approximately:
East 415924 m, North 6006480 m, Zone 9, NAD 83 or
Latitude: 54°11’58.02”, Longitude: -130°17’19.81”

Pacific Northwest LNG Detailed Air Quality Dispersion Modelling Plan Final Section 3: Site Description
August 12, 2013
Project No. 1231-10537
6
3.1 Topography Figure 1 shows the air quality assessment area for the Project. Lelu Island and surrounding area is considered to be flat low plain that is mostly below 30 m elevation. The Island is bordered by deep water in Porpoise Harbour to the north and Inverness Passage to the south. The western portions of the assessment area cover the ocean component of Hecate Straight and Chatham Sound. The area to the east consists of rugged coastal terrain, with intermittent ocean channels and inlets, rising up to 1,400 m in elevation.
3.2 Meteorology For the dispersion modelling, the CALMET meteorological model will be used in conjunction with the CALPUFF air quality dispersion model. Input data for CALMET will consist of surface and upper air data for one full year (January 1, 2010 through December 31, 2010).
Due to distance and the strong influence of terrain on west coast wind patterns, it was determined that data from the nearest upper air observing station (Annette Island, Alaska, approx. 120 km northwest) are not representative of Project meteorological conditions. For that reason, the Weather Research and Forecasting (WRF) numerical weather prediction system will be used to define meso-meteorological upper air data with 4 km resolution for the same 2010 period.
CALMET surface meteorological characterization will be enhanced with compatible year 2010 data from meteorological stations most representative of Project conditions. Table 2 summarizes meteorological stations identified as nearest to the Project. Station locations are shown in Figure 1. Data from the Prince Rupert Airport and Holland Rock stations will be used. An overview of the available meteorological data is provided below.
The Prince Rupert Airport Canadian Climate Normals Station (CCNS) collects data on air temperature, humidity, precipitation, wind, cloud cover, ceiling height, and pressure. For modelling, meteorological observations are taken at the airport, not from the climate data from the CCNS site. Data collected at the Holland Rock station includes air temperature, humidity wind and pressure observations. The Prince Rupert Galloway Rapids continuous monitoring station collected hourly wind and temperature observations through 2004. The remaining three Prince Rupert Canadian Climate Normals stations collected precipitation observations only (Environment Canada 2012).
The 30-year Prince Rupert Airport normals data indicate that seasonal mean daily temperatures range from 2.0°C in winter to 12.6°C in summer. The annual mean temperature is 7.1°C. The historical extreme temperatures range from -24.4 to 28.7°C. Mean relative humidity readings recorded at 0600 and 1500 local standard time are high throughout the year (mostly above 70%), as is consistent with the region’s wet windward coast climate. Annual precipitation normals range from 2,594 mm at the airport station to 3,111 mm at the Prince Rupert Mont Circ station (see Figure 1), with annual snowfalls of 126 and 149 cm, respectively.

Pacific Northwest LNG Detailed Air Quality Dispersion Modelling Plan
Final Section 3: Site Description
August 12, 2013
Project No. 1231-10537
7
Table 2: Nearest Representative Meteorological Stations
Station Name (No. ID) UTM NAD83 (Zone 9)
Operating Period and Parameters Easting (m)
Northing (m)
Prince Rupert Airport 1
(1066482/1066483) 405953 6016318 1971 – 2000; 2007 – 2012
Temperature, Dew Point, Relative Humidity, Precipitation, Wind Speed and Direction, Cloud Cover, Ceiling Height, Pressure
Holland Rock2
(1063496) 411170 6003570 2007 – 2012
Temperature, Dew Point, Relative Humidity, Wind Speed and Direction, Pressure
Prince Rupert Galloway Rapids3
417400 6013161 May 2001 – Dec 2004 Temperature, Wind Speed and Direction
Prince Rupert Mont Circ1
(1066488) 416520 6019515 1971 – 2000
Precipitation
Prince Rupert Park1
(1066492) 414317 6017700 1971 – 2000
Precipitation
Prince Rupert Shawatlans1
(1066493) 417773 6124193 1971 – 2000
Precipitation
NOTES: 1 CCNS = Canadian Climate Normals Station (Environment Canada 2012). For modelling, meteorological observations are taken at the airport (Station 1066483), not from the CCNS site. 2 Automated station data obtained from Environment Canada. 3 CMS = Continuous Monitoring Station (BC MOE 2012).
In the Project’s west coast region, the prevailing upper level winds are westerly. The surface level winds are strongly influenced by the surrounding topography. Strong winds are typical in the valleys orientated along the axis of the prevailing winds.
Figure 2 provides wind roses depicting annual wind speed and direction frequency distributions derived from hourly observations at Prince Rupert Airport and Holland Rock for the year 2010. Table 3 provides a statistical summary of the wind data at each location. The surface winds at the Prince Rupert Airport station are predominantly from the southerly through easterly quadrant, suggesting the strong topographic influence. Winds are moderate, averaging 3.4 m/s (12.4 km/h). The maximum wind speed in 2010 was 20.6 m/s (74 km/h). Calm winds (< 0.5 m/s) occurred about 7% of the time. The surface winds at the Holland Rock station are also predominantly southeasterly, but stronger than the airport winds due to the more exposed location in Hecate Strait. The annual average wind speed for Holland Rock was 5.7 m/s (20.6 km/h) and the maximum speed observed in 2010 was 29.4 m/s (106 km/h). Calm winds were recorded less than 1% of the time.

Pacific Northwest LNG Detailed Air Quality Dispersion Modelling Plan Final Section 3: Site Description
August 12, 2013
Project No. 1231-10537
8
Table 3: Wind Speed Summary Statistics Observed in the Assessment Area
Parameter Units Prince Rupert Airport
Holland Rock
Sampling Period Jan 1 – Dec 31, 2010 Jan 1 – Dec 31, 2010
Total Hours (No.) 7887 8758
(%) 90.00 99.98
Calm Hours (Wind Speeds < 0.5 m s-1)
(No.) 565 49
(%) 7.1 0.6
Maximum Wind Speed (m s-1) 20.6 29.4
Average Wind Speed (m s-1) 3.4 5.7
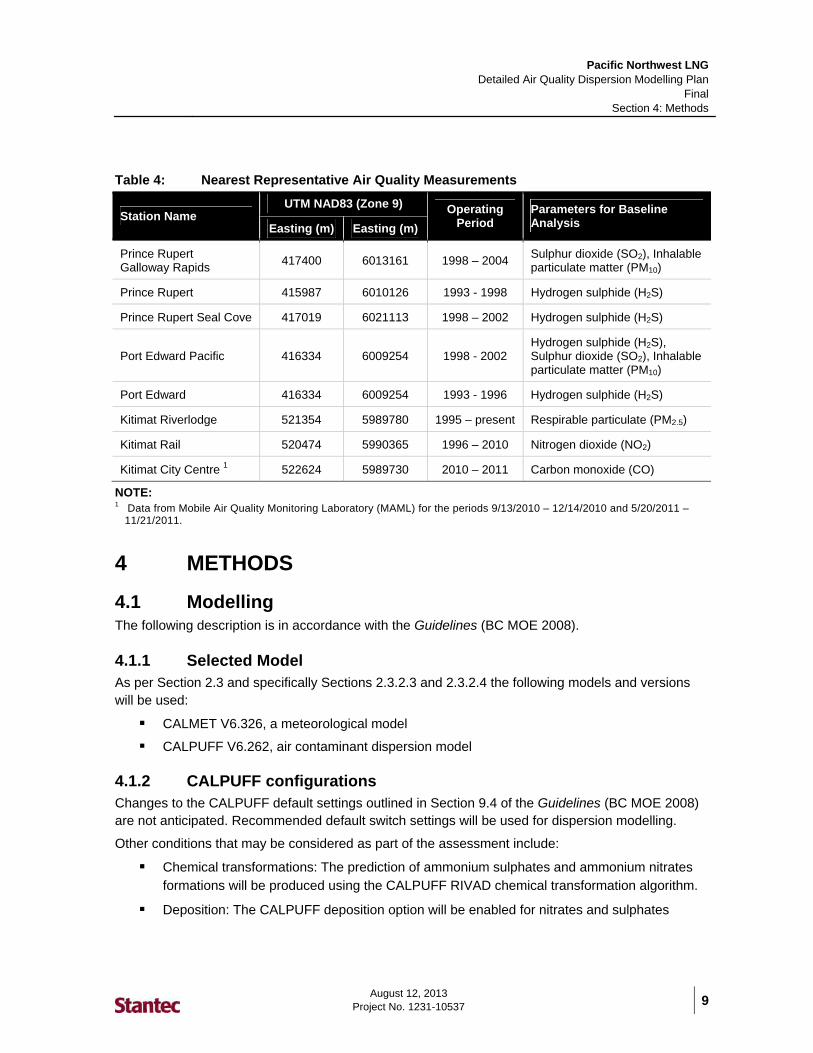
3.3 Background Ambient Air Quality Monitoring stations that are most representative of Project conditions are summarized in Table 4. Within the Project area, ambient concentrations are only available for SO2, H2S and PM10. Regional concentrations for PM2.5, CO, and NO2 will be defined based on data collected in Kitimat, BC. Although Kitimat is approximately 100 km from the Project site, the geographic setting is similar to that of Prince Rupert and the data stations are mostly located in residential areas within a few kilometres of industrial emission sources. When available, the most recent five-year data intervals will be used to determine baseline concentrations. These data are considered representative of the range of air quality conditions that can be expected to occur.
The regional airshed is primarily influenced by existing industrial air emission sources. For this reason, dispersion modelling will predict background concentrations based on regional air emissions sources currently operating within the modelling domain:
Ridley Terminals Inc.
Prince Rupert Grain Ltd.
Northland Cruise Terminal
Prince Rupert Ferry Terminal (BC Ferries and Alaska Ferries)
Fairview Container Terminal (Phase I)
A number of facilities have ceased operations and will not be included in the regional background including the China Paper Group Pulp Mill, J.S. McMillan Fisheries and the ICEC Terminals facilities. The ICEC terminal never commenced construction, and the Permit was cancelled in 2011.
Predicted regional background concentrations will be compared to available ambient air quality data from stations most representative of Project site conditions.
Pacific Northwest LNG Detailed Air Quality Dispersion Modelling Plan
Final Section 4: Methods
August 12, 2013
Project No. 1231-10537
9
Table 4: Nearest Representative Air Quality Measurements
Station Name UTM NAD83 (Zone 9) Operating
Period Parameters for Baseline Analysis Easting (m) Easting (m)
Prince Rupert Galloway Rapids 417400 6013161 1998 – 2004 Sulphur dioxide (SO2), Inhalable
particulate matter (PM10)
Prince Rupert 415987 6010126 1993 - 1998 Hydrogen sulphide (H2S)
Prince Rupert Seal Cove 417019 6021113 1998 – 2002 Hydrogen sulphide (H2S)
Port Edward Pacific 416334 6009254 1998 - 2002 Hydrogen sulphide (H2S), Sulphur dioxide (SO2), Inhalable particulate matter (PM10)
Port Edward 416334 6009254 1993 - 1996 Hydrogen sulphide (H2S)
Kitimat Riverlodge 521354 5989780 1995 – present Respirable particulate (PM2.5)
Kitimat Rail 520474 5990365 1996 – 2010 Nitrogen dioxide (NO2)
Kitimat City Centre 1 522624 5989730 2010 – 2011 Carbon monoxide (CO)
NOTE: 1 Data from Mobile Air Quality Monitoring Laboratory (MAML) for the periods 9/13/2010 – 12/14/2010 and 5/20/2011 –
11/21/2011.
4 METHODS
4.1 Modelling The following description is in accordance with the Guidelines (BC MOE 2008).
4.1.1 Selected Model As per Section 2.3 and specifically Sections 2.3.2.3 and 2.3.2.4 the following models and versions will be used:
CALMET V6.326, a meteorological model
CALPUFF V6.262, air contaminant dispersion model
4.1.2 CALPUFF configurations Changes to the CALPUFF default settings outlined in Section 9.4 of the Guidelines (BC MOE 2008) are not anticipated. Recommended default switch settings will be used for dispersion modelling.
Other conditions that may be considered as part of the assessment include:
Chemical transformations: The prediction of ammonium sulphates and ammonium nitrates formations will be produced using the CALPUFF RIVAD chemical transformation algorithm.
Deposition: The CALPUFF deposition option will be enabled for nitrates and sulphates
Pacific Northwest LNG Detailed Air Quality Dispersion Modelling Plan Final Section 4: Methods
August 12, 2013
Project No. 1231-10537
10
NO to NO2 Conversion—Guidance in Section 11.4 will be followed. The methods considered, in order of preference, are:
100% conversion
RIVAD NOx to NO2 chemical transformation
Ozone Limiting Method
Ambient Ratio Method
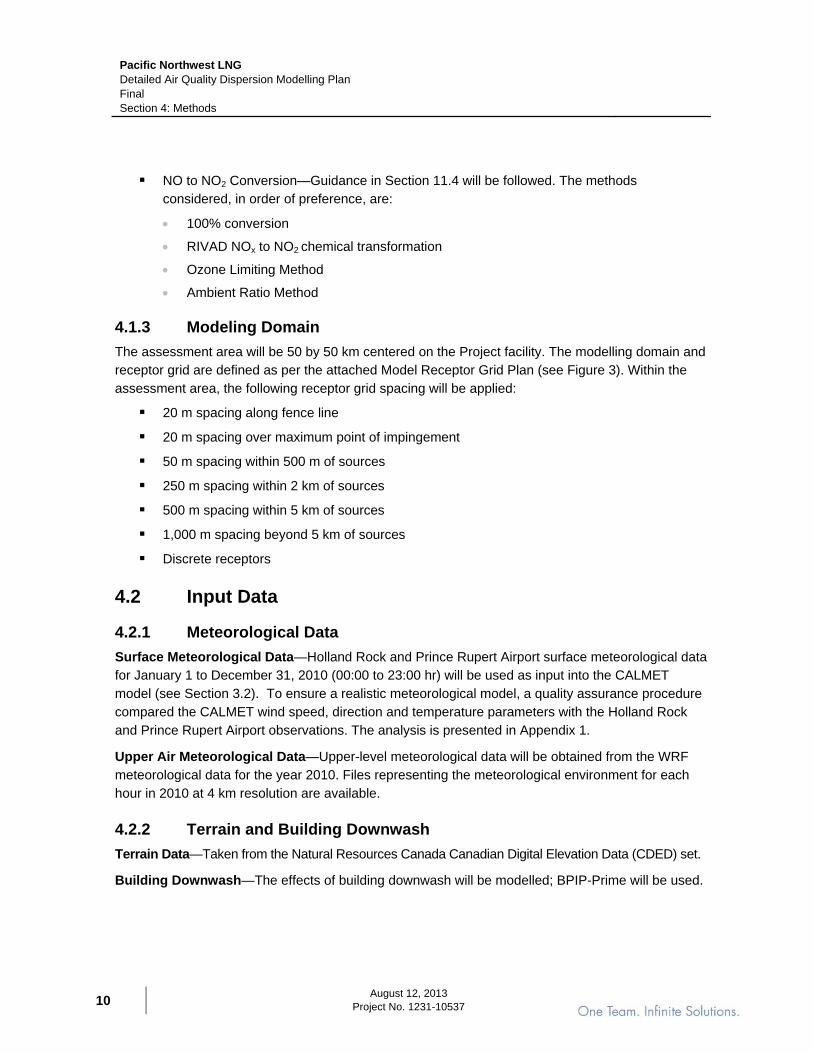
4.1.3 Modeling Domain The assessment area will be 50 by 50 km centered on the Project facility. The modelling domain and receptor grid are defined as per the attached Model Receptor Grid Plan (see Figure 3). Within the assessment area, the following receptor grid spacing will be applied:
20 m spacing along fence line
20 m spacing over maximum point of impingement
50 m spacing within 500 m of sources
250 m spacing within 2 km of sources
500 m spacing within 5 km of sources
1,000 m spacing beyond 5 km of sources
Discrete receptors
4.2 Input Data
4.2.1 Meteorological Data Surface Meteorological Data—Holland Rock and Prince Rupert Airport surface meteorological data for January 1 to December 31, 2010 (00:00 to 23:00 hr) will be used as input into the CALMET model (see Section 3.2). To ensure a realistic meteorological model, a quality assurance procedure compared the CALMET wind speed, direction and temperature parameters with the Holland Rock and Prince Rupert Airport observations. The analysis is presented in Appendix 1.
Upper Air Meteorological Data—Upper-level meteorological data will be obtained from the WRF meteorological data for the year 2010. Files representing the meteorological environment for each hour in 2010 at 4 km resolution are available.
4.2.2 Terrain and Building Downwash Terrain Data—Taken from the Natural Resources Canada Canadian Digital Elevation Data (CDED) set.
Building Downwash—The effects of building downwash will be modelled; BPIP-Prime will be used.

Pacific Northwest LNG Detailed Air Quality Dispersion Modelling Plan
Final Section 5: Data Presentation
August 12, 2013
Project No. 1231-10537
11
4.3 Output Data—Results Anticipated data processing utilities—Excel VBA scripts
Anticipated mixing height method—Upper-air soundings.
Background concentrations will be developed by an analysis of historical monitoring data from the various air quality monitoring stations (see Table 2).
5 DATA PRESENTATION Air quality assessment will be conducted for the following four cases:
Baseline Case—Determination of background concentrations or the contribution of other regional sources to the ambient concentrations in the assessment area.
Project Alone Case—Determination of the effects of emissions during normal Project operations and flaring scenarios.
Application Case—Combination of the effects of normal Project emissions with the Baseline.
Cumulative Case—Combination of the effects of Project, the Baseline and other approved and foreseeable project emissions located within the regional assessment area.
In addition to normal flaring activities, upset lit flaring scenario will be presented (as discussed in Section 2.3).
Cumulative case will incorporate emissions from other approved and foreseeable projects, including:
Fairview Container Terminal (Phase II)
Canpotex Potash Export Terminal (operations)
Prince Rupert LNG Project (assumed to have similar emission levels to PNW LNG)
5.1 Tables Predicted concentration data will be presented and compared to Canada and BC Ambient Air Quality Objectives (AAQOs). The Tables inventory includes:
Maximum effects of short term and long term emissions
Air quality effects at selected receptors of interest (sensitive receptors)
Air quality effects under certain emission situations (upsets)
5.2 Figures Maximum predicted concentrations will be presented graphically for selected parameters. The graphics will include isopleth maps of maximum 1-hour, 24-hour, and annual predictions at each domain receptor without background added. The area covered will extend outward from the project site to

Pacific Northwest LNG Detailed Air Quality Dispersion Modelling Plan Final Section 6: Review by Regulatory Agencies
August 12, 2013
Project No. 1231-10537
12
include the isopleths of 10% of the regulatory objectives or more. This approach is consistent with the domain size recommendations defined in the Guidelines (Section 6.1, MOE 2008).
6 REVIEW BY REGULATORY AGENCIES The Draft Detailed Model Plan was provided to the Ministry of Environment in June 2013. Following the MOE review, revisions were implemented. Subject to approval by MOE, the FINAL Plan will be adopted as the basis for dispersion modelling.
7 QUALITY MANAGEMENT PROGRAM For all levels of this assessment quality assurance and quality control (QA/QC) procedures will be employed to confirm the accuracy of the input source, receptor, meteorological data and the proper behaviour of the models. Both input and output files will be subjected to rigorous examination to ensure they are free of substantive errors. The model output will be studied to ensure that the concentration values and geographic distribution is consistent with expectations. The general CALPUFF/CALMET QA/QC approach provided in Section 10.2.1 of the Guidelines (BC MOE, 2008) will be followed.
The Stantec Quality Management System (SQMS) will be applied in all aspects of this work. The SQMS interprets Stantec work practices by applying the internationally recognized ISO 9001:2008 standard for quality management. This includes file and version management protocols to avoid erroneous substitution of superseded files, and a series of documented Technical and Senior reviews by personnel not involved in day-to-day work on the project.
Pacific Northwest LNG Detailed Air Quality Dispersion Modelling Plan
Final Section 8: Closure
August 12, 2013
Project No. 1231-10537
13
8 CLOSURE We trust that this Detailed Air Quality Dispersion Modelling Plan meets your needs at this time. If you have any questions or concerns, please contact Magda Kingsley by email ([email protected]) or by phone at (604) 235-1871.
Respectfully submitted,
Stantec Consulting Ltd. Reviewed by:
Magda Kingsley, M.Sc. John Spagnol, Ph.D. Air Quality Discipline Lead Senior Air Quality Scientist
Reviewed by:
Peter D. Reid, MA Andrea Pomeroy, Ph.D., R.P.Bio. Principal Project Manager
MK/JS/PDR/AP/nlb

Pacific Northwest LNG Detailed Air Quality Dispersion Modelling Plan Final Section 9: References
August 12, 2013
Project No. 1231-10537
14
9 REFERENCES British Columbia Ministry of Environment (BC MOE). 2008. Guidelines for Air Quality Dispersion
Modelling in British Columbia. Environmental Protection Division, Environmental Quality Branch, Air Protection Section. Victoria, BC. March 2008.
British Columbia Ministry of Environment (BC MOE). 2012. BC Air Data Archive. Available at: http://envistaweb.env.gov.bc.ca/. Accessed: November 2012.
Environment Canada. 2012. National Climate Data and Information Archive. Available at: http://www.climate.weatheroffice.ec.gc.ca/climate_normals/index_e.html. Accessed: December 2012.
ERCB. 2013. Regulations & Directives: Directive 060. Available at: http://www.ercb.ca/regulations-and-directives/directives/directive060. Accessed: May 2013.
Government of Canada. 2012. Canadian Environmental Assessment Act. Available at: http://laws-lois.justice.gc.ca/eng/acts/C-15.21/index.html. Accessed: December 2012.
MARPOL. 2008. International Convention for the Prevention of Pollution from Ships. Annex VI. North American Emission Control Area.

Pacific Northwest LNG Detailed Air Quality Dispersion Modelling Plan
Final Section 10: Figures
August 12, 2013
Project No. 1231-10537
15
10 FIGURES
V:\1
231\
activ
e\E
M\1
2311
0537
\dis
c_fo
lder
s\ai
r_qu
ality
\dat
a_ba
selin
e\fig
_met
_loc
.srf
FIGURE NO:
PREPARED FOR:
PREPARED BY:
PROJECTION: UTM - ZONE 9DATUM: NAD 83 CHECKED BY: J. SPAGNOL
DATE: 22 - JUL - 2013FIGURE ID: fig_met_loc.srfDRAWN BY: M. KINGSLEY
Sources: Natural Resources Canada.
Although there is no reason to believe that there are any errors associated withthe data used to generate this product or in the product itself, users of these dataare advised that errors in the data may be present
Pacific NorthWest LNG
391000 396000 401000 406000 411000 416000 421000 426000 431000 436000
391000 396000 401000 406000 411000 416000 421000 426000 431000 436000
5983
000
5988
000
5993
000
5998
000
6003
000
6008
000
6013
000
6018
000
6023
000
6028
000
5983
000
5988
000
5993
000
5998
000
6003
000
6008
000
6013
000
6018
000
6023
000
6028
000
Distance (m)
Location of Meteorological Stationsin the Regional Assessment Area
1
0 3000 6000 9000
Prince Rupert Galloway Rapids
Prince Rupert Mont Circ
Prince Rupert Park
Prince Rupert Airport
Prince Rupert Shawatlans
Holland Rock
Chatham Sound Smith Island
Kaien Island
Porcher Island
Kennedy Island
Digby Island
Pacific NorthWest LNG Project
Meteorological Station
Legend
Pacific NorthWest LNG Project

Pacific Northwest LNG Detailed Air Quality Dispersion Modelling Plan
Final Section 10: Figures
August 12, 2013
Project No. 1231-10537
17
Prince Rupert Airport 2010
Holland Rock 2010
Figure 2: Wind Roses for Prince Rupert Airport and Holland Rock

V:\1
231\
activ
e\E
M\1
2311
0537
\dis
c_fo
lder
s\ai
r_qu
ality
\mod
el_p
lan\
fig_r
ecep
tor_
grid
.srf
FIGURE NO:
PREPARED FOR:
PREPARED BY:
PROJECTION: UTM - ZONE 9DATUM: NAD 83 CHECKED BY: J. SPAGNOL
DATE: 12 - July - 2013FIGURE ID: fig_receptor_gridDRAWN BY: M. KINGSLEY
Sources: Natural Resources Canada.
Although there is no reason to believe that there are any errors associated withthe data used to generate this product or in the product itself, users of these dataare advised that errors in the data may be present
Pacific NorthWest LNG
391000 396000 401000 406000 411000 416000 421000 426000 431000 436000
391000 396000 401000 406000 411000 416000 421000 426000 431000 436000
5983
000
5988
000
5993
000
5998
000
6003
000
6008
000
6013
000
6018
000
6023
000
6028
000
5983
000
5988
000
5993
000
5998
000
6003
000
6008
000
6013
000
6018
000
6023
000
6028
000
Discrete ReceptorProject Boundary
Distance (m)
Model receptor configuration follows the Guidelines for Air Quality Dispersion Modelling in BC (MOE 2008) and consists of:
Model Receptor GridModelling Domain is 50 km by 50 km
3
0 3000 6000 9000

APPENDIX A Comparison of the Modelled
CALMET Wind Field to Observed Meteorological Data

Pacific Northwest LNG Detailed Air Quality Dispersion Modelling Plan Final Appendix A: Comparison of the Modelled CALMET Wind Field to Observed Meteorological Data
August 12, 2013
Project No. 1231-10537
A-1
COMPARISON OF THE MODELLED CALMET WIND FIELD TO OBSERVED METEOROLOGICAL DATA To ensure a realistic meteorological model is used, the Weather Research and Forecasting (WRF) data processed by CALMET is compared to observations collected at the Prince Rupert Airport Automated Weather Observing Station (AWOS) and the Holland Rock meteorological station. This quality assurance analysis compares CALMET wind speed, wind direction and air temperature with the same observed parameters at the two meteorological station locations. The comparison is made for the 2010 period as defined by the Detailed Air Quality Dispersion Modelling Plan for the Project.
The wind and temperature observations collected by the two stations are valid at a height of 2 and 10 meters (m) above the surface whereas the CALMET model results are extracted at an elevation of 10 m (CALMET Level 1). Stantec used a propriety extraction tool to obtain CALMET results at each exact station location based on a bilinear interpolation of the adjoining CALMET grip points. Wind speed, wind direction and air temperature comparison findings are presented below.
Wind Speed Modelled wind speeds are compared to observed conditions at the Prince Rupert Airport and Holland Rock stations in Figure A-1 and A-2, respectively. Modelled results follow the observed trends and are generally consistent in their frequency distributions. In the case of the Prince Rupert Airport data, the only exception occurs at wind speed between 0.5-2 metres per second (m/s) or greater than 10 m/s. CALMET underestimated the occurrence of wind speeds between 0.5-2 m/s, and overestimated the occurrence of wind speeds greater than (>) 10m/s. Thereby the average modelled wind speed was 4.4 m/s while the observed annual average wind speed for was 3.4 m/s at Prince Rupert Airport. A similar exception is observed at wind speeds between 0.5-2m/s when comparing data at the Holland Rock location.
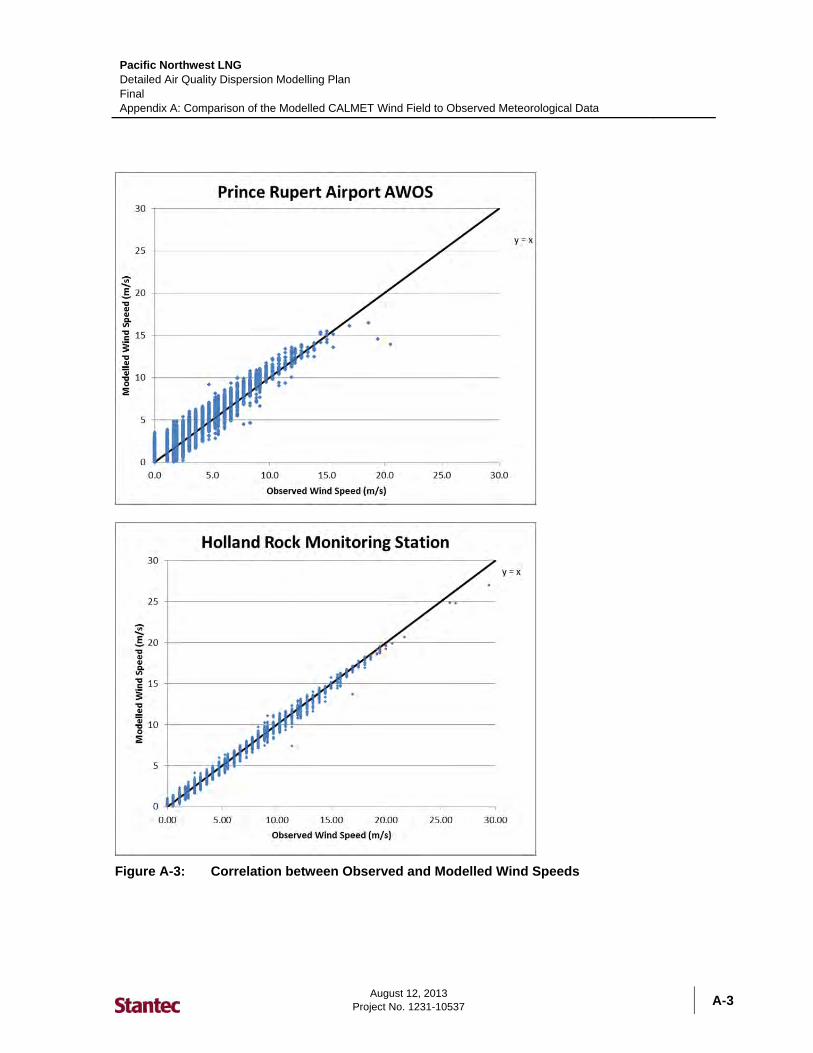
Statistical analysis was completed to evaluate the proximity of modelled results to observations collected at the two stations. The measure of linear dependence between two variables can be assessed by calculating the Pearson correlation1 between predicted and measured values. The results of the Pearson correlation for Prince Rupert Airport and Holland Rock are presented in Figure A-3. The Prince Rupert Airport correlation is considered to be very strong (R=0.954) and suggest the wind speeds used in the model are comparable to actual observations. The Holland Rock correlation is even stronger (R= 0.996) and demonstrates the similarity between observed and modelled values.
The reason for the reduced correlation at the Prince Rupert Airport location is not very clear, but may be attributed to the differences in topography, surface roughness and proximity to the shoreline where local effects can influence wind characteristics near the observing station. As well, the observed wind speed data for 2010 are missing approximately 890 observations, for which no comparison could be made.
1 Talor, R.J. 1997. An Introduction to Error Analysis: The Study of Uncertainties in Physical Measurements.

Pacific Northwest LNG Detailed Air Quality Dispersion Modelling Plan
Final Appendix A: Comparison of the Modelled CALMET Wind Field to Observed Meteorological Data
August 12, 2013
Project No. 1231-10537
A-2
Figure A-1: Comparison of Frequency of wind speeds at Prince Rupert Airport AWOS
Figure A-2: Comparison of Frequency of Wind Speeds at Holland Rock Station
Pacific Northwest LNG Detailed Air Quality Dispersion Modelling Plan Final Appendix A: Comparison of the Modelled CALMET Wind Field to Observed Meteorological Data
August 12, 2013
Project No. 1231-10537
A-3
Figure A-3: Correlation between Observed and Modelled Wind Speeds

Pacific Northwest LNG Detailed Air Quality Dispersion Modelling Plan
Final Appendix A: Comparison of the Modelled CALMET Wind Field to Observed Meteorological Data
August 12, 2013
Project No. 1231-10537
A-4
Wind Direction The observed surface winds at the Prince Rupert Airport location are predominantly easterly to southeasterly (Figure A-4) whereas the dominant wind direction at the Holland Rock station is southeasterly (Figure A-5). When compared to CALMET results, similar wind trends are observed. Figures A-6 and A-7 show the proximity of observed and modelled frequency distributions at each location. The results of this assessment suggest the wind directions produced by the CALMET model are highly comparable.
Figure A-4: Wind Rose Comparison for Prince Rupert Airport Station
Figure A-5: Wind Rose Comparison for Holland Rock Monitoring Station

Pacific Northwest LNG Detailed Air Quality Dispersion Modelling Plan Final Appendix A: Comparison of the Modelled CALMET Wind Field to Observed Meteorological Data
August 12, 2013
Project No. 1231-10537
A-5
Figure A-6: Comparison of Frequency of Wind Directions at Prince Rupert Airport Station
Figure A-7: Comparison of Frequency of Wind Directions at Holland Rock Monitoring
Station

Pacific Northwest LNG Detailed Air Quality Dispersion Modelling Plan
Final Appendix A: Comparison of the Modelled CALMET Wind Field to Observed Meteorological Data
August 12, 2013
Project No. 1231-10537
A-6
Temperature Hourly air temperature observations at the Prince Rupert Airport and Holland Rock locations are compared to modelled results in Table A-1. The average, maximum and minimum values at the Prince Rupert Airport location are similar to modelled results. The corresponding Pearson correlation demonstrates good proximity of modelled and observed results (R =0.842). At the Holland Rock location, similarity is observed in the average annual values (R=0.721). A larger discrepancy is observed when comparing maximum and minimum temperatures at the same location. However, the overall results of this assessment suggest that the temperatures produced by the CALMET model are highly comparable to observed conditions.
Table A-1: Temperatures Comparison at the Holland Rock Monitoring Station and Prince Rupert AWOS
Parameter Prince Rupert Airport AWOS Holland Rock Monitoring Station
Observed Modelled Observed Modelled
Minimum Temperature (K) 264.1 267.6 260.2 267.1
Average Temperature (K) 280.9 281.4 280.5 280.9
Maximum Temperature (K) 298.3 298.1 292.3 296.5
Pearson Correlation 0.842 0.721
CONCLUDING REMARKS This quality assurance analysis demonstrated that the data processed by CALMET is realistic and comparable to observations collected at the Prince Rupert Airport and the Holland Rock meteorological stations. Comparison of wind speed, wind direction and air temperature parameters showed close proximity of CALMET model results to actual conditions observed at both locations. The results of this analysis demonstrate that the CALMET data selected as input for the dispersion modelling is representative of regional meteorological conditions.

APPENDIX 3 Baseline Conditions

Pacific NorthWest LNG Appendix 3: Baseline Conditions
February 2014
Project No. 1231-10537
1
TABLE OF CONTENTS 1 Introduction ............................................................................................................................ 2
2 Regional Climate .................................................................................................................... 2 2.1 Air Temperature ............................................................................................................. 3 2.2 Precipitation ................................................................................................................... 6 2.3 Wind ............................................................................................................................. 14 2.4 Fog (Visibility) ............................................................................................................... 18
3 Air Quality ............................................................................................................................. 19 3.1 Sulphur Dioxide (SO2) .................................................................................................. 21 3.2 Nitrogen Dioxide (NO2) ................................................................................................ 22 3.3 Carbon Monoxide (CO) ................................................................................................ 23 3.4 Inhalable Particulate Matter (PM10) .............................................................................. 24 3.5 Respirable Particulate Matter (PM2.5)........................................................................... 25 3.6 Hydrogen Sulphide (H2S) ............................................................................................. 26 3.7 Volatile Organic Compounds (VOCs) .......................................................................... 27 3.8 Summary of Ambient Air Quality .................................................................................. 27
4 References ............................................................................................................................ 28

Pacific NorthWest LNG Appendix 3: Baseline Conditions
February 2014
Project No. 1231-10537 2
1 INTRODUCTION Transport and dispersion of the air emissions are significantly influenced by local meteorological conditions and are principally influenced by wind speed, wind direction, and atmospheric stability. To account for these influences, meteorological observations of wind speeds and direction taken at the nearest climate stations were analysed. Observed upper air data required to determine stability parameters were not available. Stability influences were determined by the meteorological model (Appendix 5).
Understanding the current ambient air quality helps determine the connection between the air emissions and resultant changes in ambient air quality and then allows for an assessment of potential effects of Project-related emissions on the ambient air quality. This regional air quality summary has considered the air quality parameters measured at the nearest or most representative continuous monitoring stations.
2 REGIONAL CLIMATE To characterize the Project’s climatic conditions, air temperature, precipitation, wind, and visibility data from the nearest meteorological monitoring stations were assessed.
Data from the Prince Rupert Airport automated weather observing station (AWOS) (2007-2012) and Holland Rock station (2007-2013) were used to study the recent meteorology in the RAA. Historical Canadian Climate Normals (CCNS) were also extracted from the National Climate Data and Information Archive over the 30-year period of 1981 to 2010 (Environment Canada 2013a). The geographic coordinates and elevations of monitoring stations for which meteorological data were analyzed are provided below (Table 3-1), followed by the operating periods and meteorological parameters (Table 3-2). The locations of these stations are shown on a regional map (Appendix 1, Figure 1-2).
Table 3-1: Geographic Coordinates of Meteorological Stations in the Regional Assessment Area
Station Type Station Name Latitude Longitude Elevation
(masl)
UTM NAD83 (Zone 9)
Northing (m) Easting (m)
AWOS Prince Rupert Airport AWOS 54°17' N 130°27' W 35.4 6016318 405967
CCNS Prince Rupert Airport 54°17' N 130°26' W 35.4 6016318 405953
CCNS Prince Rupert Mont Circ 54°19' N 130°17' W 60.0 6019924 416094
CCNS Prince Rupert Park 54°18' N 130°19' W 90.8 6017721 413233
CCNS Prince Rupert Shawatlans 54°19' N 130°15' W 11.0 6021330 418721
CMS Holland Rock 54°10' N 130°21' W 5.0 6003570 411170
NOTES: AWOS = automated weather observing station. CCNS = Canadian Climate Normals station. CMS = Continuous monitoring station.
Pacific NorthWest LNG Appendix 3: Baseline Conditions
February 2014
Project No. 1231-10537
3
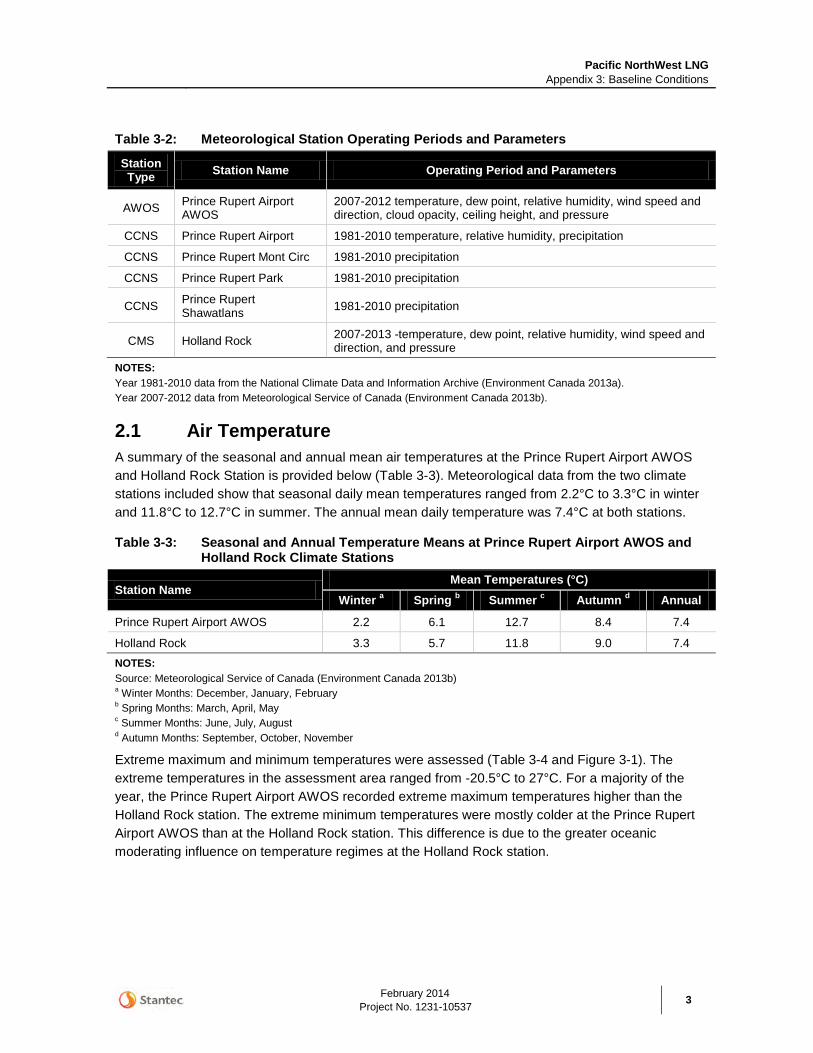
Table 3-2: Meteorological Station Operating Periods and Parameters
NOTES: Year 1981-2010 data from the National Climate Data and Information Archive (Environment Canada 2013a). Year 2007-2012 data from Meteorological Service of Canada (Environment Canada 2013b).
2.1 Air Temperature A summary of the seasonal and annual mean air temperatures at the Prince Rupert Airport AWOS and Holland Rock Station is provided below (Table 3-3). Meteorological data from the two climate stations included show that seasonal daily mean temperatures ranged from 2.2°C to 3.3°C in winter and 11.8°C to 12.7°C in summer. The annual mean daily temperature was 7.4°C at both stations.
Table 3-3: Seasonal and Annual Temperature Means at Prince Rupert Airport AWOS and Holland Rock Climate Stations
Station Name Mean Temperatures (°C)
Winter a Spring b Summer c Autumn d Annual
Prince Rupert Airport AWOS 2.2 6.1 12.7 8.4 7.4
Holland Rock 3.3 5.7 11.8 9.0 7.4 NOTES: Source: Meteorological Service of Canada (Environment Canada 2013b) a Winter Months: December, January, February b Spring Months: March, April, May c Summer Months: June, July, August d Autumn Months: September, October, November
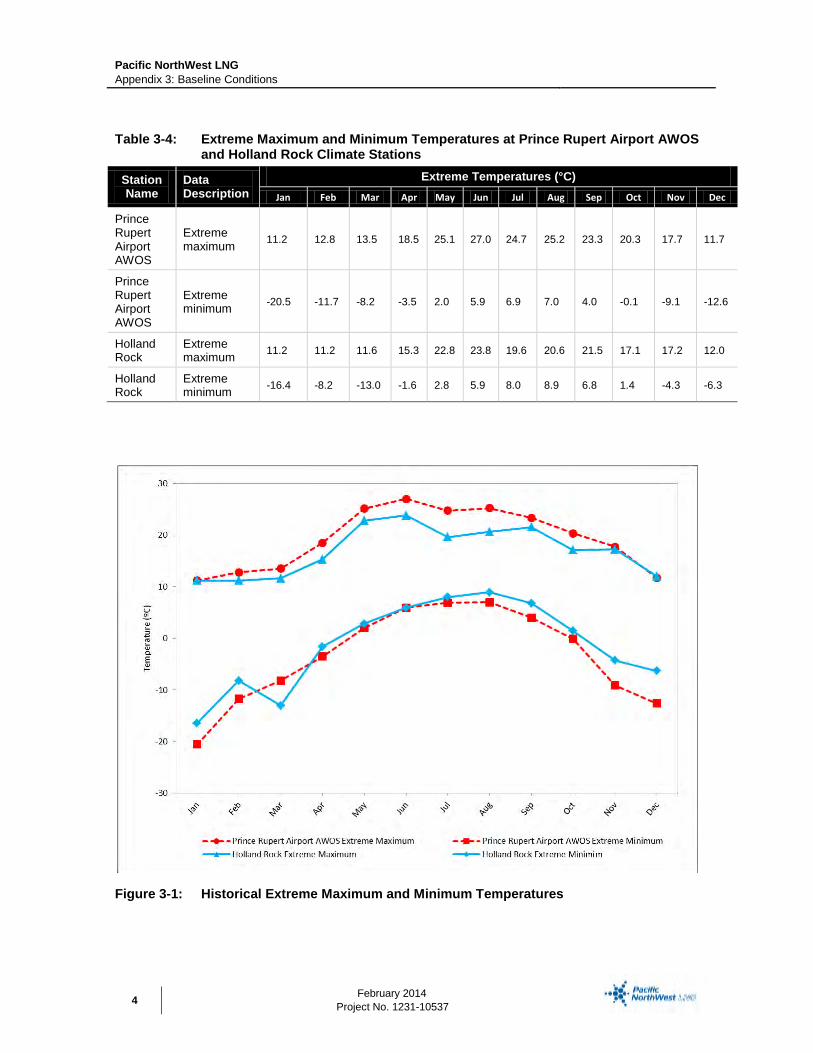
Extreme maximum and minimum temperatures were assessed (Table 3-4 and Figure 3-1). The extreme temperatures in the assessment area ranged from -20.5°C to 27°C. For a majority of the year, the Prince Rupert Airport AWOS recorded extreme maximum temperatures higher than the Holland Rock station. The extreme minimum temperatures were mostly colder at the Prince Rupert Airport AWOS than at the Holland Rock station. This difference is due to the greater oceanic moderating influence on temperature regimes at the Holland Rock station.
Station Type Station Name Operating Period and Parameters
AWOS Prince Rupert Airport AWOS
2007-2012 temperature, dew point, relative humidity, wind speed and direction, cloud opacity, ceiling height, and pressure
CCNS Prince Rupert Airport 1981-2010 temperature, relative humidity, precipitation
CCNS Prince Rupert Mont Circ 1981-2010 precipitation
CCNS Prince Rupert Park 1981-2010 precipitation
CCNS Prince Rupert Shawatlans 1981-2010 precipitation
CMS Holland Rock 2007-2013 -temperature, dew point, relative humidity, wind speed and direction, and pressure
Pacific NorthWest LNG Appendix 3: Baseline Conditions
February 2014
Project No. 1231-10537 4
Table 3-4: Extreme Maximum and Minimum Temperatures at Prince Rupert Airport AWOS and Holland Rock Climate Stations
Station Name
Data Description
Extreme Temperatures (°C) Jan Feb Mar Apr May Jun Jul Aug Sep Oct Nov Dec
Prince Rupert Airport AWOS
Extreme maximum 11.2 12.8 13.5 18.5 25.1 27.0 24.7 25.2 23.3 20.3 17.7 11.7
Prince Rupert Airport AWOS
Extreme minimum -20.5 -11.7 -8.2 -3.5 2.0 5.9 6.9 7.0 4.0 -0.1 -9.1 -12.6
Holland Rock
Extreme maximum 11.2 11.2 11.6 15.3 22.8 23.8 19.6 20.6 21.5 17.1 17.2 12.0
Holland Rock
Extreme minimum -16.4 -8.2 -13.0 -1.6 2.8 5.9 8.0 8.9 6.8 1.4 -4.3 -6.3
Figure 3-1: Historical Extreme Maximum and Minimum Temperatures

Pacific NorthWest LNG Appendix 3: Baseline Conditions
February 2014
Project No. 1231-10537
5
To determine if significant temperature changes have been experienced in the Prince Rupert area, a comparison of the monthly mean, maximum, and minimum temperatures was completed (Table 3-5). The Prince Rupert Airport station climate normals (1981-2010) were compared to recent observations collected by the Prince Rupert AWOS (2007-2012). Monthly temperature trends were assessed (Figure 3-2). The recent daily mean temperatures (2007-2012) resembled historical (1981-2010) mean temperatures quite closely, with differences being less than 1.0°C for all months except December. Variations were greater for maximum and minimum temperatures, with typical differences of 1.0 – 2.0°C between the recent and historical temperatures (Figure 3-2).The analysis demonstrates that recent monthly temperature trends are in line with historical observations for the Prince Rupert region.
Table 3-5: Monthly and Annual Mean Air Temperatures at the Prince Rupert Airport AWOS Data Description
Mean Temperature (°C) Jan Feb Mar Apr May Jun Jul Aug Sep Oct Nov Dec Annual
Mean daily temperature 2007-2012 a
2.3 3.0 3.7 5.9 9.1 11.5 13.2 13.5 12.0 8.6 4.7 1.0 7.4
Maximum daily temperature 2007-2012 a
3.4 4.9 5.1 8.1 12.3 13.2 14.0 15.1 14.2 10.3 8.2 3.6 9.4
Minimum daily temperature 2007-2012 a
0.1 0.9 1.3 3.4 7.1 10.5 11.9 12.2 10.2 7.0 1.3 -1.7 5.3
Mean daily temperature 1981-2010 b
2.4 2.7 4.2 6.4 9.0 11.6 13.4 13.8 11.5 8.0 4.3 2.7 7.5
Maximum daily temperature 1981-2010 b
5.6 6.1 7.7 10.2 12.6 14.7 16.2 17.0 14.9 11.1 7.3 5.5 10.8
Minimum daily temperature 1981-2010 b
-0.8 -0.7 0.6 2.5 5.4 8.4 10.5 10.6 8.0 4.9 1.3 -0.2 4.2
NOTES: a Source: Meteorological Service of Canada (Environment Canada 2013b). b Source: National Climate Data and Information Archive (Environment Canada 2013a).

Pacific NorthWest LNG Appendix 3: Baseline Conditions
February 2014
Project No. 1231-10537 6
Figure 3-2: Comparison between Historical and Recent Air Temperatures at the Prince Rupert Airport AWOS
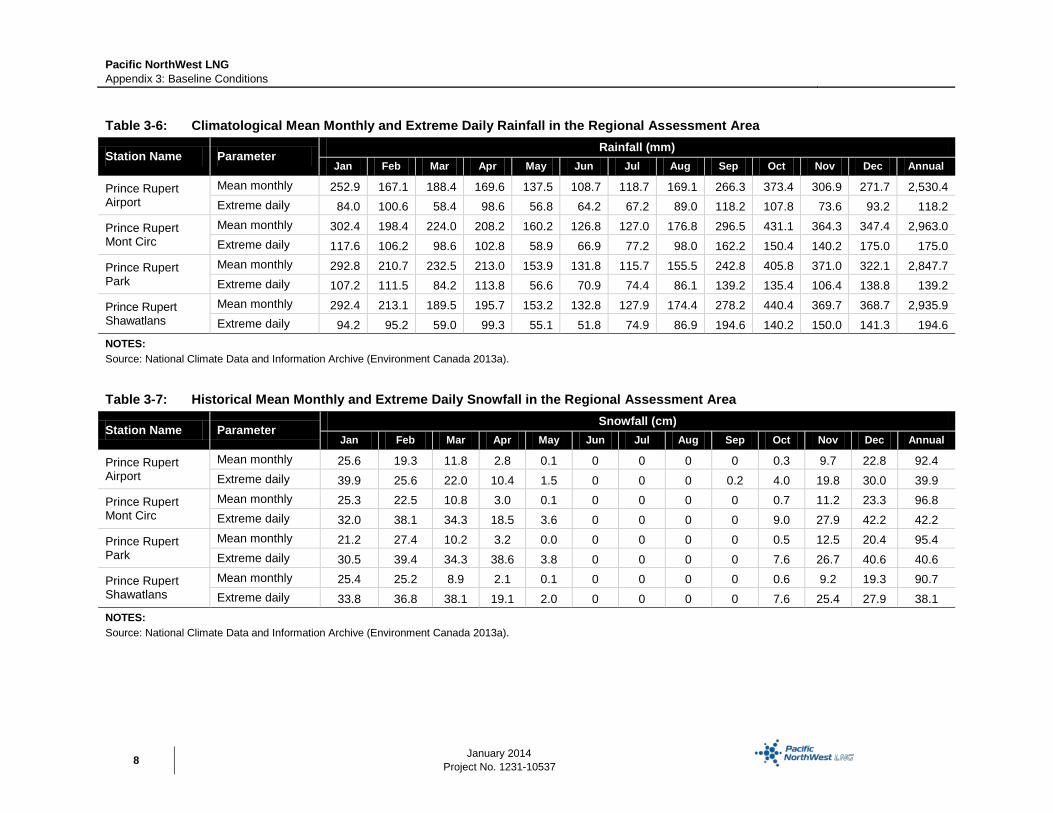
2.2 Precipitation The monthly mean and extreme daily rainfall, snowfall, and total precipitation for four selected CCNSs (Prince Rupert Airport, Prince Rupert Mont Circ, Prince Rupert Park and Prince Rupert Shawatlans) near the Project were assessed (Table 3-6, Table 3-7, and Table 3-8, respectively). Precipitation rates were not monitored by the Prince Rupert Airport AWOS (2007 to 2010).
October to December were typically the wettest months of the year, while June through August were the driest (Table 3-6 and Figure 3-3). The extreme daily rainfall at any of the sites (194.6 mm) was recorded at the Prince Rupert Shawatlans station in September. For a majority of the year, the monthly average rainfall at the Prince Rupert Airport was less than observed at the other three sites.
Most of the snowfall in the region occurred between December and February (Table 3-7 and Figure 3-4). The extreme daily snowfall at any of the sites (42.2 cm) was recorded at the Prince Rupert Mont Circ station in December. Of the four sites analyzed, the Prince Rupert Shawatlans station had the least normal annual snowfall (90.7 cm) and the Prince Rupert Mont Circ station had the most snowfall (96.8 cm).
Annual average precipitation is considered to be high at all four sites, with the Prince Rupert Mont Circ station having the highest annual precipitation at 3,059.8 mm (Table 3-8). The least precipitation occurred at the Prince Rupert Airport (2,619.1 mm) and the average annual precipitation for all four stations was 2,912.2 mm.

Pacific NorthWest LNG Appendix 3: Baseline Conditions
February 2014
Project No. 1231-10537
7
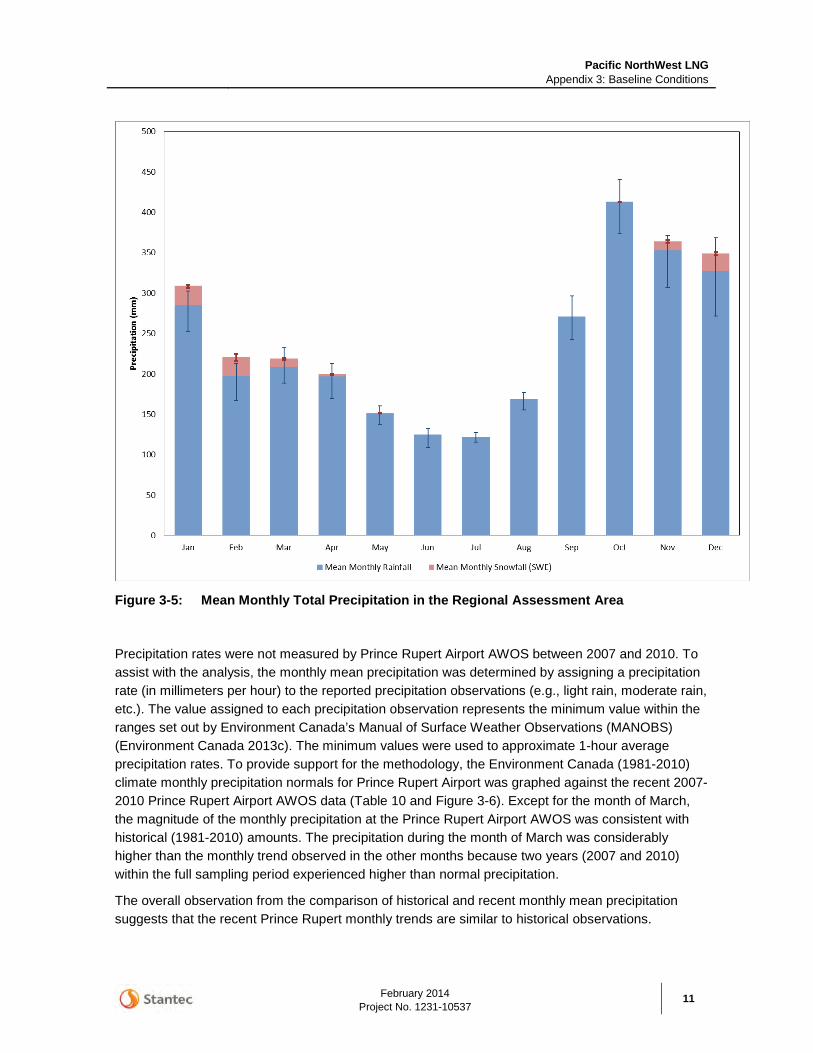
The mean monthly precipitation for the four stations was assessed (Figure 3-5). This figure identifies the contributions of rainfall and snowfall, in snow water equivalent (SWE), to the total precipitation. The vertical lines (also called whiskers) on the plot illustrate the monthly variation of the total precipitation (rainfall and snow) observed at the four stations. The range illustrates the maximum and minimum outliners out of all the stations. The analysis shows that rainfall fluctuates significantly more than the snowfall at the four locations.
Pacific NorthWest LNG Appendix 3: Baseline Conditions
January 2014
Project No. 1231-10537 8
Table 3-6: Climatological Mean Monthly and Extreme Daily Rainfall in the Regional Assessment Area
Station Name Parameter Rainfall (mm)
Jan Feb Mar Apr May Jun Jul Aug Sep Oct Nov Dec Annual
Prince Rupert Airport
Mean monthly 252.9 167.1 188.4 169.6 137.5 108.7 118.7 169.1 266.3 373.4 306.9 271.7 2,530.4 Extreme daily 84.0 100.6 58.4 98.6 56.8 64.2 67.2 89.0 118.2 107.8 73.6 93.2 118.2
Prince Rupert Mont Circ
Mean monthly 302.4 198.4 224.0 208.2 160.2 126.8 127.0 176.8 296.5 431.1 364.3 347.4 2,963.0 Extreme daily 117.6 106.2 98.6 102.8 58.9 66.9 77.2 98.0 162.2 150.4 140.2 175.0 175.0
Prince Rupert Park
Mean monthly 292.8 210.7 232.5 213.0 153.9 131.8 115.7 155.5 242.8 405.8 371.0 322.1 2,847.7 Extreme daily 107.2 111.5 84.2 113.8 56.6 70.9 74.4 86.1 139.2 135.4 106.4 138.8 139.2
Prince Rupert Shawatlans
Mean monthly 292.4 213.1 189.5 195.7 153.2 132.8 127.9 174.4 278.2 440.4 369.7 368.7 2,935.9 Extreme daily 94.2 95.2 59.0 99.3 55.1 51.8 74.9 86.9 194.6 140.2 150.0 141.3 194.6
NOTES: Source: National Climate Data and Information Archive (Environment Canada 2013a).
Table 3-7: Historical Mean Monthly and Extreme Daily Snowfall in the Regional Assessment Area
Station Name Parameter Snowfall (cm)
Jan Feb Mar Apr May Jun Jul Aug Sep Oct Nov Dec Annual
Prince Rupert Airport
Mean monthly 25.6 19.3 11.8 2.8 0.1 0 0 0 0 0.3 9.7 22.8 92.4 Extreme daily 39.9 25.6 22.0 10.4 1.5 0 0 0 0.2 4.0 19.8 30.0 39.9
Prince Rupert Mont Circ
Mean monthly 25.3 22.5 10.8 3.0 0.1 0 0 0 0 0.7 11.2 23.3 96.8 Extreme daily 32.0 38.1 34.3 18.5 3.6 0 0 0 0 9.0 27.9 42.2 42.2
Prince Rupert Park
Mean monthly 21.2 27.4 10.2 3.2 0.0 0 0 0 0 0.5 12.5 20.4 95.4 Extreme daily 30.5 39.4 34.3 38.6 3.8 0 0 0 0 7.6 26.7 40.6 40.6
Prince Rupert Shawatlans
Mean monthly 25.4 25.2 8.9 2.1 0.1 0 0 0 0 0.6 9.2 19.3 90.7 Extreme daily 33.8 36.8 38.1 19.1 2.0 0 0 0 0 7.6 25.4 27.9 38.1
NOTES: Source: National Climate Data and Information Archive (Environment Canada 2013a).

Pacific NorthWest LNG Appendix 3: Baseline Conditions
February 2014
Project No. 1231-10537
9
Table 3-8: Historical Mean Monthly and Extreme Daily Precipitation in the Regional Assessment Area
Station Name Parameter Total Precipitation (mm SWE)
Jan Feb Mar Apr May Jun Jul Aug Sep Oct Nov Dec Annual
Prince Rupert Airport
Mean monthly 276.3 185.6 199.6 172.4 137.6 108.8 118.7 169.1 266.3 373.6 317.0 294.2 2,619.1 Extreme daily 84.0 100.6 58.4 98.6 56.8 64.2 67.2 89.0 118.2 107.8 73.6 93.2 118.2
Prince Rupert Mont Circ
Mean monthly 327.7 220.9 234.8 211.2 160.3 126.8 127.0 176.8 296.5 431.7 375.5 370.6 3,059.8 Extreme daily 117.6 106.2 98.6 102.8 58.9 66.9 77.2 98.0 162.2 150.4 140.2 175.0 175.0
Prince Rupert Park
Mean monthly 314.1 238.1 242.8 216.2 153.9 131.8 115.7 155.5 242.8 406.4 383.5 342.5 2,943.2 Extreme daily 107.2 111.5 84.2 113.8 56.6 70.9 74.4 86.1 139.2 135.4 106.4 138.8 139.2
Prince Rupert Shawatlans
Mean monthly 317.8 238.3 198.4 197.8 153.3 132.8 127.9 174.4 278.2 441.1 378.8 387.9 3,026.7 Extreme daily 94.2 95.2 76.5 99.3 55.1 51.8 74.9 86.9 194.6 140.2 150.0 141.3 194.6
NOTES: Source: National Climate Data and Information Archive (Environment Canada 2013a).

Pacific NorthWest LNG Appendix 3: Baseline Conditions
February 2014
Project No. 1231-10537 10
Figure 3-3: Mean Monthly Rainfall in the Regional Assessment Area
Figure 3-4: Mean Monthly Snowfall in the Regional Assessment Area
Pacific NorthWest LNG Appendix 3: Baseline Conditions
February 2014
Project No. 1231-10537
11
Figure 3-5: Mean Monthly Total Precipitation in the Regional Assessment Area
Precipitation rates were not measured by Prince Rupert Airport AWOS between 2007 and 2010. To assist with the analysis, the monthly mean precipitation was determined by assigning a precipitation rate (in millimeters per hour) to the reported precipitation observations (e.g., light rain, moderate rain, etc.). The value assigned to each precipitation observation represents the minimum value within the ranges set out by Environment Canada’s Manual of Surface Weather Observations (MANOBS) (Environment Canada 2013c). The minimum values were used to approximate 1-hour average precipitation rates. To provide support for the methodology, the Environment Canada (1981-2010) climate monthly precipitation normals for Prince Rupert Airport was graphed against the recent 2007-2010 Prince Rupert Airport AWOS data (Table 10 and Figure 3-6). Except for the month of March, the magnitude of the monthly precipitation at the Prince Rupert Airport AWOS was consistent with historical (1981-2010) amounts. The precipitation during the month of March was considerably higher than the monthly trend observed in the other months because two years (2007 and 2010) within the full sampling period experienced higher than normal precipitation.
The overall observation from the comparison of historical and recent monthly mean precipitation suggests that the recent Prince Rupert monthly trends are similar to historical observations.

Pacific NorthWest LNG Appendix 3: Baseline Conditions
February 2014
Project No. 1231-10537 12
Table 3-9: Mean Monthly Precipitation at the Prince Rupert Airport AWOS
Month Total Precipitation (mm SWE )
2007-2010 a 1981-2010 b
January 319.0 276.3 February 276.9 185.6 March 382.3 199.6 April 246.1 172.4 May 154.9 137.6 June 166.1 108.8 July 118.6 118.7 August 151.9 169.1 September 195.2 266.3 October 364.6 373.6 November 302.1 317.0 December 199.8 294.2 NOTES: a Source: Meteorological Service of Canada (Environment Canada 2013b), Jan 1, 2007 to December 31, 2010 for Prince Rupert AWOS. b Source: National Climate Data and Information Archive (Environment Canada 2013a), Jan 1, 1981 to Dec 31, 2010 for Prince Rupert.
Figure 3-6: Mean Monthly Precipitation at the Prince Rupert Airport AWOS

Pacific NorthWest LNG Appendix 3: Baseline Conditions
February 2014
Project No. 1231-10537
13
The frequency of precipitation events in the Prince Rupert area is generally high year-round. For the Prince Rupert Airport, the Environment Canada (1981-2010) climate normal has 240 days per year, roughly two out of three days, with measureable precipitation (greater than 0.2 millimetres per day). The recent data (2007-2010) indicated that the number of days with precipitation greater than 0.2 mm/day has increased slightly to approximately 260 days per year. The driest months of the year (July-August) average 17 days with rainfall, while the wettest months of the year (March and October) average 24-29 days with measureable precipitation. These conditions tend to maintain high soil moisture content throughout the year. The total number of precipitation days within each month of the year is presented below (Table 3-10 and Figure 3-7).
Table 3-10: Number of Days with Precipitation at the Prince Rupert Airport AWOS
Month Number of Days with Precipitation > 0.2 mm SWE
2007-2010 a 1981-2010 b
January 23.8 22.5
February 19.8 18.5
March 28.8 21.7
April 22.3 19.6
May 18.5 18.3
June 19.5 17.3
July 18.8 17.5
August 17.3 17.5
September 21.3 19.8
October 27.0 24.2
November 22.3 23.8
December 19.5 22.8
Annual 258.5 243.5 NOTES: a Source: Meteorological Service of Canada (Environment Canada 2013b), Jan 1, 2007 to December 31, 2010 for Prince Rupert AWOS. b Source: National Climate Data and Information Archive (Environment Canada 2013a), Jan 1, 1981 to Dec 31, 2010 for Prince Rupert.

Pacific NorthWest LNG Appendix 3: Baseline Conditions
February 2014
Project No. 1231-10537 14
Figure 3-7: Number of Days with Precipitation at the Prince Rupert Airport AWOS
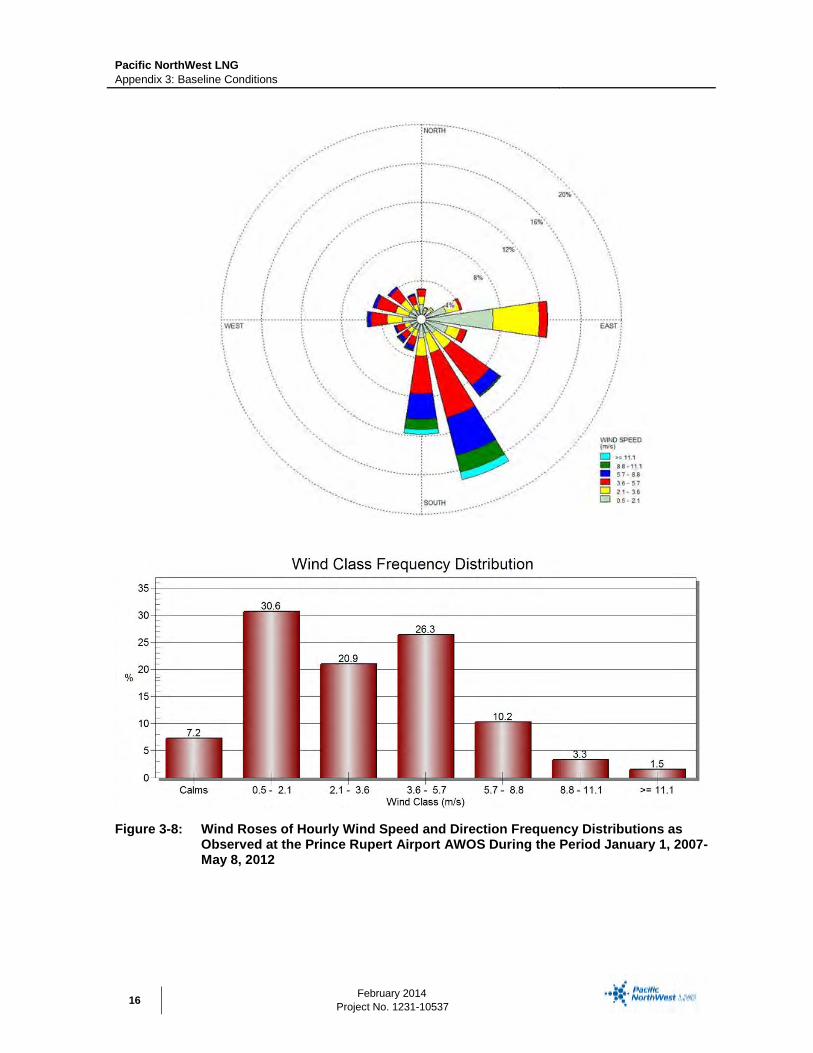
2.3 Wind On the mid-latitude west coast of the North American continent, the prevailing upper level winds are westerly. However, the surface level winds are strongly influenced by topography. Valleys orientated along the axis of the prevailing wind aloft can expect to experience stronger winds, while calm conditions are frequent where sites are sheltered from the ambient winds. The wind observations for the Prince Rupert Airport AWOS and Holland Rock stations form the basis for the wind analyses. A summary of the wind data at each location is provided below (Table 3-11).
Wind roses are a graphic means for presenting wind speed and direction analyses. The length of the radial barbs gives the total percent frequency of winds from the indicated direction, while coloured portions of the barbs indicate the frequency of associated wind speed categories. Wind roses depicting annual wind speed and direction frequency distributions derived from hourly observations at the Prince Rupert Airport AWOS and Holland Rock stations are presented below (Figure 3-8 and Figure 3-9, respectively). The near-surface winds at the Prince Rupert Airport AWOS were predominantly from the southerly through easterly quadrant, suggesting the strong topographic influence. Winds were moderate, averaging 3.5 metres per second (m/s). The 1-hour extreme wind speed in the sampling period was 21.7 m/s with a maximum gust speed of 31.9 m/s. Calm winds (< 0.5 m/s) occurred about 7.2% of the time. The near-surface winds at the Holland Rock station were also predominantly southeasterly, but stronger than the Prince Rupert airport winds due to the more exposed location in Hecate Strait and difference in topography. The average wind speed for Holland Rock was 5.8 m/s. The 1-hour extreme wind speed in the sampling period was 29.4 m/s with a maximum gust speed of 36.7 m/s. Calm winds occurred about 1.1% of the time.

Pacific NorthWest LNG Appendix 3: Baseline Conditions
February 2014
Project No. 1231-10537
15
Table 3-11: Wind Speed Summary Statistics Observed in the Assessment Area
Parameter Units Prince Rupert Airport AWOS Holland Rock
Sampling period Jan 1, 2007 – May 8, 2012 Jan 1, 2007 – June 10, 2013
Total hours No. 34,043 53,856
% 74% 96%
Calm hours No. 2,447 584
Wind speeds < 0. 5 m/s % 7.2% 1.1%
Extreme 1-hr wind speed m/s 21.7 29.4
Average 1-hr wind speed m/s 3.5 5.8
Maximum gust speed m/s 31.9 36.7
Pacific NorthWest LNG Appendix 3: Baseline Conditions
February 2014
Project No. 1231-10537 16
Figure 3-8: Wind Roses of Hourly Wind Speed and Direction Frequency Distributions as Observed at the Prince Rupert Airport AWOS During the Period January 1, 2007-May 8, 2012

Pacific NorthWest LNG Appendix 3: Baseline Conditions
February 2014
Project No. 1231-10537
17
Figure 3-9: Wind Roses of Hourly Wind Speed and Direction Frequency Distributions as Observed at the Holland Rock Meteorology Station During the Period January 1, 2007-June 10, 2013

Pacific NorthWest LNG Appendix 3: Baseline Conditions
February 2014
Project No. 1231-10537 18
2.4 Fog (Visibility) MANOBS (Environment Canada 2013c) defines fog as the suspension of very small water droplets or ice crystals in air, thereby reducing visibility to 0.5 statute miles (0.8 km) or less. To determine the mean number of hours of restricted visibilities due to fog per month, visibility data from the Prince Rupert Airport AWOS were analyzed. Environment Canada climate normals (1981-2010) for Prince Rupert Airport identified the mean number of hours per month with visibility less than 1 km. These data were compared to recent data that align with the MANOBS definition (visibility less than 0.8 km). Data collected for both sample periods is provided below (Table 3-12).
Table 3-12: Mean Number of Hours per Month of Fog at the Prince Rupert Airport AWOS
Month Mean Numbers of Hours of Fog
2007-2010 a 1981-2010 b
January 13.7 8.0
February 5.0 8.5
March 11.0 3.7
April 7.0 4.4
May 8.7 3.0
June 17.0 8.5
July 22.0 19.4
August 31.8 28.8
September 29.3 23.2
October 30.0 15.2
November 6.3 2.6
December 7.0 4.8
Annual 188.6 130.1 NOTES: a Prince Rupert Airport AWOS data from Meteorological Service of Canada (Environment Canada 2013b). Fog defined as visibility less than 0.8 km as per Environment Canada MANOBS. b Prince Rupert Airport data from the National Climate Data and Information Archive (Environment Canada 2013a). Fog defined as visibility less than 1 km.
At Prince Rupert Airport, the climatological (1981-2010) normal of 130 hours per year were considered to have visibilities within the fog criteria. The recent Prince Rupert Airport AWOS data (2007-2010) suggested that fog was present approximately 189 hours per year. Thus, even with a more strict definition of fog (lower restricted visibility criterion) the recent years showed an increase in fog observations compared to the historical dataset. Between November and May, the least amount of fog was present, while from July to October fog conditions could be present for up to 30 hours per month (Figure 3-10).

Pacific NorthWest LNG Appendix 3: Baseline Conditions
February 2014
Project No. 1231-10537
19
Figure 3-10: Mean Number of Hours per Month of Fog at the Prince Rupert AWOS
3 AIR QUALITY Characterization of the RAA air quality was based on ambient monitoring data and a comprehensive regional emissions inventory. The following analysis focuses on this assessment’s substances of interest: SO2, NO2, CO, PM10, PM2.5 and H2S. Baseline concentrations of these CACs were determined by analyzing data from the nearest, most representative air quality monitoring stations. These include historical monitoring stations in the Prince Rupert area as well as current and historical stations in Kitimat, BC.
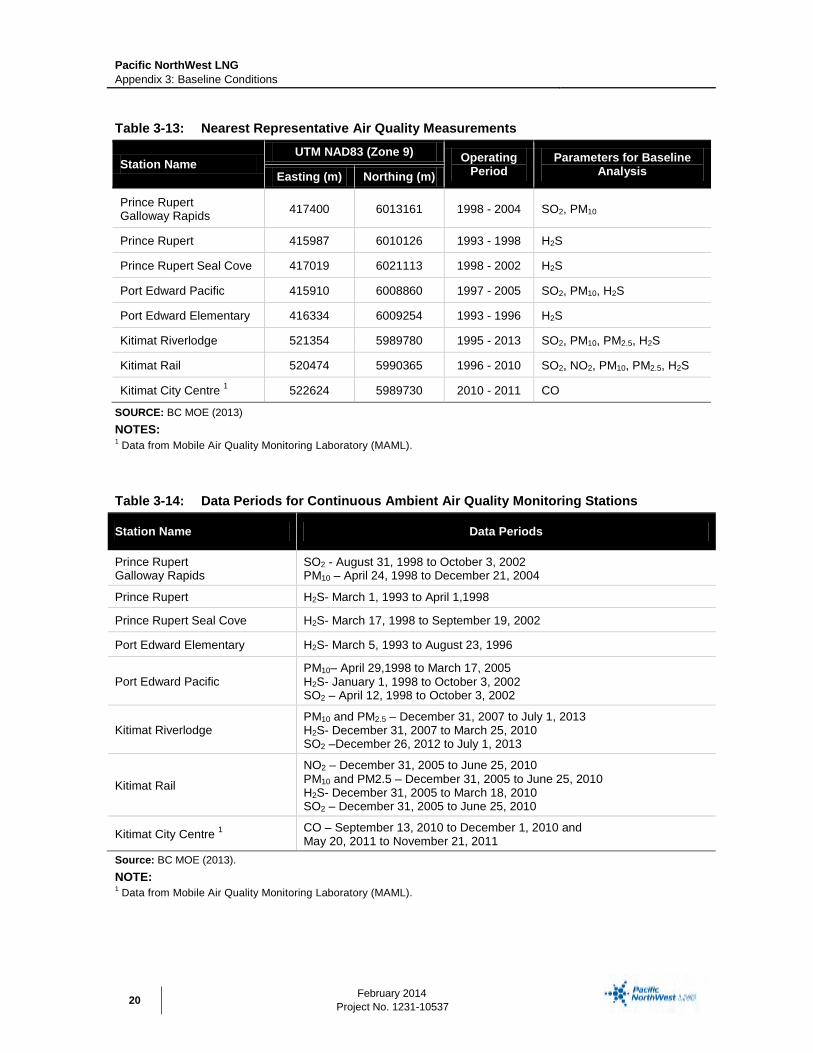
Data were obtained from the BC MOE Air Data Archive (BC MOE 2013). A summary of the station locations and the substances monitored is provided below (Table 3-13). Station locations are shown in Appendix 1 (Figure 1-2). Kitimat monitoring stations were used for substances of interest that have not historically been monitored in the Prince Rupert area. Although the coastal setting is similar to Prince Rupert and Port Edward, the Kitimat data are used with caution in this assessment, because the Kitimat airshed is more heavily industrialized. When available, the most recent five-year data intervals were used to determine baseline concentrations.
The available monitoring intervals for the Table 3-13 stations are provided below (Table 3-14). The process used to select and analyze ambient monitoring data followed the procedure outlined in the Guidelines (BC MOE 2008).
Pacific NorthWest LNG Appendix 3: Baseline Conditions
February 2014
Project No. 1231-10537 20
Table 3-13: Nearest Representative Air Quality Measurements
Station Name UTM NAD83 (Zone 9) Operating
Period Parameters for Baseline
Analysis Easting (m) Northing (m)
Prince Rupert Galloway Rapids 417400 6013161 1998 - 2004 SO2, PM10
Prince Rupert 415987 6010126 1993 - 1998 H2S
Prince Rupert Seal Cove 417019 6021113 1998 - 2002 H2S
Port Edward Pacific 415910 6008860 1997 - 2005 SO2, PM10, H2S
Port Edward Elementary 416334 6009254 1993 - 1996 H2S
Kitimat Riverlodge 521354 5989780 1995 - 2013 SO2, PM10, PM2.5, H2S
Kitimat Rail 520474 5990365 1996 - 2010 SO2, NO2, PM10, PM2.5, H2S
Kitimat City Centre 1 522624 5989730 2010 - 2011 CO
SOURCE: BC MOE (2013) NOTES: 1 Data from Mobile Air Quality Monitoring Laboratory (MAML).
Table 3-14: Data Periods for Continuous Ambient Air Quality Monitoring Stations
Station Name Data Periods
Prince Rupert Galloway Rapids
SO2 - August 31, 1998 to October 3, 2002 PM10 – April 24, 1998 to December 21, 2004
Prince Rupert H2S- March 1, 1993 to April 1,1998
Prince Rupert Seal Cove H2S- March 17, 1998 to September 19, 2002
Port Edward Elementary H2S- March 5, 1993 to August 23, 1996
Port Edward Pacific PM10– April 29,1998 to March 17, 2005 H2S- January 1, 1998 to October 3, 2002 SO2 – April 12, 1998 to October 3, 2002
Kitimat Riverlodge PM10 and PM2.5 – December 31, 2007 to July 1, 2013 H2S- December 31, 2007 to March 25, 2010 SO2 –December 26, 2012 to July 1, 2013
Kitimat Rail
NO2 – December 31, 2005 to June 25, 2010 PM10 and PM2.5 – December 31, 2005 to June 25, 2010 H2S- December 31, 2005 to March 18, 2010 SO2 – December 31, 2005 to June 25, 2010
Kitimat City Centre 1 CO – September 13, 2010 to December 1, 2010 and May 20, 2011 to November 21, 2011
Source: BC MOE (2013). NOTE: 1 Data from Mobile Air Quality Monitoring Laboratory (MAML).
Pacific NorthWest LNG Appendix 3: Baseline Conditions
February 2014
Project No. 1231-10537
21
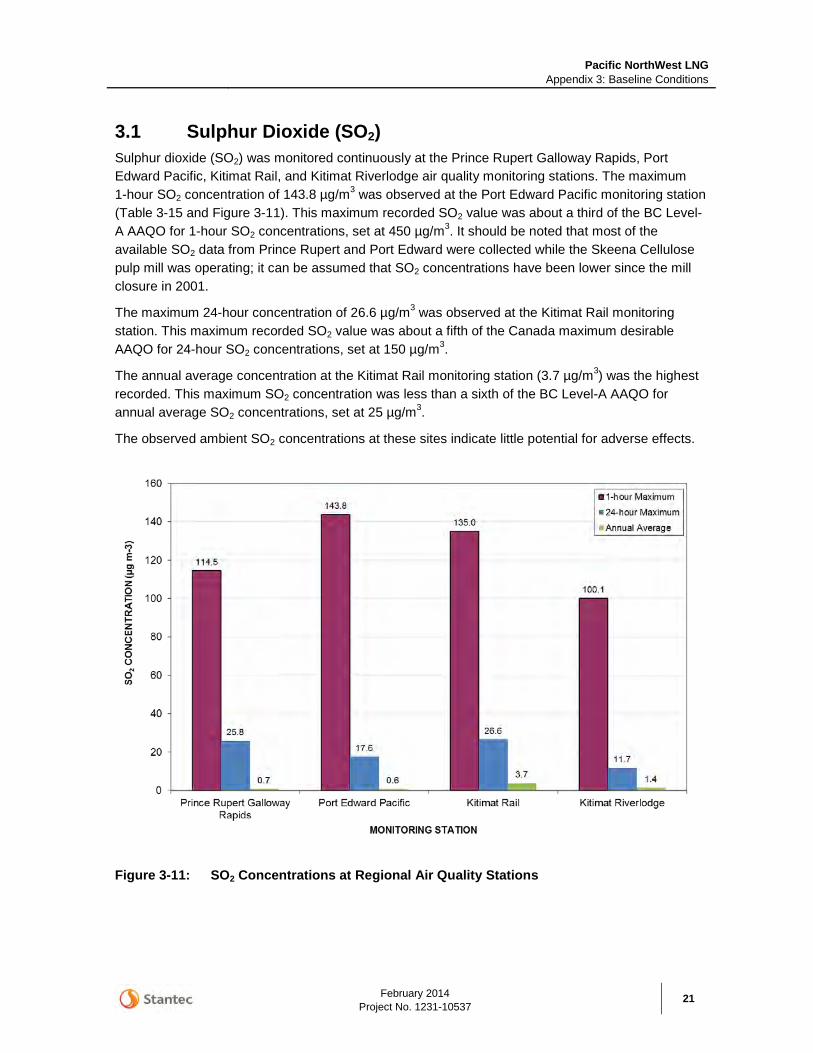
3.1 Sulphur Dioxide (SO2) Sulphur dioxide (SO2) was monitored continuously at the Prince Rupert Galloway Rapids, Port Edward Pacific, Kitimat Rail, and Kitimat Riverlodge air quality monitoring stations. The maximum 1-hour SO2 concentration of 143.8 µg/m3 was observed at the Port Edward Pacific monitoring station (Table 3-15 and Figure 3-11). This maximum recorded SO2 value was about a third of the BC Level-A AAQO for 1-hour SO2 concentrations, set at 450 µg/m3. It should be noted that most of the available SO2 data from Prince Rupert and Port Edward were collected while the Skeena Cellulose pulp mill was operating; it can be assumed that SO2 concentrations have been lower since the mill closure in 2001.
The maximum 24-hour concentration of 26.6 µg/m3 was observed at the Kitimat Rail monitoring station. This maximum recorded SO2 value was about a fifth of the Canada maximum desirable AAQO for 24-hour SO2 concentrations, set at 150 µg/m3.
The annual average concentration at the Kitimat Rail monitoring station (3.7 µg/m3) was the highest recorded. This maximum SO2 concentration was less than a sixth of the BC Level-A AAQO for annual average SO2 concentrations, set at 25 µg/m3.
The observed ambient SO2 concentrations at these sites indicate little potential for adverse effects.
Figure 3-11: SO2 Concentrations at Regional Air Quality Stations

Pacific NorthWest LNG Appendix 3: Baseline Conditions
February 2014
Project No. 1231-10537 22
3.2 Nitrogen Dioxide (NO2) Nitrogen dioxide (NO2) was monitored continuously at the Kitimat Rail air quality station (Table 3-15, Table 3-14). The 1-hour and 24-hour maximum concentrations were measured as 132 µg/m3 and 22.2 µg/m3, respectively (Table 3-17 and Figure 3-12). These values are below the Canada maximum acceptable AAQO limits set for 1-hour and 24-hour averaging periods (400 µg/m3 and 200 µg/m3, respectively).
The annual average concentration (4.1 µg/m3) is below the Canada maximum desirable AAQO concentration of 60 µg/m3. The observed NO2 concentrations in the region are typically well below the objectives and have little potential of causing adverse effects.
Figure 3-12: NO2 Concentrations at Regional Air Quality Stations

Pacific NorthWest LNG Appendix 3: Baseline Conditions
February 2014
Project No. 1231-10537
23
3.3 Carbon Monoxide (CO) Carbon monoxide (CO) was only found to be monitored by a Mobile Air Quality Monitoring Laboratory (MAML) in Kitimat for the periods of September 13 to December 14, 2010 and May 20 to November 21, 2011 (Table 3-12). The measured 1-hour maximum CO concentration of1,176 µg/m3 was below the BC Level-A AAQO of 14,300 µg/m3(Table 3-14 and Figure 3-13). As well, the 8-hour CO concentration of 702 µg/m3 was below the BC Level-A AAQO of 5,500 µg/m3.
These data demonstrate that the CO concentrations are typically well below the objectives and have little potential of causing adverse effects.
Figure 3-13: CO Concentrations at Regional Air Quality Stations

Pacific NorthWest LNG Appendix 3: Baseline Conditions
February 2014
Project No. 1231-10537 24
3.4 Inhalable Particulate Matter (PM10) In the Prince Rupert area, inhalable particulate matter (PM10) was monitored at the Prince Rupert Galloway Rapids and Port Edward Pacific monitoring stations. The maximum 24-hour PM10 concentrations were 33.5 and 39.6 µg/m3 at the Prince Rupert Galloway Rapids and Port Edward Pacific stations, respectively (Table 3-15). These values are less than the applicable BC Level B AAQO for 24-hour average PM10 (50 µg/m3) (Figure 3-14).
Figure 3-14: PM10 Concentrations at Regional Air Quality Stations

Pacific NorthWest LNG Appendix 3: Baseline Conditions
February 2014
Project No. 1231-10537
25
3.5 Respirable Particulate Matter (PM2.5) Respirable (fine) particulate matter (PM2.5) has not historically been measured in Prince Rupert, but has been monitored at two sites in Kitimat: Kitimat Rail and Kitimat Riverlodge (Table 3-14). The 24-hour 98th percentile concentration values were measured to be 12.5 and 9.0 µg/m3 at the Kitimat Rail and Kitimat Riverlodge stations, respectively. The 24-hour 98th percentile concentration was assessed to coincide with the BC objectives. The calculated values are considerably lower than the BC 24-hour AAQO of 25 µg/m3 (Figure 3-15)
The annual arithmetic mean values were calculated to be 3.4 and 2.8 µg/m3 at the Kitimat Rail and Kitimat Riverlodge stations, respectively. These values are less than half of the BC annual average AAQO of 8 µg/m3. These data show that the observed PM2.5 concentrations are typically well below the objectives and have little potential of causing adverse effects.
Figure 3-15: PM2.5 Concentrations at Regional Air Quality Stations

Pacific NorthWest LNG Appendix 3: Baseline Conditions
February 2014
Project No. 1231-10537 26
3.6 Hydrogen Sulphide (H2S) Hydrogen sulphide (H2S) was monitored continuously at six air quality monitoring stations in the Prince Rupert and Kitimat areas. The maximum 1-hour H2S concentrations ranged from 92 µg/m3 at the Port Edward Elementary monitoring station to 21.3 µg/m3 at Prince Rupert Seal Cove (Table 3-15 and Figure 3-16). These values are higher than the applicable BC Level-A AAQO for 1-hour average H2S concentration (7 µg/m3). However, it should be noted that most the data from the Port Edward area were concurrent with the operation of the Skeena Cellulose pulp mill. Pulp mills are known sources of H2S emissions and likely played a role in these observed exceedences. This pulp mill was closed in 2001; consequently, current H2S concentrations are expected to be much lower than the historical values.
At the stations near Prince Rupert and Kitimat, the exceedences occurred less than one percent of the time, as the 1-hour 99% percentile values are below the BC Level-A AAQO. This suggests that the region was periodically subject to short-term odour issues only.
The maximum 24-hour H2S concentrations ranged from 5.9 to 17.8 µg/m3. These values are greater than the BC 3 µg/m3 AAQO for 24-hour H2S concentrations. However, the average 24-hour H2S concentrations were much lower (ranging from 0.2 to 1.2 µg/m3), suggesting that exceedances of the 24-hour AAQO were infrequent, as discussed in the 1-hour results found above.
These data demonstrate that ambient H2S concentrations are strongly correlated with major sources of emissions existing at the time of monitoring. The Prince Rupert region has experienced higher H2S concentrations during the operation of a pulp mill, which has since been decommissioned. In its absence, there are no local sources of H2S; therefore, current concentrations are expected to very low.
Figure 3-16: H2S Concentrations at Regional Air Quality Stations
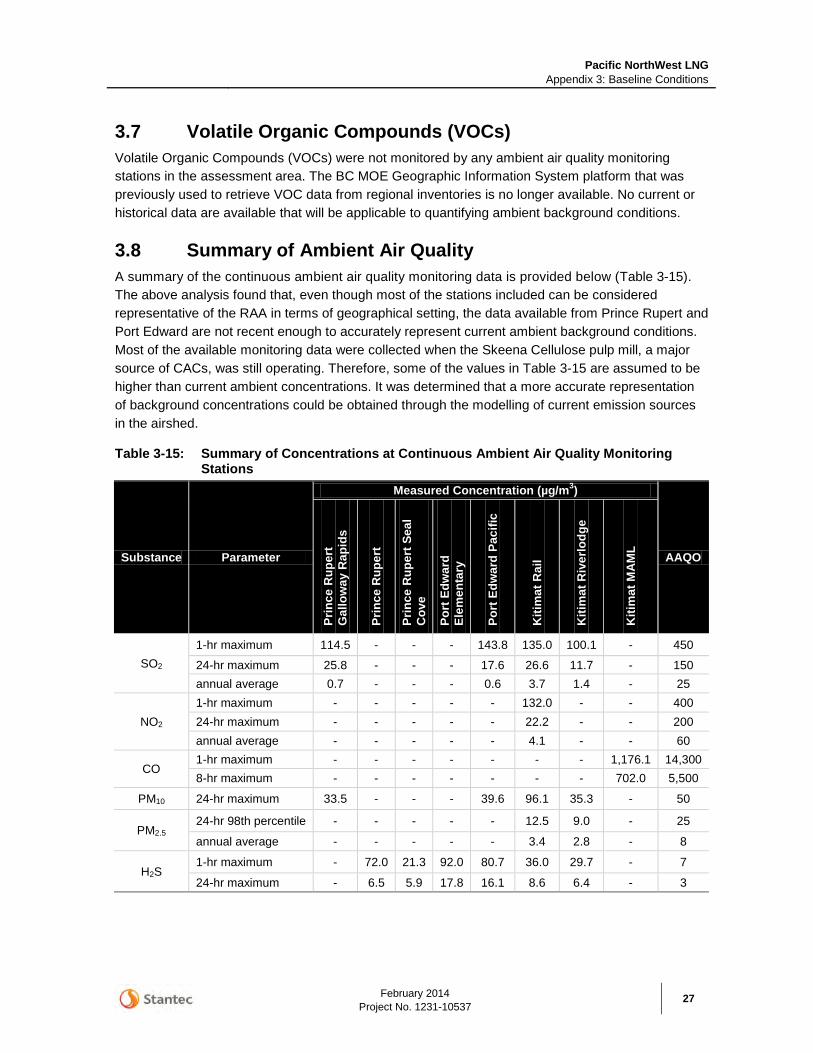
Pacific NorthWest LNG Appendix 3: Baseline Conditions
February 2014
Project No. 1231-10537
27
3.7 Volatile Organic Compounds (VOCs) Volatile Organic Compounds (VOCs) were not monitored by any ambient air quality monitoring stations in the assessment area. The BC MOE Geographic Information System platform that was previously used to retrieve VOC data from regional inventories is no longer available. No current or historical data are available that will be applicable to quantifying ambient background conditions.
3.8 Summary of Ambient Air Quality A summary of the continuous ambient air quality monitoring data is provided below (Table 3-15). The above analysis found that, even though most of the stations included can be considered representative of the RAA in terms of geographical setting, the data available from Prince Rupert and Port Edward are not recent enough to accurately represent current ambient background conditions. Most of the available monitoring data were collected when the Skeena Cellulose pulp mill, a major source of CACs, was still operating. Therefore, some of the values in Table 3-15 are assumed to be higher than current ambient concentrations. It was determined that a more accurate representation of background concentrations could be obtained through the modelling of current emission sources in the airshed.
Table 3-15: Summary of Concentrations at Continuous Ambient Air Quality Monitoring Stations
Substance Parameter
Measured Concentration (µg/m3)
AAQO
Prin
ce R
uper
t G
allo
way
Rap
ids
Prin
ce R
uper
t
Prin
ce R
uper
t Sea
l C
ove
Port
Edw
ard
Elem
enta
ry
Port
Edw
ard
Paci
fic
Kiti
mat
Rai
l
Kiti
mat
Riv
erlo
dge
Kiti
mat
MA
ML
SO2 1-hr maximum 114.5 - - - 143.8 135.0 100.1 - 450
24-hr maximum 25.8 - - - 17.6 26.6 11.7 - 150 annual average 0.7 - - - 0.6 3.7 1.4 - 25
NO2 1-hr maximum - - - - - 132.0 - - 400 24-hr maximum - - - - - 22.2 - - 200 annual average - - - - - 4.1 - - 60
CO 1-hr maximum - - - - - - - 1,176.1 14,300 8-hr maximum - - - - - - - 702.0 5,500
PM10 24-hr maximum 33.5 - - - 39.6 96.1 35.3 - 50
PM2.5 24-hr 98th percentile - - - - - 12.5 9.0 - 25
annual average - - - - - 3.4 2.8 - 8
H2S 1-hr maximum - 72.0 21.3 92.0 80.7 36.0 29.7 - 7
24-hr maximum - 6.5 5.9 17.8 16.1 8.6 6.4 - 3

Pacific NorthWest LNG Appendix 3: Baseline Conditions
February 2014
Project No. 1231-10537 28
4 REFERENCES Environment Canada (EC). 2013a. National Climate Data and Information Archive. Canadian
Climate Normals 1981-2010. Available at: http://www.climate.weatheroffice.ec.gc.ca/climate_normals/index_e.html Accessed: July 2013.
Environment Canada (EC). 2013b. Canadian Climatological Data (Surface). Hourly Weather Conditions for Holland Rock (Climate ID 1063496) and Prince Rupert Airport AWOS (Climate ID 1066483). Meteorological Service of Canada.
Environment Canada (EC). 2013c. MANOBS Manual of Surface Weather Observations. Seventh Edition, Amendment 18. Meteorological Service of Canada. January 2013.
British Columbia Ministry of Environment (BC MOE). 2013. BC Air Data Archive. Available at: http://envistaweb.env.gov.bc.ca/. Accessed: July 2013.
British Columbia Ministry of Environment (BC MOE). 2008. Guidelines for Air Quality Dispersion Modelling in British Columbia. Environmental Protection Division, Environmental Quality Branch, Air Protection Section. Victoria, BC. Available at: http://www.env.gov.bc.ca/epd/bcairquality/reports/pdfs/air_disp_model_08.pdf.

APPENDIX 4 Air Emissions Estimates
Pacific NorthWest LNG Appendix 4: Air Emissions Estimates
February 2014 Project No. 1231-10537
1
1 Introduction ............................................................................................................................. 2
2 Regional Emissions Estimates ............................................................................................. 2
3 Construction Emissions Estimates ...................................................................................... 6
4 Operations Emissions Estimates ....................................................................................... 11 4.1 Land-based Emissions Estimates ................................................................................ 11
4.1.1 Natural Gas Turbines ..................................................................................... 11 4.1.2 Thermal Oxidizers .......................................................................................... 12 4.1.3 Flares ............................................................................................................. 12 4.1.4 Standby Equipment ........................................................................................ 15 4.1.5 Fugitive Piping Component Emissions .......................................................... 17
4.2 Marine-Based Emissions Estimates ............................................................................. 19 4.2.1 LNG Carriers .................................................................................................. 19 4.2.2 Assist Tug Boats ............................................................................................ 22
5 Future Projects Emissions Estimates ................................................................................ 26
6 References ............................................................................................................................ 30 6.1 Literature Cited ............................................................................................................. 30

Pacific NorthWest LNG Appendix 4: Air Emissions Estimates
February 2014
Project No. 1231-10537 2
1 INTRODUCTION This Appendix describes an inventory of air emissions attributed to existing regional sources, Project construction activities, Project operations, and reasonably foreseeable future projects. The substances inventoried include criteria air contaminants (CACs); substances for which ambient air quality objectives have been established. CACs included in this inventory include sulphur dioxide (SO2), nitrogen oxides (NOx), carbon monoxide (CO), and particulate matter (PM10 and PM2.5).
Volatile organic compounds (VOCs) and greenhouse gases (GHG) are quantified for inclusion in other sections of the EIA unrelated to ambient air quality. GHG estimates are quantified in terms of the annual emission rates of carbon dioxide (CO2), methane (CH4) and nitrous oxide (N2O).
2 REGIONAL EMISSIONS ESTIMATES Existing regional emissions information was obtained from previously published documents (Stantec 2009, Stantec 2011). Regional emission details included in dispersion modelling are summarized below for land-based and marine-based activities, and include emissions for the following projects:
Ridley Terminals Inc.
Prince Rupert Grain Limited
Northland Cruise Terminal
Prince Rupert Ferry Terminal (BC Ferries and Alaska Ferries)
Fairview (Phase 1).
Emissions and emission parameters for point and area sources are summarized below (see Table 4-1 and Table 4-2).
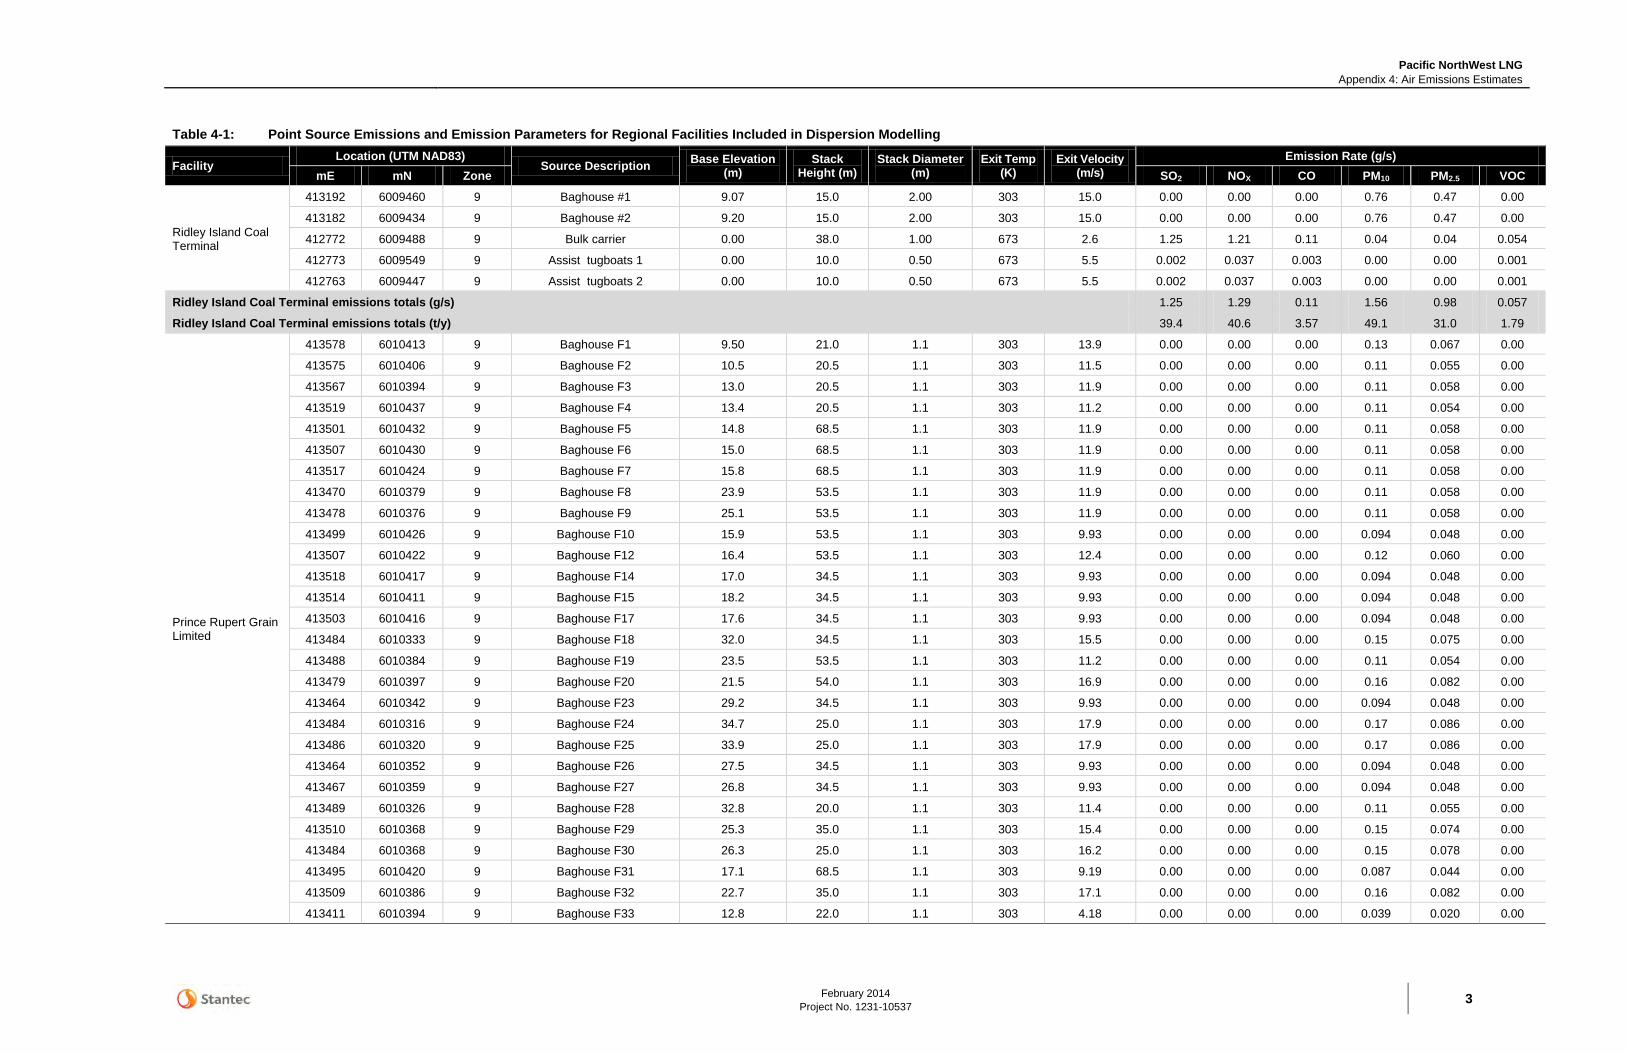
Pacific NorthWest LNG Appendix 4: Air Emissions Estimates
February 2014 Project No. 1231-10537
3
Table 4-1: Point Source Emissions and Emission Parameters for Regional Facilities Included in Dispersion Modelling
Facility Location (UTM NAD83)
Source Description Base Elevation (m)
Stack Height (m)
Stack Diameter (m)
Exit Temp (K)
Exit Velocity
(m/s) Emission Rate (g/s)
mE mN Zone SO2 NOX CO PM10 PM2.5 VOC
Ridley Island Coal Terminal
413192 6009460 9 Baghouse #1 9.07 15.0 2.00 303 15.0 0.00 0.00 0.00 0.76 0.47 0.00
413182 6009434 9 Baghouse #2 9.20 15.0 2.00 303 15.0 0.00 0.00 0.00 0.76 0.47 0.00
412772 6009488 9 Bulk carrier 0.00 38.0 1.00 673 2.6 1.25 1.21 0.11 0.04 0.04 0.054
412773 6009549 9 Assist tugboats 1 0.00 10.0 0.50 673 5.5 0.002 0.037 0.003 0.00 0.00 0.001
412763 6009447 9 Assist tugboats 2 0.00 10.0 0.50 673 5.5 0.002 0.037 0.003 0.00 0.00 0.001
Ridley Island Coal Terminal emissions totals (g/s) 1.25 1.29 0.11 1.56 0.98 0.057
Ridley Island Coal Terminal emissions totals (t/y) 39.4 40.6 3.57 49.1 31.0 1.79
Prince Rupert Grain Limited
413578 6010413 9 Baghouse F1 9.50 21.0 1.1 303 13.9 0.00 0.00 0.00 0.13 0.067 0.00
413575 6010406 9 Baghouse F2 10.5 20.5 1.1 303 11.5 0.00 0.00 0.00 0.11 0.055 0.00
413567 6010394 9 Baghouse F3 13.0 20.5 1.1 303 11.9 0.00 0.00 0.00 0.11 0.058 0.00
413519 6010437 9 Baghouse F4 13.4 20.5 1.1 303 11.2 0.00 0.00 0.00 0.11 0.054 0.00
413501 6010432 9 Baghouse F5 14.8 68.5 1.1 303 11.9 0.00 0.00 0.00 0.11 0.058 0.00
413507 6010430 9 Baghouse F6 15.0 68.5 1.1 303 11.9 0.00 0.00 0.00 0.11 0.058 0.00
413517 6010424 9 Baghouse F7 15.8 68.5 1.1 303 11.9 0.00 0.00 0.00 0.11 0.058 0.00
413470 6010379 9 Baghouse F8 23.9 53.5 1.1 303 11.9 0.00 0.00 0.00 0.11 0.058 0.00
413478 6010376 9 Baghouse F9 25.1 53.5 1.1 303 11.9 0.00 0.00 0.00 0.11 0.058 0.00
413499 6010426 9 Baghouse F10 15.9 53.5 1.1 303 9.93 0.00 0.00 0.00 0.094 0.048 0.00
413507 6010422 9 Baghouse F12 16.4 53.5 1.1 303 12.4 0.00 0.00 0.00 0.12 0.060 0.00
413518 6010417 9 Baghouse F14 17.0 34.5 1.1 303 9.93 0.00 0.00 0.00 0.094 0.048 0.00
413514 6010411 9 Baghouse F15 18.2 34.5 1.1 303 9.93 0.00 0.00 0.00 0.094 0.048 0.00
413503 6010416 9 Baghouse F17 17.6 34.5 1.1 303 9.93 0.00 0.00 0.00 0.094 0.048 0.00
413484 6010333 9 Baghouse F18 32.0 34.5 1.1 303 15.5 0.00 0.00 0.00 0.15 0.075 0.00
413488 6010384 9 Baghouse F19 23.5 53.5 1.1 303 11.2 0.00 0.00 0.00 0.11 0.054 0.00
413479 6010397 9 Baghouse F20 21.5 54.0 1.1 303 16.9 0.00 0.00 0.00 0.16 0.082 0.00
413464 6010342 9 Baghouse F23 29.2 34.5 1.1 303 9.93 0.00 0.00 0.00 0.094 0.048 0.00
413484 6010316 9 Baghouse F24 34.7 25.0 1.1 303 17.9 0.00 0.00 0.00 0.17 0.086 0.00
413486 6010320 9 Baghouse F25 33.9 25.0 1.1 303 17.9 0.00 0.00 0.00 0.17 0.086 0.00
413464 6010352 9 Baghouse F26 27.5 34.5 1.1 303 9.93 0.00 0.00 0.00 0.094 0.048 0.00
413467 6010359 9 Baghouse F27 26.8 34.5 1.1 303 9.93 0.00 0.00 0.00 0.094 0.048 0.00
413489 6010326 9 Baghouse F28 32.8 20.0 1.1 303 11.4 0.00 0.00 0.00 0.11 0.055 0.00
413510 6010368 9 Baghouse F29 25.3 35.0 1.1 303 15.4 0.00 0.00 0.00 0.15 0.074 0.00
413484 6010368 9 Baghouse F30 26.3 25.0 1.1 303 16.2 0.00 0.00 0.00 0.15 0.078 0.00
413495 6010420 9 Baghouse F31 17.1 68.5 1.1 303 9.19 0.00 0.00 0.00 0.087 0.044 0.00
413509 6010386 9 Baghouse F32 22.7 35.0 1.1 303 17.1 0.00 0.00 0.00 0.16 0.082 0.00
413411 6010394 9 Baghouse F33 12.8 22.0 1.1 303 4.18 0.00 0.00 0.00 0.039 0.020 0.00

Pacific NorthWest LNG Appendix 4: Air Emissions Estimates
February 2014
Project No. 1231-10537 4
Facility Location (UTM NAD83)
Source Description Base Elevation (m)
Stack Height (m)
Stack Diameter (m)
Exit Temp (K)
Exit Velocity
(m/s) Emission Rate (g/s)
mE mN Zone SO2 NOX CO PM10 PM2.5 VOC
413403 6010422 9 Baghouse PFL1 11.6 19.0 1.1 303 1.97 0.00 0.00 0.00 0.019 0.009 0.00
413420 6010415 9 Baghouse PFL2 11.9 19.0 1.1 303 1.97 0.00 0.00 0.00 0.019 0.009 0.00
413417 6010408 9 Baghouse PFL3 12.2 19.0 1.1 303 1.97 0.00 0.00 0.00 0.019 0.009 0.00
413399 6010415 9 Baghouse PFL4 11.9 19.0 1.1 303 1.97 0.00 0.00 0.00 0.019 0.009 0.00
413401 6010380 9 Baghouse PLN1 14.4 31.0 1.1 303 5.47 0.00 0.00 0.00 0.791 0.405 0.00
413387 6010386 9 Baghouse PLN2 13.4 31.0 1.1 303 5.47 0.00 0.00 0.00 0.791 0.405 0.00
412910 6010166 9 Baghouse F40 0.00 23.0 1.1 303 8.05 0.00 0.00 0.00 0.076 0.039 0.00
412904 6010169 9 Baghouse F41 0.00 23.0 1.1 303 8.05 0.00 0.00 0.00 0.076 0.039 0.00
412904 6010163 9 Baghouse F42 0.00 23.0 1.1 303 7.44 0.00 0.00 0.00 0.070 0.036 0.00
412907 6010215 9 Baghouse F43 0.00 23.0 1.1 303 7.44 0.00 0.00 0.00 0.070 0.036 0.00
412911 6010265 9 Baghouse F44 0.00 23.0 1.1 303 7.44 0.00 0.00 0.00 0.070 0.036 0.00
412880 6010202 9 Bulk carrier 0.00 38.0 1.0 673 1.80 0.89 0.85 0.076 0.031 0.025 0.038
412867 6010274 9 Assist tugboats 1 0.00 10.0 0.5 673 5.50 0.002 0.04 0.003 0.002 0.002 0.001
412858 6010142 9 Assist tugboats 2 0.00 10.0 0.5 673 5.50 0.002 0.04 0.003 0.002 0.002 0.001
Prince Rupert Grain Limited emissions totals (g/s) 0.89 0.92 0.083 5.28 2.72 0.040
Prince Rupert Grain Limited emissions totals (t/y) 28.2 29.1 2.60 167 85.6 1.28
Northland Cruise Terminal
413949 6019758 9 Cruise ship 0.00 65.0 1.5 d 673 7.80 2.49 3.00 0.23 0.072 0.057 0.090
413937 6019758 9 Assist tugboats 1 0.00 10.0 0.50 673 5.50 0.00 0.04 0.00 0.002 0.002 0.001
413820 6019674 9 Assist tugboats 2 0.00 10.0 0.50 673 5.50 0.00 0.04 0.00 0.002 0.002 0.001
Northland Cruise Terminal emissions totals (g/s) 2.49 3.08 0.24 0.076 0.060 0.093
Northland Cruise Terminal emissions totals (t/y) 78.5 97.0 7.55 2.38 1.91 2.93
Prince Rupert ferry terminal (BC Ferries + Alaska Ferries)
411868 6017558 9 BC Ferries (ferries terminal) 0.00 23.0 1.00 673 1.10 0.25 0.22 0.019 0.006 0.005 0.007
411868 6018058 9 Alaska Ferries (ferries terminal) 0.00 23.0 1.00 673 1.10 0.25 0.062 0.021 0.006 0.005 0.002
Prince Rupert Ferry Terminal (BC Ferries + Alaska Ferries) emissions totals (g/s) 0.50 0.28 0.04 0.01 0.01 0.01
Prince Rupert Ferry Terminal (BC Ferries + Alaska Ferries) emissions totals (t/y) 15.9 8.8 1.27 0.4 0.3 0.29
Fairview Terminal (Phase I) 411422 6016177 9 Ultra-large container ships
(Phase I) 0.00 45.0 1.00 673 3.70 0.003 2.85 0.25 0.093 0.074 0.11
411389 6016194 9 Assist tugboats 1 0.00 10.0 0.50 673 5.50 0.003 0.07 0.01 0.004 0.003 0.00
411389 6015925 9 Assist tugboats 2 0.00 10.0 0.50 673 5.50 0.003 0.07 0.01 0.004 0.003 0.00
Fairview Terminal (Phase I) emissions totals (g/s) 0.009 2.98 0.26 0.10 0.080 0.12
Fairview Terminal (Phase I) emissions totals (t/y) 0.30 94.0 8.09 3.15 2.52 3.73 SOURCE: Fairview Terminal Phase II Expansion Project (Stantec 2009); Canpotex Potash Export Terminal and Ridley Island Road, Rail and Utility Corridor Project (Stantec 2011).
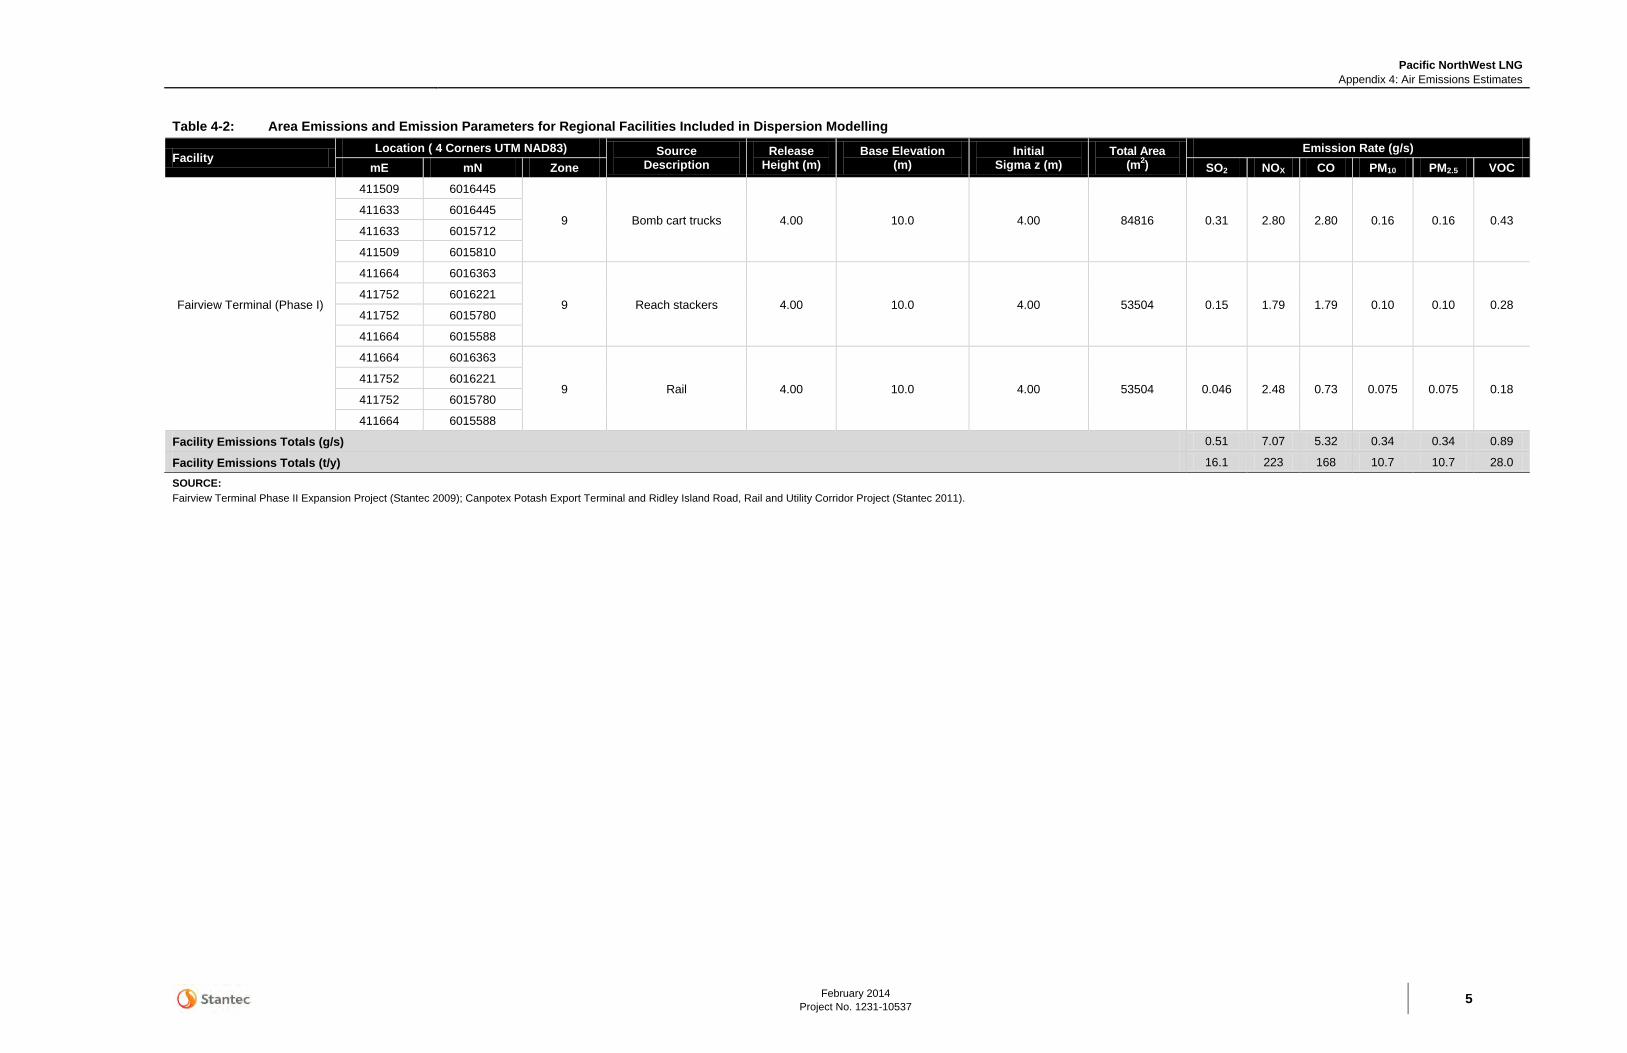
Pacific NorthWest LNG Appendix 4: Air Emissions Estimates
February 2014 Project No. 1231-10537
5
Table 4-2: Area Emissions and Emission Parameters for Regional Facilities Included in Dispersion Modelling
Facility Location ( 4 Corners UTM NAD83) Source
Description Release
Height (m) Base Elevation
(m) Initial
Sigma z (m) Total Area
(m2) Emission Rate (g/s)
mE mN Zone SO2 NOX CO PM10 PM2.5 VOC
Fairview Terminal (Phase I)
411509 6016445
9 Bomb cart trucks 4.00 10.0 4.00 84816 0.31 2.80 2.80 0.16 0.16 0.43 411633 6016445
411633 6015712
411509 6015810
411664 6016363
9 Reach stackers 4.00 10.0 4.00 53504 0.15 1.79 1.79 0.10 0.10 0.28 411752 6016221
411752 6015780
411664 6015588
411664 6016363
9 Rail 4.00 10.0 4.00 53504 0.046 2.48 0.73 0.075 0.075 0.18 411752 6016221
411752 6015780
411664 6015588
Facility Emissions Totals (g/s) 0.51 7.07 5.32 0.34 0.34 0.89
Facility Emissions Totals (t/y) 16.1 223 168 10.7 10.7 28.0
SOURCE: Fairview Terminal Phase II Expansion Project (Stantec 2009); Canpotex Potash Export Terminal and Ridley Island Road, Rail and Utility Corridor Project (Stantec 2011).

Pacific NorthWest LNG Appendix 4: Air Emissions Estimates
February 2014
Project No. 1231-10537 6
3 CONSTRUCTION EMISSIONS ESTIMATES The primary sources of air emissions during the construction phase will be exhaust from diesel combustion by vehicles, heavy equipment and marine activities. This section provides equipment details such as power ratings, fuel consumption, and projected operating times used to develop the construction emissions inventory. The data provided below are based on information from available manufacturer specifications and experience with similar projects.
Fugitive dust emissions associated with vehicle travel and site preparation are expected to be negligible. Emissions of fugitive dust are expected to be low due to high year-round precipitation in the Prince Rupert area and relatively-moist composition of the material handled (muskeg) during construction.
This emissions inventory incorporates equipment fleet requirements over the 52 month construction schedule. During the first year of construction, effort will be directed at establishing road and bridge access to Lelu Island, site preparation and the construction of the Material Offloading Facility. Facility installation, dredging and construction of the trestle will commence once site preparation is completed (years 2 to 5).
The CAC emissions were determined using the following equation:
𝐸𝐸𝐸𝐸𝐸𝐸𝐸𝐸𝐸𝐸𝐸𝐸𝐸𝐸𝐸𝐸𝐸𝐸 (𝑡𝑡) = 𝑂𝑂𝑂𝑂𝑂𝑂𝑂𝑂𝑂𝑂𝑡𝑡𝐸𝐸𝐸𝐸𝑂𝑂 𝐻𝐻𝐸𝐸𝐻𝐻𝑂𝑂𝐸𝐸 × 𝐸𝐸𝐸𝐸𝑂𝑂𝐸𝐸𝐸𝐸𝑂𝑂 𝑃𝑃𝐸𝐸𝑃𝑃𝑂𝑂𝑂𝑂 (𝑘𝑘𝑘𝑘) × 𝐸𝐸𝐸𝐸𝐸𝐸𝐸𝐸𝐸𝐸𝐸𝐸𝐸𝐸𝐸𝐸 𝐹𝐹𝑂𝑂𝐹𝐹𝑡𝑡𝐸𝐸𝑂𝑂 �𝑂𝑂
𝑘𝑘𝑘𝑘 ℎ𝑂𝑂 � × 𝑈𝑈𝐸𝐸𝐸𝐸𝑡𝑡 𝐶𝐶𝐸𝐸𝐸𝐸𝐶𝐶𝑂𝑂𝑂𝑂𝐸𝐸𝐸𝐸𝐸𝐸𝐸𝐸 �𝑡𝑡
106𝑂𝑂 �
All land-based construction equipment was assumed to be model year 2008 or newer. All marine equipment was assumed to be model year 2004 or newer. Some of the highly specialized construction equipment, such as cranes and tug boats, may be older. The engine power associated with each piece of equipment has been sourced from manufacturer information. All equipment is assumed to be powered with diesel fuel except for the tug boats which will require marine fuel oil. Emissions estimates assume 12 hour working days.
Equipment utilization characteristics are summarized below (see Table 4-3 and Table 4-4). Emission factors and rates for each component of the inventory are also provided (see Table 4-5 and Table 4-6). The land-based CAC and VOC emission factors are based on the United States Environmental Protection Agency (US EPA) Tier III emission factors for Nonroad Compression-Ignition Engines (US EPA 2010). The SO2 emissions are based on ultra-low sulphur diesel limit of 15 ppm (EC 2010). The GHG emissions are calculated based on Environment Canada emissions factors for mobile combustion sources (EC 2010).
The marine CAC, VOC and GHG emission factors are based on the US EPA Tier II emission factors for harbour crafts (ICF 2009). The SO2 emissions are based on fuel sulphur content of 1.5% (ICF 2009). Emissions rates for these sources were based on previously-published work (Stantec 2011) and do not include compliance with the International Marine Organization North American Emission Control Area emission standards (MARPOL 2008) expected to take effect in 2015. Based on the proposed clean fuel targets, SO2, NOx and PM emissions from marine vessels are expected to be reduced. For this reason, the construction phase emissions estimated are overly conservative.

Pacific NorthWest LNG Appendix 4: Air Emissions Estimates
February 2014 Project No. 1231-10537
7
Table 4-3: Utilization for Land-Based and Marine Construction Equipment for the Proposed PNW LNG Project (Year 1) a
Activity Vehicle Equipment Type Units Fuel (l/hr)
Power (kW)
Load Factor b
Construction Duration
(months/year/unit)
Construction Duration
(days/year/unit)
Estimated Operation
(hours/year/unit)
Clearing
Brush cutter 2 3.79 45 0.59 6 180 2160 Skidder 2 9.46 112 0.59 6 180 2160
Dozer 2 83.3 231 0.59 6 180 2160
P/U truck 3 20.4 242 0.59 6 180 2160
Dump truck 3 31.8 381 0.59 6 180 2160
Site preparation
Compactor 4 6.44 75 0.59 12 360 4320 Dozer 4 13.6 164 0.59 12 360 4320
P/U truck 5 14.0 168 0.59 12 360 4320
Water truck 2 15.1 179 0.59 12 360 4320
Loader (6m3) 5 17.0 205 0.59 12 360 4320
Grader 3 18.5 221 0.59 12 360 4320
Dump truck (10m3) 10 20.4 242 0.59 12 360 4320
Excavator 6 20.8 250 0.59 12 360 4320
Track drill 4 26.5 317 0.59 12 360 4320
Dump truck (20m3) 12 31.8 381 0.59 12 360 4320
Marine-based construction equipment
Medium crane (22 tonne) 4 18.9 119 0.59 6 180 2160 Drill rig (12.5 tonne) 2 22.7 146 0.59 6 180 2160
Vibro-hammer excavator (17 tonne) 1 37.9 201 0.59 6 180 2160
Dredge (2461 tonne) 1 30.3 1909 0.69 6 180 2160
Large crane (100 tonne) 1 30.3 291 0.59 6 180 2160
Tug boat (1000 hp) 2 60.6 746 0.31 6 180 2160
Freight barge 2 0.0 0.0 0.00 12 360 4320 NOTES: a Equipment specifics (model type and fuel consumption) estimated by Stantec based on experience with similar projects and publically available documents (Stantec 2009, Stantec 2011). b Land-based load factor is assumed to be 0.59 (US EPA 2002). Marine-based load factor assumed to be 0.69 and 0.31 for dredges and tugboats, respectively (ICF 2009).
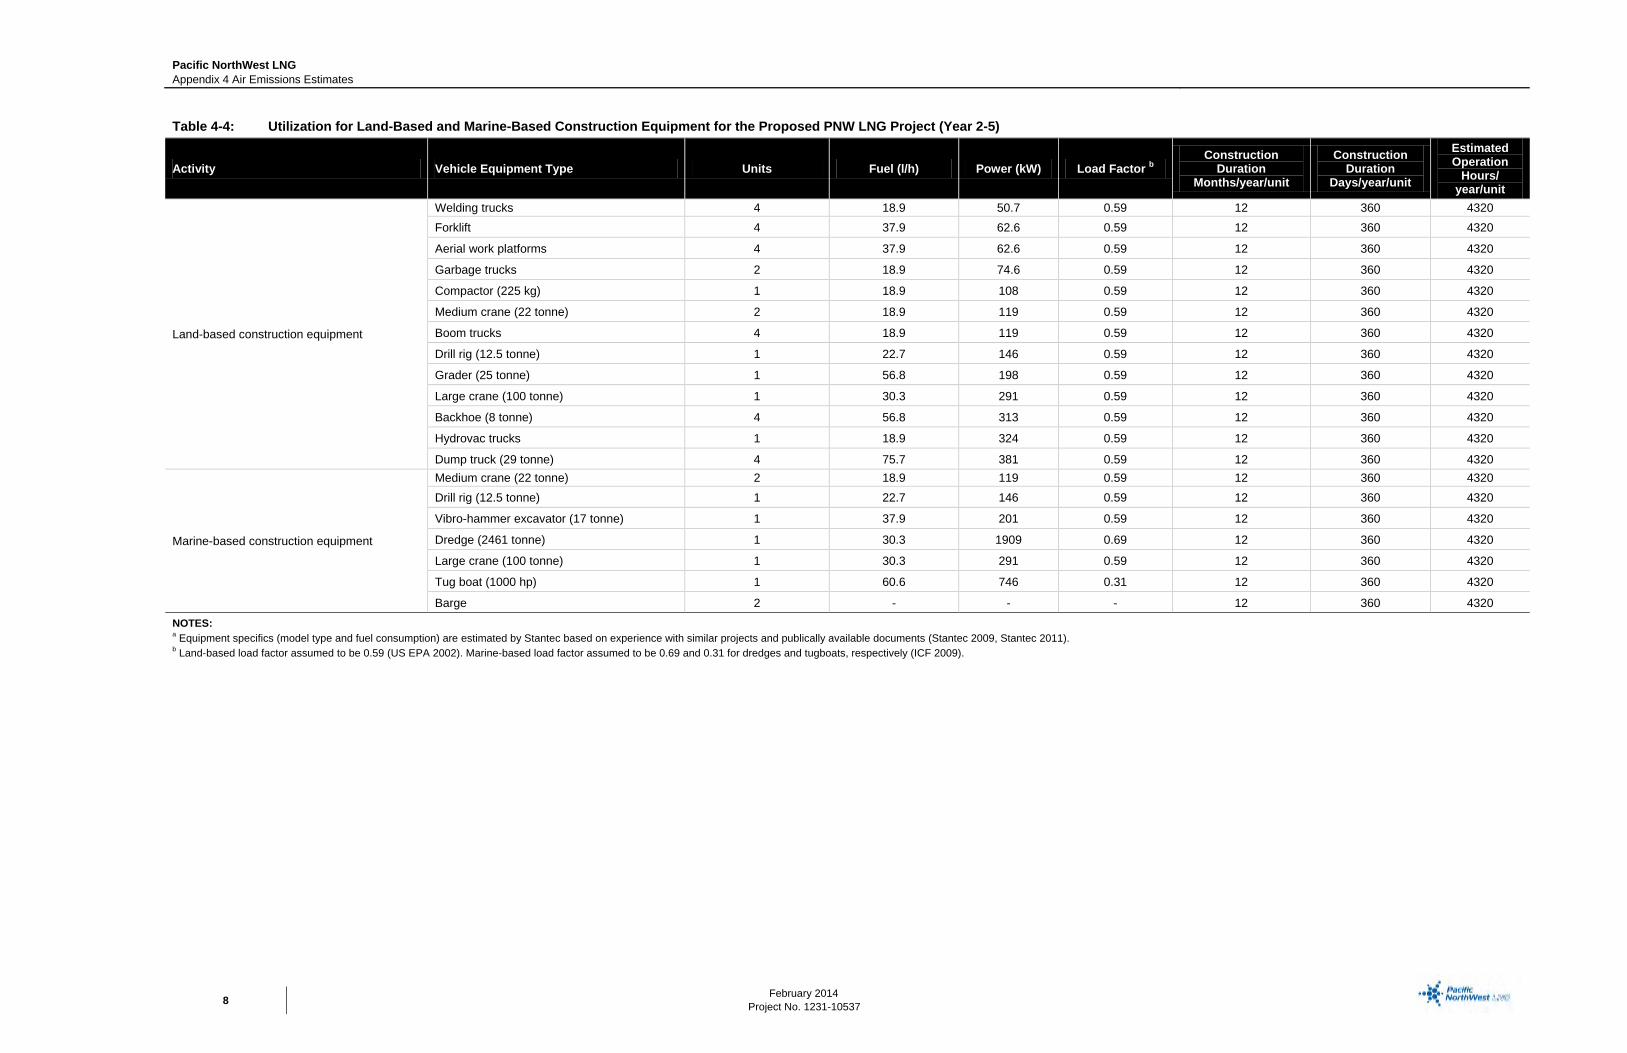
Pacific NorthWest LNG Appendix 4 Air Emissions Estimates
February 2014
Project No. 1231-10537 8
Table 4-4: Utilization for Land-Based and Marine-Based Construction Equipment for the Proposed PNW LNG Project (Year 2-5)
Activity Vehicle Equipment Type Units Fuel (l/h) Power (kW) Load Factor b Construction
Duration Months/year/unit
Construction Duration
Days/year/unit
Estimated Operation
Hours/ year/unit
Land-based construction equipment
Welding trucks 4 18.9 50.7 0.59 12 360 4320 Forklift 4 37.9 62.6 0.59 12 360 4320
Aerial work platforms 4 37.9 62.6 0.59 12 360 4320
Garbage trucks 2 18.9 74.6 0.59 12 360 4320
Compactor (225 kg) 1 18.9 108 0.59 12 360 4320
Medium crane (22 tonne) 2 18.9 119 0.59 12 360 4320
Boom trucks 4 18.9 119 0.59 12 360 4320
Drill rig (12.5 tonne) 1 22.7 146 0.59 12 360 4320
Grader (25 tonne) 1 56.8 198 0.59 12 360 4320
Large crane (100 tonne) 1 30.3 291 0.59 12 360 4320
Backhoe (8 tonne) 4 56.8 313 0.59 12 360 4320
Hydrovac trucks 1 18.9 324 0.59 12 360 4320
Dump truck (29 tonne) 4 75.7 381 0.59 12 360 4320
Marine-based construction equipment
Medium crane (22 tonne) 2 18.9 119 0.59 12 360 4320 Drill rig (12.5 tonne) 1 22.7 146 0.59 12 360 4320
Vibro-hammer excavator (17 tonne) 1 37.9 201 0.59 12 360 4320
Dredge (2461 tonne) 1 30.3 1909 0.69 12 360 4320
Large crane (100 tonne) 1 30.3 291 0.59 12 360 4320
Tug boat (1000 hp) 1 60.6 746 0.31 12 360 4320
Barge 2 - - - 12 360 4320 NOTES: a Equipment specifics (model type and fuel consumption) are estimated by Stantec based on experience with similar projects and publically available documents (Stantec 2009, Stantec 2011). b Land-based load factor assumed to be 0.59 (US EPA 2002). Marine-based load factor assumed to be 0.69 and 0.31 for dredges and tugboats, respectively (ICF 2009).
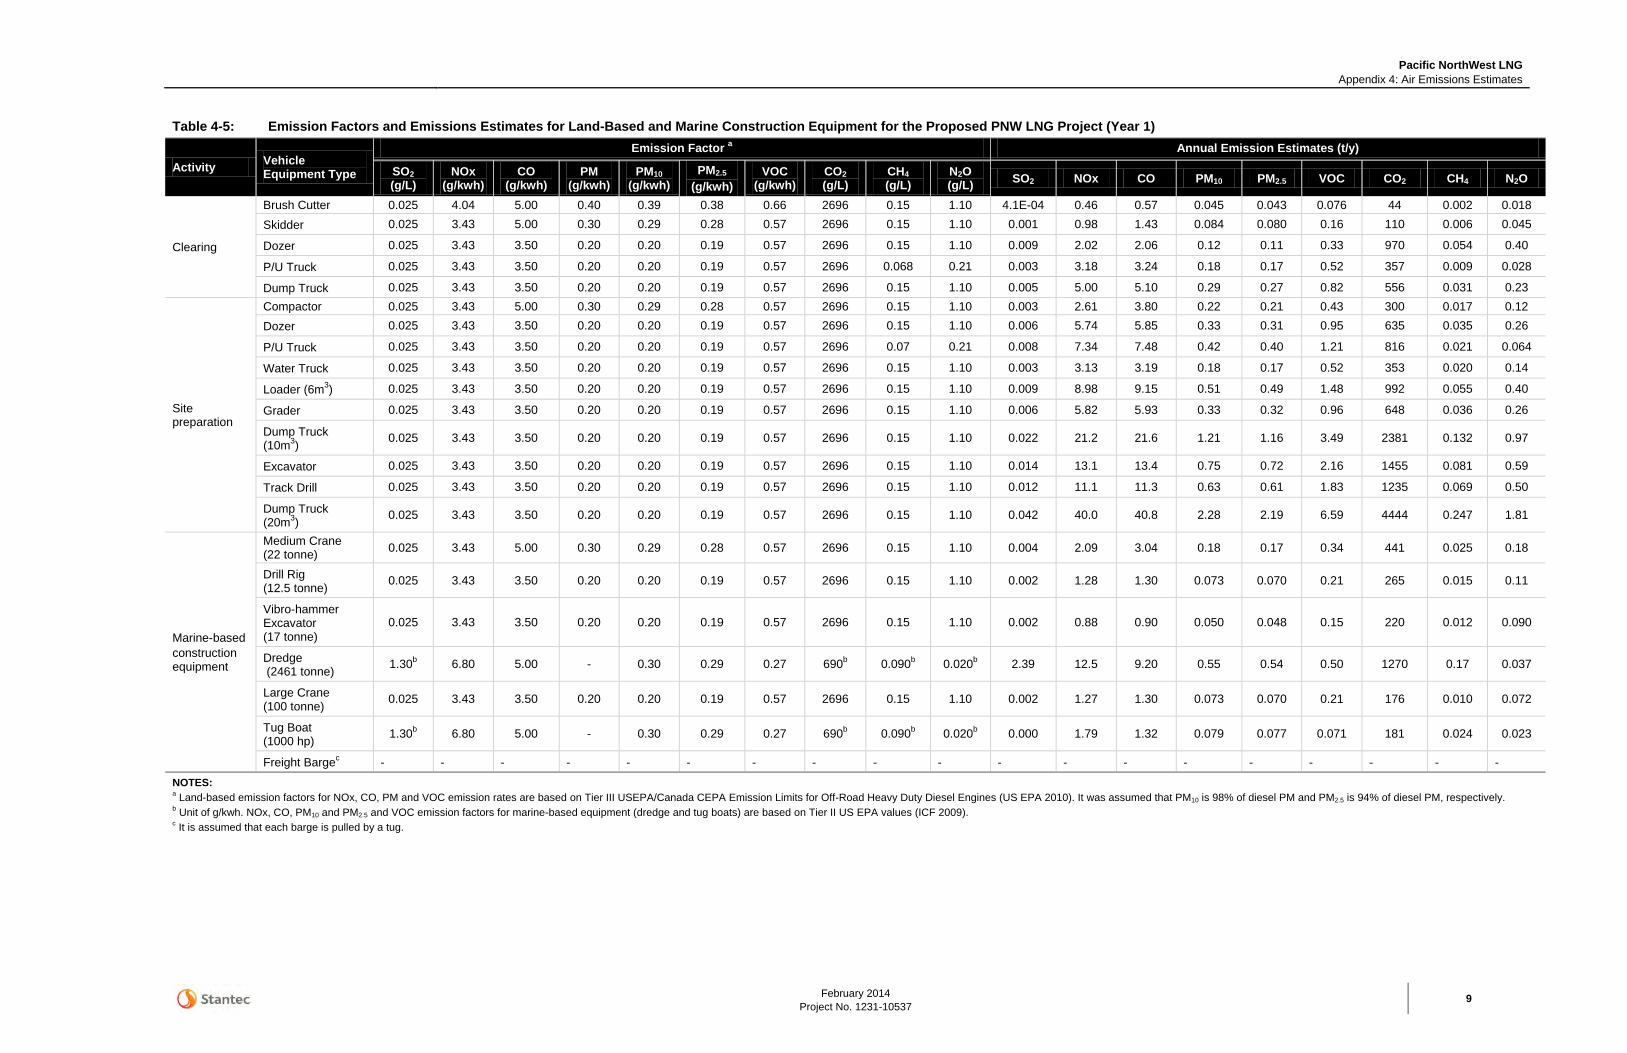
Pacific NorthWest LNG Appendix 4: Air Emissions Estimates
February 2014 Project No. 1231-10537
9
Table 4-5: Emission Factors and Emissions Estimates for Land-Based and Marine Construction Equipment for the Proposed PNW LNG Project (Year 1)
Activity Vehicle Equipment Type
Emission Factor a Annual Emission Estimates (t/y)
SO2 (g/L)
NOx (g/kwh)
CO (g/kwh)
PM (g/kwh)
PM10 (g/kwh)
PM2.5
(g/kwh)
VOC (g/kwh)
CO2 (g/L)
CH4 (g/L)
N2O (g/L) SO2
NOx CO PM10 PM2.5 VOC CO2 CH4 N2O
Clearing
Brush Cutter 0.025 4.04 5.00 0.40 0.39 0.38 0.66 2696 0.15 1.10 4.1E-04 0.46 0.57 0.045 0.043 0.076 44 0.002 0.018 Skidder 0.025 3.43 5.00 0.30 0.29 0.28 0.57 2696 0.15 1.10 0.001 0.98 1.43 0.084 0.080 0.16 110 0.006 0.045
Dozer 0.025 3.43 3.50 0.20 0.20 0.19 0.57 2696 0.15 1.10 0.009 2.02 2.06 0.12 0.11 0.33 970 0.054 0.40
P/U Truck 0.025 3.43 3.50 0.20 0.20 0.19 0.57 2696 0.068 0.21 0.003 3.18 3.24 0.18 0.17 0.52 357 0.009 0.028
Dump Truck 0.025 3.43 3.50 0.20 0.20 0.19 0.57 2696 0.15 1.10 0.005 5.00 5.10 0.29 0.27 0.82 556 0.031 0.23
Site preparation
Compactor 0.025 3.43 5.00 0.30 0.29 0.28 0.57 2696 0.15 1.10 0.003 2.61 3.80 0.22 0.21 0.43 300 0.017 0.12 Dozer 0.025 3.43 3.50 0.20 0.20 0.19 0.57 2696 0.15 1.10 0.006 5.74 5.85 0.33 0.31 0.95 635 0.035 0.26
P/U Truck 0.025 3.43 3.50 0.20 0.20 0.19 0.57 2696 0.07 0.21 0.008 7.34 7.48 0.42 0.40 1.21 816 0.021 0.064
Water Truck 0.025 3.43 3.50 0.20 0.20 0.19 0.57 2696 0.15 1.10 0.003 3.13 3.19 0.18 0.17 0.52 353 0.020 0.14
Loader (6m3) 0.025 3.43 3.50 0.20 0.20 0.19 0.57 2696 0.15 1.10 0.009 8.98 9.15 0.51 0.49 1.48 992 0.055 0.40
Grader 0.025 3.43 3.50 0.20 0.20 0.19 0.57 2696 0.15 1.10 0.006 5.82 5.93 0.33 0.32 0.96 648 0.036 0.26
Dump Truck (10m3) 0.025 3.43 3.50 0.20 0.20 0.19 0.57 2696 0.15 1.10 0.022 21.2 21.6 1.21 1.16 3.49 2381 0.132 0.97
Excavator 0.025 3.43 3.50 0.20 0.20 0.19 0.57 2696 0.15 1.10 0.014 13.1 13.4 0.75 0.72 2.16 1455 0.081 0.59
Track Drill 0.025 3.43 3.50 0.20 0.20 0.19 0.57 2696 0.15 1.10 0.012 11.1 11.3 0.63 0.61 1.83 1235 0.069 0.50
Dump Truck (20m3) 0.025 3.43 3.50 0.20 0.20 0.19 0.57 2696 0.15 1.10 0.042 40.0 40.8 2.28 2.19 6.59 4444 0.247 1.81
Marine-based construction equipment
Medium Crane (22 tonne) 0.025 3.43 5.00 0.30 0.29 0.28 0.57 2696 0.15 1.10 0.004 2.09 3.04 0.18 0.17 0.34 441 0.025 0.18
Drill Rig (12.5 tonne) 0.025 3.43 3.50 0.20 0.20 0.19 0.57 2696 0.15 1.10 0.002 1.28 1.30 0.073 0.070 0.21 265 0.015 0.11
Vibro-hammer Excavator (17 tonne)
0.025 3.43 3.50 0.20 0.20 0.19 0.57 2696 0.15 1.10 0.002 0.88 0.90 0.050 0.048 0.15 220 0.012 0.090
Dredge (2461 tonne) 1.30b 6.80 5.00 - 0.30 0.29 0.27 690b 0.090b 0.020b 2.39 12.5 9.20 0.55 0.54 0.50 1270 0.17 0.037
Large Crane (100 tonne) 0.025 3.43 3.50 0.20 0.20 0.19 0.57 2696 0.15 1.10 0.002 1.27 1.30 0.073 0.070 0.21 176 0.010 0.072
Tug Boat (1000 hp) 1.30b 6.80 5.00 - 0.30 0.29 0.27 690b 0.090b 0.020b 0.000 1.79 1.32 0.079 0.077 0.071 181 0.024 0.023
Freight Bargec - - - - - - - - - - - - - - - - - - - NOTES: a Land-based emission factors for NOx, CO, PM and VOC emission rates are based on Tier III USEPA/Canada CEPA Emission Limits for Off-Road Heavy Duty Diesel Engines (US EPA 2010). It was assumed that PM10 is 98% of diesel PM and PM2.5 is 94% of diesel PM, respectively. b Unit of g/kwh. NOx, CO, PM10 and PM2.5 and VOC emission factors for marine-based equipment (dredge and tug boats) are based on Tier II US EPA values (ICF 2009). c It is assumed that each barge is pulled by a tug.
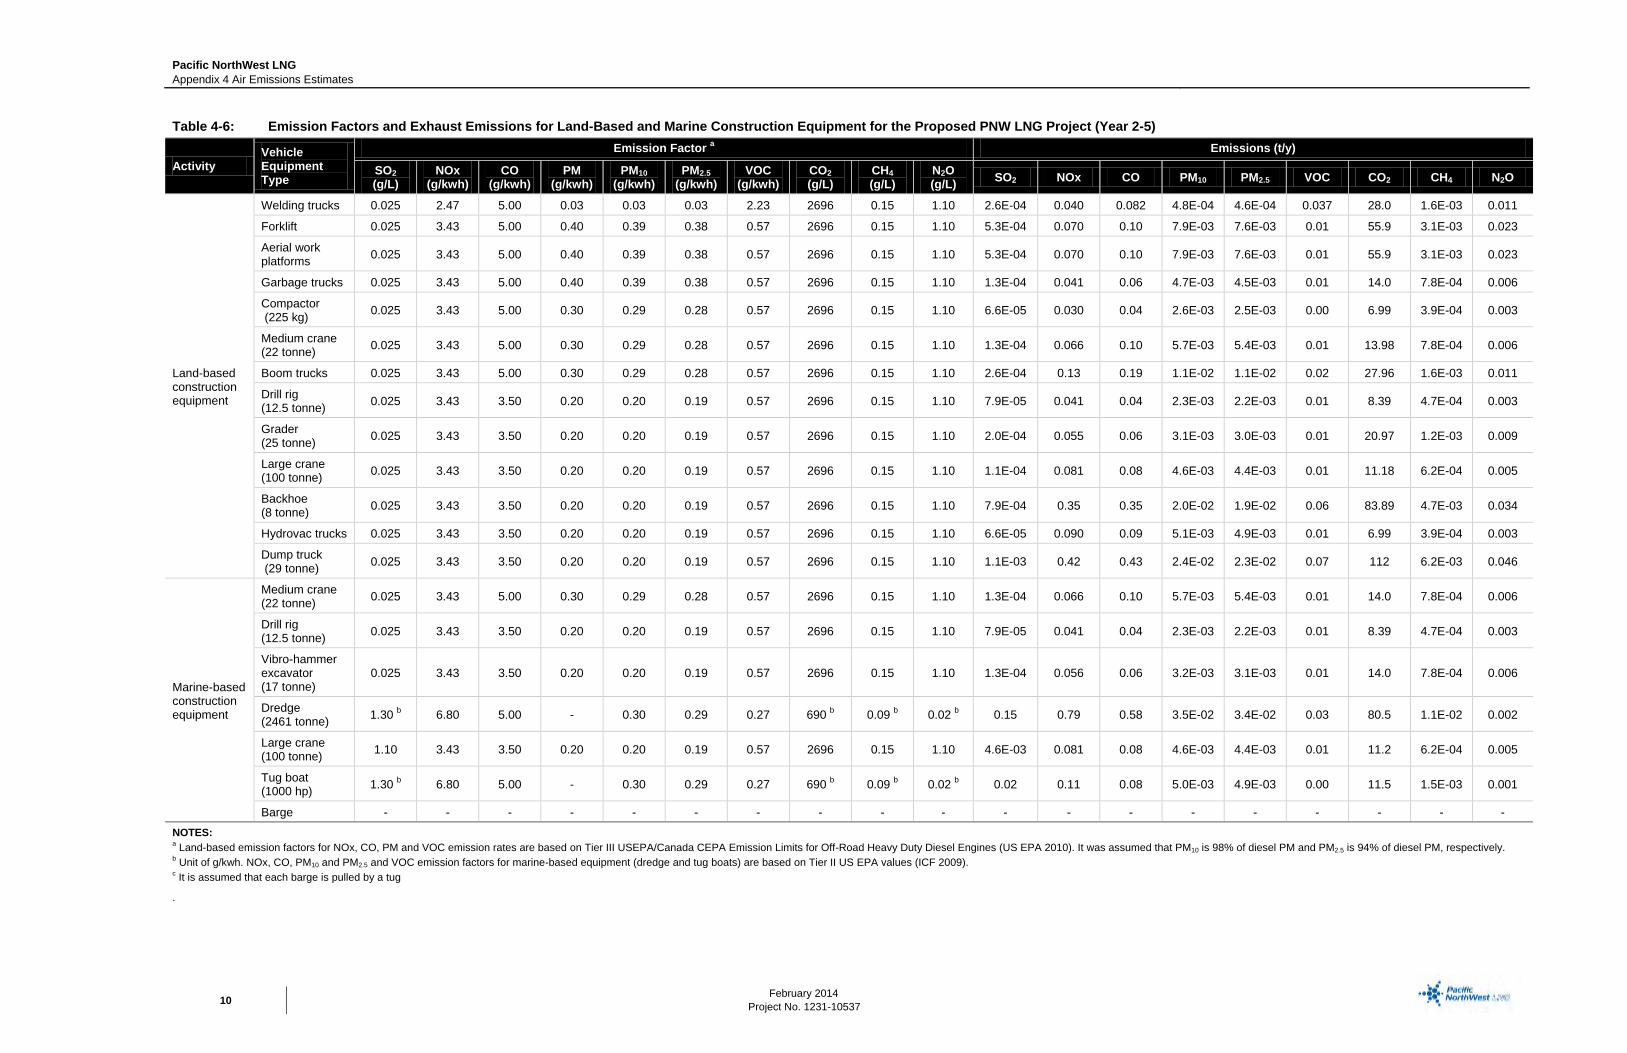
Pacific NorthWest LNG Appendix 4 Air Emissions Estimates
February 2014
Project No. 1231-10537 10
Table 4-6: Emission Factors and Exhaust Emissions for Land-Based and Marine Construction Equipment for the Proposed PNW LNG Project (Year 2-5)
Activity Vehicle Equipment Type
Emission Factor a Emissions (t/y)
SO2 (g/L)
NOx (g/kwh)
CO (g/kwh)
PM (g/kwh)
PM10 (g/kwh)
PM2.5 (g/kwh)
VOC (g/kwh)
CO2 (g/L)
CH4 (g/L)
N2O (g/L) SO2
NOx CO PM10 PM2.5 VOC CO2 CH4 N2O
Land-based construction equipment
Welding trucks 0.025 2.47 5.00 0.03 0.03 0.03 2.23 2696 0.15 1.10 2.6E-04 0.040 0.082 4.8E-04 4.6E-04 0.037 28.0 1.6E-03 0.011
Forklift 0.025 3.43 5.00 0.40 0.39 0.38 0.57 2696 0.15 1.10 5.3E-04 0.070 0.10 7.9E-03 7.6E-03 0.01 55.9 3.1E-03 0.023
Aerial work platforms 0.025 3.43 5.00 0.40 0.39 0.38 0.57 2696 0.15 1.10 5.3E-04 0.070 0.10 7.9E-03 7.6E-03 0.01 55.9 3.1E-03 0.023
Garbage trucks 0.025 3.43 5.00 0.40 0.39 0.38 0.57 2696 0.15 1.10 1.3E-04 0.041 0.06 4.7E-03 4.5E-03 0.01 14.0 7.8E-04 0.006
Compactor (225 kg) 0.025 3.43 5.00 0.30 0.29 0.28 0.57 2696 0.15 1.10 6.6E-05 0.030 0.04 2.6E-03 2.5E-03 0.00 6.99 3.9E-04 0.003
Medium crane (22 tonne) 0.025 3.43 5.00 0.30 0.29 0.28 0.57 2696 0.15 1.10 1.3E-04 0.066 0.10 5.7E-03 5.4E-03 0.01 13.98 7.8E-04 0.006
Boom trucks 0.025 3.43 5.00 0.30 0.29 0.28 0.57 2696 0.15 1.10 2.6E-04 0.13 0.19 1.1E-02 1.1E-02 0.02 27.96 1.6E-03 0.011
Drill rig (12.5 tonne) 0.025 3.43 3.50 0.20 0.20 0.19 0.57 2696 0.15 1.10 7.9E-05 0.041 0.04 2.3E-03 2.2E-03 0.01 8.39 4.7E-04 0.003
Grader (25 tonne) 0.025 3.43 3.50 0.20 0.20 0.19 0.57 2696 0.15 1.10 2.0E-04 0.055 0.06 3.1E-03 3.0E-03 0.01 20.97 1.2E-03 0.009
Large crane (100 tonne) 0.025 3.43 3.50 0.20 0.20 0.19 0.57 2696 0.15 1.10 1.1E-04 0.081 0.08 4.6E-03 4.4E-03 0.01 11.18 6.2E-04 0.005
Backhoe (8 tonne) 0.025 3.43 3.50 0.20 0.20 0.19 0.57 2696 0.15 1.10 7.9E-04 0.35 0.35 2.0E-02 1.9E-02 0.06 83.89 4.7E-03 0.034
Hydrovac trucks 0.025 3.43 3.50 0.20 0.20 0.19 0.57 2696 0.15 1.10 6.6E-05 0.090 0.09 5.1E-03 4.9E-03 0.01 6.99 3.9E-04 0.003
Dump truck (29 tonne) 0.025 3.43 3.50 0.20 0.20 0.19 0.57 2696 0.15 1.10 1.1E-03 0.42 0.43 2.4E-02 2.3E-02 0.07 112 6.2E-03 0.046
Marine-based construction equipment
Medium crane (22 tonne) 0.025 3.43 5.00 0.30 0.29 0.28 0.57 2696 0.15 1.10 1.3E-04 0.066 0.10 5.7E-03 5.4E-03 0.01 14.0 7.8E-04 0.006
Drill rig (12.5 tonne) 0.025 3.43 3.50 0.20 0.20 0.19 0.57 2696 0.15 1.10 7.9E-05 0.041 0.04 2.3E-03 2.2E-03 0.01 8.39 4.7E-04 0.003
Vibro-hammer excavator (17 tonne)
0.025 3.43 3.50 0.20 0.20 0.19 0.57 2696 0.15 1.10 1.3E-04 0.056 0.06 3.2E-03 3.1E-03 0.01 14.0 7.8E-04 0.006
Dredge (2461 tonne) 1.30 b 6.80 5.00 - 0.30 0.29 0.27 690 b 0.09 b 0.02 b 0.15 0.79 0.58 3.5E-02 3.4E-02 0.03 80.5 1.1E-02 0.002
Large crane (100 tonne) 1.10 3.43 3.50 0.20 0.20 0.19 0.57 2696 0.15 1.10 4.6E-03 0.081 0.08 4.6E-03 4.4E-03 0.01 11.2 6.2E-04 0.005
Tug boat (1000 hp) 1.30 b 6.80 5.00 - 0.30 0.29 0.27 690 b 0.09 b 0.02 b 0.02 0.11 0.08 5.0E-03 4.9E-03 0.00 11.5 1.5E-03 0.001
Barge - - - - - - - - - - - - - - - - - - - NOTES: a Land-based emission factors for NOx, CO, PM and VOC emission rates are based on Tier III USEPA/Canada CEPA Emission Limits for Off-Road Heavy Duty Diesel Engines (US EPA 2010). It was assumed that PM10 is 98% of diesel PM and PM2.5 is 94% of diesel PM, respectively. b Unit of g/kwh. NOx, CO, PM10 and PM2.5 and VOC emission factors for marine-based equipment (dredge and tug boats) are based on Tier II US EPA values (ICF 2009). c It is assumed that each barge is pulled by a tug
.
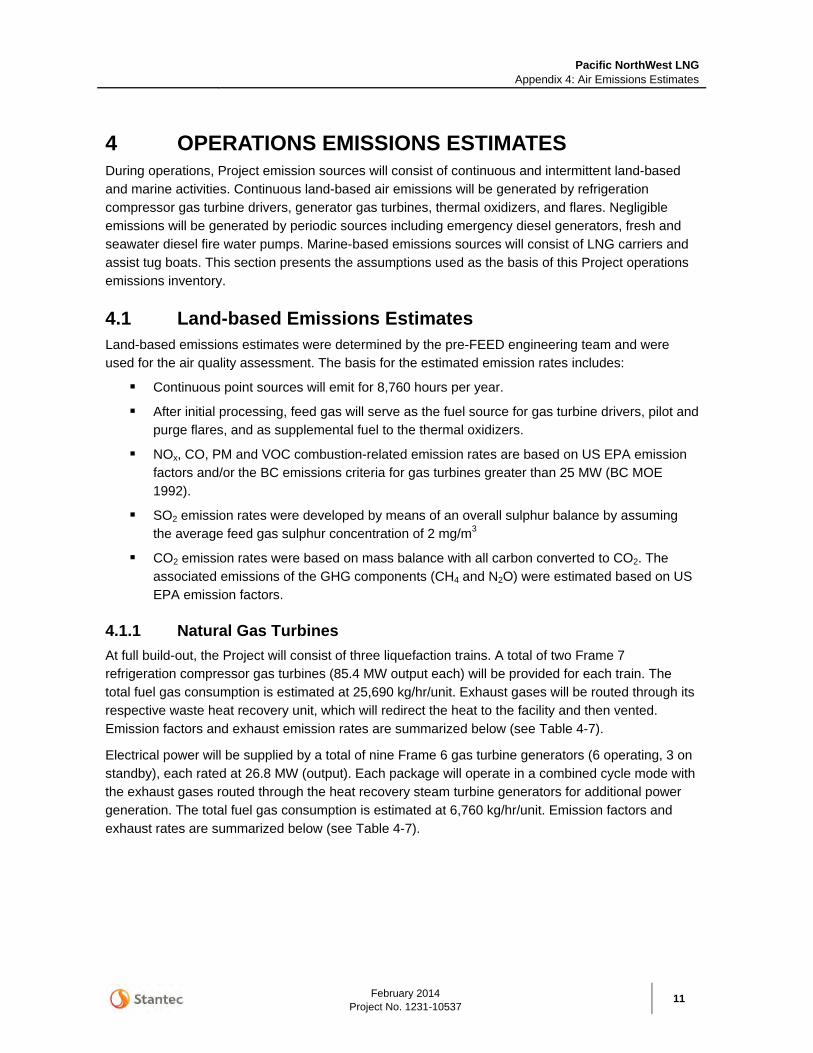
Pacific NorthWest LNG Appendix 4: Air Emissions Estimates
February 2014 Project No. 1231-10537
11
4 OPERATIONS EMISSIONS ESTIMATES During operations, Project emission sources will consist of continuous and intermittent land-based and marine activities. Continuous land-based air emissions will be generated by refrigeration compressor gas turbine drivers, generator gas turbines, thermal oxidizers, and flares. Negligible emissions will be generated by periodic sources including emergency diesel generators, fresh and seawater diesel fire water pumps. Marine-based emissions sources will consist of LNG carriers and assist tug boats. This section presents the assumptions used as the basis of this Project operations emissions inventory.
4.1 Land-based Emissions Estimates Land-based emissions estimates were determined by the pre-FEED engineering team and were used for the air quality assessment. The basis for the estimated emission rates includes:
Continuous point sources will emit for 8,760 hours per year.
After initial processing, feed gas will serve as the fuel source for gas turbine drivers, pilot and purge flares, and as supplemental fuel to the thermal oxidizers.
NOx, CO, PM and VOC combustion-related emission rates are based on US EPA emission factors and/or the BC emissions criteria for gas turbines greater than 25 MW (BC MOE 1992).
SO2 emission rates were developed by means of an overall sulphur balance by assuming the average feed gas sulphur concentration of 2 mg/m3
CO2 emission rates were based on mass balance with all carbon converted to CO2. The associated emissions of the GHG components (CH4 and N2O) were estimated based on US EPA emission factors.
4.1.1 Natural Gas Turbines At full build-out, the Project will consist of three liquefaction trains. A total of two Frame 7 refrigeration compressor gas turbines (85.4 MW output each) will be provided for each train. The total fuel gas consumption is estimated at 25,690 kg/hr/unit. Exhaust gases will be routed through its respective waste heat recovery unit, which will redirect the heat to the facility and then vented. Emission factors and exhaust emission rates are summarized below (see Table 4-7).
Electrical power will be supplied by a total of nine Frame 6 gas turbine generators (6 operating, 3 on standby), each rated at 26.8 MW (output). Each package will operate in a combined cycle mode with the exhaust gases routed through the heat recovery steam turbine generators for additional power generation. The total fuel gas consumption is estimated at 6,760 kg/hr/unit. Emission factors and exhaust rates are summarized below (see Table 4-7).
Pacific NorthWest LNG Appendix 4: Air Emissions Estimates
February 2014
Project No. 1231-10537 12
Both the refrigeration compressor gas turbines and the gas turbine generators share similarities in estimating air emissions. SO2 emission rates were estimated by material balance on basis of fuel gas sulphur content of 2 mg/m3.(assuming hydrogen sulphide (H2S) equivalents NOx and CO emission factors were defined by the BC emissions criteria for gas turbines greater than 24 MW (BC MOE 1992). PM and VOC emission factors were obtained from US EPA (US EPA 2000). CO2 emissions were calculated by material balance with GHG contributions from CH4 and N2O based on the US EPA emission factors (US EPA 2000).
4.1.2 Thermal Oxidizers Each train will include a thermal oxidizer for safe disposal of gases and hydrocarbons removed from the feed gas stream. The acid gas waste stream directed to the incinerator will consist primarily of a CO2 rich stream with lesser amounts of CH4 and H2O as well as minor amounts of H2S and VOCs. Supplemental fuel gas will be supplied to the incinerator to maintain the combustion temperature at a level that will ensure overall contaminant destruction efficiently of 100% (H2S oxidation to SO2). The operations assumed for each of the thermal oxidizers are flow rates of acid gas and supplemental fuel gas at 14.9 kg/hr and 2,444 kg/hr, respectively. Estimated thermal oxidizer emissions are summarized below. SO2 emission rates were estimated by material balance on basis of fuel gas sulphur content of 2 mg/m3. NOx and CO emission factors are representative of vendor guaranteed values. PM and VOC emission factors were obtained from the US EPA (US EPA 1998). CO2 emissions were calculated by material balance and GHG emissions for CH4 and N2O were based on the US EPA emission factors (US EPA 1998). Emission factors and exhaust emission rates are summarized below (see Table 4-7).
4.1.3 Flares The Project will include three flares for reliable and safe disposal of hydrocarbon streams that result from normal operations and upset conditions. The main flare is of a derrick supported multi-riser elevated flare, consisting of the warm, cold and spare flares. The warm flare will handle warm/wet hydrocarbon releases routed from the front end of the LNG process train. The cold flare will handle cold/dry hydrocarbon releases from the liquefaction and refrigeration areas. In addition to the main derrick flare, the low Pressure (LP) flare will handle cold vapour releases from the LNG storage areas.
During normal operations, vent gases are not expected to be routed to the flares and flare emissions will be limited to combustion of pilot and purge gas only (processed feed gas). The Project will apply the non-flaring philosophy during normal operations. Low pressure fuel gas will serve as the pilot and purge gas for each of the three flares. The fuel gas will constitute a mixture of gases from different sources. Air emissions associated with the pilot light flare were determined as a function of the combined fuel gas composition. A 100% conversion efficiency of H2S to SO2 is assumed during normal operations. Each flare will be equipped with an automatic striker system to ensure the pilot flame is on at all times. Since the flares will be smokeless, PM emissions are assumed to be negligible.

Pacific NorthWest LNG Appendix 4: Air Emissions Estimates
February 2014 Project No. 1231-10537
13
The pilot light conditions for each of the three flares assume a fuel gas flow rate of 100 kg/hr each. Estimated flare emissions are summarized below. SO2 emission rates were estimated by material balance on basis of fuel gas sulphur content of 2 mg/m3. NOx, CO and VOC emission factors were obtained from the US EPA (US EPA 1991). CO2 emissions were calculated by material balance with GHG contributions from CH4 and N2O based on the US EPA emission factors (US EPA 2000). Emission factors and exhaust emission rates are summarized below (see Table 4-7).
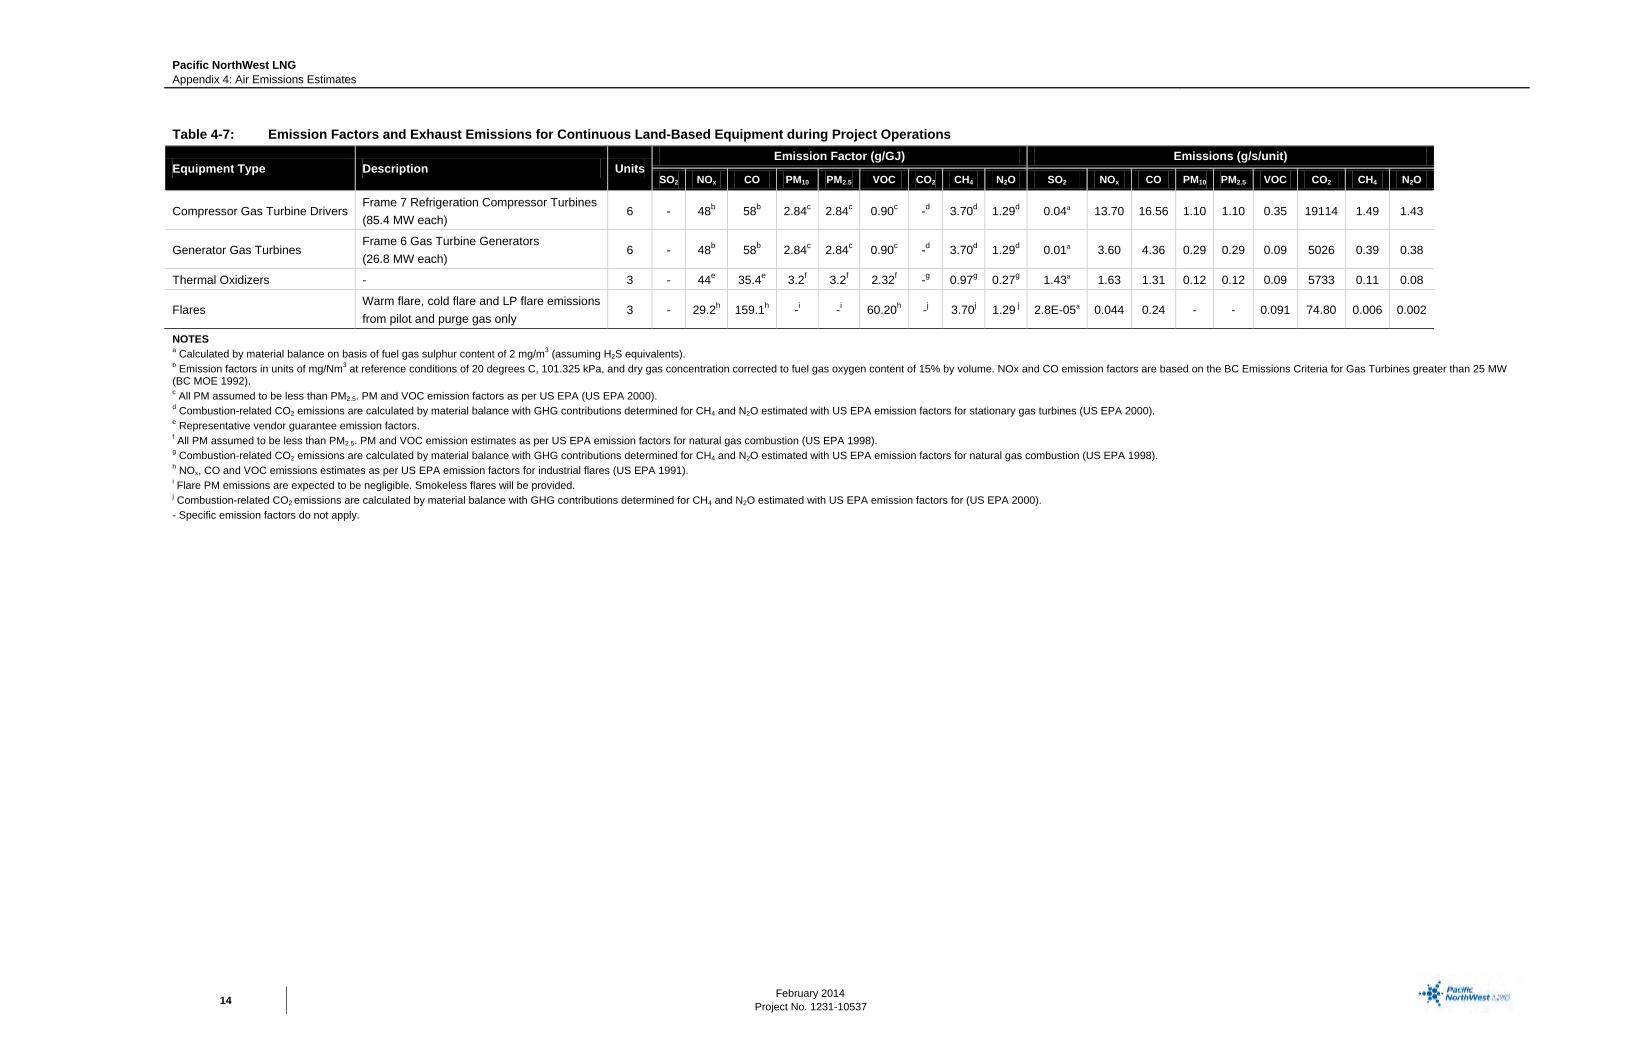
Pacific NorthWest LNG Appendix 4: Air Emissions Estimates
February 2014
Project No. 1231-10537 14
Table 4-7: Emission Factors and Exhaust Emissions for Continuous Land-Based Equipment during Project Operations
Equipment Type Description Units Emission Factor (g/GJ) Emissions (g/s/unit)
SO2 NOx CO PM10 PM2.5 VOC CO2 CH4 N2O SO2 NOx CO PM10 PM2.5 VOC CO2 CH4 N2O
Compressor Gas Turbine Drivers Frame 7 Refrigeration Compressor Turbines (85.4 MW each)
6 - 48b 58b 2.84c 2.84c 0.90c -d 3.70d 1.29d 0.04a 13.70 16.56 1.10 1.10 0.35 19114 1.49 1.43
Generator Gas Turbines Frame 6 Gas Turbine Generators (26.8 MW each)
6 - 48b 58b 2.84c 2.84c 0.90c -d 3.70d 1.29d 0.01a 3.60 4.36 0.29 0.29 0.09 5026 0.39 0.38
Thermal Oxidizers - 3 - 44e 35.4e 3.2f 3.2f 2.32f -g 0.97g 0.27g 1.43a 1.63 1.31 0.12 0.12 0.09 5733 0.11 0.08
Flares Warm flare, cold flare and LP flare emissions from pilot and purge gas only
3 - 29.2h 159.1h -i -i 60.20h -j 3.70j 1.29 j 2.8E-05a 0.044 0.24 - - 0.091 74.80 0.006 0.002
NOTES a Calculated by material balance on basis of fuel gas sulphur content of 2 mg/m3 (assuming H2S equivalents). b Emission factors in units of mg/Nm3 at reference conditions of 20 degrees C, 101.325 kPa, and dry gas concentration corrected to fuel gas oxygen content of 15% by volume. NOx and CO emission factors are based on the BC Emissions Criteria for Gas Turbines greater than 25 MW (BC MOE 1992). c All PM assumed to be less than PM2.5. PM and VOC emission factors as per US EPA (US EPA 2000). d Combustion-related CO2 emissions are calculated by material balance with GHG contributions determined for CH4 and N2O estimated with US EPA emission factors for stationary gas turbines (US EPA 2000). e Representative vendor guarantee emission factors. f All PM assumed to be less than PM2.5. PM and VOC emission estimates as per US EPA emission factors for natural gas combustion (US EPA 1998). g Combustion-related CO2 emissions are calculated by material balance with GHG contributions determined for CH4 and N2O estimated with US EPA emission factors for natural gas combustion (US EPA 1998). h NOx, CO and VOC emissions estimates as per US EPA emission factors for industrial flares (US EPA 1991). i Flare PM emissions are expected to be negligible. Smokeless flares will be provided. j Combustion-related CO2 emissions are calculated by material balance with GHG contributions determined for CH4 and N2O estimated with US EPA emission factors for (US EPA 2000). - Specific emission factors do not apply.

Pacific NorthWest LNG Appendix 4: Air Emissions Estimates
February 2014 Project No. 1231-10537
15
4.1.4 Standby Equipment Project backup equipment will include diesel-driven generators and firewater pumps. A total of six 3.8 MW emergency power generators will be provided to ensure that adequate power is available for the safe shutdown of the facility and to provide the minimum power loads required during extended periods of plant shutdown. A total of three 300 kW fresh-water diesel fired water pumps will be provided to ensure a supply of fresh water firewater is available in the event the main motor driven fresh-water firewater pumps are unavailable. Finally, a total of six 250 kW seawater diesel fire water pumps will be available in the event that the fire water demand exceeds the available fresh water supply.
Under normal operations, none of the diesel driven generators or pumps will be in service. The estimated annual emissions assume an operational frequency of one hour per week per machine (52 hours of the year) for routine maintenance and readiness testing purposes. Estimated emissions associated with the periodic operation of the backup equipment are provided below (see Table 4-8). The table also summarizes all assumptions applied in the estimation.

Pacific NorthWest LNG Appendix 4: Air Emissions Estimates
February 2014
Project No. 1231-10537 16
Table 4-8: Emission Factors and Exhaust Emissions for Backup Land-Based Equipment during Project Operations
Equipment Type Description Units EF (g/GJ) Emissions (g/s/unit)
SO2 NOx CO PM VOC CO2 SO2 NOx CO PM VOC CO2
Emergency diesel generators
3,800 kW 6 - a 7.90b 3.34b 0.43b 0.43b - c 0.24 8.34 3.53 0.45 0.45 758
Freshwater diesel fire water pumps
300 kW 3 - a 18.85d 4.04d 1.34 d 13.13d - c 0.03 1.57 0.34 0.11 1.09 59.7
Seawater diesel fire water pumps
250 kW 6 - a 18.85d 4.04d 1.34d 13.13d - c 0.02 1.31 0.28 0.09 0.91 50.0
NOTES a Calculated by material balance on basis of diesel fuel sulphur content of 500 ppm. b Emission estimates are based on US EPA emission factors for large stationary diesel engines (US EPA 1996a). PM10 is assumed to be equivalent to PM2.5. . c All CO2 emissions are calculated by material balance. d Emission estimates are based on US EPA emission factors for diesel industrial engines (US EPA 1996b). Total PM is assumed to be equivalent to both PM10 and PM2.5.

Pacific NorthWest LNG Appendix 4: Air Emissions Estimates
February 2014 Project No. 1231-10537
17
4.1.5 Fugitive Piping Component Emissions Estimates of fugitive emissions from piping components were obtained from a reference LNG facility and the use of average emission factors developed by the US EPA and the Oil and Gas Processing Industry. Fugitive VOC, CH4 and CO2e emissions for valves, flanges, connectors and pump seals are summarized below (see Table 4-9).
To reduce fugitive GHG emissions, the Project will maximize use of welded joints instead of flanged connections in all components not requiring maintenance. A management system will be implemented that includes an ongoing monitoring and maintenance program to ensure that leaks are detected and remain well controlled.

Pacific NorthWest LNG Appendix 4: Air Emissions Estimates
February 2014
Project No. 1231-10537 18
Table 4-9: Estimated Fugitive Emissions (per train)
Equipment Type Phase Count Emission Factor (kg/hr-component)
Emissions (kg/hr)
Total VOC CH4 CO2e
Valves Gas 1,440 0.0045 6.48 - 6.48 882
Light liquid 360 0.0025 0.90 0.90 - -
Flanges Gas 4,380 0.00039 1.71 - 1.71 61
Light liquid 780 0.00011 0.09 0.09 - -
Connectors Gas 440 0.00020 0.09 - 0.09 0.2
Light liquid 80 0.00021 0.02 0.02 - -
Pump seals Light liquid 50 0.013 0.05 0.65 - -
Total 9.93 1.65 8.28 943 NOTE: Factors vary depending on material used (e.g., gas or light light). “Light light” refers to oil greater than 20o American Petroleum Industry gravity and can be applied to compressor seals, pressure relief valves, agitator seals, and heavy liquid pumps.

Pacific NorthWest LNG Appendix 4: Air Emissions Estimates
February 2014 Project No. 1231-10537
19
4.2 Marine-Based Emissions Estimates This section provides a detailed description of assumptions used to estimate air emissions for LNG carriers and assist tug boats employed in the Operations phase of the Project..
4.2.1 LNG Carriers At full build-out, about 350 LNG carriers are expected to berth at the Project marine terminal per year. The Project marine terminal will be designed to accommodate a variety of LNG carrier sizes. The largest vessel that the terminal is designed to accommodate is the Q-Flex LNG carrier. This carrier is up to 217 m in length and 50 m wide with a 12 m draught. The Q-Flex has capacity to ship up to 217,000 m3 of LNG. In this inventory, all LNG carriers calling on the port are assumed to be equivalent to the Q-Flex carrier. This is a conservative assumption, and emissions from LNG carriers are expected to be lower once the Project commences operations. During a typical port-of-call, each LNG carrier will require about three hours to travel between Triple Point and the Project marine terminal, one hour to maneuver into a berth, one hour to attach the LNG loading arms, 24 hours to load the vessel, one hour to detach the LNG loading arms, one hour to unberth, and three hours to exit the port. During each component of its voyage in Prince Rupert port waters, each LNG carrier will rely on a number of main propulsion engines and auxiliary engines to reach the final destination.
Most ocean-going vessels operate their main propulsion engines on residual oil and have at least two tanks and reserve one for either marine diesel oil or marine gas oil (ICF 2009). Residual oil is a very thick petroleum product which requires heating prior to combustion. Marine diesel and gas oil are refined and used mostly for auxiliary engines for cleaning and cold start-up of propulsion engines. Marine diesel oil is typically used in older ships, whereas gas oil is applied to newer auxiliary engines.
Starting January 1, 2015, vessels travelling within the North American Emission Control Area (ECA) will be required to use fuel with a maximum sulphur limit of 0.1 wt% (MARPOL 2008).This means, vessels will either need to switch to lighter distillate fuel or install appropriate emission control technology. Ships complying with ECA standards will reduce their emissions of SO2, NOx and PM by as much as 86 percent, 74 percent, and 23 percent, respectively (US EPA 2010). Emission factors for ocean-going vessels quote marine gas oil as the only fuel type meeting the 0.1 wt% sulphur content limit (ICF 2009).
Q-flex fuel efficiencies are claimed at 40% versus the conventional steam turbine LNG carriers, due to the use of hybrid propulsion (conventional marine fuel and boil-off gas). As a conservative assumption, this inventory assumed that each LNG carrier will rely on ECA-compliant marine gas oil for propulsion and auxiliary engines.. When implemented for this Project, SO2 emissions generated by the operations of LNG cargo ships will be insubstantial. Should LNG carriers use hybrid propulsion, air emissions are expected to be even lower.
Q-Flex air emissions details were not available for this Project. In their absence, the LNG carrier emission estimates are determined based on US EPA methodology (ICF 2009). LNG carrier
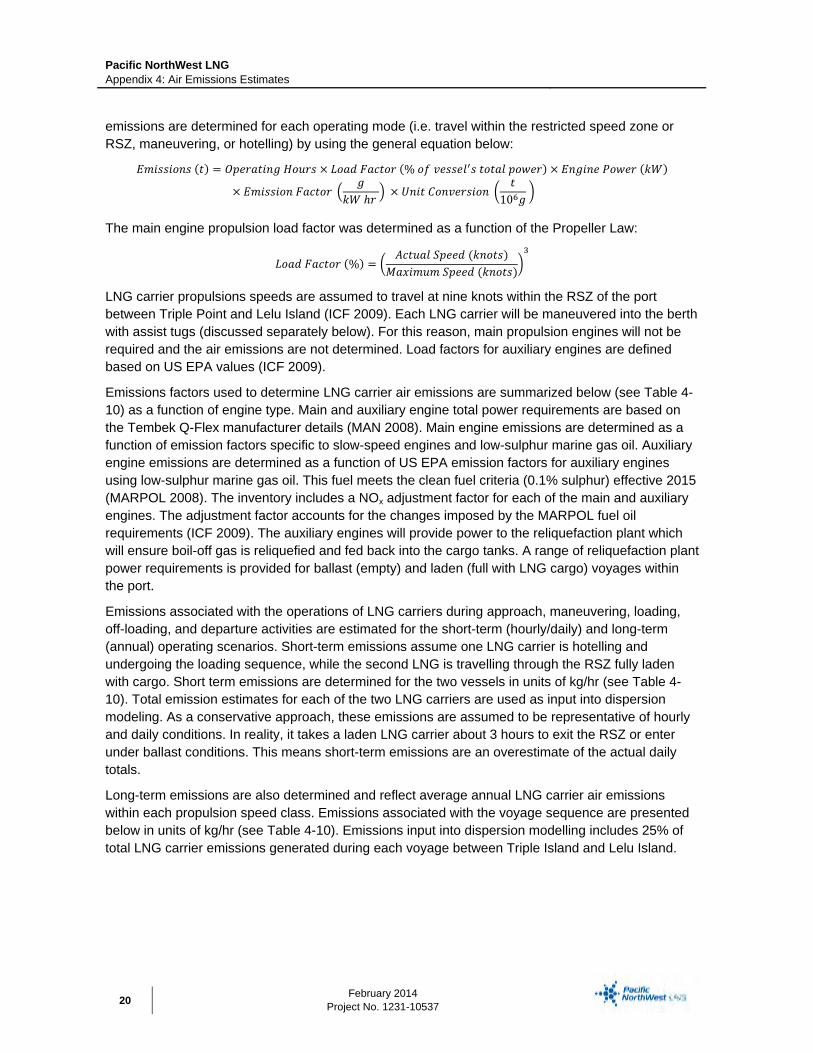
Pacific NorthWest LNG Appendix 4: Air Emissions Estimates
February 2014
Project No. 1231-10537 20
emissions are determined for each operating mode (i.e. travel within the restricted speed zone or RSZ, maneuvering, or hotelling) by using the general equation below:
𝐸𝐸𝐸𝐸𝐸𝐸𝐸𝐸𝐸𝐸𝐸𝐸𝐸𝐸𝐸𝐸𝐸𝐸 (𝑡𝑡) = 𝑂𝑂𝑂𝑂𝑂𝑂𝑂𝑂𝑂𝑂𝑡𝑡𝐸𝐸𝐸𝐸𝑂𝑂 𝐻𝐻𝐸𝐸𝐻𝐻𝑂𝑂𝐸𝐸 × 𝐿𝐸𝐸𝑂𝑂𝑑 𝐹𝐹𝑂𝑂𝐹𝐹𝑡𝑡𝐸𝐸𝑂𝑂 (% 𝐸𝐸𝑓 𝐶𝐶𝑂𝑂𝐸𝐸𝐸𝐸𝑂𝑂𝑙′𝐸𝐸 𝑡𝑡𝐸𝐸𝑡𝑡𝑂𝑂𝑙 𝑂𝑂𝐸𝐸𝑃𝑃𝑂𝑂𝑂𝑂) × 𝐸𝐸𝐸𝐸𝑂𝑂𝐸𝐸𝐸𝐸𝑂𝑂 𝑃𝑃𝐸𝐸𝑃𝑃𝑂𝑂𝑂𝑂 (𝑘𝑘𝑘𝑘)
× 𝐸𝐸𝐸𝐸𝐸𝐸𝐸𝐸𝐸𝐸𝐸𝐸𝐸𝐸𝐸𝐸 𝐹𝐹𝑂𝑂𝐹𝐹𝑡𝑡𝐸𝐸𝑂𝑂 �𝑂𝑂
𝑘𝑘𝑘𝑘 ℎ𝑂𝑂 � × 𝑈𝑈𝐸𝐸𝐸𝐸𝑡𝑡 𝐶𝐶𝐸𝐸𝐸𝐸𝐶𝐶𝑂𝑂𝑂𝑂𝐸𝐸𝐸𝐸𝐸𝐸𝐸𝐸 �𝑡𝑡
106𝑂𝑂 �
The main engine propulsion load factor was determined as a function of the Propeller Law:
𝐿𝐸𝐸𝑂𝑂𝑑 𝐹𝐹𝑂𝑂𝐹𝐹𝑡𝑡𝐸𝐸𝑂𝑂 (%) = �𝐴𝐹𝐹𝑡𝑡𝐻𝐻𝑂𝑂𝑙 𝑆𝑂𝑂𝑂𝑂𝑂𝑂𝑑 (𝑘𝑘𝐸𝐸𝐸𝐸𝑡𝑡𝐸𝐸)
𝑀𝑂𝑂𝑥𝐸𝐸𝐸𝐸𝐻𝐻𝐸𝐸 𝑆𝑂𝑂𝑂𝑂𝑂𝑂𝑑 (𝑘𝑘𝐸𝐸𝐸𝐸𝑡𝑡𝐸𝐸)�3
LNG carrier propulsions speeds are assumed to travel at nine knots within the RSZ of the port between Triple Point and Lelu Island (ICF 2009). Each LNG carrier will be maneuvered into the berth with assist tugs (discussed separately below). For this reason, main propulsion engines will not be required and the air emissions are not determined. Load factors for auxiliary engines are defined based on US EPA values (ICF 2009).
Emissions factors used to determine LNG carrier air emissions are summarized below (see Table 4-10) as a function of engine type. Main and auxiliary engine total power requirements are based on the Tembek Q-Flex manufacturer details (MAN 2008). Main engine emissions are determined as a function of emission factors specific to slow-speed engines and low-sulphur marine gas oil. Auxiliary engine emissions are determined as a function of US EPA emission factors for auxiliary engines using low-sulphur marine gas oil. This fuel meets the clean fuel criteria (0.1% sulphur) effective 2015 (MARPOL 2008). The inventory includes a NOx adjustment factor for each of the main and auxiliary engines. The adjustment factor accounts for the changes imposed by the MARPOL fuel oil requirements (ICF 2009). The auxiliary engines will provide power to the reliquefaction plant which will ensure boil-off gas is reliquefied and fed back into the cargo tanks. A range of reliquefaction plant power requirements is provided for ballast (empty) and laden (full with LNG cargo) voyages within the port.
Emissions associated with the operations of LNG carriers during approach, maneuvering, loading, off-loading, and departure activities are estimated for the short-term (hourly/daily) and long-term (annual) operating scenarios. Short-term emissions assume one LNG carrier is hotelling and undergoing the loading sequence, while the second LNG is travelling through the RSZ fully laden with cargo. Short term emissions are determined for the two vessels in units of kg/hr (see Table 4-10). Total emission estimates for each of the two LNG carriers are used as input into dispersion modeling. As a conservative approach, these emissions are assumed to be representative of hourly and daily conditions. In reality, it takes a laden LNG carrier about 3 hours to exit the RSZ or enter under ballast conditions. This means short-term emissions are an overestimate of the actual daily totals.
Long-term emissions are also determined and reflect average annual LNG carrier air emissions within each propulsion speed class. Emissions associated with the voyage sequence are presented below in units of kg/hr (see Table 4-10). Emissions input into dispersion modelling includes 25% of total LNG carrier emissions generated during each voyage between Triple Island and Lelu Island.

Pacific NorthWest LNG Appendix 4: Air Emissions Estimates
February 2014 Project No. 1231-10537
21
Table 4-10: Short-Term and Long-Term Emission Estimates for two LNG Carriers
Emission Parameters
Short-Term Scenario (Hourly/Daily)
Long-Term Scenario (Annual)
Main Engine
RSZ Auxiliary
RSZ Auxiliary
Hotel Main
Engine RSZ
Auxiliary RSZ
Auxiliary Maneuver
Auxiliary Hotel
Load factor (%) 0.22 0.28 0.26 0.22 0.28 0.33 0.26
Engine power (kW) 37,320 17,500 17,500 37,320 17,500 17,500 17,500
Reliquefaction plant (kW) – ballast - 1,500 3,000 - 1,500 1,500 3,000
Reliquefaction plant (kW) – laden - 6,000 - - 6,000 6,000 -
Fuel sulphur content (%)a 0.10% 0.10% 0.10% 0.10% 0.10% 0.10% 0.10%
ECA NOx control adjustment factor (2020)b 0.60 0.58 0.58 0.60 0.58 0.58 0.58
Total LNG Vessels 1 1 1 350 350 350 350
Total time in port per LNG carrier
Total RSZ time (hours/year) 1 1 - 6 6 - -
25% of RSZ time (hours/year) - - - - - 2 -
Total maneuvering time (hours/year) - - - - - - 26
Total hotelling time (hours/year) - - 1 - - -
Emission factors (ICF 2009)
SO2 (g/kW-hr)c 0.36 0.42 0.42 0.36 0.42 0.42 0.42
NOx (g/kW-hr) c 17.00 13.90 13.90 17.00 13.90 13.90 13.90
CO (g/kW-hr) c 1.40 1.10 1.10 1.40 1.10 1.10 1.10
PM10 (g/kW-hr) c 0.19 0.18 0.18 0.19 0.18 0.18 0.18
PM2.5 (g/kW-hr) c 0.17 0.17 0.17 0.17 0.17 0.17 0.17
HC (g/kW-hr) c 0.60 0.40 0.40 0.60 0.40 0.40 0.40
CO2 (g/kW-hr) c 588.79 690.71 690.71 588.79 690.71 690.71 690.71
CH4 (as CO2e g/kW-hr) c 0.13 0.084 0.084 0.13 0.084 0.084 0.084
N2O (as CO2e g/kW-hr) c 9.61 9.61 9.61 9.61 9.61 9.61 9.61
Emission rates
SO2 (kg/hr) 3.02 2.76 2.57 0.18 0.15 0.24 2.41
NOx (kg/hr as NO2) 85.00 53.43 49.6 5.09 2.90 4.55 46.6
CO (kg/hr) 11.75 7.24 6.72 0.70 0.39 0.62 6.31
PM10 (kg/hr) 1.59 1.18 1.10 0.10 0.06 0.10 1.03
PM2.5 (kg/hr) 1.43 1.12 1.04 0.09 0.06 0.10 0.98
VOC (kg/hr) 5.04 2.63 2.44 0.30 0.14 0.22 2.30

Pacific NorthWest LNG Appendix 4: Air Emissions Estimates
February 2014
Project No. 1231-10537 22
Emission Parameters
Short-Term Scenario (Hourly/Daily)
Long-Term Scenario (Annual)
Main Engine
RSZ Auxiliary
RSZ Auxiliary
Hotel Main
Engine RSZ
Auxiliary RSZ
Auxiliary Maneuver
Auxiliary Hotel
CO2e (kg/hr) 5,023 4167 4279 301 250 392 4,020
CO2 (kg/hr) 4,941 4110 4220 296 246 387 3,964
CH4 (as CO2e kg/hr) 1.06 0.50 0.51 0.06 0.03 0.05 0.48
N2O (as CO2e kg/hr) 80.7 57.18 58.72 4.83 3.43 5.39 55.2
NOTES a Fuel sulphur content defined per MARPOL (MARPOL 2008). b MARPOL NOx adjustment factor applies to marine emissions within the new ECA (ICF 2009). c Emission factors defined by US EPA (ICF 2009) for Slow Speed Diesel main engines and auxiliary engines using low-sulphur marine gas oil.
4.2.2 Assist Tug Boats Pilotage into the port is compulsory for all vessels over 350 gross tonnes. The current pilot boarding station is located off Triple Island, about 49 km from Lelu Island. All LNG carriers will be escorted to Lelu Island with one tug boat. At full build-out, a total of four assist tugs will be assigned to the Project marine terminal. Total operating time for each tug boat is summarized in Table 4-11 (Pers. Comm. May 10, 2013). Total tugboat emission factors are based on manufacturer specifications for Caterpillar 3516C engines. Table 4-12 summarizes emission estimates within each activity type of running, pushing/pulling, and standby (hotelling). The table also provides total tug boat emissions per LNG carrier port-of-call. Each tug will use low sulphur marine diesel fuel.
Tugboat short-term emissions estimates (see Table 4-13) assume two tugboats will be in the running mode and the remaining two will be in standby mode. As a conservative approach, these emissions are assumed to be representative of hourly and daily conditions. In reality, tugboats will spend majority of their activity in standby mode during each LNG carrier port-of-call (see Table 4-11).
Long-term emissions are also determined and reflect average annual tug boat air emissions within each activity type (see Table 4-13). Emissions input into dispersion modelling includes 25% of total tugboat emissions generated during each voyage between Triple Island and Lelu Island.
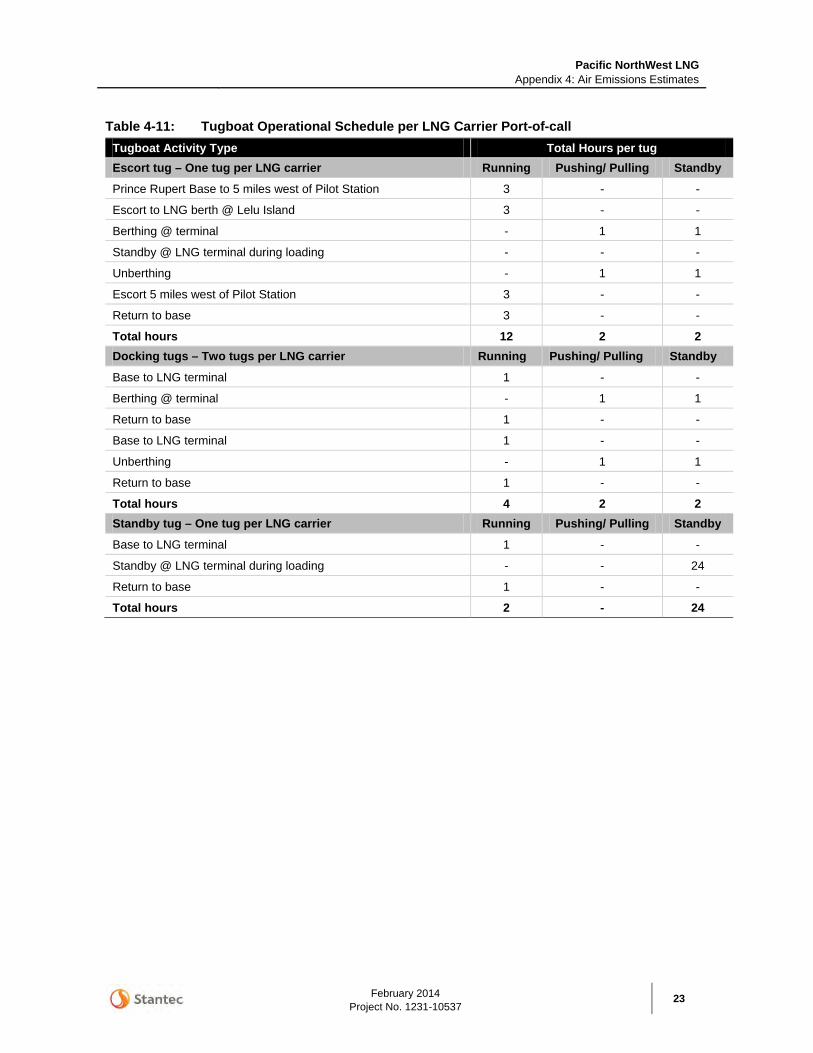
Pacific NorthWest LNG Appendix 4: Air Emissions Estimates
February 2014 Project No. 1231-10537
23
Table 4-11: Tugboat Operational Schedule per LNG Carrier Port-of-call Tugboat Activity Type Total Hours per tug Escort tug – One tug per LNG carrier Running Pushing/ Pulling Standby
Prince Rupert Base to 5 miles west of Pilot Station 3 - -
Escort to LNG berth @ Lelu Island 3 - -
Berthing @ terminal - 1 1
Standby @ LNG terminal during loading - - -
Unberthing - 1 1
Escort 5 miles west of Pilot Station 3 - -
Return to base 3 - -
Total hours 12 2 2 Docking tugs – Two tugs per LNG carrier Running Pushing/ Pulling Standby
Base to LNG terminal 1 - -
Berthing @ terminal - 1 1
Return to base 1 - -
Base to LNG terminal 1 - -
Unberthing - 1 1
Return to base 1 - -
Total hours 4 2 2 Standby tug – One tug per LNG carrier Running Pushing/ Pulling Standby
Base to LNG terminal 1 - -
Standby @ LNG terminal during loading - - 24
Return to base 1 - -
Total hours 2 - 24

Pacific NorthWest LNG Appendix 4: Air Emissions Estimates
February 2014
Project No. 1231-10537 24
Table 4-12: Emission Factors and Exhaust Emissions for Tug Boats
Activity Type kW RPM Emission Factor
(g/kW-hr)a Emissions (g/s/tug)
Total Tug Boat Hours
per LNG carrier call
Total Tug Boat Emission Rate per LNG Carrier Call (kg/carrier call)
SO2 NOx CO PM10 PM2.5b
VOCc CO2 CH4 N2Od SO2 NOx CO PM10 PM2.5 VOC CO2 CH4 N2O SO2
NOx CO PM VOC CO2 CH4 N2O
Running 1,500 1,440 0.19 8.90 0.6 0.05 0.05 0.3 603 0.30 0.02 0.08 3.71 0.25 0.02 0.02 0.13 251 0.13 0.008 22 6.27 294 19.8 1.65 9.90 19,899 9.90 0.66
Pushing/pulling 2,525 1,800 0.19 10.00 0.3 0.04 0.04 0.23 633 0.25 0.02 0.13 7.01 0.21 0.03 0.03 0.16 444 0.18 0.014 44 1.92 101 3.03 0.40 2.32 6,393 2.53 0.20
Standby 100 650 0.24 19.60 1.4 0.07 0.07 0.63 777 0.63 0.02 0.01 0.54 0.04 0.002 0.002 0.02 18.8 0.02 0.0006 30 0.72 58.8 4.20 0.21 1.89 2,031 2.07 0.06 NOTES: a Emission factors are based on Tugboat Caterpillar 3516C main engines. Emissions are assumed to be representative of Project tugboat emissions. b All PM are assumed to be less than PM10. Emission factor for PM2.5 was determined by applying the PM10 to PM2.5 emission factor ratio in auxiliary marine engines using low sulphur marine gas oil (ICF 2009). c Emissions factors are representative of C3H8. d Emission factors are based on Tier II harbour vessels defined by US EPA (ICF 2009).

Pacific NorthWest LNG Appendix 4: Air Emissions Estimates
February 2014 Project No. 1231-10537
25
Table 4-13: Short and Long-Term Tugboat Emissions Parameter Assist Tugboats
Source Modelling ID TUG1 TUG2 TUG3 TUG4
Short term emission rate (g/s)
SO2 0.079 0.079 0.01 0.01
NOx a 3.71 3.71 0.54 0.54
CO 0.25 0.25 0.039 0.039
PM10 0.021 0.021 0.002 0.002
PM2.5 0.020 0.020 0.002 0.002
VOC 0.13 0.13 0.018 0.018
CO2e 256 256 19.38 19.38
CO2 251 251 18.81 18.81
CH4 0.13 0.13 0.02 0.02
N2O 0.01 0.01 0.00 0.00
Long term emission rate (g/s)
SO2 0.012 0.012 0.012 0.012
NOx a 0.647 0.647 0.647 0.647
CO 0.034 0.034 0.034 0.034
PM10 0.003 0.003 0.003 0.003
PM2.5 0.003 0.003 0.003 0.003
VOC 0.019 0.019 0.019 0.019
CO2e 38.0 38.0 38.0 38.0
CO2 37.18 37.18 37.18 37.18
CH4 0.020 0.020 0.020 0.020
N2O 0.001 0.001 0.001 0.001 NOTES: a NOx expressed as NO2 equivalent.

Pacific NorthWest LNG Appendix 4: Air Emissions Estimates
February 2014
Project No. 1231-10537 26
5 FUTURE PROJECTS EMISSIONS ESTIMATES Air emissions from reasonably foreseeable projects located within the RAA were obtained from previously published documents (Stantec 2009, Stantec 2011). Emissions details included in dispersion modelling are summarized below for land-based and marine-based activities, and include emissions for the following projects:
Fairview (Phase 2)
Canpotex Potash Export Terminal
BG Prince Rupert LNG.
To the best of our knowledge, Fairview and Canpotex emissions rates are not compliant with the International ECA emission standards (MARPOL 2008) expected to take effect in 2015. In this context, marine SO2, NOx and CO emissions estimates are considered conservative.
At full build-out the Prince Rupert LNG project will consist of three parallel trains and is expected to produce 21 MTPA of LNG. The facility will rely on natural gas to meet its power requirements. In order to assess potential overlap of project effects on air quality, this assessment assumes BG Prince Rupert LNG emissions are the same as those from PNW LNG. Although the BG Prince Rupert feed gas composition is unknown, the assumption that the facilities emit similar quantities of air emissions is the most quantitative approach for determining land-based emissions. The through-put capacity of the two facilities is comparable.
BG Prince Rupert LNG marine infrastructure will accommodate up to two LNG carriers at any given time with cargo capacity of up to 210,000 m3 each. The project expects a total of 284 vessel calls per year. Project details including feed gas composition, processing, liquefaction and shipping of LNG are not publically disclosed. PNW LNG anticipates 350 vessel calls per year, which is about 23% more than BG Prince Rupert LNG. This suggests that BG Prince Rupert LNG marine emission estimates are likely overestimated in this assessment.
Emissions and emission parameters for point and area sources are summarized below (see Table 4-14 and Table 4-15)

Pacific NorthWest LNG Appendix 4: Air Emissions Estimates
February 2014 Project No. 1231-10537
27
Table 4-14: Emissions and Emission Parameters for Reasonably-Foreseeable Proposed Facilities Included in Dispersion Modelling Point Sources
Facility Location (UTM NAD83)
Source Description Base
Elevation (m)
Stack Height b
(m)
Stack Diameter (m)
Exit Temp (K)
Exit Velocity (m/s)
Emission Rate (g/s)
mE mN Zone SO2 NOX CO PM10 PM2.5 VOC
Fairview Terminal (Phase II) a
411422 6015769 9 Ultra-large container ships (Phase II) 0.00 45.0 1.00 673 9.00 8.53 10.7 0.908 0.34 0.28 0.43 411422 6015361 9 Ultra-large container ships (Phase II) 0.00 45.0 1.00 673 9.00 8.53 10.7 0.908 0.34 0.28 0.43
411389 6015786 9 Assist tugboats (Phase II) 0.00 10.0 0.50 673 5.50 0.00 0.10 0.008 0.005 0.004 0.004
411389 6015516 9 Assist tugboats (Phase II) 0.00 10.0 0.50 673 5.50 0.00 0.10 0.008 0.005 0.004 0.004
411389 6015378 9 Assist tugboats (Phase II) 0.00 10.0 0.50 673 5.50 0.00 0.10 0.008 0.005 0.004 0.004
411389 6015108 9 Assist tugboats (Phase II) 0.00 10.0 0.50 673 5.50 0.00 0.10 0.008 0.005 0.004 0.004
Fairview Terminal (Phase II) Emissions Totals (g/s) 17.1 21.8 1.848 0.71 0.57 0.87
Fairview Terminal (Phase II) Emissions Totals (t/y) 538 688 58.3 22.4 17.9 27.4
Canpotex Potash Terminal b
412824 6008465 9 Cape size bulk carriers 0.00 41.0 1.00 673 9.00 1.16 1.48 0.13 0.12 0.11 0.050 412885 6008248 9 Assist tugboats 0.00 11.0 0.50 673 5.50 0.009 0.18 0.02 0.01 0.01 0.01
412913 6008260 9 Assist tugboats 0.00 11.0 0.50 673 5.50 0.009 0.18 0.02 0.01 0.01 0.01
412784 6008539 9 Assist tugboats 0.00 11.0 0.50 673 5.50 0.009 0.18 0.02 0.01 0.01 0.01
412828 6008549 9 Assist tugboats 0.00 11.0 0.50 673 5.50 0.009 0.18 0.02 0.01 0.01 0.01
412863 6008300 9 Bin vent, BC611 head 0.00 20.0 0.50 293 12.0 0.00 0.00 0.00 0.014 0.007 0.00
412865 6008350 9 Bin vent, BC612 skirting 0.00 9.50 0.50 293 12.0 0.00 0.00 0.00 0.014 0.007 0.00
412855 6008400 9 Bin vent, BC612 tripper head 0.00 31.0 0.50 293 12.0 0.00 0.00 0.00 0.014 0.007 0.00
412822 6008474 9 Bin vent, boom conveyor skirting 0.00 26.5 0.50 293 12.0 0.00 0.00 0.00 0.014 0.007 0.00
412810 6008511 9 Bin vent, boom conveyor head 0.00 32.0 0.50 293 12.0 0.00 0.00 0.00 0.014 0.007 0.00
413762 6008514 9 Rail car dumper /transfer point TT-03 25.0 22.0 2.00 293 4.81 0.00 0.00 0.00 0.085 0.043 0.00
413800 6008460 9 Transfer towers TT-01 and TT-02 25.0 42.0 2.00 293 4.06 0.00 0.00 0.00 0.066 0.033 0.00
Canpotex Potash Terminal Emissions Totals (g/s) 1.19 2.20 0.19 0.38 0.25 0.078
Canpotex Potash Terminal Emissions Totals (t/y) 37.6 69.3 5.9 11.9 8.0 2.5
BG Group - point land c
414574 6008000 9 Compressor GT driver # 1 25.0 50.0 8.37 972 20.0 0.040 13.7 16.6 1.10 1.10 0.35 414492 6007892 9 Compressor GT driver # 2 25.0 50.0 8.37 972 20.0 0.040 13.7 16.6 1.10 1.10 0.35
414303 6007626 9 Gas turbine generator #A 25.0 50.0 2.73 393 20.0 0.011 3.60 4.36 0.29 0.29 0.092
414349 6007584 9 Gas turbine generator #B 25.0 50.0 2.73 393 20.0 0.011 3.60 4.36 0.29 0.29 0.092
414415 6007780 9 Thermal oxidizer #1 25.0 50.0 1.81 1143 20.0 1.43 1.63 1.31 0.12 0.12 0.085
414753 6007887 9 Compressor GT driver # 3 25.0 50.0 8.37 972 20.0 0.040 13.7 16.6 1.10 1.10 0.35
414651 6007775 9 Compressor GT driver # 4 25.0 50.0 8.37 972 20.0 0.040 13.7 16.6 1.10 1.10 0.35
414441 6007509 9 Gas turbine generator #D 25.0 50.0 2.73 393 20.0 0.011 3.60 4.36 0.29 0.29 0.092
414506 6007464 9 Gas turbine generator #E 25.0 50.0 2.73 393 20.0 0.011 3.60 4.36 0.29 0.29 0.092
414579 6007672 9 Thermal oxidizer #2 25.0 50.0 1.81 1143 20.0 1.43 1.63 1.31 0.12 0.12 0.085
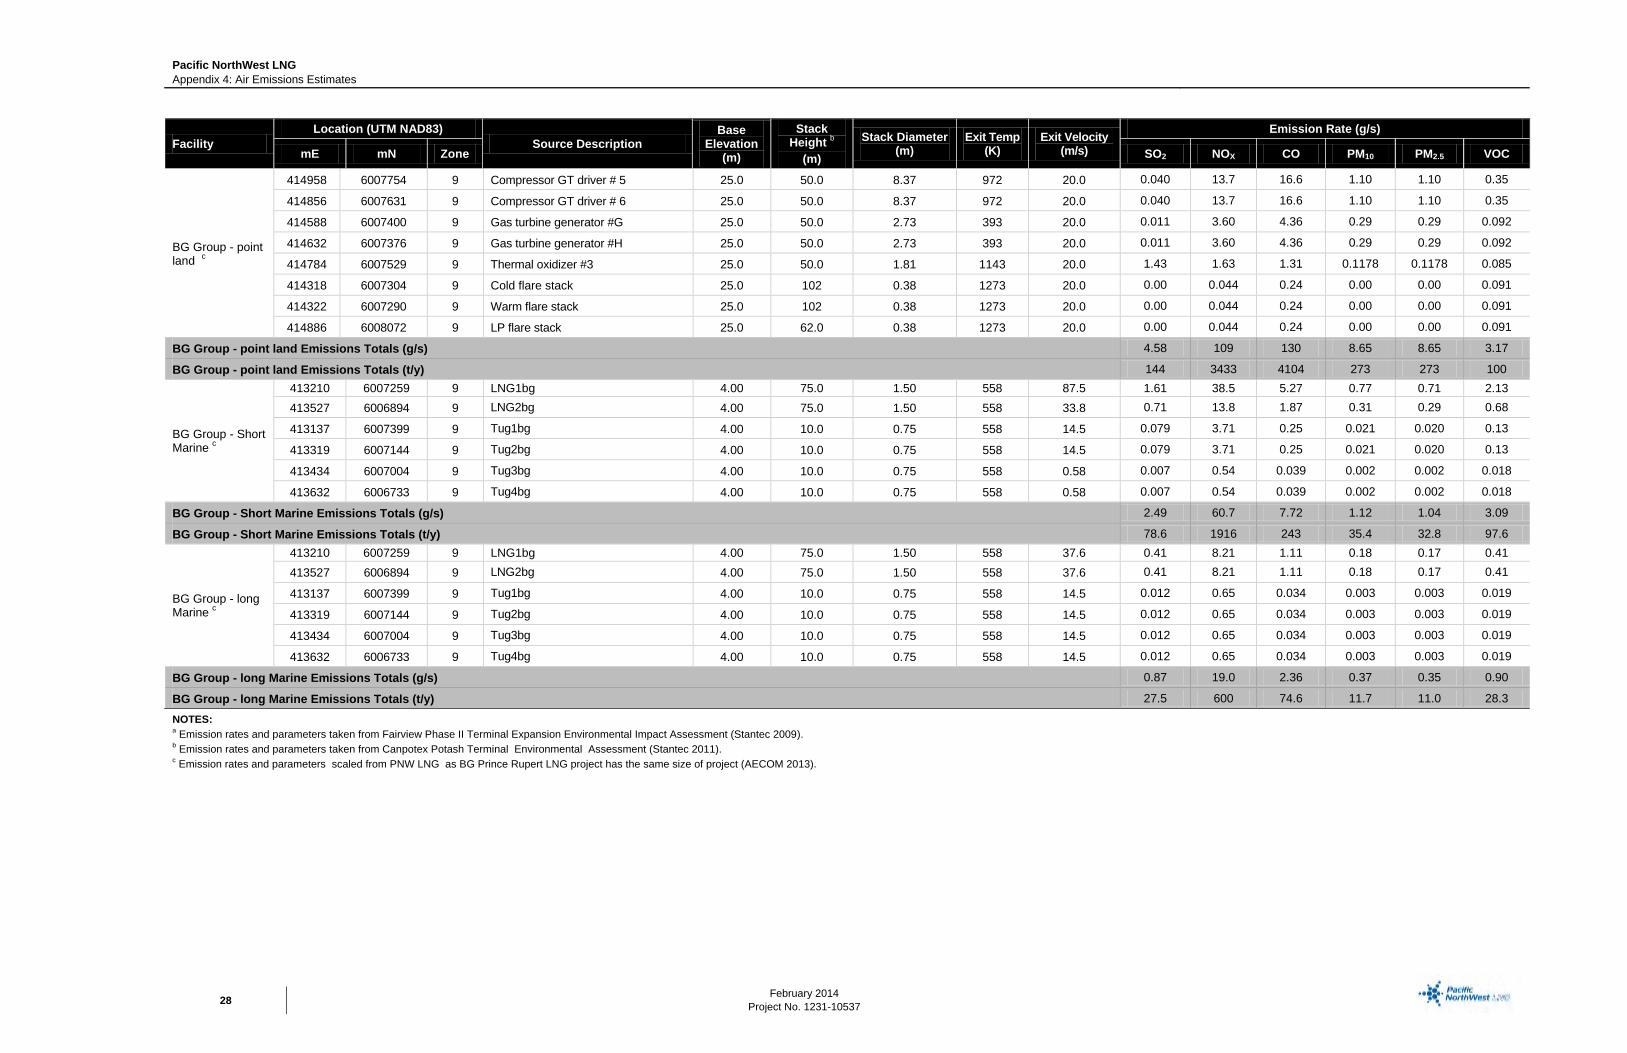
Pacific NorthWest LNG Appendix 4: Air Emissions Estimates
February 2014
Project No. 1231-10537 28
Facility Location (UTM NAD83)
Source Description Base
Elevation (m)
Stack Height b
(m)
Stack Diameter (m)
Exit Temp (K)
Exit Velocity (m/s)
Emission Rate (g/s)
mE mN Zone SO2 NOX CO PM10 PM2.5 VOC
BG Group - point land c
414958 6007754 9 Compressor GT driver # 5 25.0 50.0 8.37 972 20.0 0.040 13.7 16.6 1.10 1.10 0.35
414856 6007631 9 Compressor GT driver # 6 25.0 50.0 8.37 972 20.0 0.040 13.7 16.6 1.10 1.10 0.35
414588 6007400 9 Gas turbine generator #G 25.0 50.0 2.73 393 20.0 0.011 3.60 4.36 0.29 0.29 0.092
414632 6007376 9 Gas turbine generator #H 25.0 50.0 2.73 393 20.0 0.011 3.60 4.36 0.29 0.29 0.092
414784 6007529 9 Thermal oxidizer #3 25.0 50.0 1.81 1143 20.0 1.43 1.63 1.31 0.1178 0.1178 0.085
414318 6007304 9 Cold flare stack 25.0 102 0.38 1273 20.0 0.00 0.044 0.24 0.00 0.00 0.091
414322 6007290 9 Warm flare stack 25.0 102 0.38 1273 20.0 0.00 0.044 0.24 0.00 0.00 0.091
414886 6008072 9 LP flare stack 25.0 62.0 0.38 1273 20.0 0.00 0.044 0.24 0.00 0.00 0.091
BG Group - point land Emissions Totals (g/s) 4.58 109 130 8.65 8.65 3.17
BG Group - point land Emissions Totals (t/y) 144 3433 4104 273 273 100
BG Group - Short Marine c
413210 6007259 9 LNG1bg 4.00 75.0 1.50 558 87.5 1.61 38.5 5.27 0.77 0.71 2.13 413527 6006894 9 LNG2bg 4.00 75.0 1.50 558 33.8 0.71 13.8 1.87 0.31 0.29 0.68
413137 6007399 9 Tug1bg 4.00 10.0 0.75 558 14.5 0.079 3.71 0.25 0.021 0.020 0.13
413319 6007144 9 Tug2bg 4.00 10.0 0.75 558 14.5 0.079 3.71 0.25 0.021 0.020 0.13
413434 6007004 9 Tug3bg 4.00 10.0 0.75 558 0.58 0.007 0.54 0.039 0.002 0.002 0.018
413632 6006733 9 Tug4bg 4.00 10.0 0.75 558 0.58 0.007 0.54 0.039 0.002 0.002 0.018
BG Group - Short Marine Emissions Totals (g/s) 2.49 60.7 7.72 1.12 1.04 3.09
BG Group - Short Marine Emissions Totals (t/y) 78.6 1916 243 35.4 32.8 97.6
BG Group - long Marine c
413210 6007259 9 LNG1bg 4.00 75.0 1.50 558 37.6 0.41 8.21 1.11 0.18 0.17 0.41 413527 6006894 9 LNG2bg 4.00 75.0 1.50 558 37.6 0.41 8.21 1.11 0.18 0.17 0.41
413137 6007399 9 Tug1bg 4.00 10.0 0.75 558 14.5 0.012 0.65 0.034 0.003 0.003 0.019
413319 6007144 9 Tug2bg 4.00 10.0 0.75 558 14.5 0.012 0.65 0.034 0.003 0.003 0.019
413434 6007004 9 Tug3bg 4.00 10.0 0.75 558 14.5 0.012 0.65 0.034 0.003 0.003 0.019
413632 6006733 9 Tug4bg 4.00 10.0 0.75 558 14.5 0.012 0.65 0.034 0.003 0.003 0.019
BG Group - long Marine Emissions Totals (g/s) 0.87 19.0 2.36 0.37 0.35 0.90
BG Group - long Marine Emissions Totals (t/y) 27.5 600 74.6 11.7 11.0 28.3
NOTES: a Emission rates and parameters taken from Fairview Phase II Terminal Expansion Environmental Impact Assessment (Stantec 2009). b Emission rates and parameters taken from Canpotex Potash Terminal Environmental Assessment (Stantec 2011). c Emission rates and parameters scaled from PNW LNG as BG Prince Rupert LNG project has the same size of project (AECOM 2013).

Pacific NorthWest LNG Appendix 4: Air Emissions Estimates
February 2014 Project No. 1231-10537
29
Table 4-15: Emissions and Emission Parameters for Reasonably-Foreseeable Proposed Facilities Included in Dispersion Modelling _Area Sources
Facility Location (4 Corners UTM NAD83) Source
Description Release
Height (m) Base Elevation
(m) Initial Sigma
z (m) Total Area
(m2) Emission Rate (g/s)
mE mN Zone SO2 NOX CO PM10 PM2.5 VOC
Fairview Terminal (Phase II)
411633 6015712
9 Bomb Cart Trucks 4 10 4 115,444 0.47 4.19 4.19 0.24 0.24 0.65
411633 6014830
411509 6014830
411633 6015712
Fairview Terminal (Phase II)
411752 6015780
9 Reach Stackers 4 10 4 80,696 0.050 0.60 0.60 0.034 0.034 0.092
411752 6014696
411664 6014838
411752 6015780
Fairview Terminal (Phase II)
411490 6015825
9 Top Lifts 4 10 4 5,957 0.040 0.48 0.30 0.028 0.22 0.074 411490 6015405
411476 6015405
411490 6015825
Fairview Terminal (Phase II)
411752 6015780
9 Rail 4 10 4 80,696 0.14 7.45 2.20 0.22 0.02 0.55 411752 6014696
411664 6014838
411752 6015780
Canpotex
413475 6008823
9 Rail 4 10 4 1,790,000 0.005 0.61 0.073 0.022 11.54 0.023 414151 6010345
415103 6008970
414122 6007909
Facility Emissions Totals (g/s) 0.70 13.3 7.36 0.55 12.1 1.38
Facility Emissions Totals (t/y) 22.2 420 232 17.3 381 43.5

Pacific NorthWest LNG Appendix 4: Air Emissions Estimates
February 2014
Project No. 1231-10537 30
6 REFERENCES
6.1 Literature Cited AECOM 2013. Prince Rupert LNG Project Description. Available at: http://www.ceaa-
acee.gc.ca/050/documents-eng.cfm?evaluation=80042
British Columbia Ministry of Environment. 1992. Emission Criteria for Gas Turbines. Rescinded but considered applicable to the Project.
Environment Canada. 2010. National Inventory Report: Greenhouse Gas Inventory Report. Annex 8: Emission Factors (Table A8-11: Emission Factors for Energy Mobile Combustion Sources).
ICF International. 2009. US EPA. Current Methodologies in Preparing Mobile Source Port-Related Emission Inventories. Available at: http://epa.gov/cleandiesel/documents/ports-emission-inv-april09.pdf Accessed: July 2013.
MAN Diesel. 2008. LNG Carrier Power. Total Fuel Flexibility & Maintainability with 51/60DF Electric Propulsion.
MARPOL. 2008. International Convention for the Prevention of Pollution from Ships. Annex VI. North American Emission Control Area.
Stantec Consulting Ltd. 2009. Fairview Terminal Phase II Expansion Project. Available at: http://www.ceaa-acee.gc.ca/050/documents-eng.cfm?evaluation=37956
Stantec Consulting Ltd. 2011. Canpotex Potash Export Terminal and Ridley Island Road, Rail and Utility Corridor Project. Available at: http://www.ceaa-acee.gc.ca/050/documents/53477/53477E.pdf
United States Environmental Protection Agency (US EPA). 1991. AP-42, Section 13.5: Industrial Flares. Available at: http://www.epa.gov/ttn/chief/ap42/ch13/final/c13s05.pdf Accessed: May 2013.
United States Environmental Protection Agency (US EPA). 1996a. AP-42, Section 3.4: Large Stationary Diesel and All Stationary Dual-fuel Engines. Available at: http://www.epa.gov/ttn/chief/ap42/ch03/final/c03s04.pdf Accessed: May 2013.
United States Environmental Protection Agency (US EPA). 1996b. AP-42, Section 3.3: Gasoline and Diesel Industrial Engines. Available at: http://www.epa.gov/ttn/chief/ap42/ch03/final/c03s03.pdf Accessed: May 2013.
United States Environmental Protection Agency (US EPA). 1998. AP-42, Section 1.4: Natural Gas Combustion. Available at: http://www.epa.gov/ttn/chief/ap42/ch01/final/c01s04.pdf Accessed: May 2013.

Pacific NorthWest LNG Appendix 4: Air Emissions Estimates
February 2014 Project No. 1231-10537
31
United States Environmental Protection Agency (US EPA). 2000. AP-42, Section 3.1: Stationary Gas Turbines. Available at: http://www.epa.gov/ttn/chief/ap42/ch03/final/c03s01.pdf Accessed: May 2013.
United States Environmental Protection Agency (US EPA). 2002. Median Life, Annual Activity, and Load Factor Values for Nonroad Engine Emissions Modelling. Available at: http://www.epa.gov/otaq/models/nonrdmdl/nonrdmdl2010/420r10016.pdf Accessed: June 2013.
United States Environmental Protection Agency (US EPA). 2010. Nonroad Compression-Ignition Engines – Exhaust Emission Standards. Available at: http://epa.gov/oms/standards/nonroad/nonroadci.htm. Accessed: August 2013.
United States Environmental Protection Agency (US EPA). 2010. Designation of North American Emission Control Area to Reduce Emissions from Ships. Available at: http://www.epa.gov/omswww/regs/nonroad/marine/ci/420f10015.pdf. Accessed: September 2013.

APPENDIX 5 CALMET Description

Pacific NorthWest LNG Appendix 5: CALMET Description
February 2014 Project No. 1231-10537
1
TABLE OF CONTENTS
1 Introduction ............................................................................................................................ 2
2 CALMET Modelling ................................................................................................................ 2 2.1 Model Description .......................................................................................................... 2
2.1.1 Diagnostic Wind Field Module—Initial Guess Field ........................................ 3 2.1.2 Micrometeorology Modules ............................................................................. 4
2.2 CALMET Application ...................................................................................................... 4 2.3 Meteorological Domain .................................................................................................. 5 2.4 Terrain and Land Use .................................................................................................... 5 2.5 Meteorological Inputs ................................................................................................... 13 2.6 CALMET Data QAQC .................................................................................................. 14
2.6.1 Winds ............................................................................................................. 14 2.6.2 Surface Temperature .................................................................................... 17 2.6.3 Stability and Mixing Heights .......................................................................... 18
2.7 CALMET Model Options .............................................................................................. 21
3 References ............................................................................................................................ 29

Pacific NorthWest LNG Appendix 5: CALMET Description
February 2014
Project No. 1231-10537 2
1 INTRODUCTION This appendix provides technical details and assumptions regarding the CALMET meteorological model (CALMET) which were used in conjunction with the CALPUFF dispersion model (CALPUFF) to assess the air quality effects of the proposed Pacific NorthWest LNG Ltd. Partnership (PNW LNG) project (the Project). CALMET is an approved model by the British Columbia Ministry of Environment (BC MOE) for use in dispersion modelling assessments. What follows is an overview of the initialization and parameterization of the CALMET model, a technical description of the models, and a general assessment of the model’s performance.
2 CALMET MODELLING The CALMET meteorological model is used to provide the meteorological environment necessary to initialize the CALPUFF dispersion model. CALMET version 6.326 was used for this assessment. This model is initialized with geophysical (terrain and land use) data characterizing the region of interest, as well as meteorological input from numerous sources. Various user-defined parameters control both how the input meteorological data is interpolated to the model grid, as well as which internal algorithms are applied to these input data. More details regarding these options are provided in the following sections. Output from the CALMET model includes hourly temperature and wind fields on a user-specified three-dimensional domain as well as additional two-dimensional variables used by the CALPUFF dispersion model. Appendix 6 of the Air Quality Technical Data Report (TDR) describes the CALPUFF dispersion model in detail.
2.1 Model Description The following description of the major CALMET model algorithms and options are excerpts from the CALMET user manual (Scire et al. 2000).
The CALMET model consists of diagnostic wind field and micrometeorological modules for overwater and overland boundary layers. The diagnostic wind field module uses a two-step approach for the computation of the wind fields (Douglas and Kessler 1988) (see Figure 5-1).
To produce a Step-1 wind field, an initial guess wind field is adjusted for kinematic effects of terrain, slope flows, and terrain blocking effects. The initial guess field is a uniform field based on available observational data and the output from the Weather Research and Forecasting (WRF) model. The second step consists of an objective analysis procedure to introduce the effects of observational data into the Step-1 wind field to produce a final wind field.

Pacific NorthWest LNG Appendix 5: CALMET Description
February 2014 Project No. 1231-10537
3
Figure 5-1: Flow Diagram for the CALMET Diagnostic Wind Module
2.1.1 Diagnostic Wind Field Module—Initial Guess Field Step-1 Wind Field:The Step-1 wind field is adjusted for kinematic effects of terrain, slope flows, and blocking effects as follows:
Kinematic effects of terrain: The approach of Liu and Yocke (1980) is used to evaluate kinematic terrain effects. The domain scale winds are used to compute a terrain forced vertical velocity, subject to an exponential, stability dependent decay function. The kinematic effects of terrain on the horizontal wind components are evaluated by applying a divergence minimisation scheme to the initial guess wind field. The divergence minimisation scheme is applied iteratively until the three dimensional divergence is less than a threshold value.
Slope Flows: An empirical scheme based on Allwine and Whiteman (1985) is used to estimate the magnitude of slope flows in complex terrain. The slope flow is parameterised in terms of the terrain slope, terrain height, domain scale lapse rate, and time of day. The slope flow wind components are added to the wind field adjusted for kinematic effects.

Pacific NorthWest LNG Appendix 5: CALMET Description
February 2014
Project No. 1231-10537 4
Blocking Effects: The thermodynamic blocking effects of terrain on the wind flow are parameterised in terms of the local Froude number (Allwine and Whiteman 1985). If the Froude number at a particular grid point is less than a critical value and the wind has an uphill component, the wind direction is adjusted to be tangent to the terrain.
Step-2 Wind Field: The second step of the procedure involves the introduction of observational data into the Step-1 wind field through an objective analysis procedure. An inverse distance squared interpolation scheme is used which weighs observational data heavily in the vicinity of the observation station, while the Step-1 wind field dominates the interpolated wind field in regions with no observational data. The resulting wind field is subject to smoothing, an optional adjustment of vertical velocities based on the O'Brien (1970) method, and divergence minimization to produce a final Step-2 wind field.
2.1.2 Micrometeorology Modules The CALMET model contains two boundary layer models for application to overland and overwater grid cells:
Overland Boundary Layer Model: Over land surfaces, the energy balance method of Holtslag and van Ulden (1983) is used to compute hourly gridded fields of the sensible heat flux, surface friction velocity, Monin Obukhov length, and convective velocity scale. Mixing heights are determined from the computed hourly surface heat fluxes and observed temperature soundings using a modified Carson (1973) method based on Maul (1980). The model also determines gridded fields of Pasquill-Gifford-Turner (PGT) stability class and optional hourly precipitation rates.
Overwater Boundary Layer Model: The aerodynamic and thermal properties of water surfaces suggest that a different method is best suited for calculating the boundary layer parameters in the marine environment. A profile technique (Garratt 1977; Hanna et al. 1985), using air-sea temperature differences, is used in CALMET to compute the micrometeorological parameters in the marine boundary layer.
2.2 CALMET Application The CALMET model run files are available from the model developer (the Atmospheric Studies Group at TRC (TRC 2011)). CALMET version 6.326 level 080709 was utilized for this assessment. This model choice was approved by the BC MOE for use is this assessment.
A horizontal grid spacing of 500 m was selected for the CALMET simulation. With this grid spacing, it is possible to maximize run time and file size efficiencies while still capturing large-scale terrain feature influences on wind flow patterns.
To simulate transport and dispersion processes, the representative vertical profiles of wind direction, wind speed, temperature, and turbulence intensity within the atmospheric boundary layer (i.e., the layer within about 2000 metres above the Earth’s surface) are modelled. To capture this vertical structure, eight vertical layers were selected. CALMET defines a vertical layer as the midpoint between two faces (i.e., nine faces corresponds to eight layers, with the lowest layer always being ground level or 10 m). The vertical faces used in this study are 0, 20, 40, 80, 160, 320, 600, 1400 and 2600 m.

Pacific NorthWest LNG Appendix 5: CALMET Description
February 2014 Project No. 1231-10537
5
The National Centers for Environmental Prediction 32 km resolution North American Regional Reanalysis gridded analysis data were used as input to the Version 3 of the WRF model. Using the Stantec high performance computing cluster, three-years (2008-2010) of hourly meso-meteorological data with 4-km grid resolution was generated. The 4-km grid resolution WRF model output was used as an initial guess field and the CALMET model adjusted the initial guess field for the kinematic effects of terrain, slope flows, and terrain blocking effects using the finer scaled CALMET terrain data to produce a modified wind field.
2.3 Meteorological Domain The CALMET domain extends from north of 53.9562 degrees latitude to 54.4322 degrees latitude, and from west of 130.7069 degrees longitude to 129.9250 degrees longitude as shown in Figure 5-2. The CALMET Domain covers a 52 km by 52 km area, the extents of which are provided in Table 5-1.
Table 5-1: Map Projections and Horizontal Grid Parameters Parameter Value
Map Projection UTM
UTM Zone 9
Datum NAD 83
SW Corner (Easting, Northing) 388000, 5980000
NW Corner (Easting, Northing) 388000, 6032000
NE Corner (Easting, Northing) 440000, 6032000
SE Corner (Easting, Northing) 440000, 5980000
Grid Spacing (Easting, Northing) 500m
Number of Grid Cells (nx, ny) 104, 104
2.4 Terrain and Land Use Terrain elevation data were obtained from Canadian Digital Elevation Data (CDED). The source digital data for CDED at scales of 1:50,000 and 1:250,000 are extracted from the hypsographic and hydrographical elements of the National Topographic Data Base (NTDB) or various scaled positional data acquired from the provinces and territories. These data have a horizontal resolution of approximately 30 m, which is more than sufficient for air quality modelling purposes.
Terrain elevations for the CALMET model area are shown in Figure 5-2. Lelu Island and surrounding area is considered to be flat low plain that is mostly below 30 m elevation. The Island is bordered by deep water in Porpoise Harbour to the north and Inverness Passage to the south. The western portions of the assessment area cover the ocean component of Hecate Straight and Chatham Sound. The area to the east consists of rugged coastal terrain, with intermittent ocean channels and inlets, rising up to 1,400 m in elevation.

Pacific NorthWest LNG Appendix 5: CALMET Description
February 2014
Project No. 1231-10537 6
Figure 5-2: Terrain Elevations within the CALMET Model Domain

Pacific NorthWest LNG Appendix 5: CALMET Description
February 2014 Project No. 1231-10537
7
In addition to terrain elevation data, the CALMET model utilizes surface parameters such as surface roughness length, albedo, Bowen ratio, leaf area index, soil heat flux, and anthropogenic heat flux to provide input to important subroutines which, in turn, estimate quantities such as surface heat flux and mechanical turbulence.
For this assessment, the North American land-cover data (CEC 2010) was used to initialize CALMET land use categories. The 2005 North American land-cover dataset was produced as part of the North American Land Change Monitoring System (NALCMS), a trilateral effort between the Canada Centre for Remote Sensing, the United States Geological Survey, and three Mexican organizations including the National Institute of Statistics and Geography, National Commission for the Knowledge and Use of the Biodiversity, and the National Forestry Commission of Mexico. The 2005 North American land-cover dataset is at a resolution of 250 m, consistent with that of the CALMET grid spacing. This land-cover information was then converted into the fractional land-use format accepted by the CALMET geophysical pre-processor.
The scheme used to map from the North American land-cover dataset to the CALMET land-use categories is contained in Table 5-2 and illustrated in Figure 5-3. Table 5-3 to Table 5-6 describe the seasonal values for surface roughness (z0), albedo, Bowen ratio, soil heat flux, anthropogenic heat flux and Leaf Area Index defined according to the Guidelines for Air Quality Dispersion Modelling in British Columbia (BC MOE 2008) and the CALMET User Guide (Scire et al. 2000).
Table 5-2: Mapping of the North American Land-cover Data to CALMET Land-Use Land Cover Code Land Cover Type CALMET
Code CALMET Land Use Category
1 Temperate or sub-polar needleleaf forest 42 Evergreen Forest Land
2 Sub-polar taiga needleleaf forest 42 Evergreen Forest Land
3 Tropical or sub-tropical broadleaf evergreen forest 42 Evergreen Forest Land
4 Tropical or sub-tropical broadleaf deciduous forest 41 Deciduous Forest Land
5 Temperate or sub-polar broadleaf deciduous forest 41 Deciduous Forest Land
6 Mixed forest 43 Mixed Forest Land
7 Tropical or sub-tropical shrubland 32 Shrub and Brush Rangeland
8 Temperate or sub-polar shrubland 32 Shrub and Brush Rangeland
9 Tropical or sub-tropical grassland 30 Rangeland
10 Temperate or sub-polar grassland 30 Rangeland
11 Sub-polar or polar shrubland-lichen-moss 80 Tundra
12 Sub-polar or polar grassland-lichen-moss 80 Tundra
13 Sub-polar or polar barren-lichen-moss 80 Tundra
14 Wetland 60 Wet Land
15 Cropland 20 Agricultural Land
16 Barren lands 70 Barren Land
17 Urban 10 Urban or Build-up Land
18 Water 50 Water
19 Snow and Ice 90 Perennial Snow or Ice

Pacific NorthWest LNG Appendix 5: CALMET Description
February 2014
Project No. 1231-10537 8
Figure 5-3: Land-cover Classes within the CALMET Model Domain

Pacific NorthWest LNG Appendix 5: CALMET
February 2014 Project No. 1231-10537
9
Table 5-3: Land-use Characterization and Associated Geophysical Parameters for the Winter Season
NALCMS Code
Surface Roughness
(m) Albedo Bowen
Ratio Soil Heat
Flux (fraction)
Anthropogenic Heat Flux (W/m2)
Leaf Area Index
CALMET Code CALMET Land Cover Type
1 1.3 0.35 1.5 0.15 0 7 42 Evergreen Forest Land 2 1.3 0.35 1.5 0.15 0 7 42 Evergreen Forest Land 3 1.3 0.35 1.5 0.15 0 7 42 Evergreen Forest Land 4 0.5 0.5 1.5 0.15 0 7 41 Deciduous Forest Land 5 0.5 0.5 1.5 0.15 0 7 41 Deciduous Forest Land 6 1 0.1 1 0.15 0 7 43 Mixed Forest Land 7 0.05 0.25 1 0.15 0 0.5 32 Shrub Rangeland 8 0.05 0.25 1 0.15 0 0.5 32 Shrub Rangeland 9 0.001 0.6 1.5 0.15 0 0.5 30 Rangeland
10 0.001 0.6 1.5 0.15 0 0.5 30 Rangeland 11 0.2 0.3 0.5 0.15 0 0 80 Tundra 12 0.2 0.3 0.5 0.15 0 0 80 Tundra 13 0.2 0.3 0.5 0.15 0 0 80 Tundra 14 0.05 0.3 1.5 0.25 0 2 60 Wet Land 15 0.01 0.6 1.5 0.15 0 3 20 Agricultural Land 16 0.15 0.45 6 0.15 0 0.05 70 Barren Land 17 1 0.35 1.5 0.25 0 0.2 10 Urban or Build-up 18 0.0001 0.2 1.5 1 0 0 50 Water 19 0.2 0.7 0.5 0.15 0 0 90 Snow or Ice
NOTES: Winter = November, December, January, February and March; Spring = April and May; Summer = June, July and August; Fall = September and October; W/m2 = watts per square metre

Pacific NorthWest LNG Appendix 5: CALMET
February 2014
Project No. 1231-10537 10
Table 5-4: Land-use Characterization and Associated Geophysical Parameters for the Spring Season
NALCMS Code
Surface Roughness
(m) Albedo Bowen
Ratio Soil Heat
Flux (fraction)
Anthropogenic Heat Flux (W/m2)
Leaf Area Index
CALMET Code CALMET Land Cover Type
1 1.3 0.12 0.7 0.15 0 7 42 Evergreen Forest Land 2 1.3 0.12 0.7 0.15 0 7 42 Evergreen Forest Land 3 1.3 0.12 0.7 0.15 0 7 42 Evergreen Forest Land 4 1 0.12 0.7 0.15 0 7 41 Deciduous Forest Land 5 1 0.12 0.7 0.15 0 7 41 Deciduous Forest Land 6 1 0.1 1 0.15 0 7 43 Mixed Forest Land 7 0.05 0.25 1 0.15 0 0.5 32 Shrub Rangeland 8 0.05 0.25 1 0.15 0 0.5 32 Shrub Rangeland 9 0.05 0.18 0.4 0.15 0 0.5 30 Rangeland
10 0.05 0.18 0.4 0.15 0 0.5 30 Rangeland 11 0.2 0.3 0.5 0.15 0 0 80 Tundra 12 0.2 0.3 0.5 0.15 0 0 80 Tundra 13 0.2 0.3 0.5 0.15 0 0 80 Tundra 14 0.2 0.12 0.1 0.25 0 2 60 Wet Land 15 0.03 0.14 0.3 0.15 0 3 20 Agricultural Land 16 0.3 0.3 3 0.15 0 0.05 70 Barren Land 17 1 0.14 1 0.25 0 0.2 10 Urban or Build-up 18 0.0001 0.12 0.1 1 0 0 50 Water 19 0.2 0.7 0.5 0.15 0 0 90 Snow or Ice
NOTES: Winter = November, December, January, February and March; Spring = April and May; Summer = June, July and August; Fall = September and October; W/m2 = watts per square metre

Pacific NorthWest LNG Appendix 5: CALMET
February 2014 Project No. 1231-10537
11
Table 5-5: Land-use Characterization and Associated Geophysical Parameters for the Summer Season
NALCMS Code
Surface Roughness
(m) Albedo Bowen
Ratio Soil Heat
Flux (fraction)
Anthropogenic Heat Flux (W/m2)
Leaf Area Index
CALMET Code CALMET Land Cover Type
1 1.3 0.12 0.3 0.15 0 7 42 Evergreen Forest Land 2 1.3 0.12 0.3 0.15 0 7 42 Evergreen Forest Land 3 1.3 0.12 0.3 0.15 0 7 42 Evergreen Forest Land 4 1.3 0.12 0.3 0.15 0 7 41 Deciduous Forest Land 5 1.3 0.12 0.3 0.15 0 7 41 Deciduous Forest Land 6 1 0.1 1 0.15 0 7 43 Mixed Forest Land 7 0.05 0.25 1 0.15 0 0.5 32 Shrub Rangeland 8 0.05 0.25 1 0.15 0 0.5 32 Shrub Rangeland 9 0.1 0.18 0.8 0.15 0 0.5 30 Rangeland
10 0.1 0.18 0.8 0.15 0 0.5 30 Rangeland 11 0.2 0.3 0.5 0.15 0 0 80 Tundra 12 0.2 0.3 0.5 0.15 0 0 80 Tundra 13 0.2 0.3 0.5 0.15 0 0 80 Tundra 14 0.2 0.14 0.1 0.25 0 2 60 Wet Land 15 0.2 0.2 0.5 0.15 0 3 20 Agricultural Land 16 0.3 0.28 4 0.15 0 0.05 70 Barren Land 17 1 0.16 2 0.25 0 0.2 10 Urban or Build-up 18 0.0001 0.1 0.1 1 0 0 50 Water 19 0.2 0.7 0.5 0.15 0 0 90 Snow or Ice
NOTES: Winter = November, December, January, February and March; Spring = April and May; Summer = June, July and August; Fall = September and October; W/m2 = watts per square metre
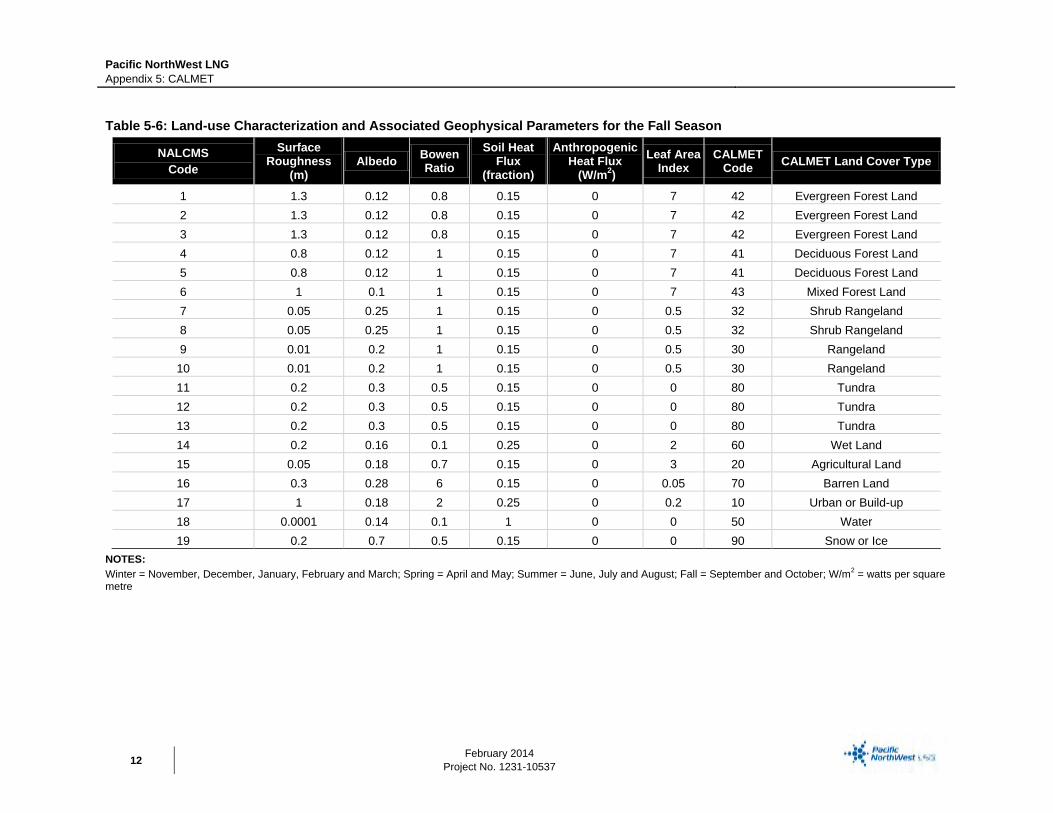
Pacific NorthWest LNG Appendix 5: CALMET
February 2014
Project No. 1231-10537 12
Table 5-6: Land-use Characterization and Associated Geophysical Parameters for the Fall Season
NALCMS Code
Surface Roughness
(m) Albedo Bowen
Ratio Soil Heat
Flux (fraction)
Anthropogenic Heat Flux (W/m2)
Leaf Area Index
CALMET Code CALMET Land Cover Type
1 1.3 0.12 0.8 0.15 0 7 42 Evergreen Forest Land 2 1.3 0.12 0.8 0.15 0 7 42 Evergreen Forest Land 3 1.3 0.12 0.8 0.15 0 7 42 Evergreen Forest Land 4 0.8 0.12 1 0.15 0 7 41 Deciduous Forest Land 5 0.8 0.12 1 0.15 0 7 41 Deciduous Forest Land 6 1 0.1 1 0.15 0 7 43 Mixed Forest Land 7 0.05 0.25 1 0.15 0 0.5 32 Shrub Rangeland 8 0.05 0.25 1 0.15 0 0.5 32 Shrub Rangeland 9 0.01 0.2 1 0.15 0 0.5 30 Rangeland
10 0.01 0.2 1 0.15 0 0.5 30 Rangeland 11 0.2 0.3 0.5 0.15 0 0 80 Tundra 12 0.2 0.3 0.5 0.15 0 0 80 Tundra 13 0.2 0.3 0.5 0.15 0 0 80 Tundra 14 0.2 0.16 0.1 0.25 0 2 60 Wet Land 15 0.05 0.18 0.7 0.15 0 3 20 Agricultural Land 16 0.3 0.28 6 0.15 0 0.05 70 Barren Land 17 1 0.18 2 0.25 0 0.2 10 Urban or Build-up 18 0.0001 0.14 0.1 1 0 0 50 Water 19 0.2 0.7 0.5 0.15 0 0 90 Snow or Ice
NOTES: Winter = November, December, January, February and March; Spring = April and May; Summer = June, July and August; Fall = September and October; W/m2 = watts per square metre

Pacific NorthWest LNG Appendix 5: CALMET
February 2014 Project No. 1231-10537
13
2.5 Meteorological Inputs The CALMET model requires the input of surface and upper-air meteorological fields. For this application, CALMET was initialized with surface station information and with upper-air data produced by the WRF meteorological model. This model initialization methodology allows for a more accurate depiction of mesoscale wind circulations in the upper layers and simultaneously permits data from surface weather stations to implement local adjustments and correct the biases that meso-meteorological model data often exhibits in the lower layers. Upper-air data from the closest radiosonde stations were determined to be non- representative of the CALMET domain.
WRF model output, covering the modelling domain, was produced for each hour of 2008-2010 at 4 km resolution. Then, the WRF model output was processed for CALMET use by the CALWRF pre-processor. Data from the Prince Rupert Airport Automated Weather Observing Station (AWOS) (2008-2010), Holland Rock Station (2008-2010), and Terrace Airport were used as the surface station inputs into the CALMET model. The geographic coordinates and elevations (see Table 5-7) and parameters observed (see Table 5-8) of the meteorological stations are found below.
Table 5-7: Geographic Coordinates of Meteorological Stations used as Input into the CALMET Model
Station Type Station Name Latitude Longitude Elevation
(masl)
UTM NAD83 (Zone 9)
Easting (m) Northing (m)
AWOS Prince Rupert Airport AWOS 54°17' N 130°26' W 35.4 405953 6016318
CMS Holland Rock 54°10' N 130°21' W 5.0 411170 6003570
- Terrace Airport 54° 27' N 128° 34' W 217 527384 6035497 NOTES: AWOS = Automated weather observations station CMS = Continuous monitoring station.
Table 5-8: Meteorological Station Parameters and Data Valid Period
Station Type Station Name Parameters
AWOS Prince Rupert Airport AWOS 2008-2010: temperature, relative humidity, wind speed and direction, cloud opacity, ceiling height, and station pressure
CMS Holland Rock 2008-2010: temperature, relative humidity, wind speed and direction, and station pressure
- Terrace Airport 2008-2010: temperature, relative humidity, wind speed and direction ,cloud opacity, ceiling height, and station pressure

Pacific NorthWest LNG Appendix 5: CALMET
February 2014
Project No. 1231-10537 14
2.6 CALMET Data QAQC
2.6.1 Winds Wind roses are an efficient and convenient means of presenting wind data. The length of the radial barbs gives the total percent frequency of winds from the indicated direction, while portions of the barbs of different widths indicate the frequency associated with each wind speed category.
The wind roses at various elevations above ground (10 m, 60 m, 120 m and 240 m) predicted by CALMET valid the center of the Project site on Lelu Island and over the marine berth located approximately 3 km southwest out from the shore of Lelu Island are show in Figures 5-4 and 5-5, respectively. The results indicate that the predominant wind direction in the area is from the southeast.
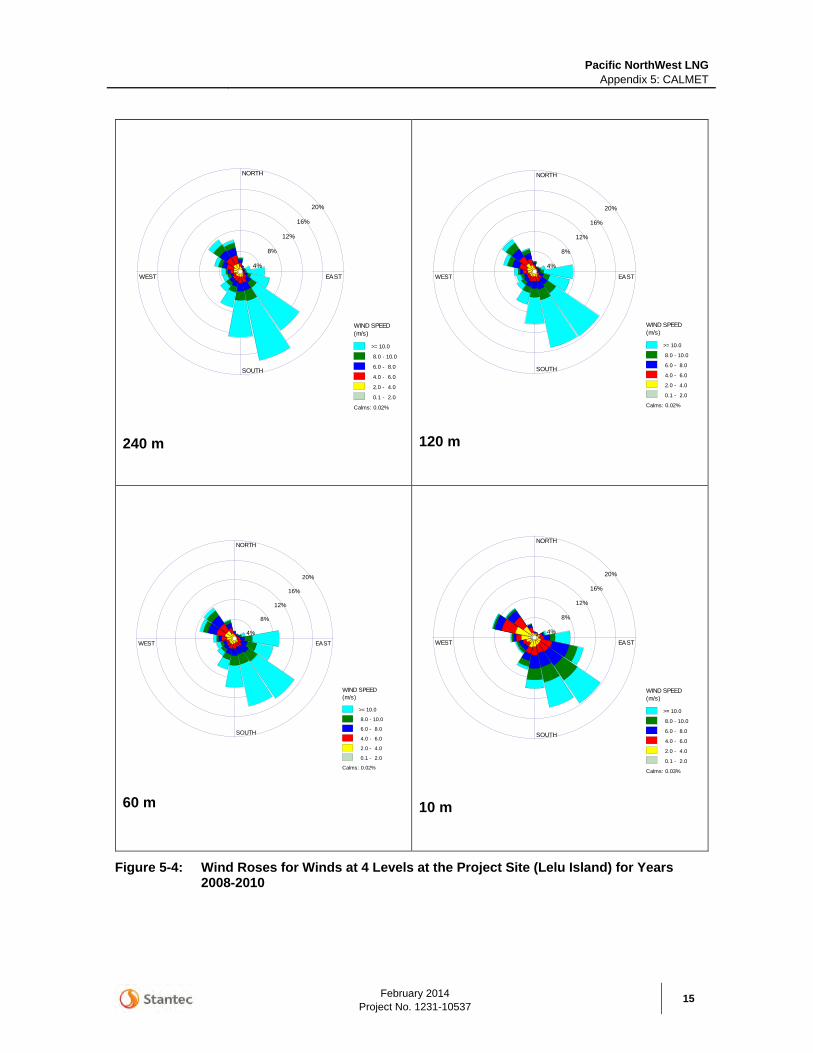
Pacific NorthWest LNG Appendix 5: CALMET
February 2014 Project No. 1231-10537
15
240 m 120 m
60 m 10 m
Figure 5-4: Wind Roses for Winds at 4 Levels at the Project Site (Lelu Island) for Years 2008-2010
NORTH
SOUTH
WEST EAST
4%
8%
12%
16%
20%
WIND SPEED (m/s)
>= 10.0
8.0 - 10.0
6.0 - 8.0
4.0 - 6.0
2.0 - 4.0
0.1 - 2.0
Calms: 0.02%
NORTH
SOUTH
WEST EAST
4%
8%
12%
16%
20%
WIND SPEED (m/s)
>= 10.0
8.0 - 10.0
6.0 - 8.0
4.0 - 6.0
2.0 - 4.0
0.1 - 2.0
Calms: 0.02%
NORTH
SOUTH
WEST EAST
4%
8%
12%
16%
20%
WIND SPEED (m/s)
>= 10.0
8.0 - 10.0
6.0 - 8.0
4.0 - 6.0
2.0 - 4.0
0.1 - 2.0
Calms: 0.02%
NORTH
SOUTH
WEST EAST
4%
8%
12%
16%
20%
WIND SPEED (m/s)
>= 10.0
8.0 - 10.0
6.0 - 8.0
4.0 - 6.0
2.0 - 4.0
0.1 - 2.0
Calms: 0.03%

Pacific NorthWest LNG Appendix 5: CALMET
February 2014
Project No. 1231-10537 16
240 m 120 m
60 m 10 m
Figure 5-5: Wind Roses for Winds at 4 Levels at the Marine Berth site for Years 2008-2010
NORTH
SOUTH
WEST EAST
4%
8%
12%
16%
20%
WIND SPEED (m/s)
>= 10.0
8.0 - 10.0
6.0 - 8.0
4.0 - 6.0
2.0 - 4.0
0.1 - 2.0
Calms: 0.00%
NORTH
SOUTH
WEST EAST
4%
8%
12%
16%
20%
WIND SPEED (m/s)
>= 10.0
8.0 - 10.0
6.0 - 8.0
4.0 - 6.0
2.0 - 4.0
0.1 - 2.0
Calms: 0.00%
NORTH
SOUTH
WEST EAST
4%
8%
12%
16%
20%
WIND SPEED (m/s)
>= 10.0
8.0 - 10.0
6.0 - 8.0
4.0 - 6.0
2.0 - 4.0
0.1 - 2.0
Calms: 0.02%
NORTH
SOUTH
WEST EAST
4%
8%
12%
16%
20%
WIND SPEED (m/s)
>= 10.0
8.0 - 10.0
6.0 - 8.0
4.0 - 6.0
2.0 - 4.0
0.1 - 2.0
Calms: 0.05%

Pacific NorthWest LNG Appendix 5: CALMET
February 2014 Project No. 1231-10537
17
2.6.2 Surface Temperature Figure 5-6 and 5-7 show the modelled monthly average surface temperatures extracted at the Project site and at the marine berth for the period of 2008-2010. The modelled monthly temperatures indicate a reasonable seasonal surface temperature variation.
Figure 5-6: CALMET Predicted Monthly Average Surface Temperature at the Project Site (Lelu Island) for 2008-2010
Figure 5-7: CALMET Predicted Monthly Average Surface Temperature at the Marine Berth site for 2008-2010
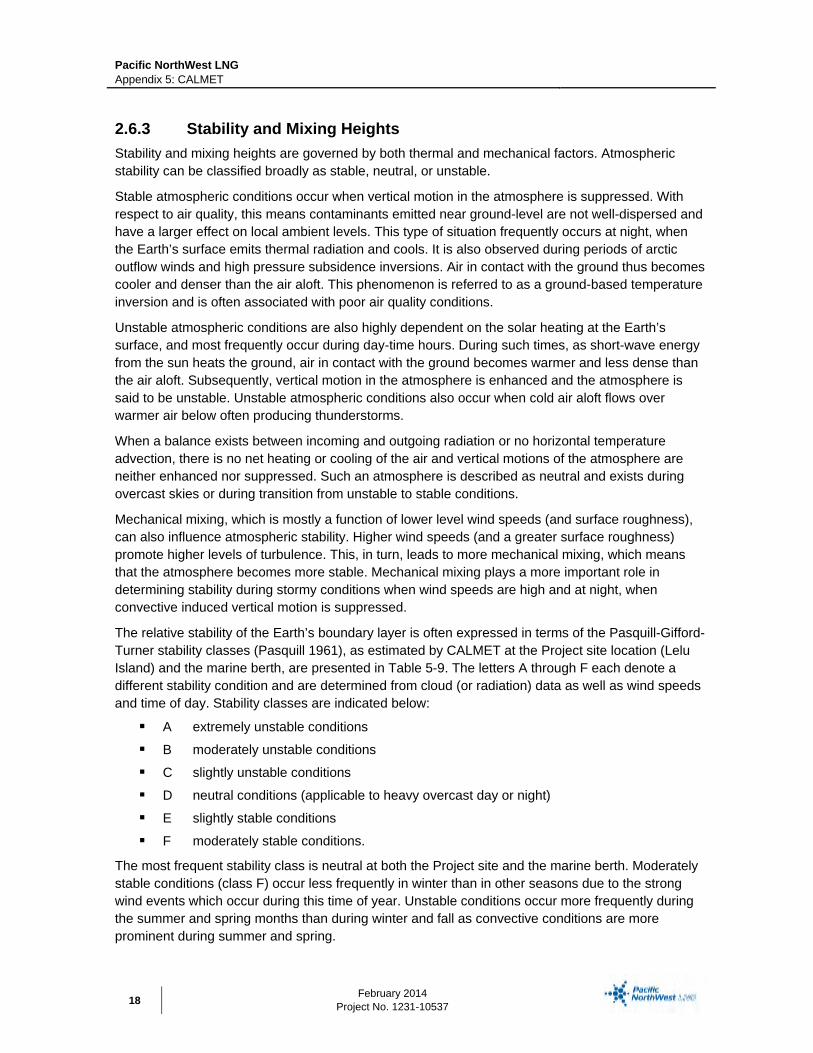
Pacific NorthWest LNG Appendix 5: CALMET
February 2014
Project No. 1231-10537 18
2.6.3 Stability and Mixing Heights Stability and mixing heights are governed by both thermal and mechanical factors. Atmospheric stability can be classified broadly as stable, neutral, or unstable.
Stable atmospheric conditions occur when vertical motion in the atmosphere is suppressed. With respect to air quality, this means contaminants emitted near ground-level are not well-dispersed and have a larger effect on local ambient levels. This type of situation frequently occurs at night, when the Earth’s surface emits thermal radiation and cools. It is also observed during periods of arctic outflow winds and high pressure subsidence inversions. Air in contact with the ground thus becomes cooler and denser than the air aloft. This phenomenon is referred to as a ground-based temperature inversion and is often associated with poor air quality conditions.
Unstable atmospheric conditions are also highly dependent on the solar heating at the Earth’s surface, and most frequently occur during day-time hours. During such times, as short-wave energy from the sun heats the ground, air in contact with the ground becomes warmer and less dense than the air aloft. Subsequently, vertical motion in the atmosphere is enhanced and the atmosphere is said to be unstable. Unstable atmospheric conditions also occur when cold air aloft flows over warmer air below often producing thunderstorms.
When a balance exists between incoming and outgoing radiation or no horizontal temperature advection, there is no net heating or cooling of the air and vertical motions of the atmosphere are neither enhanced nor suppressed. Such an atmosphere is described as neutral and exists during overcast skies or during transition from unstable to stable conditions.
Mechanical mixing, which is mostly a function of lower level wind speeds (and surface roughness), can also influence atmospheric stability. Higher wind speeds (and a greater surface roughness) promote higher levels of turbulence. This, in turn, leads to more mechanical mixing, which means that the atmosphere becomes more stable. Mechanical mixing plays a more important role in determining stability during stormy conditions when wind speeds are high and at night, when convective induced vertical motion is suppressed.
The relative stability of the Earth’s boundary layer is often expressed in terms of the Pasquill-Gifford-Turner stability classes (Pasquill 1961), as estimated by CALMET at the Project site location (Lelu Island) and the marine berth, are presented in Table 5-9. The letters A through F each denote a different stability condition and are determined from cloud (or radiation) data as well as wind speeds and time of day. Stability classes are indicated below:
A extremely unstable conditions
B moderately unstable conditions
C slightly unstable conditions
D neutral conditions (applicable to heavy overcast day or night)
E slightly stable conditions
F moderately stable conditions.
The most frequent stability class is neutral at both the Project site and the marine berth. Moderately stable conditions (class F) occur less frequently in winter than in other seasons due to the strong wind events which occur during this time of year. Unstable conditions occur more frequently during the summer and spring months than during winter and fall as convective conditions are more prominent during summer and spring.

Pacific NorthWest LNG Appendix 5: CALMET
February 2014 Project No. 1231-10537
19
Table 5-9: Predicted Seasonal Atmospheric Stability Frequencies (%) for the Project Site (Lelu Island) and the Marine Berth for 2008-2010
Pasquill Stability Category
Frequency (%)
Winter Spring Summer Fall Lelu
Island Marine Berth
Lelu Island
Marine Berth
Lelu Island
Marine Berth
Lelu Island
Marine Berth
A 0.00 0.00 0.17 0.29 0.20 0.18 0.08 0.11
B 0.09 0.31 3.94 5.57 5.24 6.36 1.37 2.21
C 1.55 2.37 6.39 7.00 6.82 7.53 3.40 4.85
D 93.25 89.02 82.84 77.70 81.76 78.49 87.99 81.56
E 2.86 5.63 3.43 4.53 2.49 2.39 3.53 5.56
F 2.25 2.68 3.25 4.91 3.49 5.06 3.63 5.71
The mixing height is the depth of the unstable air in the atmospheric boundary layer, as influenced by the mechanical and buoyant forces previously described. The height of the mixing layer is an extremely important factor in determining the dispersion of pollution in the atmosphere. Under low mixing heights, a relatively small emission amounts can have a marked effect on local air quality.
The CALMET model calculates a maximum mixing height, as determined by either convective or mechanical forces. The convective mixing height is the height to which an air package will rise under the buoyant forces created by the heating of the Earth’s surface. The convective mixing height is dependent on solar radiation amount, wind speed, as well as the vertical temperature structure of the atmosphere. Mechanical mixing heights are, similarly, the height to which an air package will rise under the influence of mechanical-invoked turbulence. The mechanical mixing height is proportional to low-level wind speeds and surface roughness.
Diurnal variations of mean mixing height, as estimated by the CALMET model at the Project site and the marine berth are shown for each season in Figure 5-8 and Figure 5-9, respectively. The results indicate that mean mixing heights are actually greater in fall and winter than during spring and summer at both sites. Note also that the mixing heights during the winter and fall months exhibit less of a diurnal fluctuation that the mixing heights in spring and summer. Both these trends indicate that mixing heights in the region are frequently mechanically-induced. Since a greater proportion of high wind speed events happen during the winter months, more mechanically-driven mixing will occur during this time of year. Since this type of event can happen during the day or at night, the diurnal fluctuation of mean mixing heights during winter is not very pronounced.
During summer months, more convective mixing is expected than in winter due to different surface radiation budgets. Maximum mixing heights usually occur during mid-afternoon hours when the effects of solar heating are greatest; minimum heights occur most frequently at night. This can be attributed to two factors:
Advection of the more stable summer marine boundary layer into the site area;
Less surface heating due to ocean proximity, the cooler climate, higher wind speeds, and persistent cloud cover in the project area.
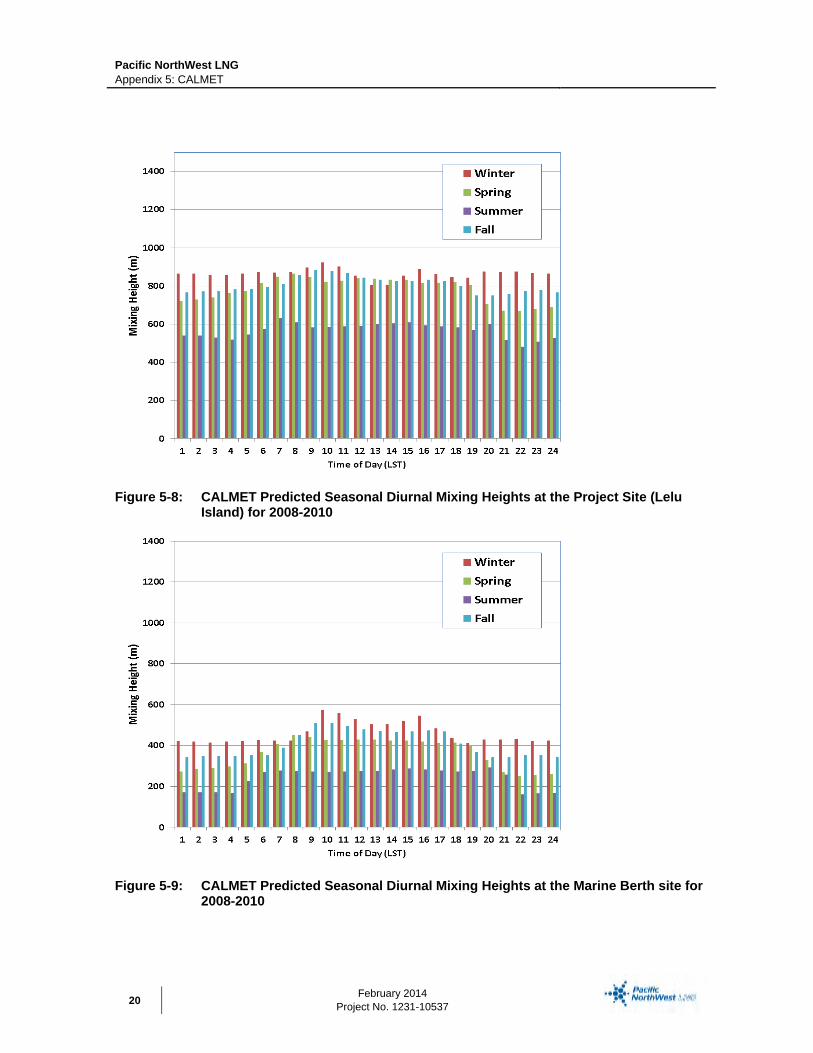
Pacific NorthWest LNG Appendix 5: CALMET
February 2014
Project No. 1231-10537 20
Figure 5-8: CALMET Predicted Seasonal Diurnal Mixing Heights at the Project Site (Lelu Island) for 2008-2010
Figure 5-9: CALMET Predicted Seasonal Diurnal Mixing Heights at the Marine Berth site for 2008-2010
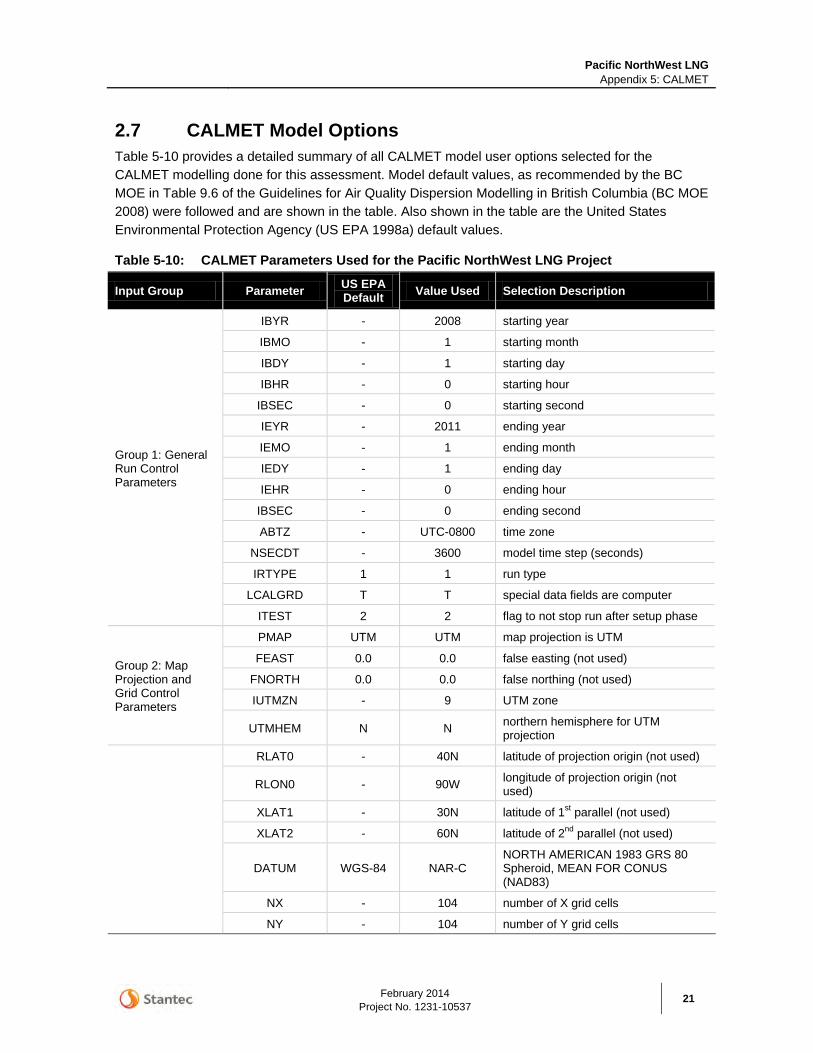
Pacific NorthWest LNG Appendix 5: CALMET
February 2014 Project No. 1231-10537
21
2.7 CALMET Model Options Table 5-10 provides a detailed summary of all CALMET model user options selected for the CALMET modelling done for this assessment. Model default values, as recommended by the BC MOE in Table 9.6 of the Guidelines for Air Quality Dispersion Modelling in British Columbia (BC MOE 2008) were followed and are shown in the table. Also shown in the table are the United States Environmental Protection Agency (US EPA 1998a) default values.
Table 5-10: CALMET Parameters Used for the Pacific NorthWest LNG Project
Input Group Parameter US EPA Default Value Used Selection Description
Group 1: General Run Control Parameters
IBYR - 2008 starting year
IBMO - 1 starting month
IBDY - 1 starting day
IBHR - 0 starting hour
IBSEC - 0 starting second
IEYR - 2011 ending year
IEMO - 1 ending month
IEDY - 1 ending day
IEHR - 0 ending hour
IBSEC - 0 ending second
ABTZ - UTC-0800 time zone
NSECDT - 3600 model time step (seconds)
IRTYPE 1 1 run type
LCALGRD T T special data fields are computer
ITEST 2 2 flag to not stop run after setup phase
Group 2: Map Projection and Grid Control Parameters
PMAP UTM UTM map projection is UTM
FEAST 0.0 0.0 false easting (not used)
FNORTH 0.0 0.0 false northing (not used)
IUTMZN - 9 UTM zone
UTMHEM N N northern hemisphere for UTM projection
RLAT0 - 40N latitude of projection origin (not used)
RLON0 - 90W longitude of projection origin (not used)
XLAT1 - 30N latitude of 1st parallel (not used)
XLAT2 - 60N latitude of 2nd parallel (not used)
DATUM WGS-84 NAR-C NORTH AMERICAN 1983 GRS 80 Spheroid, MEAN FOR CONUS (NAD83)
NX - 104 number of X grid cells
NY - 104 number of Y grid cells

Pacific NorthWest LNG Appendix 5: CALMET
February 2014
Project No. 1231-10537 22
Input Group Parameter US EPA Default Value Used Selection Description
DGRIDKM - 0.5 grid spacing in X and Y directions (km)
XORIGKM - 388.0 reference easting of SW corner of SW grid cell in UTM (km)
YORIGKM - 5980.0 reference northing of SW corner of SW grid cell in UTM (km)
NZ - 8 number of vertical grid cells
ZFACE - 0, 20, 40, 80,
160, 320, 600, 1400,2600
vertical cell face heights of the NZ vertical layers (m)
Group 3: Output Options LSAVE T T save met data in unformatted output
files
IFORMO 1 1 type of unformatted output file
LPRINT F F print meteorological fields
IPRINF 1 12 print interval in hours
IUVOUT 0 1, 7*0 do not print u, v wind components
IWOUT 0 8*0 do not print w wind component
ITOUT 0 1, 7*0 do not print 3-d temperature fields
Specify Meteorological Fields to Print
STABILITY 1 print PGT stability class
USTAR 1 do not print friction velocity
MONIN 1 do not print Monin-Obukhov length
MIXHT 1 print mixing height
WSTAR 0 do not print convective velocity scale
PRECIP 1 do not print precipitation rate
SENSHEAT 0 do not print sensible heat flux
CONVZI 0 do not print convective mixing height
Testing and Debugging Options
LDB F F print input and internal variables
NN1 1 1 first time step to print data
NN2 1 1 last time step to print data
LDBCST F F do not print distance to land internal variables
IOUTD 0 0 control variable to note write test data to disk
NZPRN2 1 1 number of levels to print
IPR0 0 0 do not print interpolated wind components
IPR1 0 0 do not print the terrain adjusted wind components

Pacific NorthWest LNG Appendix 5: CALMET
February 2014 Project No. 1231-10537
23
Input Group Parameter US EPA Default Value Used Selection Description
IPR2 0 0 do not print smoothed wind components and initial divergence fields
IPR3 0 0 do not print final wind speed and direction
IPR4 0 0 do not print final divergence fields
IPR5 0 0 do not print winds after kinematic effects are added
IPR6 0 0 do not print winds after the froude number adjustment
IPR7 0 0 do not print wind after slope flow adjustment
IPR8 0 0 do not print final wind field components
Group 4: Meteorological Data Options
NOOBS 0 1 use surface, overwater, and upper air stations
NSSTA - 3 number of surface stations
NPSTA - -1 number of precipitation stations (-1 flag for MM5/3D.dat precip data)
ICLOUD 0 0 gridded cloud data not used
IFORMS 2 2 surface meteorological data file format
IFORMP 2 2 precipitation data file format
IFORMC 2 2 cloud data file format
Group 5: Wind Field Options and Parameters
IWFCOD 1 1 wind field diagnostic model selected
IFRADJ 1 1 use froude number adjustment
IKINE 0 0 do not use kinematic effects adjustment
IOBR 0 0 use O’Brien procedure to adjust vertical velocity
ISLOPE 1 1 compute slope flow effects
IEXTRP -4 Not Applicable Extrapolate surface wind data to upper layers using similarity theory.
ICALM 0 0 do not extrapolate surface winds if calm
BIAS NZ*0 8*0
Layer dependent bias in vertical interpolation between surface and upper-air data in first guess field. Prognostic data is used, therefore the model ignores this option.
RMIN2 4 -1
Minimum distance from nearest upper-air station to surface station for which extrapolation of surface winds at surface station be allowed. Not Used if NOOBS=1

Pacific NorthWest LNG Appendix 5: CALMET
February 2014
Project No. 1231-10537 24
Input Group Parameter US EPA Default Value Used Selection Description
IPROG 0 14 use gridded prognostic wind field model output as input to the diagnostic wind field model
ISTEPPGS 3600 3600 time step (seconds) of input prognostic data
IGFMET 0 0 use coarse CALMET fields as initial guess fields
LVARY F F
Use varying radius of influence. if no stations are found within RMAX1,RMAX2, or RMAX3, then the closest station will be used.
RMAX1 - 5 maximum radius of influence over land in the surface layer (km)
RMAX2 - 10 maximum radius of influence over land aloft (km)
RMAX3 - 0.5 maximum radius of influence over water (km)
RMIN 0.1 0.1 minimum radius of influence used in the wind field interpolation (km)
TERRAD 15 2.5 radius of influence of terrain features (km)
R1 - 2 relative weighting of the first guess field and observations in the surface layer (km)
Group 5: Wind Field Options and Parameters
R2 - Not Applicable relative weighting of the first guess field and observations in the upper layer (km)
RPROG - 0 relative weighting of the prognostic wind field data (km) (not used)
DIVLIM 5 E-6 5 E-6 maximum acceptable divergence in divergence minimization procedure
NITER 50 50 maximum number of iterations in the divergence minimization procedure
NITER2 99*NZ 99*8 maximum number of stations used in each layer for the interpolation of data to a grid point
NSMTH 2,
(nz - 1)*4 2, 7, 7, 14, 14,
28, 28, 28 number of passes in the smoothing procedure
CRITFN 1 1 critical Froude number
ALPHA 0.1 0.1 empirical factor controlling kinematic effects
FEXTR2 0*NZ 0*8 multiplicative scaling factor for extrapolation of surface observations to upper layers (not used)
NBAR 0 0 number of barriers to interpolation of wind

Pacific NorthWest LNG Appendix 5: CALMET
February 2014 Project No. 1231-10537
25
Input Group Parameter US EPA Default Value Used Selection Description
KBAR NZ Not Applicable level (1 to NZ) up to which barriers apply
XBBAR - Not Applicable X coordinate of beginning of barrier (Not Used)
YBBAR - Not Applicable Y coordinate of beginning of barrier (Not Used)
XEBAR - Not Applicable X coordinate of end of barrier (Not Used)
YEBAR - Not Applicable Y coordinate of end of barrier (Not Used)
IDIOPT1 0 0 Computer surface temperature internally from surface monitoring data for Diagnostic Wind Module
ISURFT - -1
Surface meteorological station to use for the surface temperature in Diagnostic Wind Module (-1 to use 2-D spatially varying surface temperatures)
IDIOPT2 0 0 Domain-averaged temperature lapse rate computed internally from upper-air soundings
IUPT - -1 Upper-air station to use for the domain-scale lapse rate (-1 to use 2-D spatially varying lapse rate).
ZUPT 200 200 depth through which the domain-scale lapse rate is computer (m)
IDIOPT3 0 0 domain-averaged wind components calculated internally
IUPWND -1 -1 upper-air station to use for the domain scale winds
ZUPWND 1, 1000 1, 1000 bottom and top of layer through which domain-scale winds are computed (m)
IDIOPT4 0 0 observed surface wind components read from surface data file
IDIOPT5 0 0 observed upper wind components read from upper-air data file
LLBREZE F F do not use lake breeze module
NBOX - 0 number of lake breeze regions
XG1 - 0 X grid line 1 of region of interest
Group 5: Wind Field Options and Parameters
XG2 - 0 X grid line 2 of region of interest
YG1 - 0 Y grid line 1 of region of interest
YG2 - 0 Y grid line 2 of region of interest
XBCST - 0 X point defining coast line
YBCST - 0 Y point defining coast line
XECST - 0 X point defining coast line
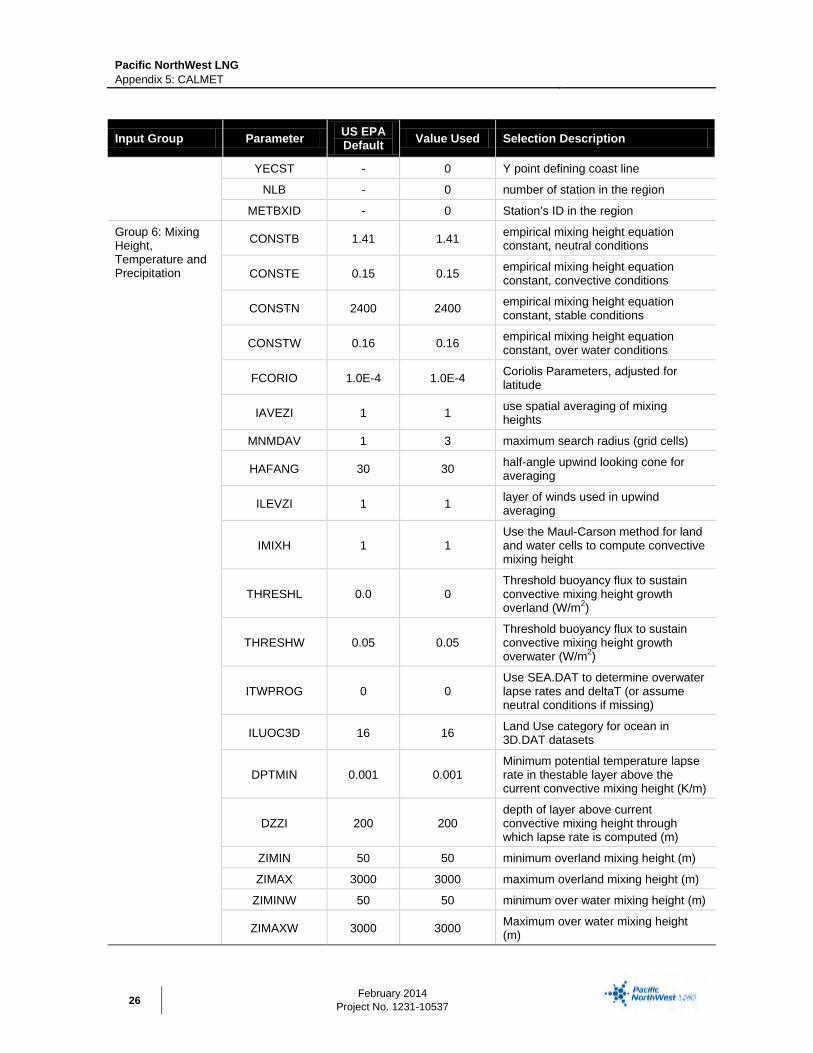
Pacific NorthWest LNG Appendix 5: CALMET
February 2014
Project No. 1231-10537 26
Input Group Parameter US EPA Default Value Used Selection Description
YECST - 0 Y point defining coast line
NLB - 0 number of station in the region
METBXID - 0 Station’s ID in the region
Group 6: Mixing Height, Temperature and Precipitation
CONSTB 1.41 1.41 empirical mixing height equation constant, neutral conditions
CONSTE 0.15 0.15 empirical mixing height equation constant, convective conditions
CONSTN 2400 2400 empirical mixing height equation constant, stable conditions
CONSTW 0.16 0.16 empirical mixing height equation constant, over water conditions
FCORIO 1.0E-4 1.0E-4 Coriolis Parameters, adjusted for latitude
IAVEZI 1 1 use spatial averaging of mixing heights
MNMDAV 1 3 maximum search radius (grid cells)
HAFANG 30 30 half-angle upwind looking cone for averaging
ILEVZI 1 1 layer of winds used in upwind averaging
IMIXH 1 1 Use the Maul-Carson method for land and water cells to compute convective mixing height
THRESHL 0.0 0 Threshold buoyancy flux to sustain convective mixing height growth overland (W/m2)
THRESHW 0.05 0.05 Threshold buoyancy flux to sustain convective mixing height growth overwater (W/m2)
ITWPROG 0 0 Use SEA.DAT to determine overwater lapse rates and deltaT (or assume neutral conditions if missing)
ILUOC3D 16 16 Land Use category for ocean in 3D.DAT datasets
DPTMIN 0.001 0.001 Minimum potential temperature lapse rate in thestable layer above the current convective mixing height (K/m)
DZZI 200 200 depth of layer above current convective mixing height through which lapse rate is computed (m)
ZIMIN 50 50 minimum overland mixing height (m)
ZIMAX 3000 3000 maximum overland mixing height (m)
ZIMINW 50 50 minimum over water mixing height (m)
ZIMAXW 3000 3000 Maximum over water mixing height (m)

Pacific NorthWest LNG Appendix 5: CALMET
February 2014 Project No. 1231-10537
27
Input Group Parameter US EPA Default Value Used Selection Description
ICOARE 10 10 COARE Method with no wave parameterization used to determine overwater surface flux
DSHELF 0 0 Coastal/Shallow water length scale (km)
IWARM 0 0 COARE warm layer computation turned off
Group 6: Mixing Height, Temperature and Precipitation
ICOOL 0 0 COARE cool skin layer computation turned off
IRHPROG 0 1 Relative humidity from surface observations
ITPROG 0 2
Compute surface temperatures from observed stations, upper air temperatures from MM5 data (2 = No surface or upper-air observations use MM5/3D.DAT for surface and upper-air data (only if NOOBS = 0,1,2)
IRAD 1 1 Use 1/R interpolation scheme
TRADKM 500 500 Radius of influence for temperature interpolation (km)
NUMTS 5 5 maximum number of stations to include in interpolation
IAVET 1 1 use spatial averaging of temperature data
TGDEFB -0.0098 -0.0098 default temperature gradient below the mixing height, over water (k/m)
TGDEFA -0.0045 -0.0045 default temperature gradient above the mixing height, over water (k/m)
JWAT1 - 55
Beginning land use category for temperature interpolation over water. Make bigger than largest land use to disable.
JWAT2 - 55
Ending land use category for temperature interpolation over water. Make bigger than largest land use to disable.
NFLAGP 2 Not Applicable Use 1/R2 interpolation scheme for precipitation interpolation
SIGMAP 100 Not Applicable radius of influence for interpolation from precipitation stations (km)
CUTP 0.01 Not Applicable minimum precipitation rate cut off (mm/hr)

Pacific NorthWest LNG Appendix 5: CALMET
February 2014
Project No. 1231-10537 28
Input Group Parameter US EPA Default Value Used Selection Description
Group 7: Surface meteorological station parameters
Surface Meteorological Stations Used
Name ID Easting (km) Norting (km) Time Zone
Anemometer Height (m)
HOLROCK 99991 411.170 6003.570 8 10
PRAWOS 99992 405.953 6016.318 8 10
TERRACE 99993 527.384 6035.497 8 10
Pacific NorthWest LNG Appendix 5: CALMET
February 2014 Project No. 1231-10537
29
3 REFERENCES Allwine, K.J., and C.D. Whiteman. 1985. MELSAR: A mesoscale air quality model for complex
terrain: Volume 1 – Overview, technical description and user’s guide. Pacific Northwest Laboratory, Richland, Washington.
Atmospheric Sciences Group at TRC (TRC). 2011. CALMET Model Download. Available at: http://www.src.com/calpuff/calpuff1.htm
BC MOE (British Columbia Ministry of Environment). 2008: Guidelines for Air Quality Dispersion Modeling in British Columbia.
Carson, D.J. (1973). The development of a dry, inversion-capped, convectively unstable boundary layer. Quart. J. Roy. Meteor. Soc., 99: 450-467.
CDED (Canadian Digital Elevation Data). 2009. Available at: http://www.geobase.ca/geobase/en/data/cded/ description.html;jsessionid=2A590C1F53D1EC843B1CEA547C94F499.
CEC (Commission for Environmental Cooperation). 2010: North American Land Change Monitoring System (NALCMS) North American Land Cover Data. 2010. Available at: http://www.cec.org/Page.asp?PageID=924&ContentID=2819.
Commission for Environmental Cooperation. 2010: 2005 North American Land Cover at 250 m spatial resolution. Produced by Natural Resources Canada/Canadian Centre for Remote Sensing (NRCan/CCRS), United States Geological Survey (USGS); Insituto Nacional de Estadística y Geografía (INEGI), Comisión Nacional para el Conocimiento y Uso de la Biodiversidad (CONABIO) and Comisión Nacional Forestal (CONAFOR).
Douglas, S., and R. Kessler. 1988. User’s guide to the diagnostic wind model. California Air Resources Board, Sacramento, CA.
Garratt, J.R. 1977. Review of drag coefficients over oceans and continents. Mon. Wea. Rev., 105: 915-929.
Hanna, S.R., L.L. Schulman, R.J. Paine, J.E. Pleim, and M. Baer. 1985. Development and evaluation of the Offshore and Coastal Dispersion Model. JAPCA, 35: 1039-1047.
Holtslag, A.A.M., and A.P. van Ulden. 1983: A simple scheme for daytime estimates of the surface fluxes from routine weather data, J. Clim. and Appl. Meteor., 22: 517-529.
Liu, M. K. and M. A. Yocke. 1980. Siting of wind turbine generators in complex terrain. Journal of Energy, 4: 10:16.
Maul, P.R. 1980. Atmospheric transport of sulfur compound pollutants. Central Electricity Generating Bureau MID/SSD/80/0026/R. Nottingham, England.
O’Brien, J.J. 1970. A note on the vertical structure of eddy exchange coefficient in the planetary boundary layer. J. Atmos. Sci., 27: 1213-1215.
Pasquill F. (1961). The estimation of the dispersion of wind-borne material. Meteorological Magazine, 90: 33-48.

Pacific NorthWest LNG Appendix 5: CALMET
February 2014
Project No. 1231-10537 30
Scire, J.S., F.R. Robe, M.E. Fernau, and R.J. Yamartino. (2000). A User’s Guide for the CALMET Meteorological Model (Version 5). Earth Tech, Inc., Concord, MA.
Steyn, D.G. and Bruce Ainslie, 2012. RE: Preparation of questions for KAPA to submit to Environmental Assessment Process. Letter Report prepared for Don Barz, Kamloops Area Preservation.
United States Environmental Protection Agency (US EPA). 1998. United States Environmental Protection Agency. Interagency Workgroup on Air Quality Modelling (IWAQM) Phase 1 Summary Report and Recommendations for Modelling Long Range Transport Impacts. EPA-454/R-98-019.