appendix c technical memorandum- regional...
TRANSCRIPT

Appendix C Technical Memorandum-
Regional Conveyance System Needs


Conveyance System Improvement Program
Technical Memorandum
Regional Conveyance System Needs Issued December 2005
Revised March 2007
King Street Center, KSC-NR-0512
201 South Jackson Street Seattle, WA 98104
http://dnr.metrokc.gov/wtd/csi/


Technical Memorandum
Regional Conveyance System Needs
Issued December 2005
Revised March 2007
Conveyance System Improvement Program
King Street Center, KSC-NR-0512 201 South Jackson Street
Seattle, WA 98104 http://dnr.metrokc.gov/wtd/csi/

For comments or questions, contact: Mark Lampard, Project Manager King County Wastewater Treatment Division 201 South Jackson Street M.S. KSC-NR-0512 Seattle, WA 98104-3856 206- 263-3162 [email protected] Alternate Formats Available 206-684-1242 TTY Relay: 711

Regional Conveyance System Needs i March 2007
Table of Contents
Conveyance System Improvement Program Overview ............................................ iii Conveyance System Planning History............................................................................................ iv Current Conveyance System Planning Process .............................................................................. iv
Section 1 Process for Identifying Needs................................................................ 1-1 1.1 Conveyance Planning Areas ...............................................................................................1-1 1.2 Needs Based on Capacity....................................................................................................1-3
1.2.1 How Capacity Related Conveyance Needs Were Determined..............................1-6 1.3 Conveyance Improvement Needs Based on System Condition ........................................1-10
1.3.1 Condition Inspection and Assessment Process....................................................1-11 1.4 Conveyance System Age ..................................................................................................1-13
Section 2 Regional Conveyance System Capacity Needs.................................... 2-1 2.1 Capacity Needs in the Separated System............................................................................2-1 2.2 Capacity Needs in the Combined System ...........................................................................2-5
Section 3 Regional Conveyance System Condition.............................................. 3-1
Section 4 Regional Conveyance System Age........................................................ 4-1 4.1 Pipe Age..............................................................................................................................4-1 4.2 Expected Life of Sewer Pipe...............................................................................................4-2
4.2.1 Brick Sewers..........................................................................................................4-3 4.2.2 Concrete Pipe ........................................................................................................4-3 4.2.3 Ferrous Pipe...........................................................................................................4-4 4.2.4 Plastic Pipe ............................................................................................................4-4
4.3 Age of Mechanical Equipment (pumps and pump station equipment) ...............................4-5 4.4 Maps of Age and Material Type by Planning Basin ...........................................................4-5
Section 5 Crosswalk to Past Conveyance Planning Documents......................... 5-1 5.1 Crosswalk to Identified Capacity Needs .............................................................................5-1 5.2 Facility Acquisitions and Extensions..................................................................................5-5
List of Tables Table 2-1. Capacity Needs in the Separated Conveyance System.............................................................2-2 Table 2-2. Planned CSO Control Projects .................................................................................................2-5 Table 3-1. Identified High Priority Needs due to Hydrogen Sulfide Corrosion ........................................3-3 Table 5-1. Conveyance System Capacity Needs by Planning Basin .........................................................5-2
List of Figures Figure 1-1. Conveyance System Improvement Sub-regional Planning Areas within the WTD
Wastewater Service Area.................................................................................................1-2 Figure 1-2. Sources of Infiltration and Inflow ...........................................................................................1-3 Figure 1-3. Projected Growth in Base Flow ..............................................................................................1-4 Figure 1-4. Impacts of I/I on Wastewater Flows .......................................................................................1-5

Table of Contents
ii Regional Conveyance System Needs March 2007
Figure 1-5. Comparison of Modeled Flow Data to Measured Flow Data..................................................1-9 Figure 1-6. Years of exposure to wastewater and hydrogen sulfide gas (H2S) have exposed
reinforcement bars in some sewer pipes. .......................................................................1-11 Figure 1-7. A construction worker applies part of plastic liner inside a corroded sewer pipe.................1-11 Figure 2-1. Currently Identified Capacity Constraints...............................................................................2-4 Figure 2-2. Planned CSO Control projects ................................................................................................2-7 Figure 2-3. Capacity Constraints – Hidden Lake.......................................................................................2-8 Figure 2-4. Capacity Constraints – Northeast Lake Washington...............................................................2-9 Figure 2-5. Capacity Constraints – North Green River............................................................................2-10 Figure 2-6. Capacity Constraints – North Lake Sammamish ..................................................................2-11 Figure 2-7. Capacity Constraints – North Lake Washington...................................................................2-12 Figure 2-8. Capacity Constraints – Northwest Lake Washington............................................................2-13 Figure 2-9. Capacity Constraints – Southeast Lake Washington.............................................................2-14 Figure 2-10. Capacity Constraints – South Green River, Kent Planning Zone .......................................2-15 Figure 2-11. Capacity Constraints – South Green River, Auburn Planning Zone ...................................2-16 Figure 2-12. Capacity Constraints – South Green River, Soos Planning Zone .......................................2-17 Figure 2-13. Capacity Constraints – South Lake Sammamish ................................................................2-18 Figure 2-14. Capacity Constraints – South Lake Washington.................................................................2-19 Figure 3-1. Identified High Priority Hydrogen Sulfide Corrosion Sites ....................................................3-4 Figure 4-1. Overall Age of the Conveyance System..................................................................................4-1 Figure 4-2. Breakdown of Conveyance System Components by Material Type.......................................4-2 Figure 4-3. Age Breakdown of Brick Sewers ............................................................................................4-3 Figure 4-4. Age Breakdown of Concrete Pipe...........................................................................................4-3 Figure 4-5. Age Breakdown of Ferrous Pipe .............................................................................................4-4 Figure 4-6. Age Breakdown of Plastic Pipe...............................................................................................4-4 Figure 4-7. Pipe Age and Material – Combined System ...........................................................................4-6 Figure 4-8. Pipe Age and Material – Hidden Lake ....................................................................................4-7 Figure 4-9. Pipe Age and Material – Northwest Lake Washington...........................................................4-8 Figure 4-10. Pipe Age and Material – North Lake Washington ................................................................4-9 Figure 4-11. Pipe Age and Material – Northeast Lake Washington ........................................................4-10 Figure 4-12. Pipe Age and Material – North Lake Sammamish..............................................................4-11 Figure 4-13. Pipe Age and Material – South Lake Washington ..............................................................4-12 Figure 4-14. Pipe Age and Material – Southeast Lake Washington ........................................................4-13 Figure 4-15. Pipe Age and Material – South Lake Sammamish..............................................................4-14 Figure 4-16. Pipe Age and Material – North Green River.......................................................................4-15 Figure 4-17. Pipe Age and Material – South Green River, Auburn Planning Zone ................................4-16 Figure 4-18. Pipe Age and Material – South Green River, Kent Planning Zone.....................................4-17 Figure 4-19. Pipe Age and Material – South Green River, Soos Planning Zone.....................................4-18
Regional Conveyance System Needs iii March 2007
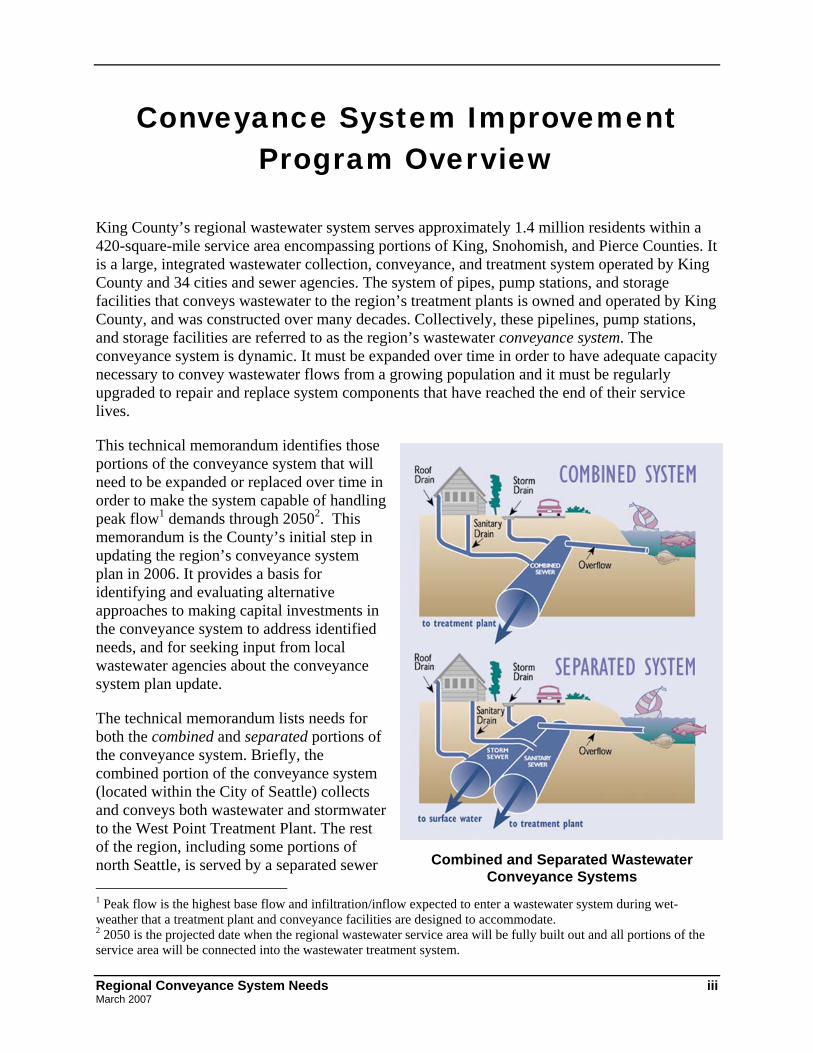
Combined and Separated Wastewater Conveyance Systems
Conveyance System Improvement Program Overview
King County’s regional wastewater system serves approximately 1.4 million residents within a 420-square-mile service area encompassing portions of King, Snohomish, and Pierce Counties. It is a large, integrated wastewater collection, conveyance, and treatment system operated by King County and 34 cities and sewer agencies. The system of pipes, pump stations, and storage facilities that conveys wastewater to the region’s treatment plants is owned and operated by King County, and was constructed over many decades. Collectively, these pipelines, pump stations, and storage facilities are referred to as the region’s wastewater conveyance system. The conveyance system is dynamic. It must be expanded over time in order to have adequate capacity necessary to convey wastewater flows from a growing population and it must be regularly upgraded to repair and replace system components that have reached the end of their service lives.
This technical memorandum identifies those portions of the conveyance system that will need to be expanded or replaced over time in order to make the system capable of handling peak flow1 demands through 20502. This memorandum is the County’s initial step in updating the region’s conveyance system plan in 2006. It provides a basis for identifying and evaluating alternative approaches to making capital investments in the conveyance system to address identified needs, and for seeking input from local wastewater agencies about the conveyance system plan update.
The technical memorandum lists needs for both the combined and separated portions of the conveyance system. Briefly, the combined portion of the conveyance system (located within the City of Seattle) collects and conveys both wastewater and stormwater to the West Point Treatment Plant. The rest of the region, including some portions of north Seattle, is served by a separated sewer 1 Peak flow is the highest base flow and infiltration/inflow expected to enter a wastewater system during wet-weather that a treatment plant and conveyance facilities are designed to accommodate. 2 2050 is the projected date when the regional wastewater service area will be fully built out and all portions of the service area will be connected into the wastewater treatment system.

Conveyance System Improvement Program Overview
iv Regional Conveyance System Needs March 2007
system. Separated systems have separate collection and conveyance pipes for wastewater and stormwater. Separated wastewater systems dedicate their capacity to convey and treat wastewater only at the South or West Point Treatment Plants. The figure on the previous page illustrates the structural and functional differences of combined and separated sewer systems.
The conveyance system needs identified here (as well as in earlier conveyance system planning documents) account for the positive affect the planned Brightwater Treatment Plant will have on regional conveyance and treatment capacity. Any significant changes to the planned capacity of the Brightwater Treatment Plant or its construction schedule would affect both the number and timing of needed improvements to the regional conveyance system to manage projected wastewater flows.
Conveyance System Planning History Because regional wastewater needs are always changing, planning for the regional conveyance system is an ongoing function for the Wastewater Treatment Division. Initial planning began in 1959 when the newly formed Municipality of Metropolitan Seattle (Metro) completed their Metropolitan Seattle Sewerage and Drainage Survey. This original plan was largely implemented in the 1960’s, 70’s, and early 80’s. The conveyance plan was updated as a part of the Regional Wastewater Services Plan (RWSP), adopted by the King County Council in 1999. An update to the RWSP was presented to the council in April 2004 that included the latest data, information and analyses available at that time from the Conveyance System Improvement Program.
The conveyance system plan is being updated in 2006 because significant new needs were identified during development of the March 2005 Regional Needs Assessment (RNA) conducted for the Regional I/I Control Program. The purpose of the RNA was to identify CSI projects and costs in order to provide a baseline for conducting benefit/cost analyses of potential I/I reduction projects. The RNA, which is based on detailed data and information about base wastewater flows and infiltration and inflow (I/I) across the region, identified 63 capital conveyance projects needed through 2050. This conveyance system plan update further refines the needs identified in the RNA and categorizes those needs based on system age, condition or capacity.
Current Conveyance System Planning Process This technical memorandum builds on the work contained in the RNA by re-evaluating the capacity needs identified for the RNA; and by reviewing age and facility inspection data about the conveyance system in order to begin to identify capital needs based on the condition of existing pipelines, pump stations, and regulator facilities. It is the first milestone in a-two-year effort to develop a complete new conveyance system plan. The major objectives of this conveyance planning process are to:
• Identify regional conveyance improvements necessary to meet the County’s 20-year peak flow design standard; and
• Clearly document why there is a specific conveyance need, what improvement is needed, when, and its estimated cost.

Conveyance System Improvement Program Overview
Regional Conveyance System Needs v March 2007
The process for developing the Conveyance System Plan is as follows:
2005 Tasks Identify Capacity Constraints within Conveyance System
• Refine Capacity Needs Identified in the RNA
2nd Qtr 2005
Identify Conveyance System Age and Condition Information
• Based on Historical Records and Inspection Information
3rd Qtr 2005
Identify Any Conveyance Needs in the Combined System Not Addressed in the CSO Plan
• Integrate Combined System Conveyance Needs into the RNA
4th Qtr 2005
System
and Financial Analysis
2006 Tasks Present and Discuss Identified CSI Needs to Local Agencies and MWPAAC
1st Qtr 2006
Develop CSI Project Solutions to Identified Needs
• Planning Level Alternatives and Costs • Development of Alternatives to Involve Local
Agencies and MWPAAC
1st & 2nd Qtr 2006
Rate and Financial Analysis
• Balance Needs with Cash Flow 2nd & 3rd Qtr 2006
Project List and Schedule to Achieve Adopted Conveyance Standard
• To be Based on Analyses and Application of MWPAAC-Approved Prioritization Criteria
4th Qtr 2006
Develop Project Database • Track, Update, and Report on Conveyance
System Projects Ongoing
Local Sewer Agency
Input
System
and Financial Analysis


Regional Conveyance System Needs 1-1 March 2007
Section 1 Process for Identifying Needs
King County’s regional conveyance system includes the pipelines, pump stations, and regulator stations that transport wastewater to the regional treatment plants. The conveyance facilities include 42 pump stations, 19 flow regulator stations, and more than 275 miles of sewer lines.
Growth in flow volumes over time, largely due to population and employment growth that increase peak flow projections, is driving the need to address capacity limitations throughout the conveyance system. In addition to capacity concerns, the County’s conveyance system is aging and is continually in need of maintenance that includes inspection, cleaning, and repairing to preserve capacity and system integrity. Many conveyance facilities were built over 40 years ago. Over time, these older parts of the system may need to be of rehabilitated or replaced to prevent failures that could result in overflows or backups.
For this technical memorandum, conveyance needs have been identified based on assumptions about construction of the new Brightwater Treatment Plant, projected capacity needs and the current condition of specific conveyance system facilities identified through inspection. The age of system components has also been included to provide information about potentially needed capital investment in the future to repair or replace facilities that may no longer be able to be maintained efficiently.
This section of the technical memorandum provides background information about how conveyance system capacity, condition, and age information was obtained and how it was used to identify needs within the system.
1.1 Conveyance Planning Areas Due to the size of the King County conveyance system, management, inspection, planning, and needs prioritization have been facilitated by breaking the regional system into ten sub-regional planning areas. These ten sub-regional planning areas are shown in Figure 1-1 below.
Documentation on sub-regional planning areas includes details on specific facilities, local wastewater agencies, and wastewater service basins. Information gathered includes regional and local wastewater planning records, descriptions of the current regional and local facilities, demographics, infrastructure, environment, and governance within each basin. Other information gathered for each sub-regional planning area includes projected growth, data on flows, and known overflows. Ongoing system inspection provides documentation of system condition within the planning sub-areas. All of this information combined forms the basis for determining the overall system planning priorities.

Section 1. Process for Identifying Needs
1-2 Regional Conveyance System Needs March 2007
Figure 1-1. Conveyance System Improvement Sub-regional Planning Areas within the WTD Wastewater Service Area

Section 1. Process for Identifying Needs
Regional Conveyance System Needs 1-3 March 2007
1.2 Needs Based on Capacity The regional wastewater conveyance system has developed over the last 40-plus years. Most of the system has the necessary capacity to transmit wastewater flows today and in the future. However, some portions of the system are at or near capacity during periods of peak flow.1 As the region grows over time, these portions of the system and others will not have adequate capacity to transmit peak wastewater flows to treatment plants. Inadequate capacity in portions of the system increases the risk of wastewater backups and overflows during periods of peak flow.
The two factors that drive the need to expand capacity in the conveyance system are regional population growth and infiltration and inflow (I/I) flows within the system. I/I is groundwater and stormwater runoff that enters wastewater collection pipes during periods of rain. Most infiltration comes from groundwater; most inflow comes from stormwater. Sources of infiltration and inflow are identified in Figure 1-2.
Figure 1-2. Sources of Infiltration and Inflow
1 Peak flow is the highest base flow and infiltration/inflow expected to enter a wastewater system during wet-weather at a given frequency that a treatment plant and conveyance facilities are designed to accommodate.
Section 1. Process for Identifying Needs
1-4 Regional Conveyance System Needs March 2007
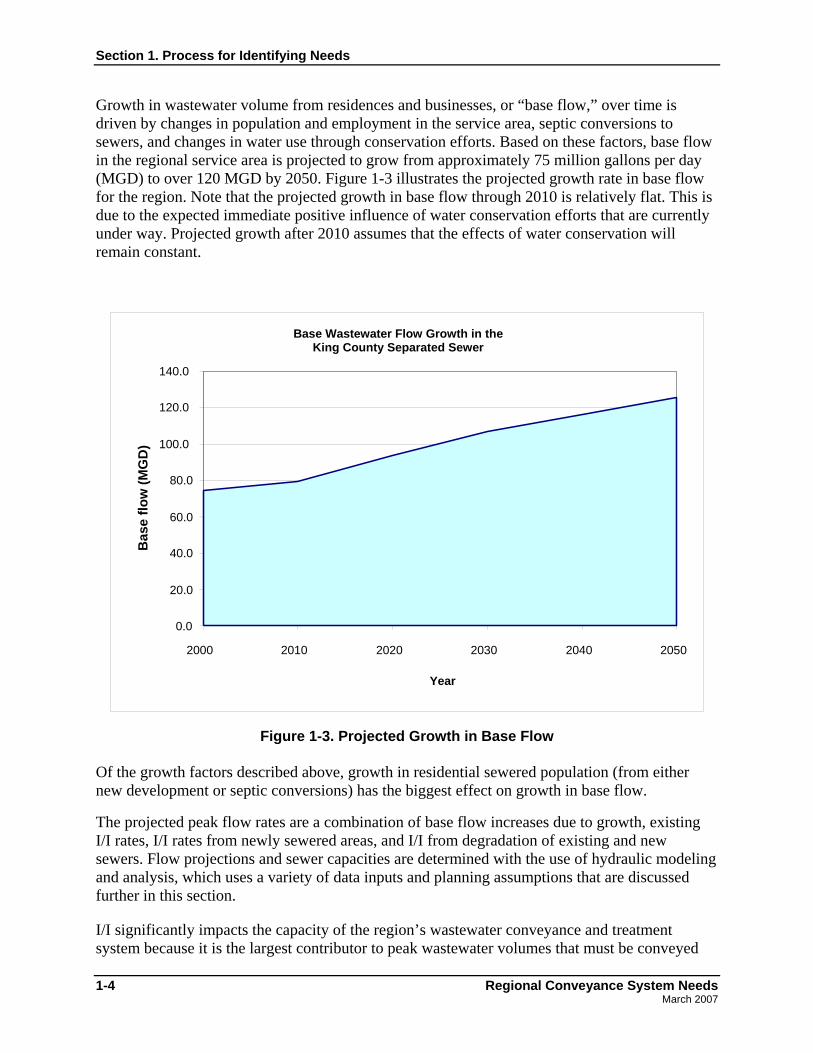
Growth in wastewater volume from residences and businesses, or “base flow,” over time is driven by changes in population and employment in the service area, septic conversions to sewers, and changes in water use through conservation efforts. Based on these factors, base flow in the regional service area is projected to grow from approximately 75 million gallons per day (MGD) to over 120 MGD by 2050. Figure 1-3 illustrates the projected growth rate in base flow for the region. Note that the projected growth in base flow through 2010 is relatively flat. This is due to the expected immediate positive influence of water conservation efforts that are currently under way. Projected growth after 2010 assumes that the effects of water conservation will remain constant.
Figure 1-3. Projected Growth in Base Flow Of the growth factors described above, growth in residential sewered population (from either new development or septic conversions) has the biggest effect on growth in base flow.
The projected peak flow rates are a combination of base flow increases due to growth, existing I/I rates, I/I rates from newly sewered areas, and I/I from degradation of existing and new sewers. Flow projections and sewer capacities are determined with the use of hydraulic modeling and analysis, which uses a variety of data inputs and planning assumptions that are discussed further in this section.
I/I significantly impacts the capacity of the region’s wastewater conveyance and treatment system because it is the largest contributor to peak wastewater volumes that must be conveyed
Base Wastewater Flow Growth in theKing County Separated Sewer
0.0
20.0
40.0
60.0
80.0
100.0
120.0
140.0
2000 2010 2020 2030 2040 2050
Year
Bas
e flo
w (M
GD
)

Section 1. Process for Identifying Needs
Regional Conveyance System Needs 1-5 March 2007
and treated in the wet season. About 75 percent of the region’s peak flows in the separated conveyance system comes from I/I 2. Figure 1-4 contains a typical hydrograph that shows how I/I affects regional wastewater volumes that must be conveyed and treated. As can be seen, flow volumes can quadruple during rain events when the conveyance system must handle base flow plus I/I (the blue line in Figure 1-4).
How I/I impacts Conveyance Facilities
0
1
2
3
4
5
6
31 1 2 3 4 5 6 7 8 9 10
Days
Flow
(mill
ion
gallo
ns/d
ay)
0
0.033
0.066
0.099
0.132
0.165
0.198
Rai
n (in
ches
/5 m
inut
es)
Base flow + I/Ibase flowrain
0
Figure 1-4. Impacts of I/I on Wastewater Flows
Twenty-year peak flow is the total flow (base flow and infiltration/inflow combined) expected to enter any segment of the conveyance system during wet weather on an average of once every 20 years. As a development standard, King County designs and builds new conveyance facilities to minimize the risk of an overflow or backup occurring in the system by sizing the facilities to accommodate a projected 20-year peak flow event.
To ensure that components of the system are adequately sized for the future the Wastewater Treatment Division (WTD) has chosen 2050 as its design year for all new facilities and facility upgrades. The year 2050 is the projected date when the regional wastewater service area will be fully built out and all portions of the service area will be connected into the wastewater treatment system. This means that facilities are being designed to convey and treat 20-year peak flows 2 Regional Wastewater Services Plan, Executive’s Preferred Plan; April 1998, page 14.
Basis for the 20-Year Peak Flow Development Standard
The adoption of the RWSP in 1999 established a uniform development standard for all future development. RWSP Policy CP-1 states:
To protect public health and water quality, King County shall plan, design, and construct county wastewater facilities to avoid sanitary sewer over flows. 1. The twenty-year design storm shall be used as the design standard for the county’s separated wastewater system.
Section 1. Process for Identifying Needs
1-6 Regional Conveyance System Needs March 2007
projected to occur in 2050. To avoid over-building, facility construction is being phased whenever practical. The effect of applying the 20-year peak flow standard is that certain components of the conveyance system that were built prior to the development of the standard now require upgrades to meet it.
Hydraulic analyses conducted in 2002-2005 based on extensive system-wide flow metering have indicated which components of the regional conveyance system are either at capacity or will be reaching capacity, as defined by the 20-year peak flow standard, between now and 2050. These analyses are documented in the March 2005 Regional Needs Assessment (RNA) Report, which identified 63 capital conveyance projects needed through 2050. As documented in this memorandum, the capacity shortfalls that created the need for the 63 proposed projects have been further refined to identify needs based on condition and age of system components. The following section explains how capacity-related needs were determined.
1.2.1 How Capacity Related Conveyance Needs Were Determined The capacity related projects listed in the 2005 RNA included a combination of projects previously identified in the 1999 RWSP, the 1999-2003 Conveyance System Improvement (CSI) Program, and additional projects identified based on extensive new flow data and sewered population information obtained and analyzed during development of the Regional I/I Control Program. Hydrologic and hydraulic modeling analyses conducted for the Regional I/I Control Program, using system-wide flow metering data collected over two wet seasons, was the basis for updating the list of projects needed through 2050. The modeling analyses and flow data are discussed briefly below. A more thorough discussion can be found in the RNA. Identified needs based on capacity are listed in Section 2 of this memorandum.
1.2.1.1 Overview of Modeling Analyses Using commercially available hydrologic and hydraulic modeling software, MOUSE™ (Modeling of Urban Sewers), and various data about the existing conveyance system that were collected as part of the Regional I/I Control Program study, the County was able to project peak flows into the future.
Modeling Term Definitions: Hydrologic model: A model used to numerically simulate the physical process of how rainfall enters the regional conveyance system as infiltration and inflow (I/I). Hydraulic model: A model of the actual pipes that convey the wastewater flows and I/I generated by the hydrologic model. The hydraulic model outputs flow depths and velocities within specific pipe segments and allows the evaluation of how the conveyance system performs under existing and future demands. Basin: A geographic area that contributes flow to a specific location, usually a flow meter or facility. The two primary types of basins used in the assessment are model basins and mini basins. Model calibration: The process of adjusting model parameters so the model output matches the measured sewer flow for the same period. Peak flow by return period: A statistical analysis related to the probability that a given flow will be equaled or exceeded in a given year. The 20-year peak flow has a 1 in 20, or 5% chance, of being exceeded in any given year.

Section 1. Process for Identifying Needs
Regional Conveyance System Needs 1-7 March 2007
The modeling required the following data:
• Flow data o Including varying groundwater conditions
• Rainfall and evaporation data o Including large rain storms to trigger I/I response o Including several storms to ensure simulation of different rainfall conditions
• Sewer basin data o Sewered area o Dry weather flow patterns
• Conveyance system specifications
Extensive wastewater flow and rainfall monitoring data, along with sewer basin data and a set of planning assumptions, were input into the MOUSE model. The data and modeling results provided the basis for establishing the current capacity conditions of the wastewater conveyance system and for projecting future flows. With this information, it was possible to identify the needed capacity related conveyance system improvements, which were documented in the RNA, and are further refined and documented in this memorandum. The various inputs and steps involved in the modeling analysis process are briefly summarized below.
1.2.1.2 Flow Data To quantify both base and I/I flows, “model basins” and “mini basins” were identified and mapped by the County and local agencies:
• Model basins represent the sewered area flowing to a specific flow meter location. Each model basin consists of approximately 1,000 sewered acres and 100,000 lineal feet of pipe. There are 147 model basins. Some of the model basins straddle agency boundaries due to agreements between agencies to “pass through” or “wheel” flows to King County.
• Mini basins are a further sub-division of model basins that geographically isolate variation in I/I flow rates within the model basins. There are 775 mini basins. They average 150 acres with 22,000 lineal feet of pipe.
To measure and project base flow and I/I, approximately 800 flow meters3 were installed throughout the regional service area to measure flows during dry-weather and wet-weather periods. Flows during dry-weather periods are typically base flows only. Wet-weather periods typically consist of both base flows and I/I. Metering flows during both dry and wet-weather periods makes it possible to develop separate measurements for base flow and I/I. The data gathered from flow meters were used to calibrate the hydrologic component of the conveyance system model and to establish non-storm flow patterns to characterize the base wastewater flow from specific portions of the service area.
Under specific weather conditions, the flow monitoring data gathered provide an accurate picture of current flows in local agency collection systems and the County’s regional conveyance
3 More detailed information about the flow metering effort is documented in the Wet Weather Flow Monitoring Technical Memoranda (2000-01 and 2002-02) and the Regional Needs Assessment Report.

Section 1. Process for Identifying Needs
1-8 Regional Conveyance System Needs March 2007
system. Projecting future flows required calibration of the hydrologic portion of the model to the measured flows.
1.2.1.3 Rainfall and Evaporation Data Rainfall data throughout the regional wastewater service area were collected for the 2000-2001 and 2001-2002 wet seasons. Data were gathered from 64 rain gauges. The rain gauge data were used in combination with CALAMAR (Calcul de lames d'eau a l'aide due radar [calculating rain with the aid of radar]) to define varying rainfall intensities throughout the service area.
Rainfall data were used to calibrate the hydrologic model and establish storm flow patterns to characterize I/I patterns that cause peak flows during storm events. A continuous time series of rainfall data was a required input for the hydrologic modeling performed. Local rainfall data coupled with radar-based rainfall intensity data were used for the model calibration. For prediction of the 20-year peak I/I flow, a 60-year rainfall record was used as a reasonable approximation of future rainfall frequency and intensity.4
1.2.1.4 Sewer Basin Data Sewered population and sewered area is information derived from a combination of available data and analyses of parcel data, aerial photos, zoning, and land-use records and plans. The information identifies the extent of current and future development within the sewered portion of the wastewater service area. Sewer basin data is GIS-based information about the service area previously unavailable at the level that it now exists. Along with its value for model calibration, sewer basin data allows growth assumptions to be clearly applied to future I/I and base flow scenarios.
1.2.1.5 Conveyance System Specifications Conveyance system specifications include specific physical details (such as pipe sizes, elevations, pump station capacities, and connection points) about the conveyance system. Most of the necessary data were available from the County’s GIS database. Other details were provided by local agencies. The specifications are a key input into the hydraulic model, which measures and projects how different components of the conveyance system perform when subject to base flows and I/I following storm events. An overview of the hydraulic capacity analysis used to identify capacity constraints relative to peak flow demand is contained in Appendix A of the CSI Program Update, June 2007.
1.2.1.6 Planning Assumptions Planning assumptions drive the timing of the projected capacity needs. Planning assumptions are applied by decade to each model basin and then compared to the capacity of the specific conveyance elements affected by the growth. Once the model assesses that elements of the system are under capacity relative to the demand, the year the exceedence is expected to occur is noted. For a detailed description of all planning assumptions, please see the RNA, Appendix A5.
4 Further details about the use of rainfall and evaporation data can be found in the Regional Needs Assessment Report.
Section 1. Process for Identifying Needs
Regional Conveyance System Needs 1-9 March 2007
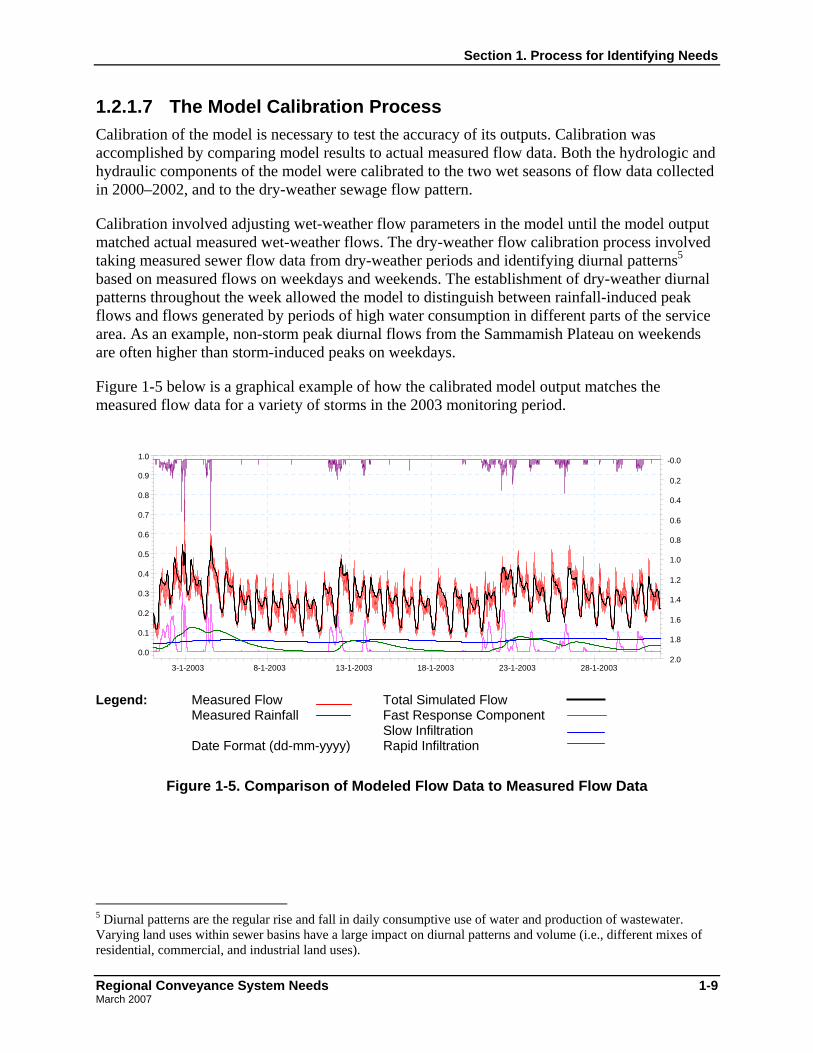
1.2.1.7 The Model Calibration Process Calibration of the model is necessary to test the accuracy of its outputs. Calibration was accomplished by comparing model results to actual measured flow data. Both the hydrologic and hydraulic components of the model were calibrated to the two wet seasons of flow data collected in 2000–2002, and to the dry-weather sewage flow pattern.
Calibration involved adjusting wet-weather flow parameters in the model until the model output matched actual measured wet-weather flows. The dry-weather flow calibration process involved taking measured sewer flow data from dry-weather periods and identifying diurnal patterns5 based on measured flows on weekdays and weekends. The establishment of dry-weather diurnal patterns throughout the week allowed the model to distinguish between rainfall-induced peak flows and flows generated by periods of high water consumption in different parts of the service area. As an example, non-storm peak diurnal flows from the Sammamish Plateau on weekends are often higher than storm-induced peaks on weekdays.
Figure 1-5 below is a graphical example of how the calibrated model output matches the measured flow data for a variety of storms in the 2003 monitoring period.
3-1-2003 8-1-2003 13-1-2003 18-1-2003 23-1-2003 28-1-2003
0.0
0.1
0.2
0.3
0.4
0.5
0.6
0.7
0.8
0.9
1.0
2.0
1.8
1.6
1.4
1.2
1.0
0.8
0.6
0.4
0.2
-0.0
Legend: Measured Flow Total Simulated Flow
Measured Rainfall Fast Response Component Slow Infiltration Date Format (dd-mm-yyyy) Rapid Infiltration
Figure 1-5. Comparison of Modeled Flow Data to Measured Flow Data
5 Diurnal patterns are the regular rise and fall in daily consumptive use of water and production of wastewater. Varying land uses within sewer basins have a large impact on diurnal patterns and volume (i.e., different mixes of residential, commercial, and industrial land uses).

Section 1. Process for Identifying Needs
1-10 Regional Conveyance System Needs March 2007
Once the models were calibrated, long-term simulations were run using the data inputs described above. The output from the long-term simulations was analyzed to determine the probability of a given peak flow being exceeded during a given year. This probability was then used to calculate the return period of peak flow. More detail on the calibration, dry-weather calibration, and estimation of peak flows is contained in Appendix A4 of the RNA.
1.2.1.8 Model Verification using the Hydraulic System Model The next key element for modeling was inputting the flows into a hydraulic model of the County system of conveyance facilities (pipes, pumps, and storage) so that the current state of the system could be evaluated. This involved using the calibrated outputs from the hydrologic model along with base sewage flow data. The modeled flows were inputted into the hydraulic model in the appropriate physical locations. This was necessary because the model basins vary from a single connection point to the conveyance system to as many as nine connection points per model basin. Using flows from the calibration period allowed for spot checking of the original model basin calibrations by comparing combined model basin flows to flow measurements in the system. Comparing these flows allows the County to adjust both base flows and I/I model parameters to better characterize the base flow and I/I contributions to the system.
1.3 Conveyance Improvement Needs Based on System Condition Another driver for conveyance facility improvement needs is the condition of individual facilities within the system. The condition of facilities is affected by their age, their material type(s), the micro environments they operate in, and the composition of the wastewater that each facility must convey during operation. Determination of the condition of a facility is a largely subjective exercise requiring interpretive skills and a broad knowledge of the following:
• How different conveyance system materials (metal, concrete, plastic, wood, etc.) perform over time
• How they are affected by the environment (slopes, soil conditions, etc.) • How they are affected by the chemical composition of raw sewage that can contain
corrosive agents such as hydrogen sulfide (H2S) gas • The inherent life-cycle of conveyance system materials and mechanical components
WTD has programs in place to identify, document, and repair adverse conditions in the system. These condition-related conveyance system maintenance needs have been identified through inspection and are documented in this memorandum. Over time, regular system inspection may identify new areas of deterioration in the system requiring conveyance system repair or replacement projects. While some condition deficiencies can be solved with spot-repairs and the use of on-call contractors, others may require capital investment to repair or replace the facility. Interior corrosion of sewer pipes is an example of a system condition that can require capital investment to repair and extend the useful life of a conveyance system facility. Figures 1-6 and 1-7 show the effects of H2S corrosion in a sewer line and an application of a spray liner to repair corrosion.

Section 1. Process for Identifying Needs
Regional Conveyance System Needs 1-11 March 2007
Figure 1-6. Years of exposure to wastewater and hydrogen sulfide gas (H2S) have exposed reinforcement bars in some sewer pipes.
Figure 1-7. A construction worker applies part of plastic liner inside a corroded sewer pipe. This Section provides a brief overview of how the conveyance system is categorized for inspection, how the condition of the various facilities are assessed and documented, and how the nature and severity of the condition deficiency determine how the solution will be addressed.
1.3.1 Condition Inspection and Assessment Process WTD operates a large and complex sewer conveyance system with more than 275 miles of sewer lines ranging in diameter from 12 inches to 14 feet, the oldest of which was built in 1890. The conveyance system consists of gravity sewers, force mains, pressure sewers, siphons, pump stations, and regulator stations that transport wastewater to the regional treatment plants (see sidebar for descriptions of the conveyance system components). The complexity of the system
Conveyance System Components
Gravity Sewer: Pipes where wastewater flows passively due the effects of gravity. About 90% of the pipes in the King County collection system are gravity sewers. Force Mains: Pipes used in conjunction with pump stations that convey wastewater under pressure. About 5% of the pipes in the King County collection system are force mains Pressure Sewers: Pipes where wastewater flows under the effects of gravity but the pipe is under pressure. About 3% of the pipes in the King County collection system are pressure sewers. Siphons: Siphons are used to convey wastewater under and across water bodies using gravity siphon effects. These pipes flow full and under pressure. Siphons make up about 2% of the pipes in the King County collection system. Pump Stations: Facilities that pump wastewater flows from geographically low lying areas to a higher point where gravity flow can occur. There are 42 pump stations in the King County system Regulator Station: Facilities that control the flow of wastewater using gates and valves to restrict or halt flow during peak flow events. Regulator stations back sewage up into storage facilities until flows can be safely conveyed by the downstream system. There are 19 flow regulator stations in the King County system.

Section 1. Process for Identifying Needs
1-12 Regional Conveyance System Needs March 2007
requires different types of expertise to maintain, inspect, determine improvement needs, and appropriately prioritize those improvement needs.
1.3.1.1 System Condition Analysis Analyzing the condition of conveyance facilities has three primary purposes:
• Determine to the extent possible system conditions that will warrant capital investment.
• See if and where deteriorating conditions exist near known capacity needs.
• Check if facilities identified as having cost-effective I/I reduction projects in the service area have conditions that will result in the need to replace a conveyance facility regardless of the ability to cost-effectively reduce I/I flows and capacity demand.
This analysis breaks the system into three groups of components:
• Gravity sewers
• Force mains, pressure sewers, and siphons
• Pump stations and regulator stations
The breakdown is along the lines of WTD work units responsible for inspecting and directing maintenance of given facilities. The Facilities Inspection Unit in Asset Management inspects gravity sewers, force mains, pressure sewers, and siphons. The Offsite Facilities Groups at the West Point and South Treatment Plants inspect and maintain the pump and regulator stations.
Gravity systems are inspected using a variety of techniques and technologies ranging from manual visual inspections to video analysis. On average, gravity sewers are video inspected on a 10-year cycle. If deteriorating conditions are identified during inspection, a more frequent inspection schedule for the site is implemented. If conditions are identified that require immediate attention to repair, there are a number of ways for repairs to be addressed depending upon the scope and scale of the need.
Force mains, pressure sewers, and siphons present challenges to inspection due to the full pipe pressurized conditions in which they operate. Traditional video inspection techniques typically require systems to be emptied or at least have their flows reduced. Inspecting pressurized systems often requires temporary shutdown of portions of the conveyance system. These temporary shutdowns can limit the time available for inspections. Some portions of the system cannot be shutdown without risking wastewater overflows. As a result, many force mains, pressure sewers, and siphons have not been thoroughly inspected on a regular basis. New techniques using sonar and other technologies are becoming available to inspect these facilities more thoroughly without taking the systems off line. As these types of facilities can be regularly inspected, additional conveyance needs due to deteriorating condition may be identified.
Pump and regulator stations are monitored continuously by the offsite and onsite treatment plant staff through the SCADA (Supervisory Control and Data Acquisition) and Metro-Tel systems. These two telecommunication and computer systems provide redundant oversight of a variety of facility conditions including pump performance, wastewater flow levels, and emergency

Section 1. Process for Identifying Needs
Regional Conveyance System Needs 1-13 March 2007
notifications of equipment malfunction. Regularly scheduled inspection and maintenance of the station equipment is performed by offsite staff. Once it is determined that the mechanical equipment at the stations require replacement or upgrade, the projects are sent either to the Asset Management or Major Capital program for implementation depending upon the scope of the replacement /upgrade.
The majority of needs identified based on the condition of conveyance facilities are addressed through Asset Management. Projects identified have an Engineering Work Request (EWR) prepared. Identified needs compete for funding based on a number of criteria and prioritization of the project’s relative need.
WTD is currently involved in development of an agency-wide Asset Management Program that will allow business case evaluations for all asset management decisions. Business case evaluations compare the long term cost of maintaining existing assets to the cost of replacing the assets and incurring lower maintenance costs over the same period. An Asset Management taskforce consisting of WTD staff is currently working to generate pilot case studies for applying business case evaluations to Asset Management and Major Capital projects. It is expected that the taskforce’s work will be completed incrementally between 2005 and 2010. The approximate five-year timeframe for completing the work will allow for gathering and analyzing data, completing inspections, documenting repair information, and developing cost data. The taskforce conclusions are expected to be integrated in an update of the region’s conveyance system plan at that time.
Section 4 of this memorandum provides further detail about system condition assessment and examples of condition-related needs currently identified throughout the regional conveyance system.
1.4 Conveyance System Age The regional conveyance system includes pipes and other facilities that were built as early as 1890, with substantial additions being made through present day. Twenty percent of the pipes in the system are over 50 years old and will continue to age in the coming decades. As the system ages, it deteriorates. Ongoing inspection, maintenance, and repair activity has kept the system operating safely, but portions of the system will reach the end of their theoretical useful life between now and 2050.
The useful life of conveyance facilities varies depending upon the materials used in construction, the environment it operates in, and the frequency and effectiveness of maintenance and repair work. Wastewater conveyance systems are subject to internal corrosion from biochemical processes in the sewage and external factors such as structural loads and galvanic corrosion.
Cathodic, or galvanic, corrosion is caused by the flow of electrical current from a more active metal (anode) to a less active metal (cathode) in the same environment. Ferrous (iron and steel) materials used in force mains, siphons, and pressure sewers are highly vulnerable to galvanic corrosion.

Section 1. Process for Identifying Needs
1-14 Regional Conveyance System Needs March 2007
Concrete pipe is susceptible to corrosion from hydrogen sulfide gasses generated by the wastewater as it flows through the system.
The useful life of different conveyance facilities also depends upon whether the component has mechanical equipment associated with its operation. For example, the pumps and control systems at a pump station have a life cycle of 15 to 25 years, while the station structure and fixed components are likely to have a life cycle of 50 to 75 years and are sized to handle projected flows for that period. The life cycle of either mechanical equipment or fixed assets can be, and often are, extended beyond their expected useful life
Section 4 of this technical memorandum contains information about the age of all conveyance system facilities within the regional system. The age of each conveyance facility was determined by the recorded construction year. In some cases significant maintenance and capital work has been performed to extend the useful life of the asset.
Databases containing information about pipe material, age, inspection, and repair history have been used to identify and categorize facilities by age and material type.
The different conveyance facilities have also been split into the following general material categories and ranked by age:
• Concrete sewers
• Iron and steel (ferrous materials)
• Brick
• Plastic (fiberglass, PVC, High Density Poly Ethylene [HDPE])
• Miscellaneous, including wood, clay, and asbestos
Regional Conveyance System Needs 2-1 March 2007
Section 2 Regional Conveyance System
Capacity Needs
2.1 Capacity Needs in the Separated System System capacity needs/constraints have been identified by comparing known capacities of pump stations, pipes, and regulator stations to projected peak flows. The flow rates used in the capacity analysis are the current and projected 20-year return period peak flows. The current and projected peak flows were generated using data gathered and analyzed during the development of the Regional Infiltration and Inflow (I/I) Control Program between 2000 and 2005. A summary of that analysis is contained in Section 1 of this memo.
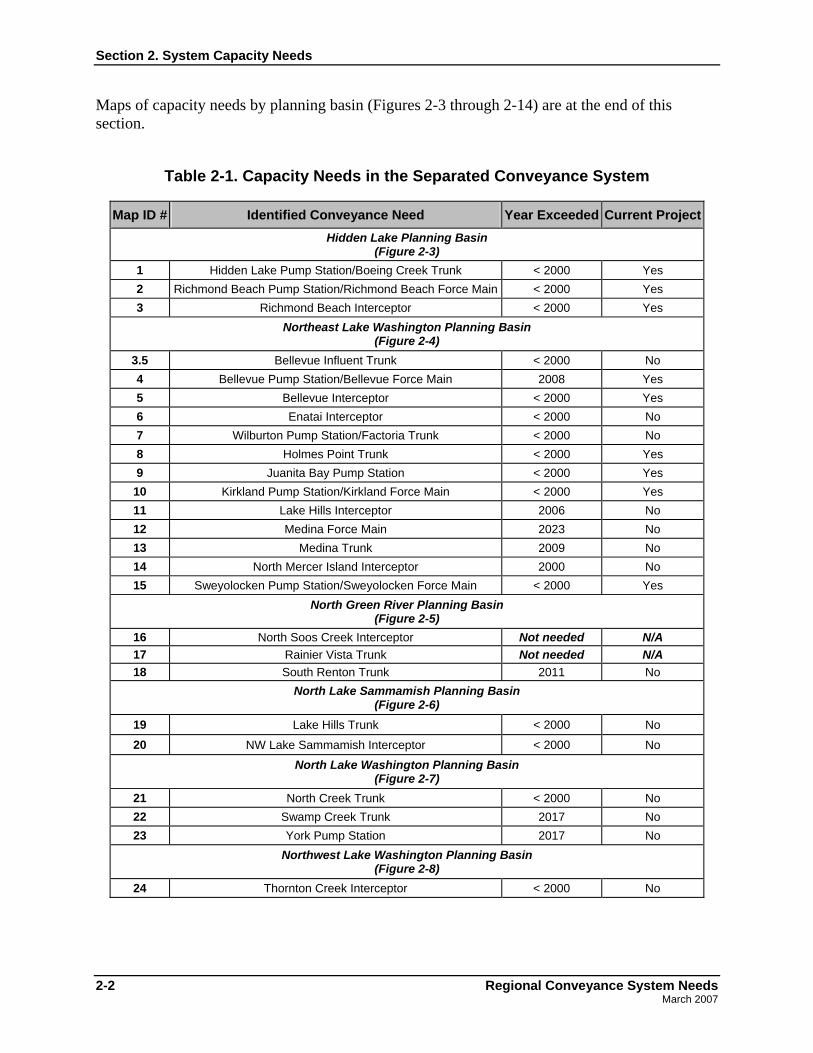
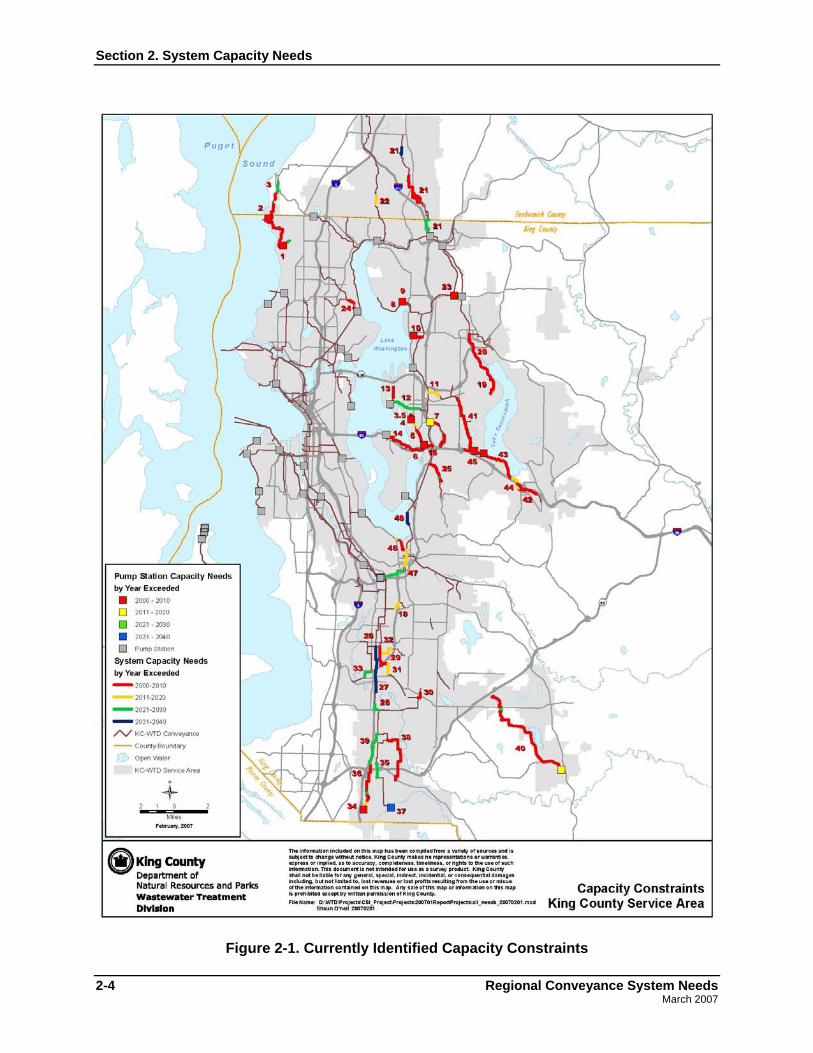
Table 2-1 lists all capacity constraints in the separated conveyance system based on comparing system component capacities to the peak flow demands in the system. A system map, Figure 2-1, shows the location of the existing and projected capacity constraints. An overview of how system capacities are compared to projected peak flow demands is contained in Appendix A of the 2007 CSI Program Update.
Table 2-1 differs from Table 4-1 in the March 2005 Regional Needs Assessment (RNA) report in that Table 2-1 simply lists identified capacity shortfalls, or “needs”, within the regional conveyance system and when the system capacity is exceeded by the projected 20-year peak flow. Table 4-1 in the RNA listed past, current, and future capital projects to address capacity needs within the regional conveyance system. The projects listed in the RNA provided a basis for completing a benefit-cost analysis for the Regional I/I Control Program. That analysis compared the cost of I/I reduction in the service area upstream of an identified conveyance system need to the capital cost of constructing increased capacity to convey projected peak flows. These capital projects and their alternatives are now under review in order to update the region’s Conveyance System Improvement Plan. A refined list of needs and recommended capital improvements to meet those needs will be contained in the updated Plan, which is due to be completed in late 2006.
Cases where a conveyance need is being addressed through a capital project(s) under development have been noted in the last column of Table 2-1. An example of this is the Hidden Lake Pump Station/Boeing Creek Trunk Project. This project (which includes a new pump station, peak flow storage facility, and conveyance upgrades to the Boeing Creek Trunk) addresses capacity needs in the Boeing Creek Trunk, Richmond Beach Pump Station and Richmond Beach Force main and Interceptor.
Note: Table 2-1, Figure 2-1, and Figures 2-3 through 2-14 have been updated since the 2005 edition based on additional analysis and input from local agencies.
Section 2. System Capacity Needs
2-2 Regional Conveyance System Needs March 2007
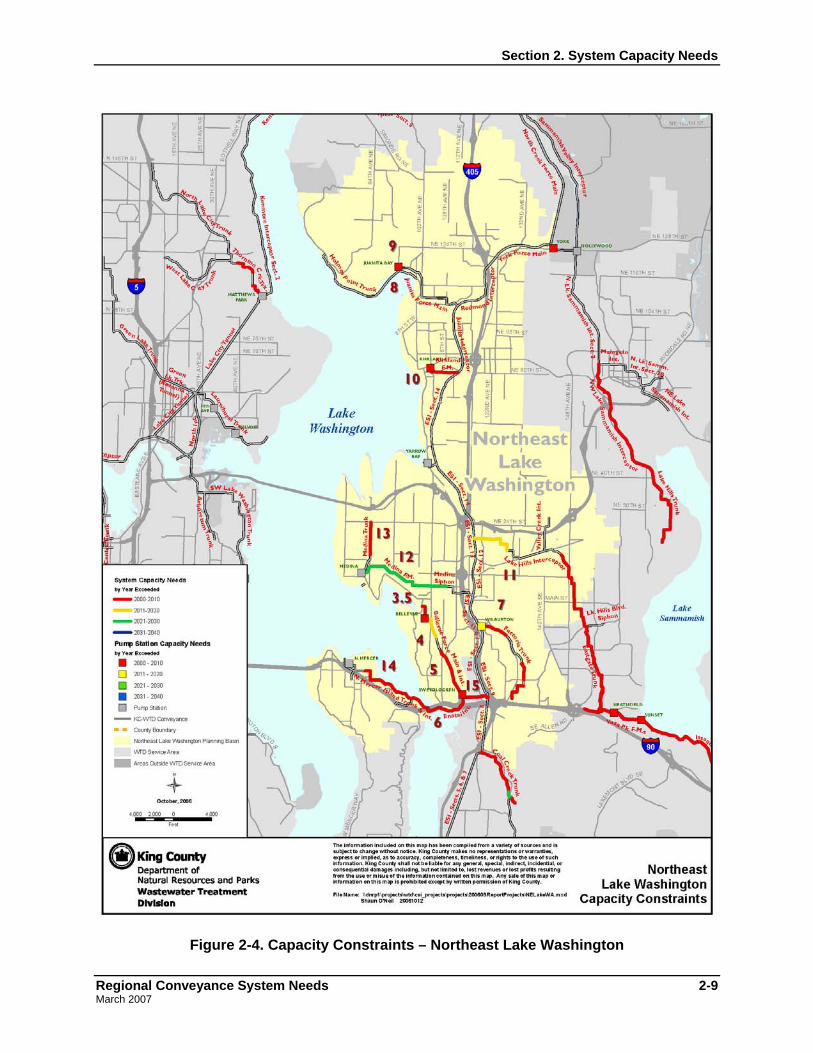
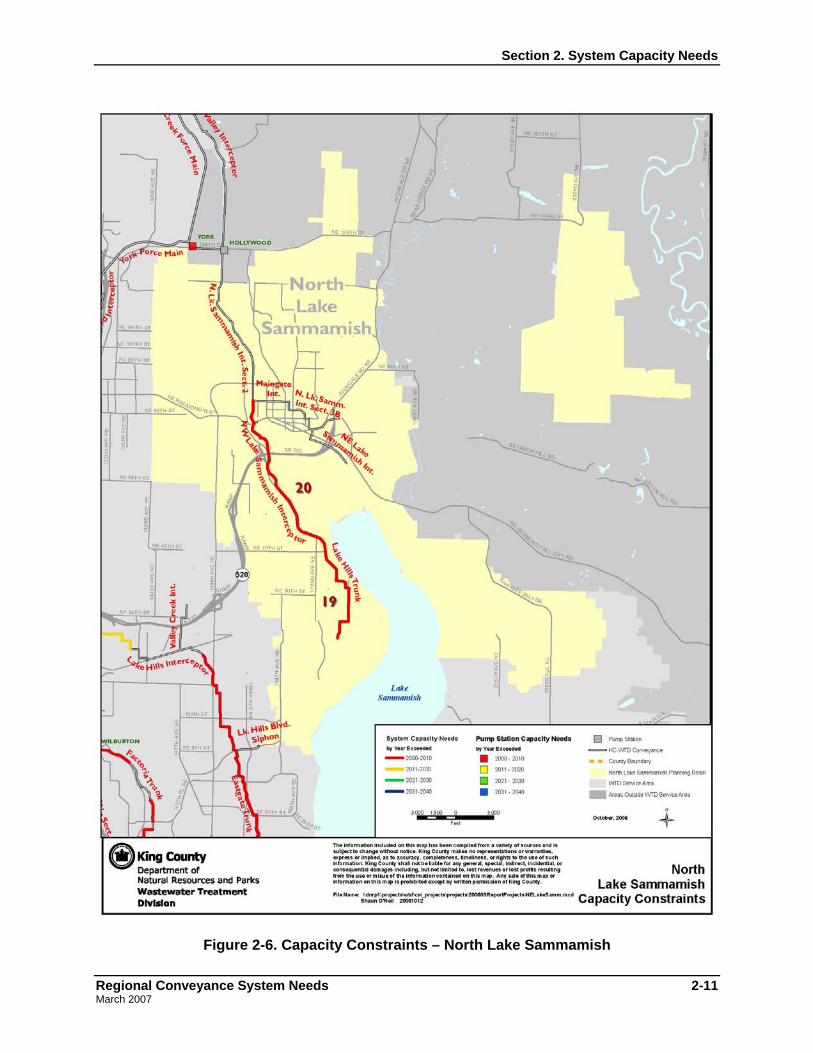
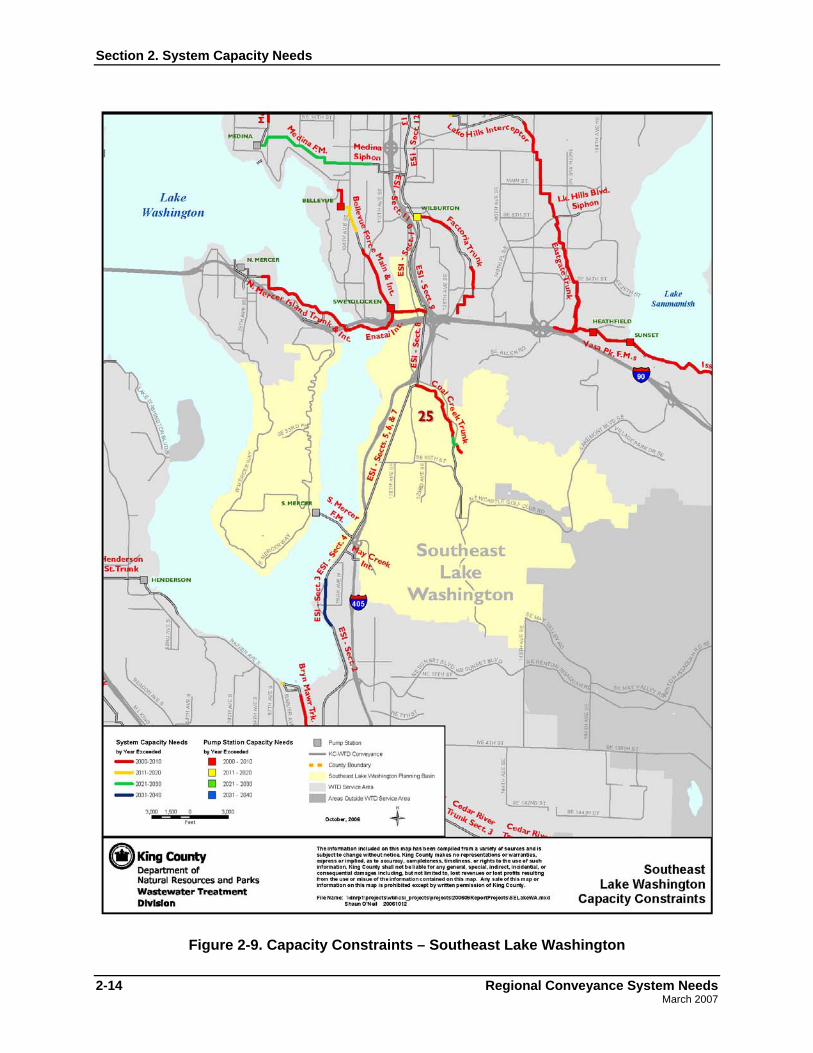
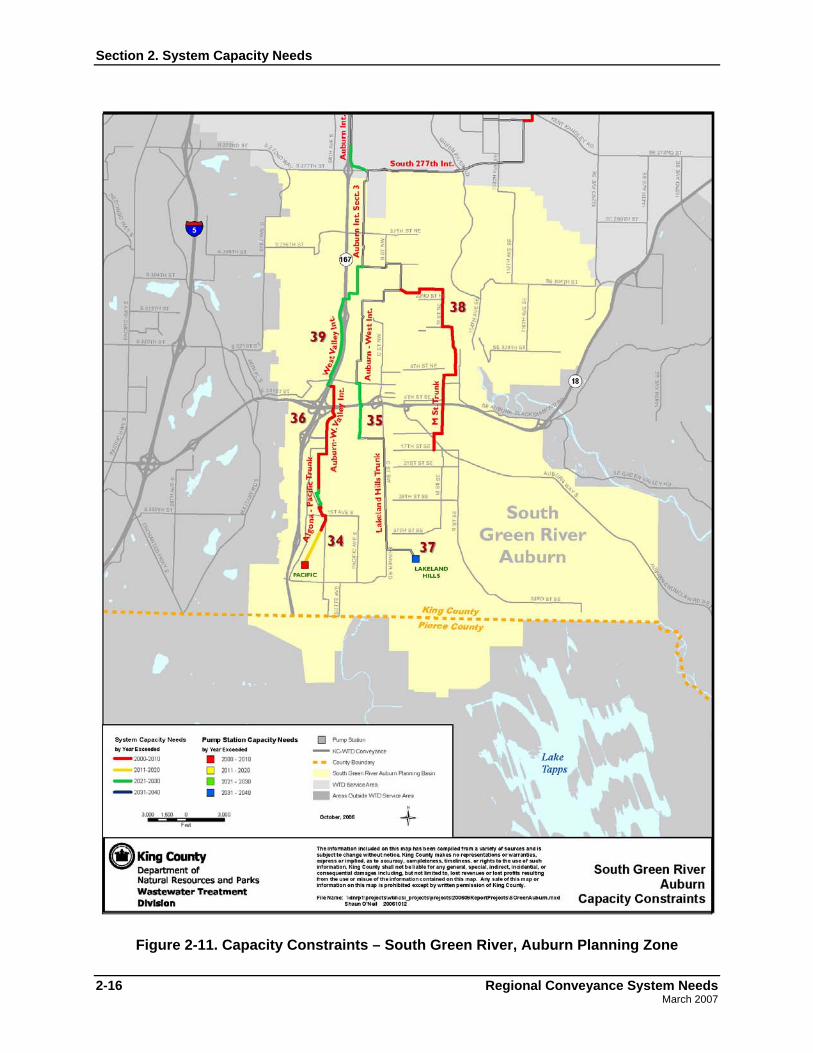
Maps of capacity needs by planning basin (Figures 2-3 through 2-14) are at the end of this section.
Table 2-1. Capacity Needs in the Separated Conveyance System
Map ID # Identified Conveyance Need Year Exceeded Current ProjectHidden Lake Planning Basin
(Figure 2-3) 1 Hidden Lake Pump Station/Boeing Creek Trunk < 2000 Yes 2 Richmond Beach Pump Station/Richmond Beach Force Main < 2000 Yes 3 Richmond Beach Interceptor < 2000 Yes
Northeast Lake Washington Planning Basin (Figure 2-4)
3.5 Bellevue Influent Trunk < 2000 No 4 Bellevue Pump Station/Bellevue Force Main 2008 Yes 5 Bellevue Interceptor < 2000 Yes 6 Enatai Interceptor < 2000 No 7 Wilburton Pump Station/Factoria Trunk < 2000 No 8 Holmes Point Trunk < 2000 Yes 9 Juanita Bay Pump Station < 2000 Yes
10 Kirkland Pump Station/Kirkland Force Main < 2000 Yes 11 Lake Hills Interceptor 2006 No 12 Medina Force Main 2023 No 13 Medina Trunk 2009 No 14 North Mercer Island Interceptor 2000 No 15 Sweyolocken Pump Station/Sweyolocken Force Main < 2000 Yes
North Green River Planning Basin (Figure 2-5)
16 North Soos Creek Interceptor Not needed N/A 17 Rainier Vista Trunk Not needed N/A 18 South Renton Trunk 2011 No
North Lake Sammamish Planning Basin (Figure 2-6)
19 Lake Hills Trunk < 2000 No
20 NW Lake Sammamish Interceptor < 2000 No
North Lake Washington Planning Basin (Figure 2-7)
21 North Creek Trunk < 2000 No 22 Swamp Creek Trunk 2017 No 23 York Pump Station 2017 No
Northwest Lake Washington Planning Basin (Figure 2-8)
24 Thornton Creek Interceptor < 2000 No
Section 2. System Capacity Needs
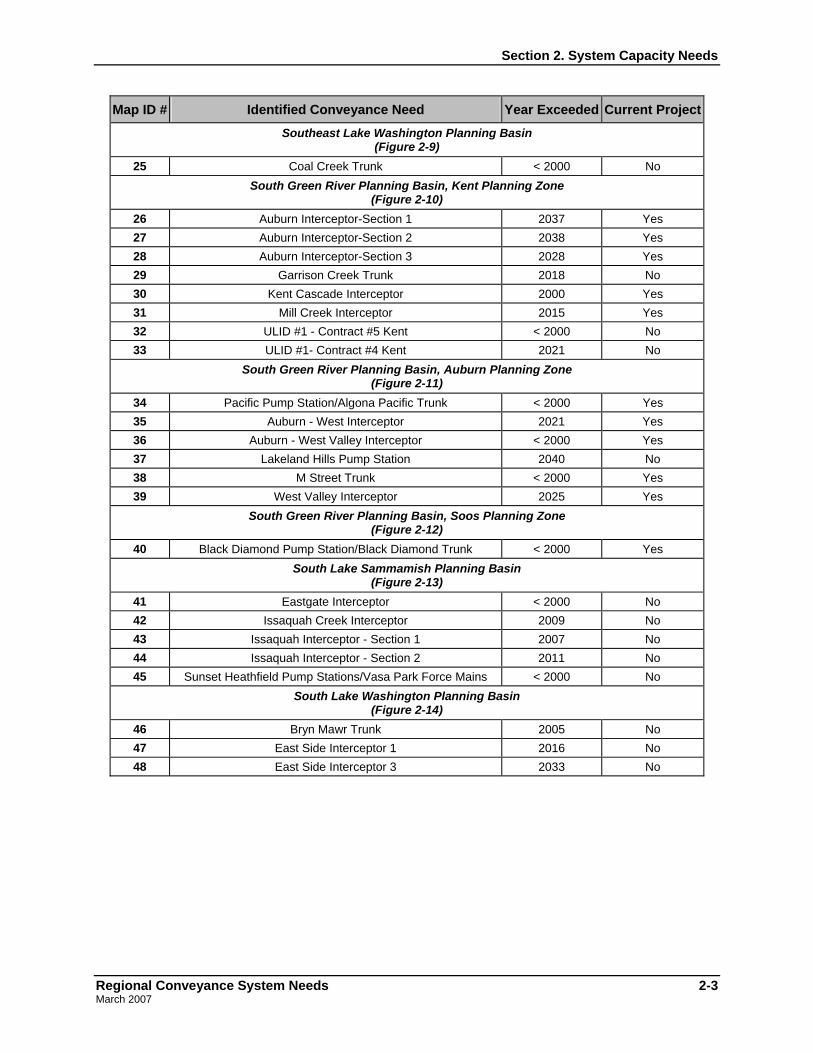
Regional Conveyance System Needs 2-3 March 2007
Map ID # Identified Conveyance Need Year Exceeded Current ProjectSoutheast Lake Washington Planning Basin
(Figure 2-9) 25 Coal Creek Trunk < 2000 No
South Green River Planning Basin, Kent Planning Zone (Figure 2-10)
26 Auburn Interceptor-Section 1 2037 Yes 27 Auburn Interceptor-Section 2 2038 Yes 28 Auburn Interceptor-Section 3 2028 Yes 29 Garrison Creek Trunk 2018 No 30 Kent Cascade Interceptor 2000 Yes 31 Mill Creek Interceptor 2015 Yes 32 ULID #1 - Contract #5 Kent < 2000 No 33 ULID #1- Contract #4 Kent 2021 No
South Green River Planning Basin, Auburn Planning Zone (Figure 2-11)
34 Pacific Pump Station/Algona Pacific Trunk < 2000 Yes 35 Auburn - West Interceptor 2021 Yes 36 Auburn - West Valley Interceptor < 2000 Yes 37 Lakeland Hills Pump Station 2040 No 38 M Street Trunk < 2000 Yes 39 West Valley Interceptor 2025 Yes
South Green River Planning Basin, Soos Planning Zone (Figure 2-12)
40 Black Diamond Pump Station/Black Diamond Trunk < 2000 Yes South Lake Sammamish Planning Basin
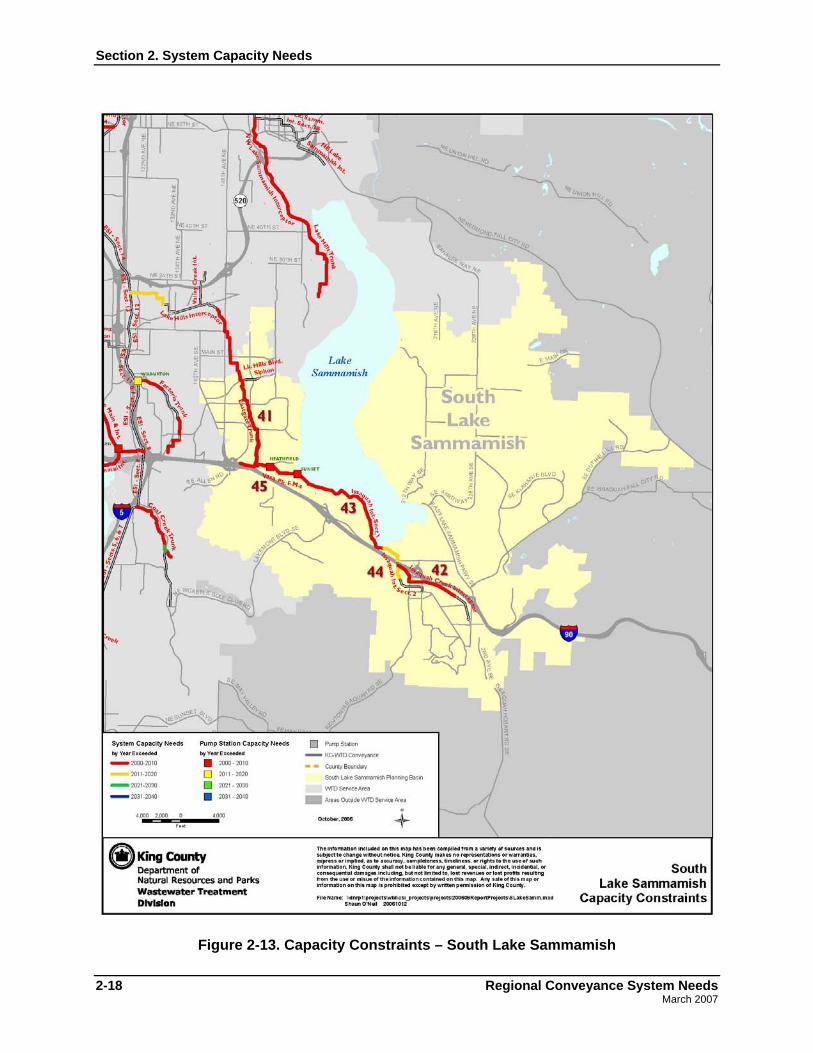
(Figure 2-13) 41 Eastgate Interceptor < 2000 No 42 Issaquah Creek Interceptor 2009 No 43 Issaquah Interceptor - Section 1 2007 No 44 Issaquah Interceptor - Section 2 2011 No 45 Sunset Heathfield Pump Stations/Vasa Park Force Mains < 2000 No
South Lake Washington Planning Basin (Figure 2-14)
46 Bryn Mawr Trunk 2005 No 47 East Side Interceptor 1 2016 No 48 East Side Interceptor 3 2033 No
Section 2. System Capacity Needs
2-4 Regional Conveyance System Needs March 2007
Figure 2-1. Currently Identified Capacity Constraints

Section 2. System Capacity Needs
Regional Conveyance System Needs 2-5 March 2007
2.2 Capacity Needs in the Combined System Capacity needs to meet projected peak flows in the portion of the regional wastewater system that is a combined system were identified and are addressed in the County’s adopted Combined Sewer Overflow (CSO) Control Plan (2000) and subsequent CSO control annual reports, plan updates and reviews. The information from the adopted CSO plan and subsequent updates summarized here is intended to provide a more a complete picture of the capacity needs facing the entire regional conveyance system. More information about the CSO Plan is available at http://dnr.metrokc.gov/wtd/cso/.
As discussed in Section 1 of this memorandum, the combined system is located within the City of Seattle where wastewater and stormwater are collected and conveyed together to the West Point Treatment Plant. When flows entering the combined sewer system exceed pipe or treatment process capacity, overflows of wastewater diluted with stormwater are released into receiving waters at combined sewer overflows (CSOs). These events are referred to as CSO discharges.
The City of Seattle still owns and maintains a large portion of the combined sewer system. However, the County acquired some larger combined sewer facilities in the 1960s during the formation of Metro. The County and the City of Seattle undertake joint projects to reduce CSO discharges when regionally beneficial. The combined efforts of the County and the City to implement treatment and CSO control programs have reduced the volume of overflows from about 30 billion gallons per year in the 1960s to approximately 1.5 billion gallons per year in 2000. The state requirement for controlling CSOs is to limit untreated discharges at each CSO location to one event per year (on average). The County’s program will meet state and federal regulations and agreements by 2030.
A list of CSO capacity needs with their associated planned capital projects is contained in Table 2-2 below. The project schedule shown in the table may change as a result of the next CSO update. Figure 2-2, which follows the table, is a map showing the location of the CSO needs and planned projects.
Table 2-2. Planned CSO Control Projects
Map ID # CSO Control Project Project Description Year Controlled
1 South Magnolia 1.3-MG storage tank 2010 2 SW Alaska St a 0.7-MG storage tank 2010 3 Murray Ave. 0.8-MG storage tank 2010 4 Barton St. Pump Station upgrade 2011 5 North Beach Storage tank and pump station upgrade 2011 6 University/Montlake 7.5-MG storage tank 2015 7 Hanford 3.3-MG storage and treatment tank 2017
8 West Point Treatment Plant improvements Primary and secondary enhancements 2018
9 Lander St. 1.5-MG storage/treatment at Hanford 2019 10 Michigan 2.2-MG storage and treatment tank 2022

Section 2. System Capacity Needs
2-6 Regional Conveyance System Needs March 2007
Map ID # CSO Control Project Project Description Year Controlled
11 Brandon St. 0.8-MG storage and treatment tank 2022 12 Chelan Avenue 4-MG storage tank 2024 13 Connecticut St. 2.1-MG storage and treatment tank 2026 14 King St. Conveyance to Connecticut St. treatment 2026 15 Hanford at Rainier Ave. 0.6-MG storage tank 2026 16 8th Ave. S 1.0 MG storage tank 2027 17 West Michigan Conveyance upgrade 2027 18 Terminal 115 0.5-MG storage tank 2027 19 3rd Avenue W 5.5-MG storage tank 2027 20 Ballard 1.0-MG storage tank (40% King County) 2029 21 11th Ave. NW 2.0-MG storage tank 2030
a The SW Alaska Street project is no longer needed; updated monitoring and modeling data indicate that this CSO is already controlled.

Section 2. System Capacity Needs
Regional Conveyance System Needs 2-7 March 2007
Figure 2-2. Planned CSO Control projects

Section 2. System Capacity Needs
2-8 Regional Conveyance System Needs March 2007
Figure 2-3. Capacity Constraints – Hidden Lake
Section 2. System Capacity Needs
Regional Conveyance System Needs 2-9 March 2007
Figure 2-4. Capacity Constraints – Northeast Lake Washington

Section 2. System Capacity Needs
2-10 Regional Conveyance System Needs March 2007
Figure 2-5. Capacity Constraints – North Green River
Section 2. System Capacity Needs
Regional Conveyance System Needs 2-11 March 2007
Figure 2-6. Capacity Constraints – North Lake Sammamish

Section 2. System Capacity Needs
2-12 Regional Conveyance System Needs March 2007
Figure 2-7. Capacity Constraints – North Lake Washington

Section 2. System Capacity Needs
Regional Conveyance System Needs 2-13 March 2007
Figure 2-8. Capacity Constraints – Northwest Lake Washington
Section 2. System Capacity Needs
2-14 Regional Conveyance System Needs March 2007
Figure 2-9. Capacity Constraints – Southeast Lake Washington

Section 2. System Capacity Needs
Regional Conveyance System Needs 2-15 March 2007
Figure 2-10. Capacity Constraints – South Green River, Kent Planning Zone
Section 2. System Capacity Needs
2-16 Regional Conveyance System Needs March 2007
Figure 2-11. Capacity Constraints – South Green River, Auburn Planning Zone

Section 2. System Capacity Needs
Regional Conveyance System Needs 2-17 March 2007
Figure 2-12. Capacity Constraints – South Green River, Soos Planning Zone
Section 2. System Capacity Needs
2-18 Regional Conveyance System Needs March 2007
Figure 2-13. Capacity Constraints – South Lake Sammamish

Section 2. System Capacity Needs
Regional Conveyance System Needs 2-19 March 2007
Figure 2-14. Capacity Constraints – South Lake Washington

Regional Conveyance System Needs 3-1 March 2007
Section 3 Regional Conveyance System
Condition
As stated in Subsection 1.3.1.1 of this memo, conveyance system needs based primarily on system condition identified here are based on information provided by Wastewater Treatment Division (WTD) Asset Management staff and staff from the West Point and South Treatment Plants.
Also noted in Subsection 1.3.1.1, WTD is leading a division-wide taskforce that is developing an asset management plan that will evaluate how best to maintain, repair, or replace regional wastewater conveyance and treatment facilities over time. The results of this program will allow least cost solutions to be implemented based on investment in capital versus ongoing maintenance on the County’s conveyance system components and treatment plant facilities. The evaluation of all operation, maintenance and capital activities will be completed in 2010, and will likely result in an update to the portion of Regional Conveyance System Program Update that addresses system condition at that time. Until this is completed, the following identified needs based on condition are based on information currently available and DO NOT represent the complete list of condition-driven needs for the entire system.
WTD implements projects that replace or rehabilitate degraded regional conveyance system equipment or structures. They also implement projects that improve existing treatment processes at regional facilities. Asset management projects differ from major capital projects in that they do not typically provide significant capacity expansion or result in the construction of new facilities that provide added system capacity. Rather, they replace worn facilities, or extend their useful lives. Asset management projects still require capital investment in the conveyance system and as such, have the same financial and rate impacts as major capital projects that typically provide additional capacity. The Division’s Asset Management Program has roughly 40 primary projects and programs in place that account for approximately $35M annually in capital expenditures on the conveyance system. WTD publishes an Annual Facilities Plan that details its operating budget, facility inspection programs, and lists its capital projects. The report is available for review from the WTD’s Asset Management Section.
Asset management capital projects are organized into seven categories. The first category, Stand-Alone Projects, consists of large asset management projects that are generally funded as individual fully defined projects with dedicated multi-year budgets.
An identified large stand-alone project is the repair or replacement of the Ballard siphon. The siphon is a wood stave inverted siphon constructed in 1935 that conveys combined sewage flows from north to south under Salmon Bay in the Ballard/Interbay area of the City of Seattle. Internal inspections of the siphon using new sonar technology in late 2005 identified structural issues that were not apparent during external inspections of the siphon over 10 years ago. These newly
Section 3. System Condition
3-2 Regional Conveyance System Needs March 2007
identified structural conditions warranted additional internal inspections prior to proceeding with capital investment to repair or replace the siphon. Additional sonar inspections along with recent video inspection have continued and confirmed the need to proceed with design and construction of a parallel of the existing siphons. The current project schedule calls for completion of construction in late 2008. Additional projects of this type are expected to be identified over time as the work of the Asset Management taskforce is completed over the next several years.
The remaining categories 2 through 7 are minor asset management projects that address needs resulting from the continuous inspection and monitoring of the wastewater conveyance and treatment system. The projects typically cost less than $500,000 and take one to two construction seasons to complete.
The remaining categories are:
2. Electrical Systems and Instrumentation and Control Systems 3. Mechanical Equipment 4. Odor and Corrosion control 5. Pipeline replacements (these are typically in-plant replacements related to process
equipment) 6. Process Replacements and Improvements (treatment plant related) 7. Structure and Site Improvements
An example of a minor asset management program in place to address ongoing identified condition issues is the Hydrogen Sulfide (H2S) Corrosion Program. Hydrogen Sulfide is generated through a complex series biological and chemical reactions. These reactions known collectively as the sulfur cycle take place between the wastewater and the bacteria that thrive on the interior walls of sewer pipes. Detailed information about the sulfur cycle and how repair or rehabilitation needs are identified and addressed is contained in the WTD’s Annual Facilities Plan.
Recent inspections of 57 known hydrogen sulfide (H2S) corrosion sites in the conveyance system indicate that corrosion has been occurring at a rate faster than anticipated or seen in the past. The H2S program has recently prioritized a list of the top 17 needs based on the latest assessment of the inspection data. Table 3-1 and Figure 3-1 below list and show the location of the recently updated high priority H2S repair sites. Again, additional projects of this nature are expected to be identified over time as the work of the Asset Management taskforce is completed over the next several years.

Section 3. System Condition
Regional Conveyance System Needs 3-3 March 2007
Table 3-1. Identified High Priority Needs due to Hydrogen Sulfide Corrosion
Map Key facility name Need Type Planning Basin 1 Beach Drive Interceptor H2S corrosion Combined System 2 Bothell-Woodinville Interceptors H2S corrosion North Lake Washington 3 Eastgate Interceptor H2S corrosion South Lake Sammamish 4 EBI2 H2S corrosion Combined System 5 EBI4 H2S corrosion Combined System 6 EBI8 H2S corrosion Combined System 7 ESI 1 H2S corrosion South Lake Washington 8 ESI 12 H2S corrosion NE Lake Washington 9 ESI 14 H2S corrosion NE Lake Washington
10 ESI 2 H2S corrosion South Lake Washington 11 Issaquah Interceptor - Section 1 H2S corrosion South Lake Sammamish 12 Juanita Interceptors H2S corrosion NE Lake Washington 13 Kenmore Interceptor - Section 2 H2S corrosion North Lake Washington 14 Lake Hills Interceptor H2S corrosion NE Lake Washington 15 North Interceptor H2S corrosion Combined System 16 Redmond Interceptor H2S corrosion NE Lake Washington 17 Sammamish Valley Interceptor H2S corrosion North Lake Washington

Section 3. System Condition
3-4 Regional Conveyance System Needs March 2007
Figure 3-1. Identified High Priority Hydrogen Sulfide Corrosion Sites

Regional Conveyance System Needs 4-1 March 2007
Section 4 Regional Conveyance System Age
Components of the County’s regional conveyance system vary in age from over 100 years old to newly constructed facilities. Simply stated, older conveyance facilities are likely to be more deteriorated than newer ones. However, age alone cannot and should not determine the need for capital improvements to the conveyance system. Information on the age of conveyance system components is discussed here only to identify portions of the system that may need to be replaced over time if they deteriorate to a point where maintenance and repair are no longer feasible or cost-effective.
4.1 Pipe Age A general age breakdown of regional conveyance pipes is shown in Figure 4-1. The chart is divided into categories coinciding with major capital expansion programs of the former Municipality of Metropolitan Seattle (Metro) and now King County Wastewater Treatment Division (WTD). These include pre 1961 pipe assumed from the local service providers, Phase 1 Metro construction (1961 to 1969), phase 2 (1970 to 1983), Phase 3 (1984 to 1986), and projects constructed since then. The pre 1961 pipe is further divided to show the ages of older conveyance pipes.
Overall Pipe Age by Percent (all materials)
7% 4%8%
33%15%
5%
28%<19151916-19371938-19601961-19691970-19831984-19861986-Present
Figure 4-1. Overall Age of the Conveyance System

Section 4. System Age
4-2 Regional Conveyance System Needs March 2007
Consistent inspection is required to identify and assess condition. Older facilities that have shown signs of deterioration are inspected more frequently. Consistent inspection allows for timely maintenance activity that can and does extend the life of facilities well beyond their listed design life. A discussion of the WTD condition assessment programs is covered in Section 3 of this technical memorandum.
4.2 Expected Life of Sewer Pipe The expected life of sewer pipe is primarily dependent on its construction material and the environmental and operational elements each pipe is subject to during its operation. Different wastewater agencies and groups have developed service life expectancies for individual sewage facilities, often related to cost and depreciation accounting practices. The United States Environmental Protection Agency and the State of California use 50 years for any type of wastewater pipe. British industry standards range from 80 to 125 years depending upon pipe diameter. This variation in projected life expectancy demonstrates that there is no universally accepted standard for life expectancy of any conveyance system component or material type.
Newer plastic pipe materials are believed to have longer service lives and lower life cycle costs, but most installations have not been in service long enough to determine the expected life.
Figure 4-2 below shows the percent breakdown of the conveyance system by material. WTD has 33 distinct types of pipe in its inventory. For this memorandum, the 33 pipe types have been categorized by their primary structural material into one of five categories: brick, concrete, ferrous materials (iron or steel), plastic, and miscellaneous (wood, clay, or asbestos). The miscellaneous category makes up less than one percent of the system.
Pipe System Materials by Percent
67%
27%
4% 2%
0.2%
brickconcreteferrousplasticmiscellaneous
Figure 4-2. Breakdown of Conveyance System Components by Material Type

Section 4. System Age
Regional Conveyance System Needs 4-3 March 2007
The following sections show the age of the wastewater conveyance system based on the categories of construction material.
4.2.1 Brick Sewers The brick sewers are primarily in the combined service area, and 85% of these pipes were constructed prior to 1915.
Brick Pipe Percent by Construction Year
85%
9% 0%
5%
1%
<19151916-19371938-19601970-19831986-Present
Figure 4-3. Age Breakdown of Brick Sewers
4.2.2 Concrete Pipe Concrete pipe includes some older brick pipe that has been rehabilitated with concrete. The major factor contributing to the deterioration of concrete pipe is corrosion due to hydrogen sulfide gas that naturally occurs in wastewater. As shown in the figure below, 80% of concrete pipe in the system was constructed after 1961.
Concrete Pipe Percent by Construction Year
6% 5%9%
47%
16%
1%16% <1915
1916-19371938-19601961-19691970-19831984-19861986-Present
Figure 4-4. Age Breakdown of Concrete Pipe

Section 4. System Age
4-4 Regional Conveyance System Needs March 2007
4.2.3 Ferrous Pipe Pipes made of ferrous materials include ductile iron, cast iron, and other steel/concrete and plastic lined steel hybrid pipes. The hybrid pipes are included in the ferrous pipes because the primary structure of the pipe is provided by the ferrous material. The most significant factors contributing to the deterioration of ferrous pipe are exterior galvanic corrosion and interior H2S corrosion.
Ferrous Pipe Percent by Construction Year
6% 9%
14%
16%
52%
3%0.1%
<19151916-19371938-19601961-19691970-19831984-19861986-Present
Figure 4-5. Age Breakdown of Ferrous Pipe
4.2.4 Plastic Pipe As seen in Figure 4.6 all of the plastic pipe in the system has been constructed since 1961.
Plastic pipe percent by constructioin year
1% 16%
83%
1961-19691970-19831986-Present
Figure 4-6. Age Breakdown of Plastic Pipe
Section 4. System Age
Regional Conveyance System Needs 4-5 March 2007
4.3 Age of Mechanical Equipment (pumps and pump station equipment) Mechanical or rotating equipment associated with the pumped conveyance of wastewater has shorter life expectancy and higher levels of inspection, maintenance, and replacement during their use. Typical life spans for wastewater mechanical equipment are 15 to 25 years. The mechanical equipment at a given pump station typically varies to serve the unique functions of each individual pump station.
The monitoring, maintenance, and replacement programs for mechanical equipment in place at the county are discussed in Sections 1 and 3 of this technical memorandum.
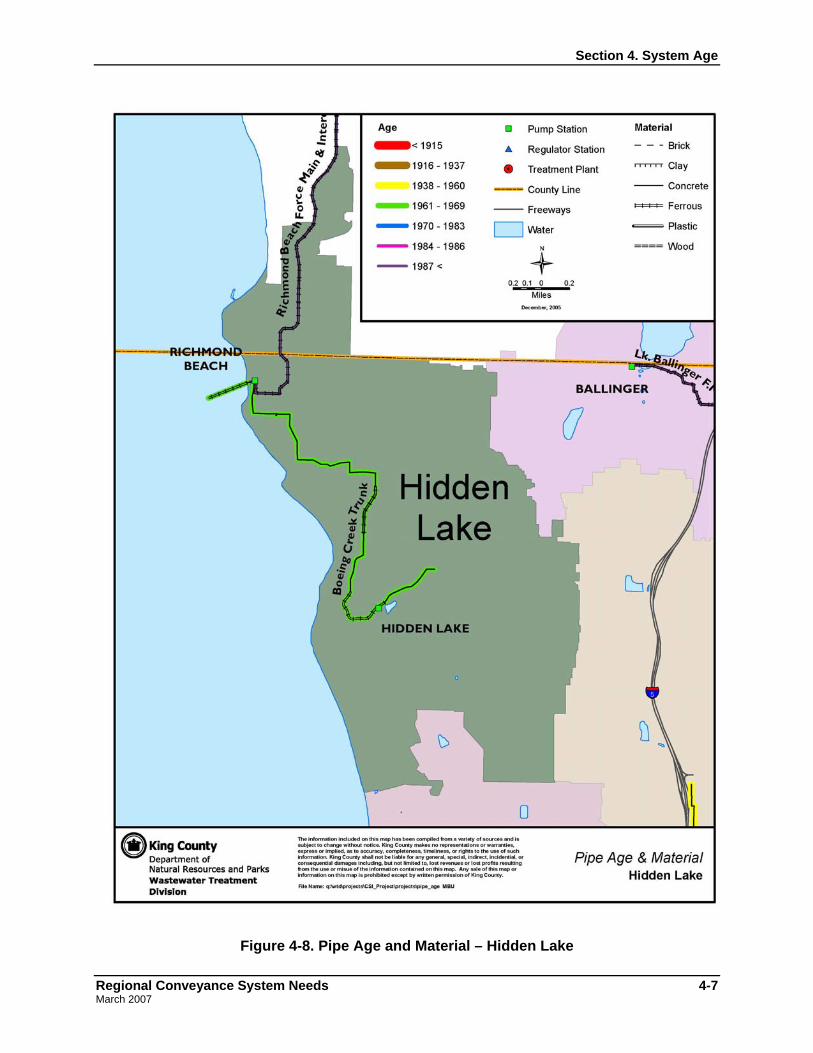
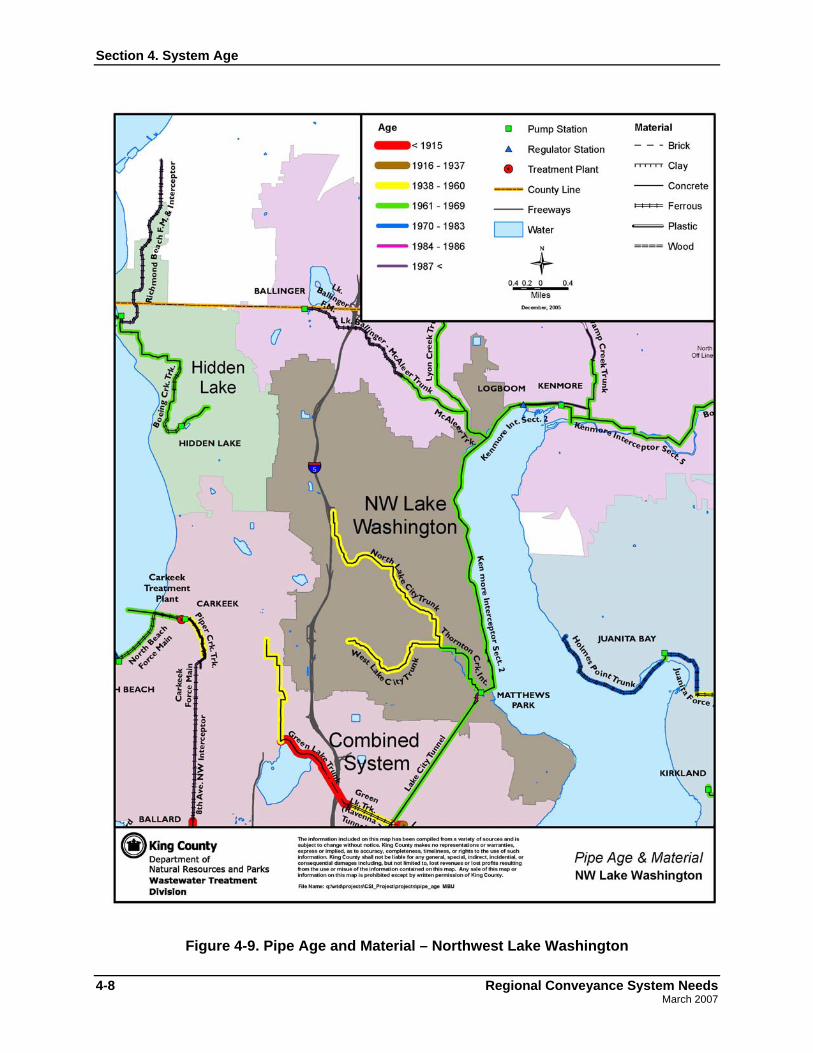
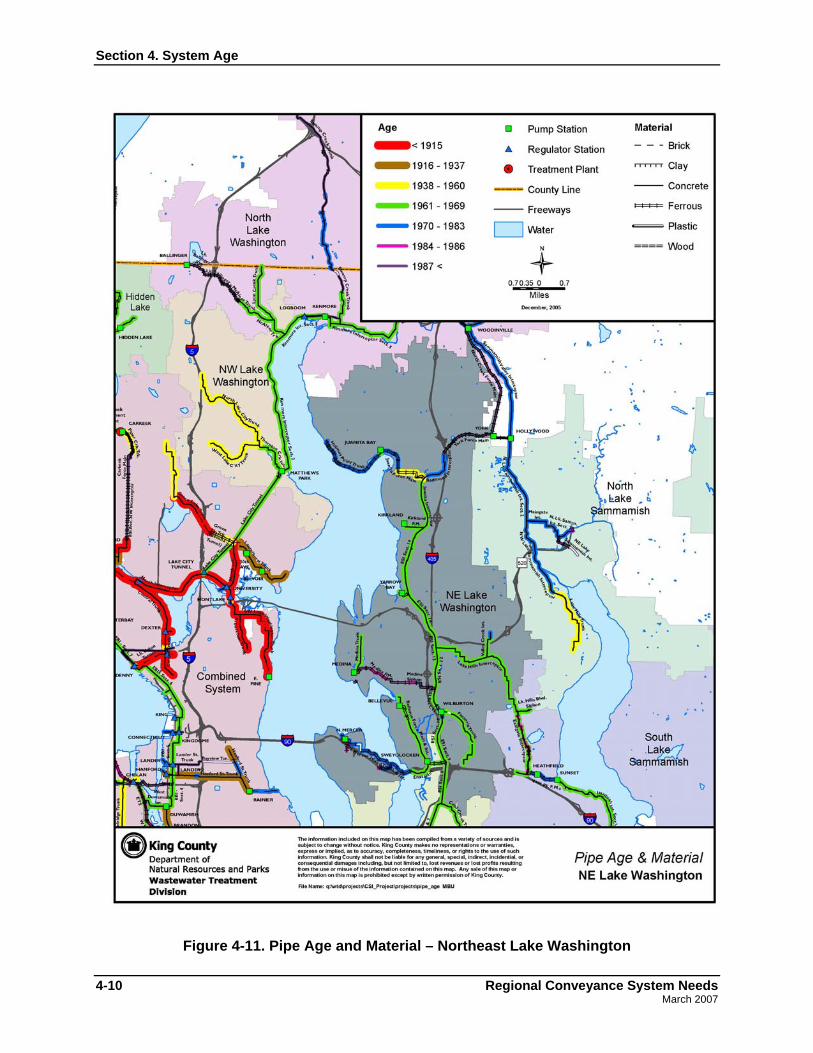
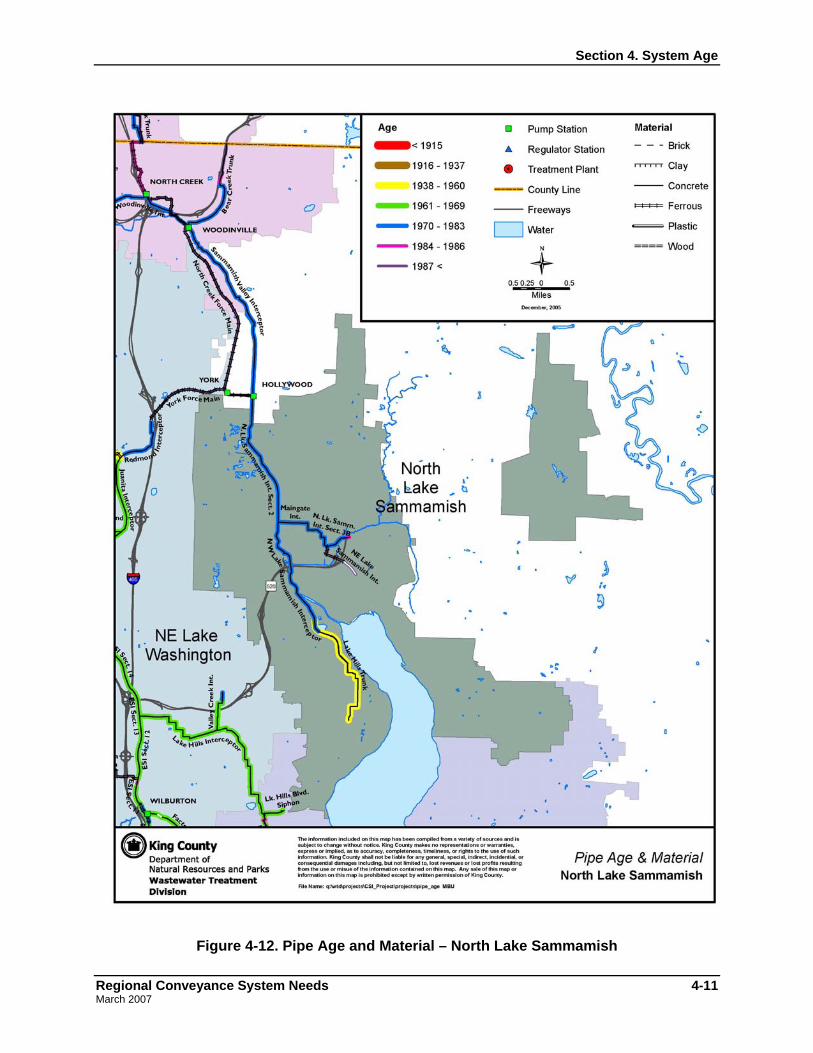
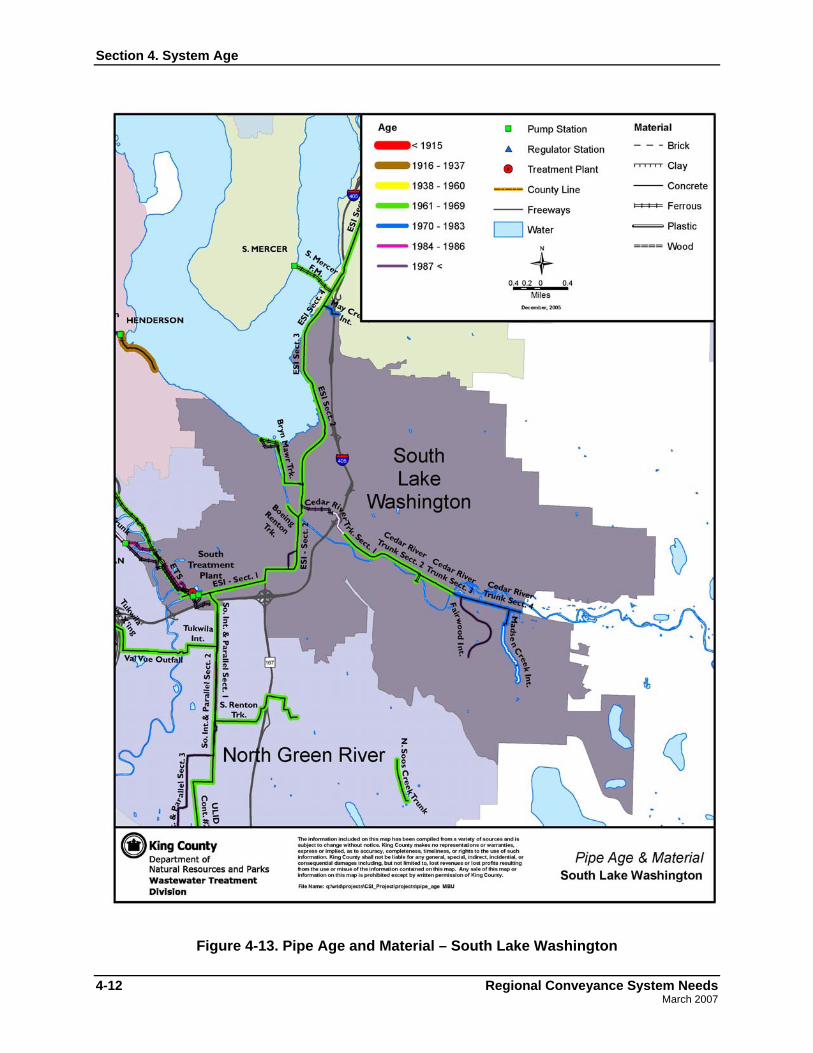
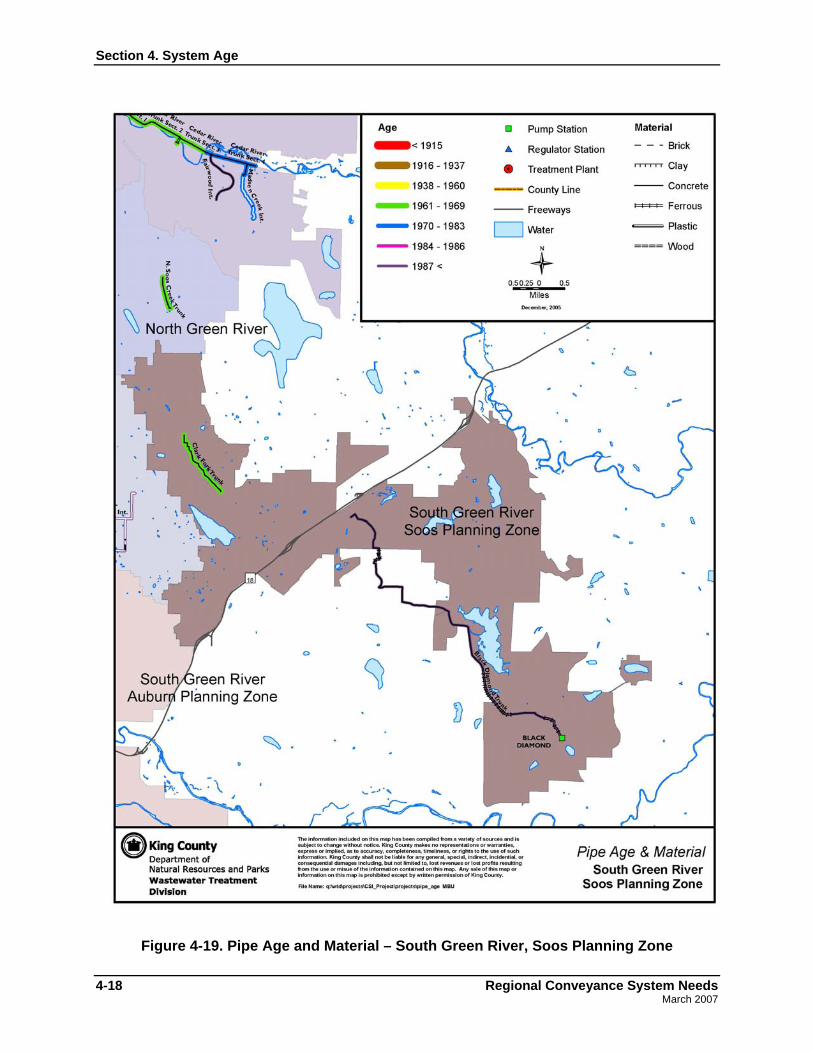
4.4 Maps of Age and Material Type by Planning Basin The following maps show the location of conveyance system components according to their age and material types by planning basin.

Section 4. System Age
4-6 Regional Conveyance System Needs March 2007
Figure 4-7. Pipe Age and Material – Combined System
Section 4. System Age
Regional Conveyance System Needs 4-7 March 2007
Figure 4-8. Pipe Age and Material – Hidden Lake
Section 4. System Age
4-8 Regional Conveyance System Needs March 2007
Figure 4-9. Pipe Age and Material – Northwest Lake Washington

Section 4. System Age
Regional Conveyance System Needs 4-9 March 2007
Figure 4-10. Pipe Age and Material – North Lake Washington
Section 4. System Age
4-10 Regional Conveyance System Needs March 2007
Figure 4-11. Pipe Age and Material – Northeast Lake Washington
Section 4. System Age
Regional Conveyance System Needs 4-11 March 2007
Figure 4-12. Pipe Age and Material – North Lake Sammamish
Section 4. System Age
4-12 Regional Conveyance System Needs March 2007
Figure 4-13. Pipe Age and Material – South Lake Washington

Section 4. System Age
Regional Conveyance System Needs 4-13 March 2007
Figure 4-14. Pipe Age and Material – Southeast Lake Washington

Section 4. System Age
4-14 Regional Conveyance System Needs March 2007
Figure 4-15. Pipe Age and Material – South Lake Sammamish

Section 4. System Age
Regional Conveyance System Needs 4-15 March 2007
Figure 4-16. Pipe Age and Material – North Green River

Section 4. System Age
4-16 Regional Conveyance System Needs March 2007
Figure 4-17. Pipe Age and Material – South Green River, Auburn Planning Zone

Section 4. System Age
Regional Conveyance System Needs 4-17 March 2007
Figure 4-18. Pipe Age and Material – South Green River, Kent Planning Zone
Section 4. System Age
4-18 Regional Conveyance System Needs March 2007
Figure 4-19. Pipe Age and Material – South Green River, Soos Planning Zone

Regional Conveyance System Needs 5-1 March 2007
Section 5 Crosswalk to Past Conveyance
Planning Documents
5.1 Crosswalk to Identified Capacity Needs This section is a cross-walk between the regional conveyance system needs identified in this technical memorandum to the conveyance improvement projects listed in the June 2004 technical memorandum, Summary of Non-Brightwater Conveyance Cost Increases from the 1998 Regional Wastewater Services Plan to the 2004 Regional Wastewater Services Plan Update, and the projects listed in the March 2005 Regional Needs Assessment Report (RNA).
The RWSP, the 2004 RWSP Update, and the RNA contained proposed conveyance improvement projects, planning level costs, and schedules for implementation of the projects that spread the costs between 1998 and 2030 and, in the case of the RNA, out to 2050. Because this technical memorandum focuses only on conveyance system needs, a direct crosswalk between it and previous conveyance planning documents is difficult. This is because an identified conveyance system need may require multiple improvement projects and, occasionally, a single improvement project may solve multiple conveyance system needs.
Two examples follow:
• The current Bellevue Pump Station/Force Main project will address capacity and reliability issues at the Bellevue Pump Station, and the rerouting of the force main directly to the East Side Interceptor will delay the need to address capacity issues in the Sweyolocken Pump Station system.
• Addressing capacity needs in the south Lake Sammamish Planning area will require a series of phased projects aimed at ensuring capacity along the Issaquah interceptors, Sunset/Heathfield pump stations and Vasa Park force mains, and the Eastgate and Lake Hills Interceptors.
Note This technical memorandum identifies needs based only on capacity constraints and conditions. It does not identify project solutions and their estimated costs. This work will be completed in 2006 and will include the development of project alternatives, cost estimates, the selection of a preferred project alternative for each identified need, and an implementation schedule.

Section 5. Crosswalk to Past Conveyance Planning Documents
5-2 Regional Conveyance System Needs March 2007
Table 5-1 below is a crosswalk that shows the relationship between the conveyance system capacity needs identified in this technical memorandum and the planned projects listed in Table 4, Page 6 of the 2004 RWSP Update and Table 4-1 of the RNA. The RNA projects include the project number from Table 4-1 in parentheses.
There are several conveyance needs identified in this technical memorandum that were not previously identified during the development of the 2004 RWSP Update or the RNA. Ongoing hydraulic analysis and review of conveyance system performance have identified additional capacity constraints. In one case, the current Bellevue Pump Station project was inadvertently left off of the RNA Table 4-1. This technical memorandum focuses on needs and does not include information about alternative conveyance system projects that may have positive downstream affects that can eliminate a conveyance need.
Table 5-1 organizes identified conveyance needs by planning basin. Each identified need has a unique map identification number that corresponds to the capacity constraint maps for each planning basin contained in Section 2 of this technical memorandum (Figures 2-3 through 2-14).
Table 5-1. Conveyance System Capacity Needs by Planning Basin
Map ID # Identified Conveyance Need
June 2004 RWSP Update
Table 4
March 2005 Regional Needs Assessment
Table 4-1 Hidden Lake Planning Basin
(Figure 2-3)
1 Hidden Lake Pump Station/Boeing Creek Trunk
Hidden Lake Pump Station/Boeing Trunk
Hidden Lake Pump Station/ Boeing Trunk (14)
2 Richmond Beach Pump Station/Richmond Beach Force Main
Hidden Lake Pump Station/Boeing Trunk
Hidden Lake Pump Station/ Boeing Trunk (14)
3 Richmond Beach Interceptor Hidden Lake Pump Station/Boeing Trunk
Hidden Lake Pump Station/ Boeing Trunk (14)
Northeast Lake Washington Planning Basin (Figure 2-4)
4 Bellevue Pump Station/Bellevue Force Main Bellevue Pump Station Not Identified
5 Bellevue Interceptor Bellevue Pump Station North Mercer and Enatai Interceptors (30)
6 Enatai Interceptor Bellevue Pump Station North Mercer and Enatai Interceptors (30)
7 Wilburton Pump Station/Factoria Trunk Not Identified Factoria Trunk and Wilburton
Upgrade (35)
8 Holmes Point Trunk Juanita Bay Pump Station Juanita Bay Pump Station (12)
9 Juanita Bay Pump Station Juanita Bay Pump Station Juanita Bay Pump Station (12)
10 Kirkland Pump Station/Kirkland Force Main Not Identified Kirkland Pump Station and Force
Main Upgrade (15)
11 Lake Hills Interceptor Not Identified Not Identified
12 Medina Force Main Not Identified Medina New Storage (42)
13 Medina Trunk Not Identified Medina Trunk Minor Upgrade (31)

Section 5. Crosswalk to Past Conveyance Planning Documents
Regional Conveyance System Needs 5-3 March 2007
Map ID # Identified Conveyance Need
June 2004 RWSP Update
Table 4
March 2005 Regional Needs Assessment
Table 4-1
14 North Mercer Island Interceptor North Mercer Island North Mercer and Enatai Interceptors (30)
15 Sweyolocken Pump Station/Sweyolocken Force Main Bellevue Pump Station North Mercer and Enatai
Interceptors (30) North Green River Planning Basin
(Figure 2-5)
16 North Soos Creek Interceptor Not Identified North Soos Creek Interceptor (39)
17 Rainier Vista Trunk Not Identified Rainier Vista Trunk (45)
18 South Renton Trunk Not Identified South Renton Interceptor (60)
North Lake Sammamish Planning Basin (Figure 2-6)
19 Lake Hills Trunk Not Identified Lake Hills Trunk Fourth Barrel Addition (47)
20 NW Lake Sammamish Interceptor Not Identified Northwest Lake Sammamish Interceptor (44)
North Lake Washington Planning Basin (Figure 2-7)
21 North Creek Trunk North Creek NC3-A North Creek 1-A, 2-A, 3-A, and
North Creek Trunk (17, 48, 56, and 61)
22 Swamp Creek Trunk Not Identified Swamp Creek Parallel - Section 1B (49)
23 York Pump Station Modification York Pump Station Capacity to 68 MGD York Pump Station Subtotal (10)
Northwest Lake Washington Planning Basin (Figure 2-8)
24 Thornton Creek Interceptor Thornton Interceptor (3 projects)
Thornton Creek Interceptor - Section 1and 2 (32)
Southeast Lake Washington Planning Basin (Figure 2-9)
25 Coal Creek Trunk Coal Creek (2 projects) Coal Trunk Replacement (34)
South Green River Planning Basin, Kent Planning Zone (Figure 2-10)
26 Auburn Interceptor-Section 1 New Auburn Interceptor - Section 1 Replacement
Kent Auburn CSI Projects (18, 19, 20, 21, 22, 38, 46, 55)
27 Auburn Interceptor-Section 2 New Auburn Interceptor - Section 2 Replacement
Kent Auburn CSI Projects (18, 19, 20, 21, 22, 38, 46, 55)
28 Auburn Interceptor-Section 3 Not Identified Kent Auburn CSI Projects (18, 19, 20, 21, 22, 38, 46, 55)
29 Garrison Creek Trunk Not Identified Garrison Creek Trunk (46)
30 Kent Cascade Interceptor Not Identified Soos Creek CSI Projects (23, 25, 43)
31 Mill Creek Interceptor Mill Creek Relief Interceptor Mill Creek Relief Sewer (38)
32 ULID #1 – Contract #5 Kent Not Identified Kent Auburn CSI Projects (18, 19, 20, 21, 22, 38, 46, 55)

Section 5. Crosswalk to Past Conveyance Planning Documents
5-4 Regional Conveyance System Needs March 2007
Map ID # Identified Conveyance Need
June 2004 RWSP Update
Table 4
March 2005 Regional Needs Assessment
Table 4-1
33 ULID #1 – Contract #4 Kent Not Identified Kent Auburn CSI Projects (18, 19, 20, 21, 22, 38, 46, 55)
South Green River Planning Basin, Auburn Planning Zone (Figure 2-11)
34 Pacific Pump Station/Algona Pacific Trunk Not Identified Pacific Pump Station (9), Algona
Pacific Trunk Sage 1 and 2 (50, 60)
35 Auburn - West Interceptor Not Identified Kent Auburn CSI Projects (18, 19, 20, 21, 22, 38, 46, 55)
36 Auburn - West Valley Interceptor Not Identified Kent Auburn CSI Projects (18, 19, 20, 21, 22, 38, 46, 55)
37 Lakeland Hills Pump Station Not Identified Lakeland Trunk (57), Lakeland Hills Pump Station Upgrade (63)
38 M Street Trunk Not Identified Kent Auburn CSI Projects (18, 19, 20, 21, 22, 38, 46, 55)
39 West Valley Interceptor Not Identified Kent Auburn CSI Projects (18, 19, 20, 21, 22, 38, 46, 55)
South Green River Planning Basin, Soos Planning Zone (Figure 2-12)
40 Black Diamond Pump Station/Black Diamond Trunk
Implementation of Previous Comp Plans
Soos Creek CSI Projects (23, 25, 43)
South Lake Sammamish Planning Basin (Figure 2-13)
41 Eastgate Interceptor South Sammamish CSI Projects
South Sammamish CSI Projects (28, 36, 51, 52)
42 Issaquah Creek Interceptor South Sammamish CSI Projects
South Sammamish CSI Projects (28, 36, 51, 52)
43 Issaquah Interceptor - Section 1 South Sammamish CSI Projects
South Sammamish CSI Projects (28, 36, 51, 52)
44 Issaquah Interceptor - Section 2 South Sammamish CSI Projects
South Sammamish CSI Projects (28, 36, 51, 52)
45 Sunset Heathfield Pump Stations/Vasa Park Force Mains
SLS: Minor Pump Station Improvements
South Sammamish CSI Projects (28, 36, 51, 52)
South Lake Washington Planning Basin (Figure 2-14)
46 Bryn Mawr Trunk Not Identified Bryn Mawr Storage (33)
47 ESI 1 Not Identified Not Identified
48 ESI 3 Not Identified Not Identified

Section 5. Crosswalk to Past Conveyance Planning Documents
Regional Conveyance System Needs 5-5 March 2007
5.2 Facility Acquisitions and Extensions Both the 2004 RWSP Update and the RNA listed other actions and activities that include the acquisition of facilities and extension of interceptors. These facility costs and any subsequent upgrades to these facilities become part of the CSI program. Recent examples include:
• the acquisition of the North Creek and Swamp Creek trunks from Alderwood Water and Wastewater District
• an interceptor extension being constructed by the Sammamish Plateau Water and Sewer District that will become part of the regional conveyance system upon completion in early 2006.
There are currently two acquisitions being considered by the County:
• Juanita Creek Trunk/ULID #5 in Northshore Utility District
• Central Plateau Interceptor recently constructed by the City of Renton in conjunction with a King County Roads Division Project.
