appendix c the health of our waters, water quality
TRANSCRIPT
Appendix C The Health of Our Waters,
Water Quality Monitoring Results for 2008

Table of Contents
Contents
Acronyms and Abbreviations ........................................................................................................ iii
Summary of 2008 Water and Sediment Monitoring....................................................................C-1 Treatment Plant Effluent........................................................................................................... C-1 Marine Water and Sediment ..................................................................................................... C-1 Lake Water and Sediment......................................................................................................... C-3 Stream and River Water and Sediment..................................................................................... C-4 Other Monitoring...................................................................................................................... C-5 Availability of Monitoring Data on the Web............................................................................ C-5
Marine Water Monitoring Results .............................................................................................C-11 Ambient and Outfall Locations in the Offshore and Nearshore Water Column..................... C-11 Ambient and Outfall Locations at Puget Sound Beaches ....................................................... C-20 Quartermaster Harbor Study................................................................................................... C-23
Marine Sediment Monitoring Results........................................................................................C-25 Ambient Locations in Puget Sound and Elliott Bay ............................................................... C-26 Treatment Plant Outfalls......................................................................................................... C-26 Sediment Remediation Projects.............................................................................................. C-29
Major Lakes Water Monitoring Results ....................................................................................C-34 Ambient Mid-Lake (Open Water) and Nearshore .................................................................. C-34 Swimming Beaches ................................................................................................................ C-38
Major Lakes Sediment Monitoring Results ...............................................................................C-42
Stream and River Water Monitoring Results.............................................................................C-44 Overall River and Stream Water Quality—Water Quality Index........................................... C-44 Normative Streamflows.......................................................................................................... C-50
Stream and River Sediment Monitoring Results .......................................................................C-52
Wetland Monitoring for Carnation Treatment Plant Discharge ................................................C-55
List of Tables Table C-1. Summary of King County Water Quality Monitoring Programs............................................ C-7
List of Figures Figure C-1. 2008 Marine Ambient and Outfall Water Monitoring Locations ........................................ C-13
Figure C-2. Fecal Coliform Bacteria 2008 Results for Puget Sound Offshore and Nearshore Monitoring Stations ................................................................................................................................ C-14
Figure C-3. Conceptual Diagram of Marine Nutrient-Oxygen Dynamics.............................................. C-15
Figure C-4. Percentage of King County Offshore Stations with Moderate or High Concern Rankings Based on the Water Quality Index, 1999–2008 ...................................................................................... C-16
Appendix C i

Table of Contents
ii Appendix C
Figure C-5. Example of Seasonal Dissolved Oxygen Variation in Puget Sound, 2005–2007................ C-18
Figure C-6. Dissolved Oxygen at Puget Sound Ambient and Outfall Offshore Stations, 2005–2008 .............................................................................................................................................. C-18
Figure C-7. Ammonia Values at Puget Sound Ambient and Outfall Offshore Stations, 2005–2008 .............................................................................................................................................. C-20
Figure C-8. Fecal Coliform Bacteria 2008 Results for Puget Sound Beach Monitoring Stations .......... C-22
Figure C-9. Study Area for the Quartermaster Harbor Nitrogen Management ...................................... C-25
Figure C-10. Sediment Monitoring Stations in Elliott Bay and Central Basin of Puget Sound ............ C-28
Figure C-11. Alternatives for Cleanup of Contaminated Sediments in the Lower Duwamish Waterway ................................................................................................................................................ C-33
Figure C-12. Ambient Monitoring Locations in Lakes Washington, Sammamish, and Union (including the Lake Washington Ship Canal) ......................................................................................... C-34
Figure C-13. Percentage of Ambient Stations in Lakes Washington, Sammamish, and Union that Met the Fecal Coliform Bacteria Standard, 2000–2008................................................................... C-35
Figure C-14. Overall Water Quality in Lakes Washington, Sammamish, and Union Based on the Trophic State Index for Total Phosphorus, 1994–2008 .......................................................................... C-36
Figure C-15. January Water Temperatures in Lakes Washington, Sammamish, and Union, 1933-2008 ............................................................................................................................................... C-38
Figure C-16. Swimming Beach Monitoring Locations in Lake Washington, Lake Sammamish, and Green Lake ....................................................................................................................................... C-40
Figure C-17. Percentage of Samples that Met the Fecal Coliform Bacteria Standard at Green Lake Swimming Beaches, 1996–2008............................................................................................................. C-41
Figure C-18. Percentage of Samples that Met the Fecal Coliform Bacteria Standard at Lake Sammamish Swimming Beaches, 1996–2008 ........................................................................................ C-41
Figure C-19. Percentage of Samples that Met the Fecal Coliform Bacteria Standard at Lake Washington Swimming Beaches, 1996–2008 ........................................................................................ C-42
Figure C-20. Long-Term Sediment Monitoring Stations in Lakes Washington, Sammamish, and Union................................................................................................................................................ C-43
Figure C-21. Monitoring Locations in Rivers and Streams in 2008 ....................................................... C-45
Figure C-22. Percentage of Streams in WRIAs 8 and 9 with High or Moderate Concerns Based on Water Quality Index, 2000–2008....................................................................................................... C-47
Figure C-23. Water Quality Index Rankings for Rivers and Streams in WRIA 9, 2007–2008 .............. C-48
Figure C-24. Water Quality Index Rankings for Rivers and Streams in WRIA 8, 2007–2008 .............. C-49
Figure C-25. Hydrologic Monitoring Stations Used to Calculate the Stream Flashiness Index, 1945–2008 .............................................................................................................................................. C-51
Figure C-26. Annual Median Stream Flashiness Index Scores, 1945–2008........................................... C-52
Figure C-27. Stream Basin Sediment Sampling Results, 2004–2007..................................................... C-54

iii Appendix C
Acronyms and Abbreviations
BMP best management practices C Centigrade CFU colony-forming units COCs chemicals of concern cPAHs carcinogenic polycyclic aromatic hydrocarbon CSO combined sewer overflow DDD dichlorodiphenyldichloroethane DDE dichlorodiphenyldichloroethylene DDT dichlorodiphenyltrichloroethane DNR Washington State Department of Natural Resources DO dissolved oxygen EBDRP Elliott Bay/Duwamish Restoration Program Ecology Washington State Department of Ecology EPA U.S. Environmental Protection Agency F Fahrenheit FS feasibility study HPA Hydraulic Permit Approval LDW Lower Duwamish Waterway m meter mg/L milligrams per liter mL millileter nitrate+nitrite nitrate and nitrite NPDES National Pollutant Discharge Elimination System ORP oxygen reduction potential PAHs polycyclic aromatic hydrocarbons PAR photosynthetically active radiation PBDEs polybrominated diphenyl ethers PCBs polychlorinated biphenyls RI/FS remedial investigation/feasibility study SAP sampling and analysis plan SD storm drain SMS Washington State Sediment Management Standards SRI supplemental remedial investigation SVOCs semivolatile organic compounds TOC total organic compound TP total phosphorous TSI trophic state index TSS total suspended solids µg/L micrograms per liter WAC Washington Administrative Code WQI water quality index WRIA Water Resource Inventory Area


Appendix C. Water Quality Monitoring Results for 2008
This appendix presents a summary of the quality of King County’s marine water and freshwater bodies in 2008. The summary is followed by more detailed information on water quality monitoring locations, procedures, and results. The information satisfies the RWSP reporting policies that call for inclusion of yearly water quality monitoring results as a part of the RWSP annual report.
Summary of 2008 Water and Sediment Monitoring To protect public health and its significant investment in water quality improvements, King County regularly monitors wastewater treatment plant effluent, marine water, fresh water, and sediments (Table C-1 at the end of this summary). The biological, chemical, and physical parameters used to assess a water body’s health under Washington State Water Quality Standards are fecal coliform bacteria, dissolved oxygen, temperature, pH, nutrients, turbidity, and a variety of chemical compounds. King County uses other indicators in addition to these parameters.
2008 RWSP Annual Report C-1
Monitoring activities in 2008 found that in general, the quality of marine and fresh waters in King County is fair to good.
Treatment Plant Effluent
King County regularly samples wastewater effluent from its four secondary wastewater treatment plants—West Point, South, Vashon, and Carnation plants—and analyzes these samples at process laboratories at the plants and at its environmental laboratory in Seattle. Three plants discharge their effluent into Puget Sound through deep outfalls. Carnation discharged to the Snoqualmie River in 2008 and will start discharging to a nearby wetland in 2009. Discharges continue to be in compliance with the terms and conditions of the National Pollutant Discharge Elimination System (NPDES) permit for each plant, and so are in compliance with the Washington State Water Pollution Control Law, the Federal Water Pollution Control Act, and the Federal Clean Water Act.
Some water quality indicators… Fecal coliform bacteria. The presence of fecal indicator bacteria indicates that the water has been contaminated with the fecal material of humans, birds, or other warm-blooded animals. One type of fecal indicator bacteria, fecal coliforms, may enter the aquatic environment from domestic animals, wildlife, stormwater runoff, wastewater discharges, and failing septic systems. Although these bacteria are usually not harmful, they often occur with other less easily measured disease-causing bacteria and their presence indicates the potential for pathogens to be present and to pose a risk to human health.
Dissolved oxygen. Aquatic plants and animals require a certain amount of dissolved oxygen (DO) for respiration and basic metabolic processes. Waters that contain high amounts of DO are generally considered healthy ecosystems. DO concentrations are most important during the summer season when oxygen-depleting processes are at their peak.
Temperature. Temperature influences many of the chemical components of the water, including DO concentration. Temperature also exerts a direct influence on the biological activity and growth and, therefore, the survival of aquatic organisms. Temperature levels in waters that bear salmonids (cool water fish) are also very important.
Marine Water and Sediment
King County's Puget Sound Marine Monitoring Program routinely collects and analyzes water samples at the following locations: (1) near treatment plant and Combined Sewer Overflow

Appendix C. Water Quality Monitoring Results for 2008
C-2 2008 RWSP Annual Report
(CSO) outfalls to assess potential effects to Puget Sound water quality from wastewater discharges; (2) at ambient locations in the Sound to better understand regional water quality and to provide data needed to identify trends that might indicate impacts from long-term cumulative pollution; and (3) at Puget Sound beaches, including beaches near outfalls.1 It also collects sediment samples near outfalls and at ambient locations in Elliott Bay and the Central Basin of Puget Sound.
Offshore and Nearshore Water Seventeen stations in the offshore and nearshore water column were monitored monthly in 2008. Fifteen of the seventeen stations were monitored for nutrients, fecal indicator bacteria, dissolved oxygen (DO), turbidity, temperature, salinity, chlorophyll, water clarity, suspended solids, and photosynthetically active radiation (PAR).2 Two of the stations were monitored for nutrients, fecal indicator bacteria, temperature, and salinity. In addition, two continuous water quality monitoring systems at two locations (along the Seattle waterfront and in Quartermaster Harbor near Vashon–Maury Island) collect temperature, salinity, DO, turbidity, chlorophyll, and pH data every 15 minutes. These continuous data systems are augmenting and aiding in the interpretation of the monthly data collected at the other offshore sites.
Water quality in Puget Sound is evaluated by two fecal coliform bacteria standards—the geometric mean and the peak. All offshore marine monitoring locations—both ambient and outfall locations—met these fecal coliform bacteria standards in 2008. One nearshore station in Elliott Bay along the Seattle waterfront and another nearshore station at the mouth of the Lake Washington Ship Canal did not meet all fecal coliform bacteria standards, although they showed steady improvement as the year progressed. Both stations are near freshwater bacteria sources such as storm drains and the mouths of streams and creeks.
The overall quality of offshore marine waters is evaluated through the water quality index (WQI). Results of 2008 monitoring indicate that overall water quality in Puget Sound is good. The 14 offshore sites, including the 7 outfall sites, for which the WQI is calculated were classified as having good water quality (low level of concern).
Marine Beach Water Twenty-five beach stations were monitored in 2008 for fecal indicator bacteria, nutrients, temperature, and salinity. One stream site, located in Piper’s Creek, was monitored for fecal coliform bacteria and nutrients because this site affects water quality at the outflow on the beach at Carkeek Park. Fourteen of the twenty-five monitoring locations met all fecal coliform bacteria standards. Six stations did not meet any of the standards. These stations are near freshwater sources containing animal wastes, including streams and CSO, non–King County treatment plants, and stormwater outfalls.
1 Ambient monitoring measures surrounding (background) conditions. 2 Photosynthetically active radiation is the portion of the electromagnetic spectrum associated with photosynthesis. Its measure is important in evaluating the effect of light on plant growth.
Appendix C. Water Quality Monitoring Results for 2008
Sediment Sediments in ambient locations in Elliott Bay are sampled every two years and the Central Basin of Puget Sound every five years. All stations were sampled in 2007. The sampling found that sediment quality in these areas is generally good, with some isolated impacts from human activity. Sediment sampling near the West Point Treatment Plant outfall, also done in 2007, indicated that sediment quality was intermediate to high quality in all stations sampled.
Lake Water and Sediment
The Major Lakes Monitoring Program has been sampling 25 open-water (mid-lake) and nearshore sites in Lakes Washington, Sammamish, and Union (including the Lake Washington Ship Canal) since the early 1970s; the Swimming Beach Monitoring Program has been sampling 17 beaches on Lake Sammamish, Lake Washington, and Green Lake every summer since 1996; and in 2007, the Major Lakes Sediment Monitoring Program started a 10-year program to monitor sediment quality in Lakes Washington, Sammamish, and Union.
Mid-Lake and Nearshore Water Open-water and nearshore stations were sampled biweekly in the summer and monthly during the rest of 2008 for temperature, DO, pH, conductivity, clarity (Secchi transparency), nutrients, and fecal coliform bacteria.
Ambient water quality, as indicated by fecal coliform bacteria levels, is generally good. In 2008, 100 percent of the stations in the three lakes achieved the exceptionally high standard used to assess ambient lake water. This is an improvement from 2007 when some stations in Lake Union and Lake Washington did not meet the standards. In 2008, routine sampling events preceeded major storms and, thus, stormwater was less influential.
Summer phosphorus concentrations are converted to a trophic state index to assess overall water quality in Lakes Washington, Sammamish, and Union. The 1994–2008 results for Lakes Sammamish and Washington show that phosphorus concentrations fluctuated between the low and moderate thresholds from year to year, indicating that the water quality varies from good to moderate with low potential for nuisance algal blooms (algae feeds on phosphorus). Lake Union typically shows phosphorus concentrations in the moderate water quality range, with the exception of 2007. In 2007, high phosphorus levels placed Lake Union in the poor water quality range. High phosphorus concentrations in urbanized areas can result from poorly designed drainage systems, inadequate maintenance of sewer infrastructure, and home and business landscaping practices.
Swimming Beach Water Monitoring results from 2008 show that the higher concentrations of fecal coliform bacteria occur at beaches adjacent to streams that drain urbanized drainage basins. Bacteria levels were low in Green Lake for the sixth year in a row (all samples met the standard). Lake Sammamish levels remain consistently low, with slight variability from year to year. High bacteria levels resulted in the closure of one beach on Lake Washington (Juanita) in 2008. High bacteria levels were noted at Magnuson off-leash area, Gene Coulon, Mathews, and Luther Burbank swimming beaches, but the levels did not exceed standards. Intensive bacteria monitoring took place in the
2008 RWSP Annual Report C-3

Appendix C. Water Quality Monitoring Results for 2008
C-4 2008 RWSP Annual Report
Juanita Creek basin in 2008 as a joint effort between King County, the City of Kirkland, and the Washington State Department of Ecology. Results of the effort will be published in 2009.
Sediment Sediments at five stations are monitored in deep areas of Lakes Washington, Sammamish, and Union each year for trends. Other stations are sampled to investigate sediment quality in swimming beaches, nearshore habitat, and in areas with known contamination. Samples are analyzed for metals, organics, and physical parameters. In 2008, samples were collected in Lake Washington. The results are still being analyzed. Results from 2007 sampling in Lake Sammamish indicate that 10 out of 18 stations showed chemical concentrations high enough to suggest likely adverse effects to aquatic organisms.
Stream and River Water and Sediment
The Stream and River Monitoring Program targets rivers and streams that cross sewer trunk lines and those that are considered a potential source of pollutant loading to a major water body. This long-term program has collected samples at 63 sites on four rivers and twenty-eight streams for many years.3 Overall water quality of rivers and streams in King County, as measured by the WQI for rivers and streams, varies between and within streams. Increased urbanization has resulted in more surface runoff and changes to peak streamflow that cause flooding, channel erosion, and increased contaminant loading.
In 2008, theWQI indicated that 81 percent of the sixty-three sampling sites—compared to 80 percent in 2007—were of moderate or high water quality concern (poor to moderate water quality) and 19 percent were rated of low concern (good water quality). All sites rated of high concern were affected in part by excessive nitrogen and/or phosphorus. In addition, almost all high-concern sites were affected by low DO (73 percent of all sites), high fecal coliform bacteria (67 percent of all sites), high temperatures (33 percent of all sites), and high suspended solids/turbidity (13 percent of all sites).
The Streams Sediment Monitoring Program monitors sediment in small wadeable streams in Water Resource Inventory Areas (WRIAs) 8 and 9.4 Samples are collected at one location in 10 index creeks each year and analyzed for trends. In addition, one-time samples are collected every creek-mile in approximately three stream basins each year. All 30 streams in the program will be monitored within 10 years. Samples are analyzed for metals, organics, and physical parameters. So far, 13 streams in WRIA 8 have been sampled. Results suggest that there are likely adverse effects to aquatic organisms from chemicals at 32 of the sites that were monitored.
3 Starting in 2009, the number of stream and river sites to be monitored will drop to 20 because of budget cuts. 4 The two major watersheds—called Water Resource Inventory Areas (WRIAs)—in King County are the Lake Washington/Cedar/Sammamish watershed (WRIA 8) and the Green/Duwamish and Central Puget Sound watershed (WRIA 9).

Appendix C. Water Quality Monitoring Results for 2008
Other Monitoring
In addition to ongoing water and sediment quality monitoring, the county conducts special intensive investigations. Examples include the following:
• Studies are under way to support decision-making, siting, and construction of wastewater capital projects. For example, the wetland that will receive effluent from the new Carnation Treatment Plant is being monitored both before plant startup to establish a baseline and after discharge begins to monitor for any trends in water and sediment quality.
• In 2008, King County was awarded a grant by the U.S. Environmental Protection Agency (EPA) to conduct the Quartermaster Harbor Nitrogen Management Study. The study, prompted by low DO levels and other indicators of degraded water quality, will begin in 2008 and extend through 2012.
• King County is participating in studies, some of them under the federal Superfund program, of sediments contaminated from historical discharges from CSO and storm drain outfalls.
Availability of Monitoring Data on the Web
In 2008, King County’s regional data management program continued to maintain and upgrade the methods used to store and disseminate monitoring data so that the public can directly download substantial amounts of data from the Web:
• The Puget Sound Marine Monitoring Program page provides tables and graphs of measurements of Puget Sound water quality collected from the surface to the bottom. This page was upgraded in 2007 to provide data for continuous water quality meters in Elliott Bay and Quartermaster Harbor. It is currently being updated so that all data will be available for viewing and downloading. The updated page is expected to be completed in 2010. The page is found at http://green.kingcounty.gov/marine/HiFrequency.aspx.
• The Swimming Beach Monitoring Program page provides tables, graphs, and maps of monitoring results as they become available each week and provides the most current information on beach closures. The page is found at http://green.kingcounty.gov/swimbeach/.
• The Major Lakes Monitoring Program page (http://green.kingcounty.gov/lakes/) and the Stream and River Monitoring Program page (http://green.kingcounty.gov/WLR/Waterres/StreamsData/) provide tables and graphs of monitoring results as they become available each month. These pages continue to allow for direct data download from the Web. A substantial upgrade to the Stream and River monitoring page was released in May 2008.
• The Hydrologic Information Center page provides the public with access and robust ability to download rainfall, streamflow, water quality, and other hydrologic data collected at King County gauge sites. It also offers a summary of the year’s precipitation
2008 RWSP Annual Report C-5

Appendix C. Water Quality Monitoring Results for 2008
C-6 2008 RWSP Annual Report
and provides access to presentations made by King County’s hydrology staff. The page is found at http://green.kingcounty.gov/wlr/waterres/hydrology/.
• The Lakes Stewardship Program page was upgraded to provide the ability to download data and to access graphs and maps of the lakes and the monitoring data. The page is found at http://www.kingcounty.gov/environment/wlr/lake-stewardship-program.aspx.

Appendix C. Water Quality Monitoring Results for 2008
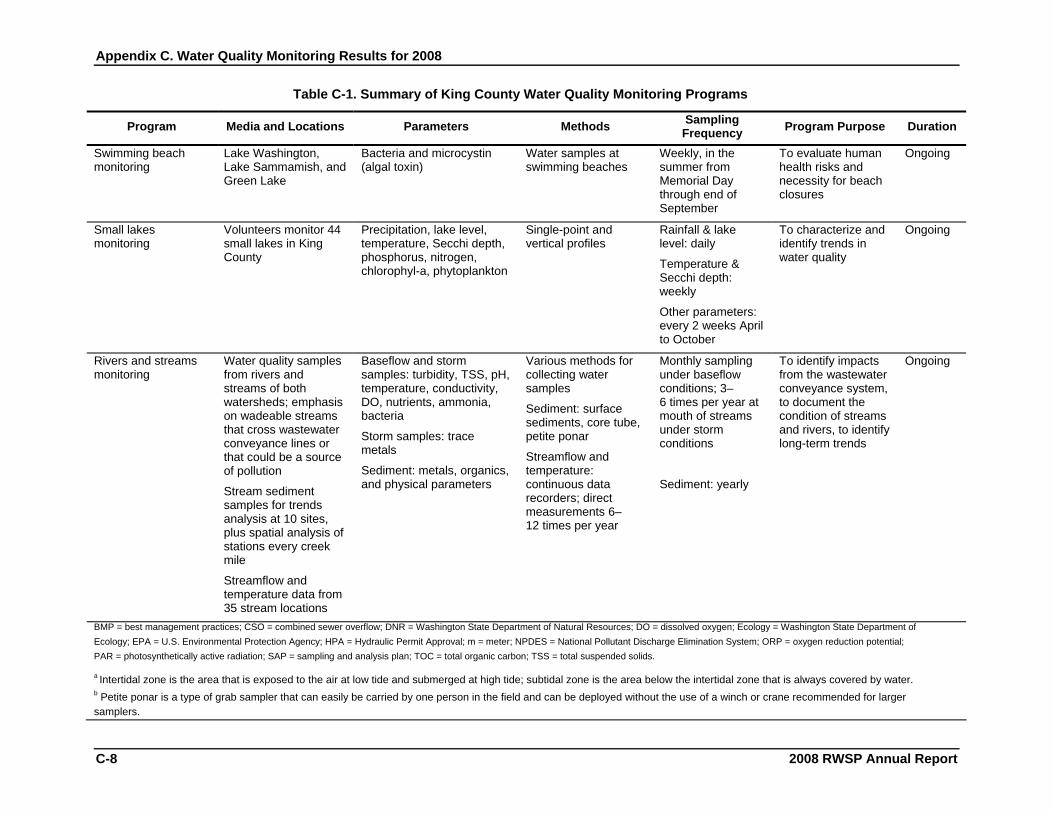
Table C-1. Summary of King County Water Quality Monitoring Programs
Program Media and Locations Parameters Methods Sampling Frequency Program Purpose Duration
Ongoing Monitoring Marine monitoring Water and sediment in
areas of Puget Sound near and away from treatment plant and CSO outfalls
Water and shellfish (butter clams) at Puget Sound beaches
Water: temperature, salinity, clarity, DO, TSS, turbidity, nutrients, pH, chlorophyll, PAR, and bacteria
Ambient sediment: metals, organics, and physical properties
Beach water: temperature, salinity, nutrients, and bacteria
Shellfish: lipids and metals
Water samples collected at multiple depths, ranging from 1 to 200 m
Sediment: VanVeen grab sampler for subtidal sediments; sediment corer for intertidal sedimentsa
Shellfish: shovel
Water: monthly; continuous (every 15 minutes) at 2 sites
Sediment: every 2 years (Elliott Bay), every 5 years (Puget Sound)
Shellfish: semi-annually
To assess potential effects to water quality from point and nonpoint pollution sources and to compare quality to county wastewater sources
Ongoing
Marine NPDES sediment monitoring
Sediments in Puget Sound near treatment plant outfalls
Grain size, solids, sulfides, ammonia-nitrogen, oil & grease, TOC, metals, organic compounds, and (at South and West Point plants) benthic infauna
Sediment samples in a grid pattern as defined in the SAP approved by Ecology
Sediment samples at outfalls once per permit cycle (about every 5 years)
NPDES permit requirement
Ongoing
Major lakes monitoring
Water and sediment in Lakes Washington, Sammamish, and Union at ambient locations and near stormdrains and CSOs
Water: temperature, DO, pH, conductivity, clarity, nutrients, and fecal coliform; micorcystin at select stations
Sediment: metals, organics, and physical properties
Water samples collected every 5 m from 1 m below the surface to bottom at one station in center of lake and from the surface around various locations around the shoreline
Sediment: surface, petite ponarb
Water samples: biweekly during the growing season; monthly during the rest of the year
Sediment: yearly
To identify impacts from the wastewater conveyance system and to document the condition of lakes
Ongoing
BMP = best management practices; CSO = combined sewer overflow; DNR = Washington State Department of Natural Resources; DO = dissolved oxygen; Ecology = Washington State Department of Ecology; EPA = U.S. Environmental Protection Agency; HPA = Hydraulic Permit Approval; m = meter; NPDES = National Pollutant Discharge Elimination System; ORP = oxygen reduction potential; PAR = photosynthetically active radiation; SAP = sampling and analysis plan; TOC = total organic carbon; TSS = total suspended solids.
a Intertidal zone is the area that is exposed to the air at low tide and submerged at high tide; subtidal zone is the area below the intertidal zone that is always covered by water. b Petite ponar is a type of grab sampler that can easily be carried by one person in the field and can be deployed without the use of a winch or crane recommended for larger samplers.
2008 RWSP Annual Report C-7
Appendix C. Water Quality Monitoring Results for 2008
C-8 2008 RWSP Annual Report
Table C-1. Summary of King County Water Quality Monitoring Programs
Program Media and Locations Parameters Methods Sampling Frequency Program Purpose Duration
Swimming beach monitoring
Lake Washington, Lake Sammamish, and Green Lake
Bacteria and microcystin (algal toxin)
Water samples at swimming beaches
Weekly, in the summer from Memorial Day through end of September
To evaluate human health risks and necessity for beach closures
Ongoing
Small lakes monitoring
Volunteers monitor 44 small lakes in King County
Precipitation, lake level, temperature, Secchi depth, phosphorus, nitrogen, chlorophyl-a, phytoplankton
Single-point and vertical profiles
Rainfall & lake level: daily
Temperature & Secchi depth: weekly
Other parameters: every 2 weeks April to October
To characterize and identify trends in water quality
Ongoing
Rivers and streams monitoring
Water quality samples from rivers and streams of both watersheds; emphasis on wadeable streams that cross wastewater conveyance lines or that could be a source of pollution
Stream sediment samples for trends analysis at 10 sites, plus spatial analysis of stations every creek mile
Streamflow and temperature data from 35 stream locations
Baseflow and storm samples: turbidity, TSS, pH, temperature, conductivity, DO, nutrients, ammonia, bacteria
Storm samples: trace metals
Sediment: metals, organics, and physical parameters
Various methods for collecting water samples
Sediment: surface sediments, core tube, petite ponar
Streamflow and temperature: continuous data recorders; direct measurements 6–12 times per year
Monthly sampling under baseflow conditions; 3–6 times per year at mouth of streams under storm conditions
Sediment: yearly
To identify impacts from the wastewater conveyance system, to document the condition of streams and rivers, to identify long-term trends
Ongoing
BMP = best management practices; CSO = combined sewer overflow; DNR = Washington State Department of Natural Resources; DO = dissolved oxygen; Ecology = Washington State Department of Ecology; EPA = U.S. Environmental Protection Agency; HPA = Hydraulic Permit Approval; m = meter; NPDES = National Pollutant Discharge Elimination System; ORP = oxygen reduction potential; PAR = photosynthetically active radiation; SAP = sampling and analysis plan; TOC = total organic carbon; TSS = total suspended solids.
a Intertidal zone is the area that is exposed to the air at low tide and submerged at high tide; subtidal zone is the area below the intertidal zone that is always covered by water. b Petite ponar is a type of grab sampler that can easily be carried by one person in the field and can be deployed without the use of a winch or crane recommended for larger samplers.

Appendix C. Water Quality Monitoring Results for 2008
2008 RWSP Annual Report C-9
Table C-1. Summary of King County Water Quality Monitoring Programs
Program Media and Locations Parameters Methods Sampling Frequency Program Purpose Duration
Benthic macroinvertebrate monitoring
Wadeable stream sub-basins
Size and distribution of aquatic macroinvertebrate populations
Samples colllected with a Surber stream bottom sampler
Annually To establish a baseline for identifying long-term trends
Ongoing
Precipitation monitoring
Rainfall measured at 70 locations in King and Snohomish Counties, and at 2 meteorologic stations
Rainfall, air temperature, wind pressure, calculated transpiration/evaporarion
Continuous data recorders
To analyze infiltration to wastewater conveyance system and to model stormwater
Ongoing
Special Studies Brightwater Outfall Studies
Water, sediment, eelgrass, and intertidal biota for the Brightwater outfall site
Water: temperature, salinity, clarity, DO, nutrients, suspended solids, turbidity, chlorophyll, PAR, and bacteria
Sediment: chemistry and benthic taxonomy
Eelgrass and intertidal biota: distribution and relative abundance
Water column samples collected at multiple depths, from 1 to 175 m
Surface sediments collected by grab sampling
Eelgrass survey: side-scan sonar, underwater video, SCUBA divers
Intertidal biota survey: transect/quadrat method
Water: monthly
Sediment: 4 times per year
Eelgrass: 7 sampling events over the course of the study
Intertidal biota: annually for 5 years
To meet HPA and DNR outfall lease requirements and to compare outfall pre-construction to post-construction data
Through 2014
Brightwater Construction NPDES Stormwater Monitoring
Stormwater and surface water
Stormwater quality Various Intensive To meet NPDES Construction Stormwater permit
Through 2010
BMP = best management practices; CSO = combined sewer overflow; DNR = Washington State Department of Natural Resources; DO = dissolved oxygen; Ecology = Washington State Department of Ecology; EPA = U.S. Environmental Protection Agency; HPA = Hydraulic Permit Approval; m = meter; NPDES = National Pollutant Discharge Elimination System; ORP = oxygen reduction potential; PAR = photosynthetically active radiation; SAP = sampling and analysis plan; TOC = total organic carbon; TSS = total suspended solids.
a Intertidal zone is the area that is exposed to the air at low tide and submerged at high tide; subtidal zone is the area below the intertidal zone that is always covered by water. b Petite ponar is a type of grab sampler that can easily be carried by one person in the field and can be deployed without the use of a winch or crane recommended for larger samplers.

Appendix C. Water Quality Monitoring Results for 2008
C-10 2008 RWSP Annual Report
Table C-1. Summary of King County Water Quality Monitoring Programs
Program Media and Locations Parameters Methods Sampling Frequency Program Purpose Duration
Elliott West/Denny Way CSO sediment monitoring
Sediment near the new Denny Way Regulator and Elliott West CSO Treatment Facility outfalls and in sediment cleanup areas associated with the old Denny Way CSO discharge site
Benthic communities, sediment chemistry
Sediment samples per approved SAP
Variable To meet U.S. Army Corps of Engineers permit requirements and an Ecology cleanup order
Through 2021
Duwamish/Diagonal post-remediation sediment monitoring
Sediment near the Seattle Diagonal storm drain (includes city and county CSO outfalls) and the county’s Duwamish CSO outfall
Sediment chemistry, turbidity, cap surveys
Sediment samples per approved SAP
Annual Under an EPA/Ecology Consent Order
Through 2013
Wetland monitoring for Carnation Treatment Plant
Water quality in discharge wetland, existing tributaries, and outflow
Sediment quality in wetland pond
Water: metals, organics, nutrients, bacteria
Sediment: metals, organics, and physical parameters
Water column
Surface sediments
Variable
Determine conditions before and after treatment plant discharge
2006–2010
Quartermaster Harbor Nitrogen Management Study
Groundwater quality
Streamwater quality
Streamflow and temperature (done as part of another project)
Marine water quality (see ambient marine monitoring above)
Groundwater: alkalinity, nutrients, TSS, bacteria, DO, pH, specific conductance, temperature, turbidity, oxidation reduction potential
Streamwater: same as groundwater, except for addition of mircrobiology and deletion of TSS and ORP
Groundwater: monitoring wells with dedicated sampling equipment
Streamwater: various sampling methods
Groundwater: Annually
Streams: Monthly
Streamflow: continuously at 5 sites; every 2 years at 22 sites
Recommend policy changes for nitrogen management in the King County Comprehensive Plan
2009–2012
BMP = best management practices; CSO = combined sewer overflow; DNR = Washington State Department of Natural Resources; DO = dissolved oxygen; Ecology = Washington State Department of Ecology; EPA = U.S. Environmental Protection Agency; HPA = Hydraulic Permit Approval; m = meter; NPDES = National Pollutant Discharge Elimination System; ORP = oxygen reduction potential; PAR = photosynthetically active radiation; SAP = sampling and analysis plan; TOC = total organic carbon; TSS = total suspended solids.
a Intertidal zone is the area that is exposed to the air at low tide and submerged at high tide; subtidal zone is the area below the intertidal zone that is always covered by water. b Petite ponar is a type of grab sampler that can easily be carried by one person in the field and can be deployed without the use of a winch or crane recommended for larger samplers.

Appendix C. Water Quality Monitoring Results for 2008
2008 RWSP Annual Report C-11
Marine Water Monitoring Results This section presents key findings of monitoring of offshore, nearshore, and beach waters of Puget Sound in 2008. It also presents the objectives of a study of Quartermaster Harbor that will begin in 2009 and that was initiated based on results of routine monitoring.
Ambient and Outfall Locations in the Offshore and Nearshore Water Column
Figure C-1 shows both ambient and outfall water quality monitoring stations in Puget Sound. Ambient stations are monitored to gauge general environmental conditions; outfall monitoring stations are located near King County wastewater treatment plant and CSO outfalls. These 17 stations were the same stations that were sampled in 2007. They include 13 offshore stations (6 ambient and 7 outfall) that were sampled by boat and 4 nearshore stations that were sampled from docks. The four nearshore stations are the central Seattle waterfront near Pier 48, Shilshole Bay south of the marina, and two stations in Quartermaster Harbor near Vashon Island. Between one and seven samples are collected at each station; the total number of samples depends on the depth at the station.
This section describes the results of marine monitoring activities in 2008 in terms of fecal coliform bacteria levels and overall water quality rankings (water quality index). In addition, this section presents 2005–2008 data from the measurement of individual parameters—DO, chlorophyll-a, and ammonia. Although DO and ammonia values are included in the WQI calculation, these parameters are important indicators of water quality (along with the many other parameters measured), and it is useful to discuss them separately. Information on general patterns and cycles was taken from a report that King County published in April 2008 titled Water Quality Status Report for Marine Waters, 2005–2007. This report and past water quality reports provide a detailed discussion of all marine water quality monitoring results. They can be found at http://green.kingcounty.gov/marine/Reports.aspx.
Fecal Coliform Bacteria Levels of fecal coliform bacteria at 17 offshore and nearshore Puget Sound locations were measured monthly in 2008 to gauge the risk posed to human health from recreational uses of these waters. At outfall stations, fecal coliform samples were collected at the surface and at multiple additional depths. At ambient stations, fecal colifrom sample were collected only at the surface.
For marine surface waters, two fecal coliform standards are used: (1) a geometric mean standard of 14 colony-forming units (CFU) per 100 millileters (mL) and (2) a peak standard that specifies that no more than 10 percent of the samples used to calculate the geometric mean exceeds 43 CFU/100 mL.5 The peak standard is evaluated on an annual basis. If fecal coliform counts in two or more samples collected during 2008 were greater than 43 CFU/100 mL, then the station
5 A colony-forming unit (CFU) is a measure of viable bacterial numbers. Unlike in direct microscopic counts where all cells, dead and living, are counted, CFU measures only viable cells.

Appendix C. Water Quality Monitoring Results for 2008
failed the peak standard. For the geometric mean standard, the period of averaging should not exceed 12 months. Because samples were collected monthly, a total of 11 or 12 samples was used in 2008 to calculate the geometric mean. Two geometric means were evaluated for each station:
• An annual geometric mean was calculated using the monthly data collected from January through December 2008 at each station. This annual geometric mean provides a picture of the overall bacterial water quality for 2008.
• To take a closer look at bacterial water quality on a month-to-month basis, a “running” geometric mean was calculated for each station. The running geometric mean takes the bacteria data for each month, along with its previous 11 months of data, to calculate a monthly geometric mean.
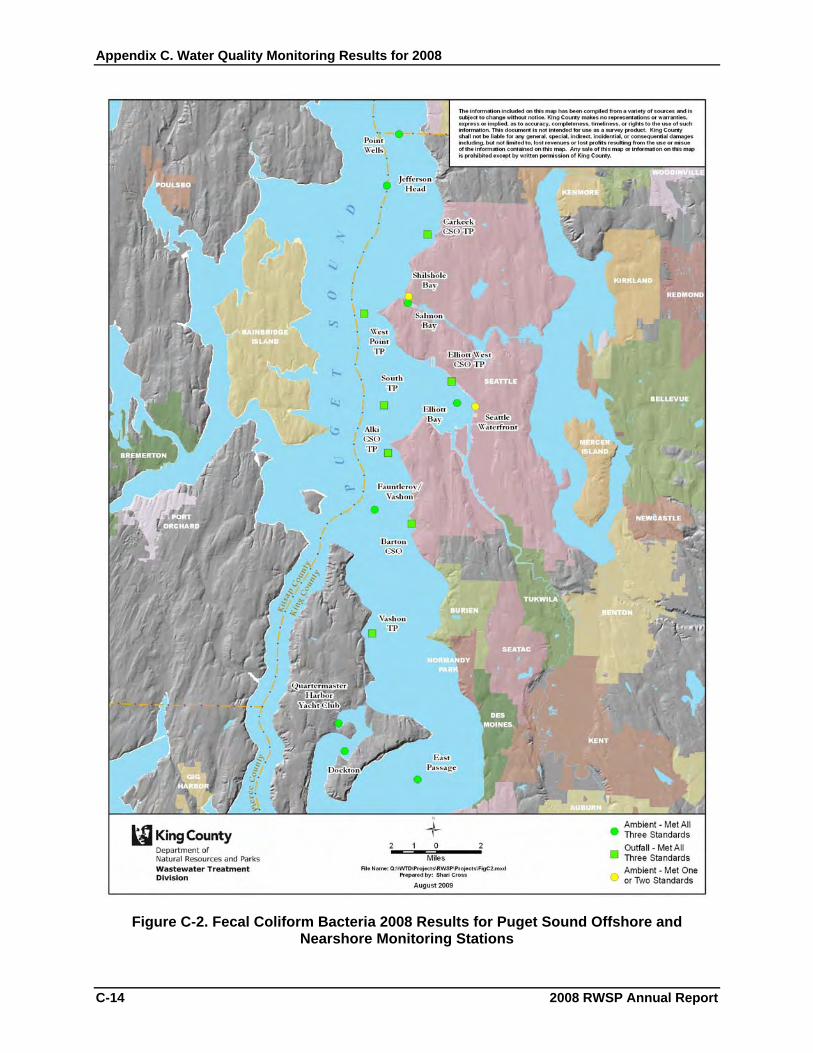
In 2008, all 13 offshore stations (6 ambient and 7 outfall) met the annual geometric mean standard, the monthly running geometric mean standard for all 12 months, and the peak fecal coliform standard for the surface samples (Figure C-2). The three standards were met at all additional sampling depths at each outfall station.
Results for the four nearshore stations were mixed (Figure C-2). The two nearshore stations in Quartermaster Harbor met all three standards. The nearshore station located at the mouth of the Lake Washington Ship Canal at Shilshole Bay met the annual geometric mean standard and the running monthly geometric mean standard for all 12 months. This station did not meet the peak standard, with fecal coliform counts exceeding 43 CFU/100 mL in 2 out of 12 samples collected in 2008. The nearshore station in Elliott Bay along the Seattle waterfront met the annual geometric standard for 2008. The Elliott Bay station did not meet the running geometric mean standard for the first nine months of 2008 but exhibited steady improvement until it met the standard for the last three months of the year. The station did not meet the annual peak standard; the standard was exceeded in 2 out of 12 samples collected. Both the Shilshole Bay and Elliott Bay stations, however, showed marked improvement in fecal coliform bacteria counts over the 2007 counts.
C-12 2008 RWSP Annual Report

Appendix C. Water Quality Monitoring Results for 2008
Figure C-1. 2008 Marine Ambient and Outfall Water Monitoring Locations
2008 RWSP Annual Report C-13
Appendix C. Water Quality Monitoring Results for 2008
Figure C-2. Fecal Coliform Bacteria 2008 Results for Puget Sound Offshore and Nearshore Monitoring Stations
C-14 2008 RWSP Annual Report
Appendix C. Water Quality Monitoring Results for 2008
Water Quality Index In 2008, King County monitored 14 sites, including 7 outfall sites, each month to assess overall quality of offshore marine water. To determine overall water quality, the county uses a modified version of the WQI developed by the Washington State Department of Ecology (Ecology). The determination is based on four indicators: DO, dissolved inorganic nitrate and nitrite (nitrate+nitrite), ammonia, and density stratification strength and persistence. Each monitoring site is categorized as low, moderate, or high concern based on the index.
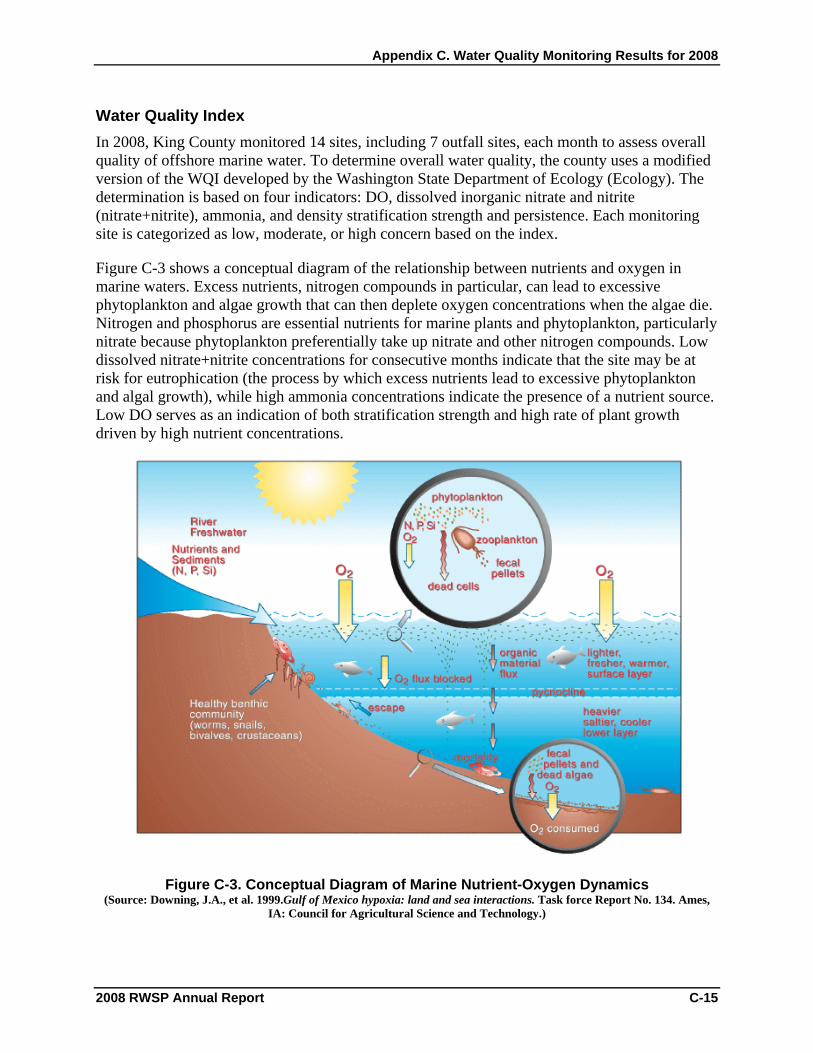
Figure C-3 shows a conceptual diagram of the relationship between nutrients and oxygen in marine waters. Excess nutrients, nitrogen compounds in particular, can lead to excessive phytoplankton and algae growth that can then deplete oxygen concentrations when the algae die. Nitrogen and phosphorus are essential nutrients for marine plants and phytoplankton, particularly nitrate because phytoplankton preferentially take up nitrate and other nitrogen compounds. Low dissolved nitrate+nitrite concentrations for consecutive months indicate that the site may be at risk for eutrophication (the process by which excess nutrients lead to excessive phytoplankton and algal growth), while high ammonia concentrations indicate the presence of a nutrient source. Low DO serves as an indication of both stratification strength and high rate of plant growth driven by high nutrient concentrations.
Figure C-3. Conceptual Diagram of Marine Nutrient-Oxygen Dynamics (Source: Downing, J.A., et al. 1999.Gulf of Mexico hypoxia: land and sea interactions. Task force Report No. 134. Ames,
IA: Council for Agricultural Science and Technology.)
2008 RWSP Annual Report C-15

Appendix C. Water Quality Monitoring Results for 2008
Water density is a function of both salinity and temperature. Density increases with higher salinity and/or lower temperatures. Density stratification is an important factor that may influence physical processes such as mixing and circulation that, in turn, affect biological and chemical processes such as oxygen gradients and phytoplankton blooms. Strong and persistent stratification indicates reduced mixing between surface and bottom waters, which can trap waters with low DO near the bottom where many invertebrates live.
Figure C-4 shows the number of sites with moderate or high concern rankings over the last several years. All 14 offshore sites were ranked as low concern based on their WQI determinations. Although some sites in the Central Basin of Puget Sound experienced moderate-infrequent stratification, low DO levels were not observed. The 2008 rankings are similar to the previous few years, with the exception of 2007.
The two sites located in Quartermaster Harbor were considered a high concern in 2007. This ranking was based on nitrate+nitrite concentrations that were below the detection limits for five consecutive months. This pattern was not seen in 2008. One of the two stations had low nitrate+nitrite values but only for three consecutive months. Also in 2007, water quality at one of the Elliott Bay sites was ranked as moderate concern. The ranking was based on strong-intermittent density stratification and DO values of less than 5.0 milligrams per liter (mg/L) for two consecutive months. Although the density stratification at both Elliott Bay sites was classified as strong-intermittent in 2008, low DO levels were not seen.
0
5
10
15
20
25
1999(n=8)
2000(n=9)
2001(n=10)
2002(n=10)
2003(n=11)
2004(n=11)
2005(n=11)
2006(n=12)
2007(n=14)
2008(n=14)
Perc
enta
ge
Figure C-4. Percentage of King County Offshore Stations with Moderate or High Concern
Rankings Based on the Water Quality Index, 1999–2008
Dissolved Oxygen Most marine organisms need sufficient oxygen levels for respiration and metabolic processes. The Washington State Surface Water Quality Standards for DO are 7.0 mg/L for a water body classified as “extraordinary” and 5.0 mg/L for a water body classified as “good.” Adverse effects
C-16 2008 RWSP Annual Report

Appendix C. Water Quality Monitoring Results for 2008
can occur when levels drop to 3.0 mg/L and below. Not only can low DO levels cause death to nonmotile organisms (organisms incapable of movement), the toxicity of various pollutants can be increased and immune suppression effects on fish can make them more susceptible to disease. Physical processes affecting DO distributions in Puget Sound include the input of fresh and ocean water, stratification intensity within the water column, circulation patterns and mixing regimes, and the exchange of oxygen across the air-sea interface. Biological activity, such as photosynthesis and respiration, also affect DO levels and its distribution within the water column.
Surface marine waters remain well oxygenated throughout the year. However, the water below the photic zone (the region through which light penetrates) is less oxygenated because of the consumption of oxygen by the remineralization of organic material descending through the water column from the photic layer. Low DO concentrations can occur when organic matter is decomposed in waters that do not mix to the surface where aeration with atmospheric oxygen can occur. Upwelled deep waters and deep waters with overlying high organic production can have naturally occurring low DO concentrations.
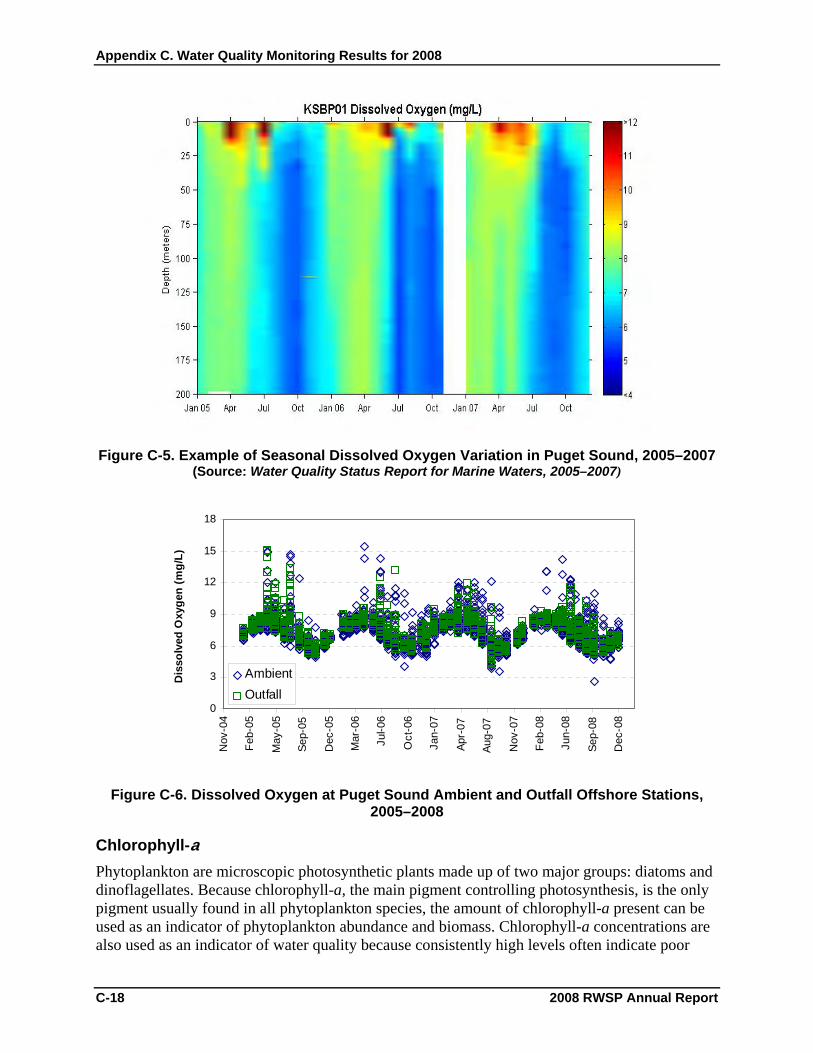
DO measurements taken throughout the water column from 2005 through 2008 at all ambient and outfall offshore sites ranged from 3.6 mg/L to 15.4 mg/L. The lowest values were found in 2007 at the two Quartermaster Harbor (ambient) locations. These low levels have prompted more intense study of Quartermaster Harbor (see description below). Low levels of DO in the harbor may be due in part to shallow depths and limited flushing and input of oxygenated water. Excluding Quartermaster Harbor, low DO levels were observed in the same four-year period at the other stations at depths below approximately 50 meters in late summer and fall. These low levels are a result of the seasonal influx of Pacific Ocean water, which has low ambient concentrations of DO. Increased water column density stratification in the spring and summer also contributes to low DO levels in the deeper layers because it impedes vertical mixing. Surface/subsurface DO maximums were seen in spring and summer in the upper 35 meters approximately. The maximums correspond temporally and spatially with maximums in chlorophyll-a concentration and may therefore be attributed to plant growth.
Figure C-5 shows 2005–2007 seasonal DO variations at a representative station located in Puget Sound near Point Jefferson on the Kitsap Peninsula. Patterns resulting from the input of low-oxygenated Pacific water and consumption of oxygen by bacterial respiration over the late summer-fall months are evident in the deep layers of the water column and are typical of the pattern seen at other locations. The production of oxygen by plants in the upper layers during late spring and summer is also discernable. As the density gradient breaks down in the fall and winter, the water column becomes well mixed with little variability in DO levels from surface to depth.
Figure C-6 shows the seasonal variation in DO concentrations from 2005–2008 at both ambient and outfall offshore stations at discrete depths. Little difference was observed between ambient and outfall stations, indicating that effluent from the outfalls is not affecting DO concentrations.
2008 RWSP Annual Report C-17
Appendix C. Water Quality Monitoring Results for 2008
Figure C-5. Example of Seasonal Dissolved Oxygen Variation in Puget Sound, 2005–2007 (Source: Water Quality Status Report for Marine Waters, 2005–2007)
0
3
6
9
12
15
18
Nov
-04
Feb-
05
May
-05
Sep-
05
Dec
-05
Mar
-06
Jul-0
6
Oct
-06
Jan-
07
Apr-
07
Aug-
07
Nov
-07
Feb-
08
Jun-
08
Sep-
08
Dec
-08
Dis
solv
ed O
xyge
n (m
g/L)
AmbientOutfall
Figure C-6. Dissolved Oxygen at Puget Sound Ambient and Outfall Offshore Stations, 2005–2008
Chlorophyll-a Phytoplankton are microscopic photosynthetic plants made up of two major groups: diatoms and dinoflagellates. Because chlorophyll-a, the main pigment controlling photosynthesis, is the only pigment usually found in all phytoplankton species, the amount of chlorophyll-a present can be used as an indicator of phytoplankton abundance and biomass. Chlorophyll-a concentrations are also used as an indicator of water quality because consistently high levels often indicate poor
C-18 2008 RWSP Annual Report
Appendix C. Water Quality Monitoring Results for 2008
water quality. Elevated chlorophyll-a levels routinely occur at various times of the year; however, it is the long-term persistence of these high levels that can lead to water quality problems.
Discrete samples for chlorophyll-a analysis are collected at depths between 1 and 35 meters. Not enough light penetrates below 35 meters to allow phytoplankton growth. In 2005–2008, chlorophyll-a values ranged from less than the detection limit to a high of 94.4 micrograms per liter (µg/L) in 2008. The highest value, and high values in general, were found at the two Quartermaster Harbor stations. The highest values are most frequently seen in April when large blooms (an accumulation of phytoplankton) are noted at most stations. These high chlorophyll levels coincide with high oxygen levels in the surface layer produced through photosynthetic activity.
The length of phytoplankton blooms can vary from a day to a month, depending on a variety of factors such as nutrient availability, amount of tidal exchange, and weather conditions. Strong winds and a large difference between the high and low tides tend to make blooms dissipate rapidly. Although chlorophyll-a samples are collected only monthly, 2005–2008 data indicate several spatial and temporal patterns. Phytoplankton blooms in the southern portion of the Central Basin occurred both earlier and later in the year than at other stations. Blooms in East Passage and Quartermaster Harbor occurred as early as March and as late as October. These blooms were not seen in other areas of the Sound during these times. The October 2006 and May 2008 blooms in Quartermaster Harbor were large, with a chlorophyll-a concentration of 43.5 µg/L at the inner harbor station and 94.4 µg/L at the outer harbor site. The May 2008 bloom was seen only in Quartermaster Harbor and was not observed at other sites in the Central Basin. There was no difference in the frequency of blooms between outfall and ambient stations.
Nitrogen, in the form of ammonia and nitrate+nitrite, was depleted in surface waters to levels below the detection limit because of phytoplankton uptake during the large blooms. For all stations, the maximum chlorophyll-a concentration was a few meters below the surface, generally between 4–6 meters depending on the station and weather conditions. Several factors can influence the depth where maximum chlorophyll-a concentrations are detected, including water column stratification and photoinhibition (reduction in a plant’s ability to photosynthesize from exposure to strong light).
Ammonia In marine waters, ammonia can be found at elevated concentrations as a byproduct of wastewater (discharged from municipal treatment plants and onsite septic treatment systems) and of agricultural and fertilization practices in urban areas. Elevated ammonia levels may also be seen following large phytoplankton blooms because ammonia is produced during the decay process.
In 2005–2008, the highest measured concentration in offshore waters was more than six times lower than the Washington State water quality ammonia standard. Most ammonia concentrations ranged from less than the detection limit of 0.010 mg/L to a maximum of 0.25 mg/L in 2005. The highest concentrations of ammonia generally occur in summer and autumn, and the lowest concentrations occur in winter. Ammonia concentrations in samples from both outfall and ambient offshore stations generally increased with depth, illustrating that uptake is primarily
2008 RWSP Annual Report C-19

Appendix C. Water Quality Monitoring Results for 2008
from phytoplankton in the photic zone and that lowered uptake and increased excretion by zooplankton are occurring below the photic zone.
Figure C-7shows 2005–2008 ammonia concentrations at all ambient and outfall offshore stations. Overall, there was little difference in average ammonia concentrations between ambient and outfall sites. The two Quartermaster Harbor stations had the highest average concentrations (0.042 and 0.033 mg/L) when compared to all other stations. The West Point Treatment Plant outfall had the third highest average value of 0.022 mg/L. If the Quartermaster Harbor stations are excluded from the overall average value of ambient stations, a slight difference is evident in average concentrations between ambient and outfall stations, with the outfall sites having a higher average.
0
0.05
0.1
0.15
0.2
0.25
Nov
-04
Feb-
05
May
-05
Sep-
05
Dec
-05
Mar
-06
Jul-0
6
Oct
-06
Jan-
07
Apr-
07
Aug-
07
Nov
-07
Feb-
08
Jun-
08
Sep-
08
Dec
-08
Am
mon
ia (m
g/L)
AmbientOutfall
Figure C-7. Ammonia Values at Puget Sound Ambient and Outfall Offshore Stations, 2005–2008
Ambient and Outfall Locations at Puget Sound Beaches
Fecal coliform bacteria levels at 25 Puget Sound beach stations were measured monthly in 2008 to assess the risks to human health from direct contact with marine waters during activities such as swimming, wading, scuba diving, and windsurfing. Sixteen stations are located in ambient areas, and nine stations are in the vicinity of King County treatment plant and CSO outfalls. Although all of the county’s treatment plant and CSO outfalls are located in offshore waters, beach areas that are inshore of the outfalls are considered outfall beach stations.
The same fecal coliform standards used to assess offshore and nearshore samples were applied to the samples collected at Puget Sound beach stations. The 2008 fecal coliform monitoring results for beach stations are shown in Figure C-8 and described below:
• Fourteen stations (3 outfall and 11 ambient) met the annual geometric mean standard, the running geometric mean standard for all 12 months, and the peak standard.
C-20 2008 RWSP Annual Report
Appendix C. Water Quality Monitoring Results for 2008
2008 RWSP Annual Report C-21
• Three stations—Golden Gardens (ambient), Alki Beach south of the lighthouse (outfall), and at Seahurst Park (ambient)—met both the annual geometric mean and peak standards but did not meet the running geometric standard for one or more months in 2008. In all three cases, the geometric mean value showed improvement over the course of the year.
• The station located on the south side of West Point (outfall) met both the annual geometric mean standard and the running geometric mean standard for all 12 months but did not meet the annual peak standard, with bacterial counts that exceeded 43 CFU/100 mL in 2 out of 12 samples.
• The station located inshore of the Magnolia CSO exceeded the peak standard in 3 out of 12 samples and exceeded the running geometric mean standard for several months but met the annual geometric mean standard by year end.
• The following six stations did not meet the annual geometric mean and peak standards, nor did they meet the monthly running geometric mean for several months in 2008:
⎯ Edwards Point in Snohomish County (ambient). An off-leash dog park is located near this station, which may contribute to elevated fecal coliform counts.
⎯ Carkeek Park at the mouth of Piper’s Creek (outfall). This station is located in the freshwater plume of Piper’s Creek as it enters Puget Sound downstream of the Carkeek CSO Treatment Plant. Another Piper’s Creek monitoring station, located upstream of the treatment plant, also exhibits constantly elevated fecal coliform bacteria counts. Past source tracing activities in this area indicate that the elevated fecal coliform counts in Piper’s Creek may be caused by raccoons and feral cats.
⎯ Richey Viewpoint near Alki (outfall). This station is located close to both the 63rd Street SW CSO outfall and a City of Seattle storm drain and may receive inputs of fecal coliform bacteria during rain events.
⎯ Fauntleroy Cove (outfall). This station is located near the Barton Street CSO and other inputs into Fauntleroy Cove, including Fauntleroy Creek and several City of Seattle storm drains, and may receive inputs of fecal coliform bacteria during rain events.
⎯ Normandy Park (ambient). Although this station is considered an ambient station, it is located near the outfall for the Miller Creek Treatment Plant, operated by the Southwest Suburban Sewer District. The station is also located near a natural creek that discharges across the beach.
⎯ Redondo Beach (ambient). This station has had ongoing elevated fecal coliform bacteria counts and has been monitored both by King County and the Washington State Department of Ecology BEACH program.6 Although this station is considered ambient, the outfall for the Lakehaven Utility District’s Redondo Treatment Plant is near this station and may contribute to the elevated bacterial counts. The outfall has recently been upgraded to discharge further offshore at a deeper depth.
6 BEACH = Beach Environmental Assessment, Communication and Health.

Appendix C. Water Quality Monitoring Results for 2008
Figure C-8. Fecal Coliform Bacteria 2008 Results for Puget Sound Beach Monitoring Stations
C-22 2008 RWSP Annual Report
Appendix C. Water Quality Monitoring Results for 2008
2008 RWSP Annual Report C-23
Quartermaster Harbor Study
In 2008, King County was awarded a West Coast Estuaries Initiative grant by Region 10 of the EPA to conduct the Quartermaster Harbor Nitrogen Management Study. The study is funded through 2012. Partners working with King County on the study include Ecology and the University of Washington-Tacoma.
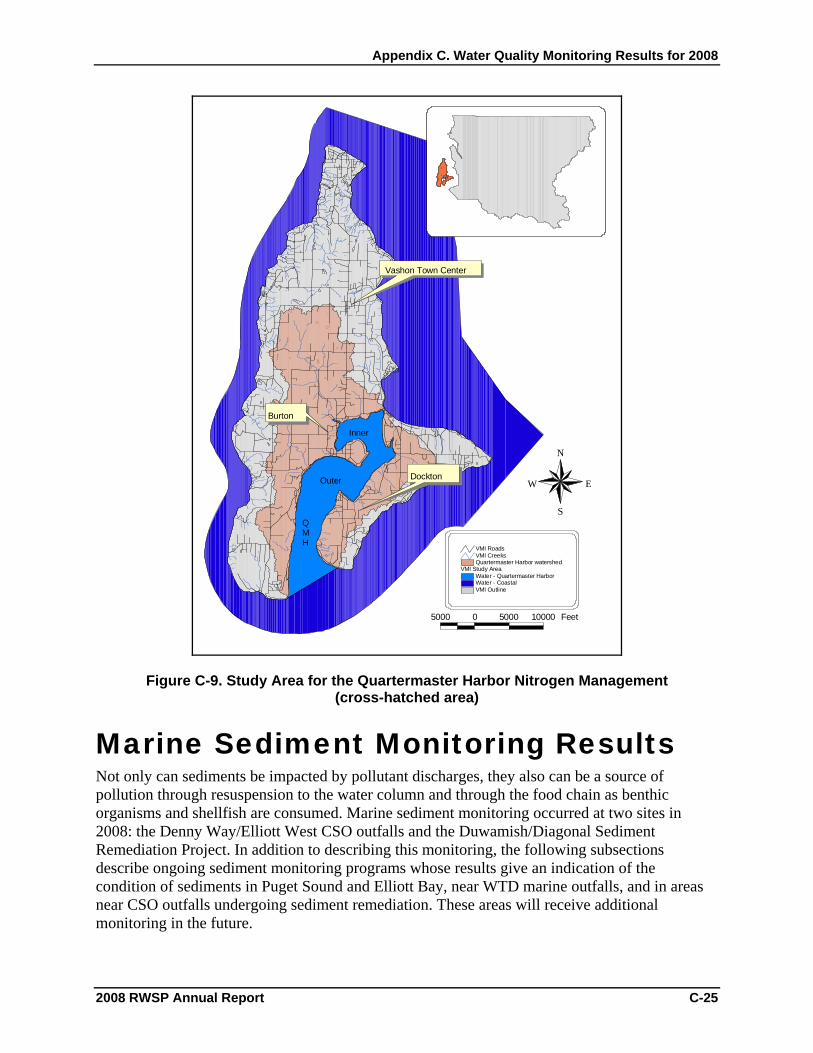
Quartermaster Harbor, located between Vashon and Maury Islands, is sheltered from wind and waves and receives runoff from about 40 percent of Vashon-Maury Island. Inner Quartermaster Harbor is especially sheltered. Judd Creek, located in the northwestern portion of the inner harbor, is the largest freshwater input. The harbor is a regionally significant natural resource area. Approximately 60 species of fish, 78 species of birds, several species of marine mammals, and a variety of marine invertebrates inhabit or use Quartermaster Harbor.
Near lethal DO levels have been observed in Quartermaster Harbor over the last three years of monthly monitoring. These low levels, combined with the high habitat value of Quartermaster Harbor, increased frequency of detections of nitrates in Vashon–Maury Island groundwater, and ongoing population growth, make this project a high priority for King County. The harbor is one of 19 areas of Puget Sound judged to be relatively sensitive to anthropogenic nutrient inputs.7
Quartermaster Harbor has many characteristics similar to Hood Canal, and is believed to be at risk of lethal low oxygen events such as those that have occurred in Hood Canal on multiple occasions this past decade. Eelgrass losses, fish kills, and harmful algal blooms have been attributed to eutrophication and lethal low oxygen events in Hood Canal. Evidence suggests that Quartermaster Harbor is a source of Alexandrium, a single-celled organism responsible for toxic algal blooms.8
Study objectives are as follows:
• To determine the relative nitrogen loadings by source type, including onsite septic systems, livestock (manure), fertilizer, alder forests, and other, and collect high frequency marine data using buoys.
• To identify Best Management Practices with assistance from regulatory and policy partners that address the land uses with the largest loadings as determined in this proposal.
• To model the effectiveness of nitrogen management on DO levels and to compare the level of effectiveness of different management options with conceptual cost estimates.
• To develop, in collaboration with residents and other agencies and departments, new policies for the 2012 King County Comprehensive Plan update related to nitrogen
7 Rensel Associates and PTI. 1991. Nutrients and phytoplankton in Puget Sound. Prepared for U.S. Environmental Protection Agency, Region 10, Seattle, WA. PTI Environmental Services, Bellevue, WA. 8 Greengrove, C.L., B. W. Frost, R.A. Horner, J.R. Postel, J.E. Gawel, K.S. Davies-Vollum, A. Cox, S. Hoffer, K. Sorensen, and J. Hubert. 2006. Survey of Alexandrium cysts in the surface sediments of Puget Sound, Washington. ASLO Summer Meeting in Victoria B.C.

Appendix C. Water Quality Monitoring Results for 2008
management on Vashon–Maury Island and to recommend management actions for implementing the new policies.
Funding for this study will support the continuation of the Vashon–Maury Island Water Resources Evaluation of surface stream and groundwater quantity and quality (http://www.kingcounty.gov/environment/waterandland/groundwater/management-areas/vashon-maury-island-gwma/vashon-island.aspx). In addition, the grant funding will support special studies of nitrogen sources to the harbor (including onsite septic systems), the development and application of watershed and marine receiving water models, and the continuation of ongoing monitoring activities conducted by the University of Washington-Tacoma (http://courses.washington.edu/uwtoce06/webg2/index2.html).
The study will depend in part on King County marine ambient monitoring work in Quartermaster Harbor. Three stations are visited monthly and two moorings record data every 15 minutes. One mooring is at Dockton and the other is at the harbor entrance. Mooring data are currently transmitted to an external Web site: http://www.ysieconet.com/public/WebUI/Default.aspx?hidCustomerID=165.
The study area is shown in Figure C-9. Because of the similarity of this study area to rural lands draining to Puget Sound, results and knowledge gained from the study may be transferable to a large part of Puget Sound.
C-24 2008 RWSP Annual Report
Appendix C. Water Quality Monitoring Results for 2008
Burton
Inner
Outer
QMH
Dockton
Vashon Town Center
VMI Outline
VMI Study AreaWater - Quartermaster HarborWater - Coastal
Quartermaster Harbor watershedVMI CreeksVMI Roads
5000 0 5000 10000 Feet
N
EW
S
Figure C-9. Study Area for the Quartermaster Harbor Nitrogen Management (cross-hatched area)
Marine Sediment Monitoring Results Not only can sediments be impacted by pollutant discharges, they also can be a source of pollution through resuspension to the water column and through the food chain as benthic organisms and shellfish are consumed. Marine sediment monitoring occurred at two sites in 2008: the Denny Way/Elliott West CSO outfalls and the Duwamish/Diagonal Sediment Remediation Project. In addition to describing this monitoring, the following subsections describe ongoing sediment monitoring programs whose results give an indication of the condition of sediments in Puget Sound and Elliott Bay, near WTD marine outfalls, and in areas near CSO outfalls undergoing sediment remediation. These areas will receive additional monitoring in the future.
2008 RWSP Annual Report C-25

Appendix C. Water Quality Monitoring Results for 2008
Ambient Locations in Puget Sound and Elliott Bay
For many years, King County collected sediment quality data from subtidal ambient monitoring stations in Elliott Bay and in the Central Basin of Puget Sound near Seattle. The program was temporarily discontinued after 2004 to enable staff scientists time to evaluate data generated from the program and from other data collection efforts in the region. Following the review, the county began an expanded subtidal sediment monitoring program in 2007 that focuses on sediment quality in Elliott Bay while also monitoring ambient sediment quality in the Central Basin of Puget Sound and in three embayments of interest—Quartermaster Harbor, Fauntleroy Cove, and outer Salmon Bay. Locations of sampling stations are shown in Figure C-10 (stations that are not in insets on the figure). The eight stations in Elliott Bay are sampled every two years; the six ambient stations are sampled every five years.
In 2007, King County collected subtidal sediment samples from all 14 locations, analyzed them for metals and organic chemicals, and compared concentrations to the published sediment quality chemical criteria of the Washington State Sediment Management Standards (SMS) and to region-wide Puget Sound sediment data. In general, the analysis found the sediment quality at areas sampled in Elliott Bay, Puget Sound, and three associated embayments to be of good quality with some evidence of minor impacts from human activities at three locations. Sediment samples will be collected from the eight Elliott Bay stations in June 2009 as part of the routine biennial sampling cycle. Sediment samples at the other six ambient monitoring locations in the Puget Sound Central Basin and three associated embayments will next be collected in June 2012.
Treatment Plant Outfalls
Sediment samples are usually collected in the vicinity of existing treatment plant marine outfalls once during each NPDES permit cycle (usually five years).
Near South Treatment Plant Outfall Sediment sampling was not required during the last NPDES permit cycle for the South Treatment Plant because samples from previous monitoring did not show evidence of contamination. A permit renewal application will be submitted and permit requirements will be negotiated in 2009.
Near the West Point Treatment Plant Outfall Surface sediment samples were collected in September 2006 for the West Point Treatment Plant. A final report was issued to Ecology in 2007. The next NPDES cycle will begin sometime in 2009.
Results of the 2006 sampling showed that all 19 stations passed Washington State SMS chemical criteria. Samples from three stations near the end of the diffuser failed one or more sediment bioassays, exceeding SMS biological criteria (West Point inset, Figure C-10). However, chemical concentrations at the three stations were well below SMS chemical criteria. The stations also support a robust, diverse benthic community that has been stable over the last three
C-26 2008 RWSP Annual Report

Appendix C. Water Quality Monitoring Results for 2008
2008 RWSP Annual Report C-27
monitoring events completed between 1998 and 2006.9 (One of the stations was resampled for benthic community analysis in 2007, and analysis was completed in 2008.) Benthic infaunal organisms are excellent biological integrators of chemical and physical sediment conditions and, as such, are considered a sensitive indicator of a healthy marine environment.10
Six stations were sampled and analyzed to classify sediment quality using the Puget Sound Sediment Quality Triad. To do this, samples for analysis of sediment chemistry, toxicity, and benthic community assemblages were collected at the same time. Sediments at four of the six stations were classified high quality. Two stations were classified as intermediate/high quality; these were two of the three stations whose bioassay results did not correlate with chemistry and benthic results.
Near the Future Brightwater Outfall In 2001, 2006, and 2007, King County collected preconstruction baseline sediment quality data at 10 stations in the vicinity of the planned diffuser for the Brightwater Treatment Plant marine outfall and at one nearby reference station (Brightwater inset, Figure C-10). In general, sediment quality was found to be good, with a stable benthic community typical of the type of sediment found at the site and little evidence of impacts from chemical compounds.
This three-year effort was determined sufficient to fully characterize baseline sediment quality prior to construction and operation of the Brightwater marine outfall. Sediment sampling will occur again in either October 2010 or October 2011, depending on the construction and testing schedule for the Brightwater System, to update the baseline just prior to outfall operation.
9 “Robust” means that it is a healthy and thriving benthic community that is able to stand up to the rigors of statistical analysis. 10 Benthic infauna live in soft substrate areas such as shallow mud flats and sand flats. They include worms, bivalves and crustaceans. All these species have burrowing mechanisms. Benthic communities provide a significant food source for many species of fish, other aquatic organisms, and wading birds.

Appendix C. Water Quality Monitoring Results for 2008
Figure C-10. Sediment Monitoring Stations in Elliott Bay and Central Basin of Puget Sound
C-28 2008 RWSP Annual Report

Appendix C. Water Quality Monitoring Results for 2008
Sediment Remediation Projects
Near the Denny Way/Elliott West CSO Outfalls Two new outfalls went online in 2005 as a part of the Mercer/Elliott West CSO control system. One outfall discharges primary-treated effluent from the new Elliott West CSO Treatment Facility; the other outfall discharges untreated CSO from the Denny Way Regulator Station and replaces the previous outfall that was closer to shore. The area inshore of the outfalls underwent remediation of historical sediment contamination from the former outfall before the site was controlled and from other unrelated inputs. Remediation was completed in early 2008. A 10-year monitoring program will track results of the remediation. King County and Ecology are monitoring three other subareas to see whether they will recover naturally or will require further remediation.
In April 2008, sediment samples were collected from 19 stations for chemical analysis. Thirteen stations are part of a long-term monitoring program. The other six stations were sampled to assess whether contaminated sediment had spread during remediation (Denny Way inset, Figure C-10). Eight of the long-term stations were also sampled for analysis of the benthic invertebrate community. Data are still undergoing analysis; early results indicate that the remedial activities did not appear to significantly impact sediment quality near the remediation area. Analysis of the long-term monitoring stations indicates that concentrations of one or more chemicals at 8 of the 13 stations sampled exceeded Washington SMS chemical criteria and that benthic assemblages in both the new and former CSO outfall locations show minor impacts from the new outfall operation.
Duwamish/Diagonal Sediment Remediation Project in the Duwamish Waterway King County conducted a sediment remediation project at the Duwamish/Diagonal CSO/Storm Drain (SD) between November 2003 and March 2004, as part of the Elliott Bay/Duwamish Restoration Program (EBDRP). The objective of the project was to remediate contaminated sediment within a 7-acre area immediately adjacent to the Duwamish/Diagonal CSO/SD and the old Diagonal Treatment Plant outfall. The project included removal of 3 to 5 feet of contaminated sediments from two areas (A and B) and placement of a capping layer. In 2005, King County placed a 4-acre thin-layer cap around one of the capped areas because of elevated concentrations of polychlorinated biphenyls (PCBs) measured in perimeter sediment samples.
The monitoring plan stipulates monitoring for a minimum of five years. In 2008, sediment samples were collected on March 24 and 25 from a total of 23 stations in four monitoring areas: the two initial capped areas (A and B), the thin-layer capped area, and perimeter stations. Preliminary analysis of the 2008 data indicates that there are no chemical exceedances of SMS in Area B. Butylbenzylphthalate, bis-2-ethylhexyl phthalate, dimethylphthalate, and phenol concentrations exceeded SMS in some samples in Area A, the thin-layer cap, and the perimeter. As in previous years, PCB concentrations exceeded SMS at some stations in the perimeter area but concentrations have been decreasing over time. Overall, contaminant concentrations in Areas A and B are below those measured before remediation and continue to decrease each year.
2008 RWSP Annual Report C-29

Appendix C. Water Quality Monitoring Results for 2008
C-30 2008 RWSP Annual Report
Harbor Island Superfund Project11 King County is working in partnership with the Port of Seattle and the City of Seattle on the Harbor Island Superfund project. The project area includes two county CSOs, one city CSO, and multiple storm drains that discharge to the East Waterway. A supplemental remedial investigation (SRI) is being conducted to evaluate the nature and extent of chemical contamination and risk to human health and the environment from contaminated sediments. A feasibility study (FS) is also being conducted that will present remedial alternatives to address risks found at the site. The draft SRI is expected to be completed in February 2011 and the draft FS in December 2011.
In 2008, the county partnered with the Port of Seattle on a sediment removal project off the Lander CSO/storm drain outfall and the port’s Terminal 30. This project is expected to be completed in 2009.
Other work in 2008 included planning and implementing source control activities, including business inspections and sampling, in order to supplement available chemistry data on CSOs. King County installed sediment traps and collected wet-weather wastewater samples from the Hanford No. 2 Regulator Station, collected solids samples during low flow from the Hanford No. 2 and Lander Street combined sewers, and collected wastewater samples for volatile organic compound analysis from the same sewers. In 2009, the effluent samples will be analyzed for PCBs, total organic carbon (TOC), semivolatile organic compounds (SVOCs), and metals. The solids samples are being analyzed for PCBs, total solids, TOC, SVOCs, and selected heavy metals. Results will indicate if additional source tracing is needed.
Also in 2008, the county collected samples of stormwater runoff to assess potential PCB concentrations in stormwater that enters the combined sewers from the south end of the old Rainier Brewery site that drains to the East Waterway.
Lower Duwamish Waterway Superfund Project In 2001, the EPA added about five miles of the Lower Duwamish Waterway (LDW) to its list of Superfund cleanup sites. Nine county CSOs are located in this stretch of the waterway. King County, the Port of Seattle, the City of Seattle, and Boeing became involved early in the process before the site was listed under Superfund and are participating in the preparation of a remedial investigation and feasibility study (RI/FS).
11 Superfund is the common name for the Comprehensive Environmental Response, Compensation and Liability Act (CERCLA). Enacted by Congress in 1980 and amended in 1986, this law provides broad federal authority to respond directly to releases or threatened releases of hazardous substances that may endanger public health or the environment.
Some Chemicals Defined… PCBs (polychlorinated biphenyls). Used in electrical equipment, paints, hydraulic fluids, plastics, dyes, and other products, before being banned in the U.S in 1977. Known to cause cancer in animals and produce health effects in humans.
PAHs (polycyclic aromatic hydrocarbons). Byproducts of combustion of coal, oil, gas, wood, garbage, and tobacco, and in charbroiled meat. May cause cancer, reproductive problems, birth defects, impaired immune function, and other health effects. (cPAHs are carcinogenic PAHs.)
Phthalates. Used in a variety of consumer products such as plastics, deodorant, nail polish, and perfume. Found to cause adverse health effects, including cancer, in laboratory animals.
Furans (and related dioxins). Byproducts of combustion, manufacture of herbicides, and bleaching of paper pulp. Found to cause adverse effects, including endocrine disruption, in laboratory animals. May cause cancer in humans.

Appendix C. Water Quality Monitoring Results for 2008
The four partners are providing data previously collected or are collecting new data for the effort. King County work in 2008 included source control sampling and analyses. Sampling of industrial sewer dischargers for phthalates was done to determine if there are controllable industrial sources of these chemicals. Analysis indicated that the average industrial wastewater concentration of phthalates was at approximately the same concentration found in domestic/commercial areas of King County’s wastewater system. In addition, sampling was conducted to evaluate the atmospheric deposition pathway to the LDW for phthalates, carcinogenic polycyclic aromatic hydrocarbons (PAHs), and PCBs. Analysis of the samples indicated that atmospheric deposition is a pathway that needs to be considered when evaluating sources of contamination to the LDW. The final reports for both sampling efforts were completed in 2008.
The following sections describe the progress made on the RI/FS.
Draft Remedial Investigation
Phase 1 of the RI examined existing data on the risks to human health and the environment from sediment-associated chemicals in the LDW. As a result of the Phase 1 study, EPA identified seven early action sites. Two of the seven early action sites were near the county’s Norfolk and Duwamish/Diagonal CSOs. Sediment near the Norfolk site had already been remediated in 1999; remediation of the Duwamish/Diagonal sediment was completed in 2004 (see above). Phase 2 of the RI filled identified data gaps and included additional modeling to complete the RI and support the FS. The draft RI was circulated for public review in November 2007 and is expected to be finalized in late 2009. Some key findings of the RI are as follows:
• The waterway contains a diverse assemblage of aquatic and wildlife species and a robust food web that includes top predators.
• Much of the sediment contamination resulted from historical releases that are now generally buried under cleaner more recently deposited sediment. Almost all new sediment that enters the waterway comes from the Green River.
• In general, high concentrations of chemicals, including PCBs, were detected in surface sediment in localized areas—frequently called “hot spots”—separated by larger areas of the LDW with lower concentrations. Relatively high surface sediment contamination is present in some areas as a result of a number of processes, including low net sedimentation rates in a few areas with primarily historical contamination or because of the presence of ongoing localized sources.
• The highest risks to people are associated with consumption of fish, crabs, and clams, with lower risks associated with activities that involve direct contact with sediment, such as clamming, beach play, and netfishing.
• Most of the human health risk is from PCBs, arsenic, carcinogenic PAHs (cPAHs), and dioxins and furans.
• Ecological risks to fish and wildlife were relatively low, with the exception of risks to river otter from PCBs.
• Sediment contamination in approximately 75 percent of the LDW is estimated to have no effect on the benthic invertebrate community; approximately 7 percent of the surface
2008 RWSP Annual Report C-31
Appendix C. Water Quality Monitoring Results for 2008
C-32 2008 RWSP Annual Report
sediment has chemical concentrations exceeding the higher of the two state standards associated with potential adverse effects to the benthic invertebrate community. The potential for effects in the remaining 18 percent of the LDW is more uncertain. Most of the state sediment standard exceedances were for PCBs and phthalates, although 41 different chemicals had at least one exceedance.
The draft RI included two recommendations in its key findings:
• The control of local sources of toxics is critical to the long-term success of specific remedial actions in the LDW.
• Continued coordination of cleanup actions and source control will be necessary to ensure that any actions taken are not unduly impacted by local sources.
Draft Feasibility Study The draft FS presents cleanup objectives and alternatives to address sediment contamination in the LDW. The cleanup objectives are as follows:
• Reduce human health risks associated with the consumption of resident LDW seafood by reducing surface sediment concentrations of chemicals of concern (COCs) to protective levels.12
• Reduce human health risks associated with exposure to COCs through direct contact with sediments and incidental sediment ingestion by reducing surface sediment concentrations of COCs to protective levels.
• Reduce risks to benthic invertebrates by reducing surface sediment concentrations of COCs to comply with the Washington State Sediment Management Standards.
• Reduce risks to crabs, fish, birds, and mammals from exposure to COCs in surface sediment by reducing surface sediment concentrations of COCs to protective levels.
Cleanup alternatives are shown in Figure C-11, which appears as Figure ES-4 in the executive summary of the draft FS. The alternatives move from the least-cost No Further Action Alternative through four other alternatives with increasing levels of action and costs.
The draft FS makes three recommendations:
• Identify an approach for cleanup of the most contaminated areas first (a “worst first” approach). Cleaning up the most contaminated areas achieves the greatest reduction in risk, while ongoing natural recovery processes are expected to concurrently reduce risk in less contaminated areas and LDW-wide.
• Collect monitoring information during and after cleanup to guide the reevaluation of the effectiveness of the selected remedial alternative.
• Continue active cleanup as needed to produce significant results within a reasonable timeframe.
12 “Protective” means protective of human health and the environment.

Appendix C. Water Quality Monitoring Results for 2008
The draft FS will be available for public comment in April 2009 (http://www.ldwg.org/index.htm). The agencies will issue a final FS in 2010 and a proposed cleanup plan in 2011.
Figure C-11. Alternatives for Cleanup of Contaminated Sediments in the Lower Duwamish Waterway
(Source: Draft Feasibility Study, Lower Duwamish Waterway, Lower Duwamish Waterway Group, 2009)
2008 RWSP Annual Report C-33

Appendix C. Water Quality Monitoring Results for 2008
Major Lakes Water Monitoring Results This section describes the results of fecal coliform bacteria sampling at ambient and swimming beach locations in the major lakes of King County. It also describes overall water quality in these lakes based on calculation of their trophic state index.
Ambient Mid-Lake (Open Water) and Nearshore
Figure C-12 shows the location of the 25 ambient sampling locations in Lakes Washington, Sammamish, and Union and in the Lake Washington Ship Canal.
Figure C-12. Ambient Monitoring Locations in Lakes Washington, Sammamish, and Union (including the Lake Washington Ship Canal)
C-34 2008 RWSP Annual Report
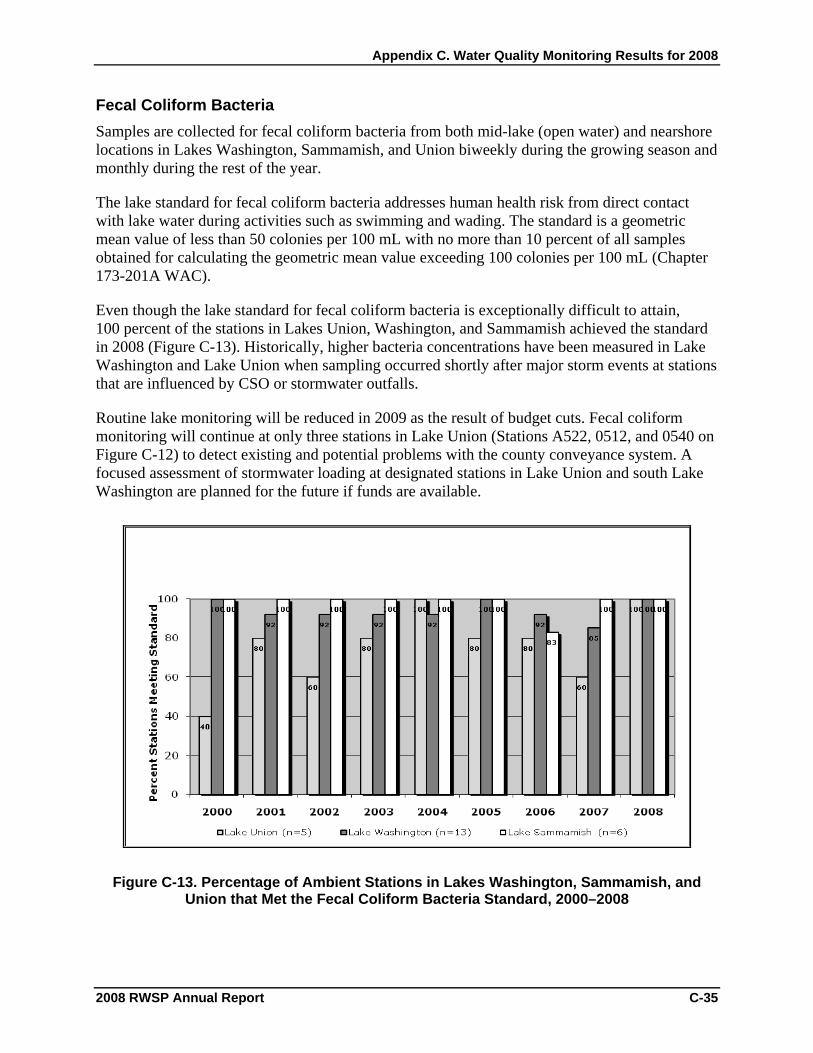
Appendix C. Water Quality Monitoring Results for 2008
Fecal Coliform Bacteria Samples are collected for fecal coliform bacteria from both mid-lake (open water) and nearshore locations in Lakes Washington, Sammamish, and Union biweekly during the growing season and monthly during the rest of the year.
The lake standard for fecal coliform bacteria addresses human health risk from direct contact with lake water during activities such as swimming and wading. The standard is a geometric mean value of less than 50 colonies per 100 mL with no more than 10 percent of all samples obtained for calculating the geometric mean value exceeding 100 colonies per 100 mL (Chapter 173-201A WAC).
Even though the lake standard for fecal coliform bacteria is exceptionally difficult to attain, 100 percent of the stations in Lakes Union, Washington, and Sammamish achieved the standard in 2008 (Figure C-13). Historically, higher bacteria concentrations have been measured in Lake Washington and Lake Union when sampling occurred shortly after major storm events at stations that are influenced by CSO or stormwater outfalls.
Routine lake monitoring will be reduced in 2009 as the result of budget cuts. Fecal coliform monitoring will continue at only three stations in Lake Union (Stations A522, 0512, and 0540 on Figure C-12) to detect existing and potential problems with the county conveyance system. A focused assessment of stormwater loading at designated stations in Lake Union and south Lake Washington are planned for the future if funds are available.
Figure C-13. Percentage of Ambient Stations in Lakes Washington, Sammamish, and Union that Met the Fecal Coliform Bacteria Standard, 2000–2008
2008 RWSP Annual Report C-35
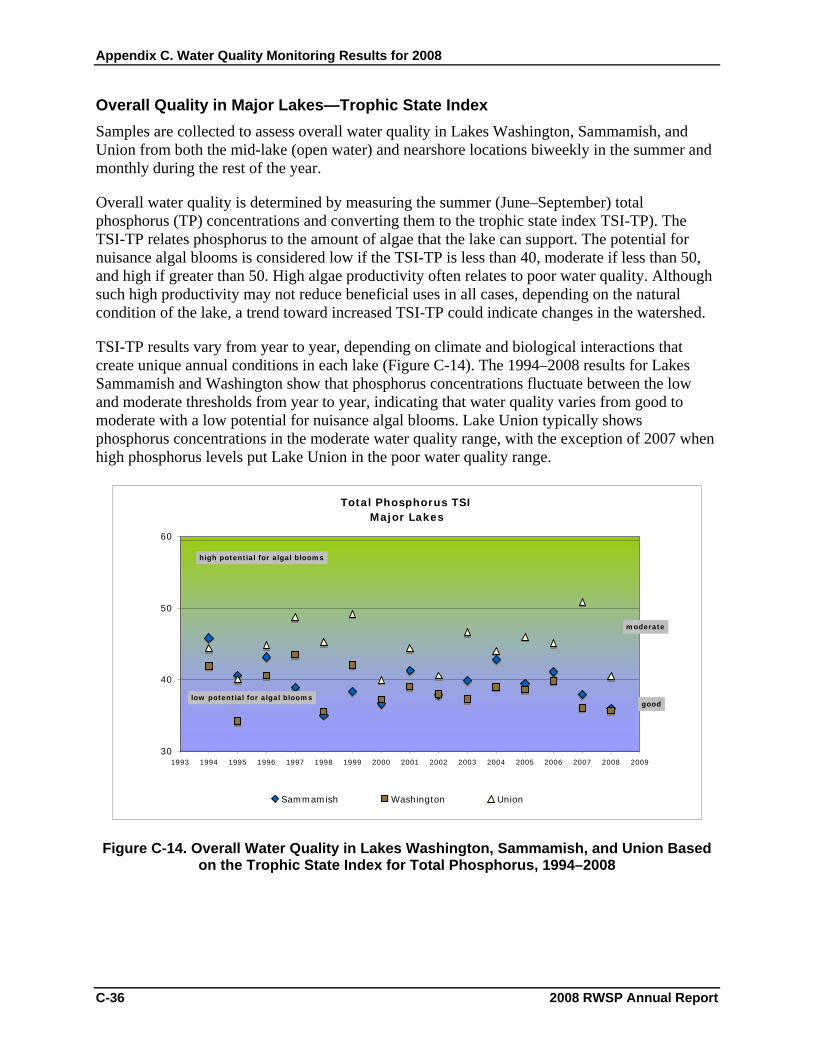
Appendix C. Water Quality Monitoring Results for 2008
Overall Quality in Major Lakes—Trophic State Index Samples are collected to assess overall water quality in Lakes Washington, Sammamish, and Union from both the mid-lake (open water) and nearshore locations biweekly in the summer and monthly during the rest of the year.
Overall water quality is determined by measuring the summer (June–September) total phosphorus (TP) concentrations and converting them to the trophic state index TSI-TP). The TSI-TP relates phosphorus to the amount of algae that the lake can support. The potential for nuisance algal blooms is considered low if the TSI-TP is less than 40, moderate if less than 50, and high if greater than 50. High algae productivity often relates to poor water quality. Although such high productivity may not reduce beneficial uses in all cases, depending on the natural condition of the lake, a trend toward increased TSI-TP could indicate changes in the watershed.
TSI-TP results vary from year to year, depending on climate and biological interactions that create unique annual conditions in each lake (Figure C-14). The 1994–2008 results for Lakes Sammamish and Washington show that phosphorus concentrations fluctuate between the low and moderate thresholds from year to year, indicating that water quality varies from good to moderate with a low potential for nuisance algal blooms. Lake Union typically shows phosphorus concentrations in the moderate water quality range, with the exception of 2007 when high phosphorus levels put Lake Union in the poor water quality range.
Total Phosphorus TSI Major Lakes
30
40
50
60
1993 1994 1995 1996 1997 1998 1999 2000 2001 2002 2003 2004 2005 2006 2007 2008 2009
Sammamish Washington Union
good
moderate
high potential for algal blooms
low potential for algal blooms
Figure C-14. Overall Water Quality in Lakes Washington, Sammamish, and Union Based on the Trophic State Index for Total Phosphorus, 1994–2008
C-36 2008 RWSP Annual Report
Appendix C. Water Quality Monitoring Results for 2008
2008 RWSP Annual Report C-37
Water Temperature—Effects of Climate Change Global climate change is having an impact on our local weather patterns and subsequently on county aquatic resources. On average, ambient air temperatures in the Pacific Northwest have increased over the twentieth century by roughly 1.5ºF.13 Air temperatures in the region are expected to continue to increase by another 2ºF to 9ºF over the next 80 years.
Lake temperatures vary annually, depending on seasonal weather conditions (wind, precipitation, cloudiness, and ambient air temperatures). Warmer air temperatures have reduced the snow pack levels in Washington and, thus, the timing and quantity of flows in regional rivers and streams. Higher air temperatures and changes in wind patterns also increase lake temperatures through surface heat exchange processes.
The University of Washington has routinely measured temperatures in Lake Washington since 1957. King County (then Metro) began monitoring temperatures in Lakes Washington, Sammamish, and Union in 1979. Additional Lake Washington data were collected in 1913, 1933, and 1950–1952. Water temperatures are taken during January because the lakes are well mixed during this month and temperatures at the surface reflect the temperatures throughout the water column water. Temperatures are measured at a 1-meter depth from the mid-lake monitoring stations.
Overall, winter water temperatures have increased about 0.25oC (0.45oF) per decade since 1960 in Lake Washington and about 1oC (1.8oF) per decade since 1979 in Lakes Sammamish and Union (Figure C-15). The smaller increase in Lake Washington is likely due to its larger volume, which is roughly 8 times greater than Lake Sammamish and 118 times greater than Lake Union.
13 For more information on climate in the Pacific Northwest, see the University of Washington’s Climate Impacts Group Web site at http://www.cses.washington.edu/cig/pnwc/pnwc.shtml.

Appendix C. Water Quality Monitoring Results for 2008
January Water Temperatures Lakes Washington, Sammamish, and Union
(1 meter depth)
y = 5E-05x + 5.957R2 = 0.1092
y = 0.0002x + 0.5587R2 = 0.2288
y = 0.0002x - 0.3371R2 = 0.3556
y = 8E-05x + 5.0434R2 = 0.1175
y = 4E-05x + 6.3156R2 = 0.1093
4.0
5.0
6.0
7.0
8.0
9.0
10.0Ja
n-31
Jan-
34
Jan-
37
Jan-
40
Jan-
43
Jan-
46
Jan-
49
Jan-
52
Jan-
55
Jan-
58
Jan-
61
Jan-
64
Jan-
67
Jan-
70
Jan-
73
Jan-
76
Jan-
79
Jan-
82
Jan-
85
Jan-
88
Jan-
91
Jan-
94
Jan-
97
Jan-
00
Jan-
03
Jan-
06
Jan-
09
tem
pera
ture
(o C)
Lake Washington Lake Union Lake SammamishLk Washington 1960-2008 Lake Union 1980-2008 Lk Sammamish 1980-2008Lake Washington 1979-2008 Lk Washington 1933-2008
Figure C-15. January Water Temperatures in Lakes Washington, Sammamish, and Union, 1933-2008
Swimming Beaches
Fecal coliform bacteria can enter lakes from untreated wastewater effluent, household or farm animals, wildlife, stormwater runoff, wastewater overflows, or failing septic systems. The most affected beaches are adjacent to streams that drain urbanized drainage basins. Samples are collected for fecal coliform bacteria each week between Memorial Day and the end of September at 17 swimming beaches in Lake Washington, Lake Sammamish, and Green Lake (Figure C-16).
King County’s standard for acceptable fecal coliform bacteria levels in swimming beaches is that none of the testing sites violates both parts of the Washington State Department of Health’s fecal coliform bacteria target, which is the geometric mean of 200 colonies per 100 mL with no single sample exceeding 1,000 colonies per 100 mL. Public Health–Seattle & King County and the Washington State Department of Health currently use this standard, which is called the Ten State Standard.
In 2008, 100 percent of samples collected from Green Lake and Lake Sammamish met both parts of the fecal coliform bacteria standard (Figure C-17and Figure C-18). This is the sixth year in a row that all Green Lake samples have met the standard. Lake Sammamish results vary slightly from year to year in the same six years, showing percentages somewhere between the low 90s and 100. For Lake Washington, 94 percent of the samples, compared to 91 percent in 2007, met
C-38 2008 RWSP Annual Report

Appendix C. Water Quality Monitoring Results for 2008
the standard (Figure C-19). High bacterial counts were measured at five beaches monitored in Lake Washington: Juanita, Magnuson off-leash area, Gene Coulon, Matthews, and Luther Burbank. The high counts resulted in one swimming beach closure (Juanita) compared to four closures in 2007 (Juanita, Magnuson Off-Leash area, Gene Coulon, and Meydenbauer Bay). An intensive bacteria monitoring survey took place in the Juanita Creek basin in 2008 as a joint effort between King County, the City of Kirkland, and Ecology. Results of the survey will be published in 2009.
2008 RWSP Annual Report C-39
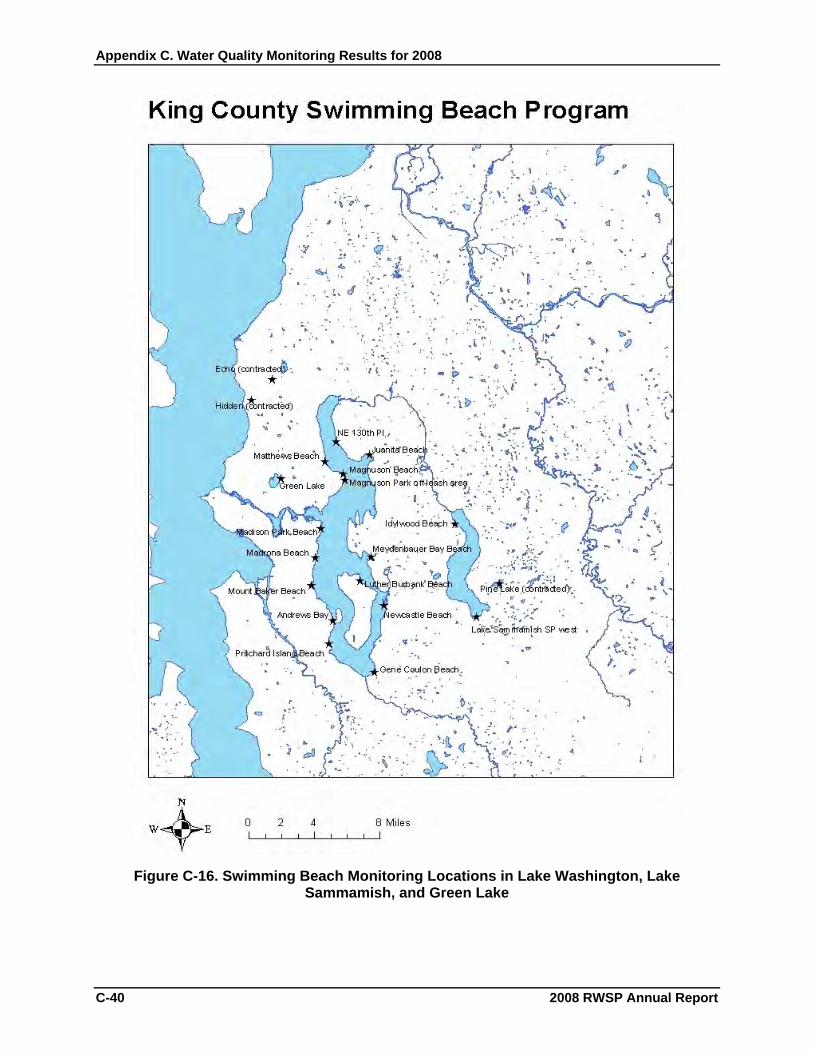
Appendix C. Water Quality Monitoring Results for 2008
Figure C-16. Swimming Beach Monitoring Locations in Lake Washington, Lake Sammamish, and Green Lake
C-40 2008 RWSP Annual Report

Appendix C. Water Quality Monitoring Results for 2008
Figure C-17. Percentage of Samples that Met the Fecal Coliform Bacteria Standard at Green Lake Swimming Beaches, 1996–2008
Average Percent of Swimming Beach Samples That Met Both Parts of Fecal Coliform Bacteria Standard
0
0.1
0.2
0.3
0.4
0.5
0.6
0.7
0.8
0.9
1
1996 1997 1998 1999 2000 2001 2002 2003 2004 2005 2006 2007 2008
Sammamish (2 beaches)
Figure C-18. Percentage of Samples that Met the Fecal Coliform Bacteria Standard at Lake Sammamish Swimming Beaches, 1996–2008
2008 RWSP Annual Report C-41

Appendix C. Water Quality Monitoring Results for 2008
Figure C-19. Percentage of Samples that Met the Fecal Coliform Bacteria Standard at Lake Washington Swimming Beaches, 1996–2008
Major Lakes Sediment Monitoring Results Sediment quality, along with indicators of water quality, habitat, and the aquatic food web (plankton, invertebrates, and fish), can present a picture of environmental health. Chemical contaminants that are washed into streams and lakes from urban areas can attach to sediments, settle to the bottom, and act as a record of both historical and recent discharge of contaminants into surface waters.
A 10-year lake sediment monitoring program began in 2007. The program incorporates a stratified sampling strategy. The strata include deep water stations, swimming beaches, nearshore habitat, and areas that previous studies have shown to be contaminated. A total of 20 sediment samples are collected each year: five samples for long-term trend monitoring from ambient stations in the deep main basins of Lakes Washington, Sammamish, and Union (Figure C-20) and fifteen one-time samples from the following locations:
• In the wading zone at public swimming beaches to better understand the public’s exposure to sediment contaminants at swimming beaches
• In shallow non-developed shoreline areas to determine if contaminant levels are a concern in the nearshore terrestrial/aquatic habitat
• In areas where previous studies found contaminant levels above sediment quality guidelines. Sampling grids will be used to determine the spatial extent of contamination.
C-42 2008 RWSP Annual Report
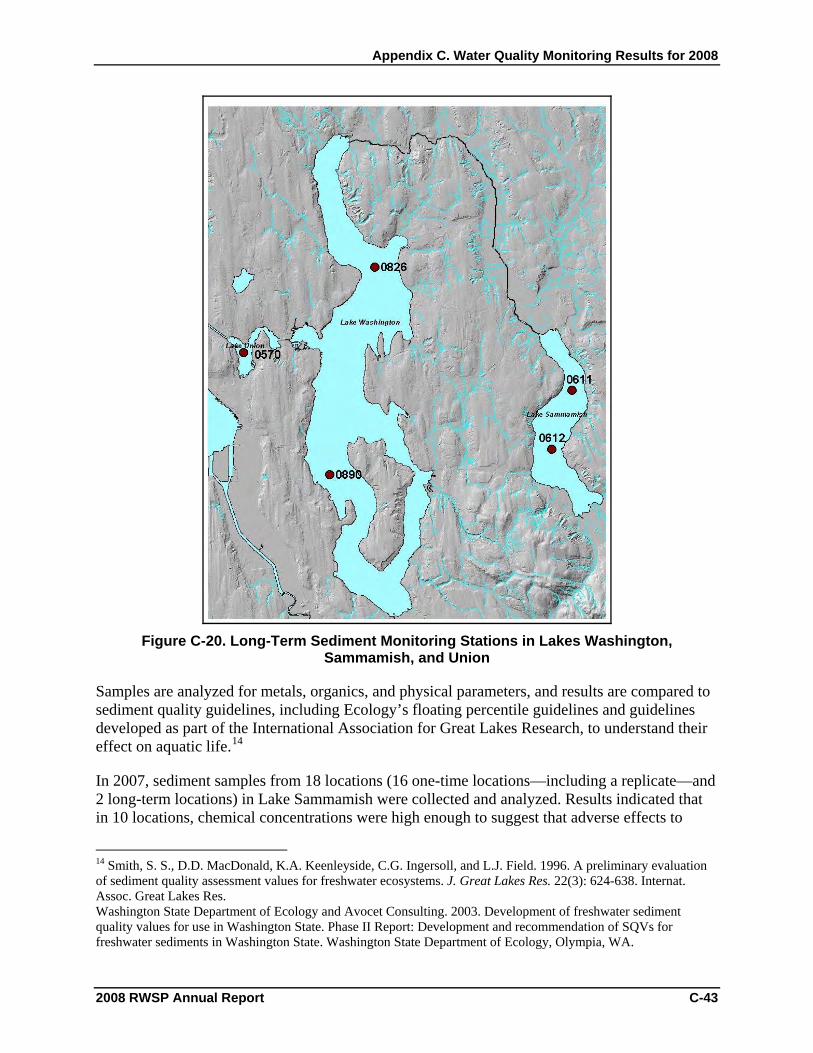
Appendix C. Water Quality Monitoring Results for 2008
2008 RWSP Annual Report C-43
Figure C-20. Long-Term Sediment Monitoring Stations in Lakes Washington,
Sammamish, and Union
Samples are analyzed for metals, organics, and physical parameters, and results are compared to sediment quality guidelines, including Ecology’s floating percentile guidelines and guidelines developed as part of the International Association for Great Lakes Research, to understand their effect on aquatic life.14
In 2007, sediment samples from 18 locations (16 one-time locations—including a replicate—and 2 long-term locations) in Lake Sammamish were collected and analyzed. Results indicated that in 10 locations, chemical concentrations were high enough to suggest that adverse effects to
14 Smith, S. S., D.D. MacDonald, K.A. Keenleyside, C.G. Ingersoll, and L.J. Field. 1996. A preliminary evaluation of sediment quality assessment values for freshwater ecosystems. J. Great Lakes Res. 22(3): 624-638. Internat. Assoc. Great Lakes Res. Washington State Department of Ecology and Avocet Consulting. 2003. Development of freshwater sediment quality values for use in Washington State. Phase II Report: Development and recommendation of SQVs for freshwater sediments in Washington State. Washington State Department of Ecology, Olympia, WA.

Appendix C. Water Quality Monitoring Results for 2008
C-44 2008 RWSP Annual Report
aquatic organisms are likely. Concentrations in four locations were at a level where effects are uncertain, and concentrations in the last four locations suggest that effects are unlikely. Additionally, polybrominated diphenyl ethers (PBDEs) were detected in several locations associated with storm drains. The locations and concentrations of these chemicals suggest that further study is needed to determine their sources and their effects on the aquatic community present in these lake sediments.
In 2008, sediment samples were collected from 17 locations in Lake Washington. Data are not yet available on the 2008 sampling.
Stream and River Water Monitoring Results This section describes the quality of water in King County streams and rivers in terms of overall water quality (water quality index) and normative streamflows.
Overall River and Stream Water Quality—Water Quality Index
Fifty-six sites along rivers and streams in WRIAs 8 and 9 (Cedar-Sammamish and Green-Duwamish watersheds) have been sampled monthly, some for over 30 years.15 Numerous water quality parameters are monitored, including those used to determine the WQI. Samples are collected monthly under base flow conditions and four times each year at the mouth of streams under storm conditions. Figure C-21 shows the locations of these sites and of seven sites on Vashon–Maury Island that were sampled in 2008 and included in the calculation of the WQI.
The WQI for rivers and streams integrates a series of key water quality indicators into a single number that can be used for comparison over time and among locations. The WQI is based on a version proposed by Ecology and originally derived from the Oregon water quality index. It is a number ranging from 1 to 100—the higher the number, the better the water quality. For temperature, pH, fecal coliform bacteria, and DO, the index expresses results relative to state standards required to maintain beneficial uses. For nutrient and sediment measures, where the state standards are not specific, results are expressed relative to expected conditions in a given eco-region. Multiple constituents are combined, results are aggregated over time to produce a single score, and a rating of low, moderate, or high concern is assigned for each sampling station.
15 The number of sites included in the routine monitoring will be reduced to 20 starting in 2009 because of budget cuts.

Appendix C. Water Quality Monitoring Results for 2008
Figure C-21. Monitoring Locations in Rivers and Streams in 2008
Overall water quality in King County streams varies between and within streams, reflecting the effects of a population of almost two million residents and intense urbanization. Increased development and greater volumes of stormwater runoff have impacted and continue to impact the water quality of rivers and streams in the county. During the 2007–2008 water year (October
2008 RWSP Annual Report C-45
Appendix C. Water Quality Monitoring Results for 2008
1 through September 30), cumulative rainfall was below average compared to historical values, even with an exceptionally wet December. As a result, WQI scores were better than in previous years. In contrast, cumulative rainfall in the 2006–2007 water year was well above historical averages and the year showed the highest percentages of “high concern” ratings in the period from 2000 through 2008.
In the 2007–2008 water year, 57 percent (36 sites) of the 63 sampling sites were rated of moderate concern and 24 percent (15 sites) were of high concern (low water quality) (Figure C-22). Of the 23 sites in WRIA 9, 8 sites were rated of low concern, 13 sites were of moderate concern, and 2 sites were of high concern (Figure C-23). Of the 40 sites in WRIA 8, 4 sites were rated of low concern, 23 sites were of moderate concern, and 13 sites were of high concern (Figure C-24).
On occasion, extreme storms occur during routine sampling events. WQI ratings are calculated with these dates excluded to allow for year-to-year comparisons of routine events. Figure C-22 shows the percentages both with and without the extreme storm events that occurred during sampling in the 2000–2001 and 2006-2007 water years to illustrate the impact of these events.
All samples that were rated of high concern in 2008 were affected in part by excessive nitrogen and/or phosphorous. In addition, almost all high-concern sites were affected by low DO (73 percent), high fecal coliform bacteria (67 percent), high temperatures (33 percent), and high-suspended solids/turbidity (13 percent).
Stormwater, waterfowl wastes, and pet wastes are the most likely sources of bacteria in urban streams. Poor livestock manure management and failing septic systems can be a potential source of bacteria in agricultural and suburban areas. In wetlands, wildlife excrement and stagnant water conditions can lead to elevated bacteria counts. High phosphorus concentrations are found in fecal material, and elevated concentrations of phosphorus are often linked to similar sources as bacteria. Elevated phosphorus concentrations are also linked to areas undergoing development. Low DO concentrations can be associated with low flows, wetlands, high temperatures (colder water holds more oxygen), and high levels of organic matter (bacteria use oxygen in the process of decomposing).
C-46 2008 RWSP Annual Report

Appendix C. Water Quality Monitoring Results for 2008
Percent King County Stream Stations in WRIA 8 & 9 with Moderate or High WQI Ratings
42%
65%
46% 41%50% 54% 54%
33% 37%
57%
47%
24%
43%45%
38% 36% 38%
57% 52%24%
0%
20%
40%
60%
80%
100%20
00-0
1
2000
-01
(exc
ludi
ngO
ct w
et
2001
-02
2002
-03
2003
-04
2004
-05
2005
-06
2006
-07
2006
-07
(exc
ludl
ing
Dec
wet
2007
-08
high concern
moderate concern
Figure C-22. Percentage of Streams in WRIAs 8 and 9 with High or Moderate Concerns Based on Water Quality Index, 2000–2008
2008 RWSP Annual Report C-47

Appendix C. Water Quality Monitoring Results for 2008
0 40 80
Tahlequah - VA37A
Springbrook - 0317
Soos (Covington) - C320
Soos (above hatchery) - A320
Shinglemill - VA12A
Newaukum - 0322
Mill (Hill) - A315
Mileta - VA45A
Longfellow (upstream at Brandon St) - J370
Longfellow (footbridge on Yancy) - C370
Little Soos - G320
Judd - VA42A
Jenkins - D320
Green R (at Allentown) - 0309
Green (upstream Soos confluence) - A319
Green (upstream Newaukum confluence) -B319
Green (Renton Junction) - 0311
Green (Fort Dent Park) - 3106
Gorsuch - VA65A
Fisher - VA41A
Crisp (upstream) - F321
Crisp (mouth) - 0321
Christensen - VA41A
Increasing Water Quality ==> < 40 high concern, 40-80 moderate, > 80 low concern
WRIA 9 Rivers & StreamsWater Quality Index 2007-08
Figure C-23. Water Quality Index Rankings for Rivers and Streams in WRIA 9, 2007–2008
C-48 2008 RWSP Annual Report
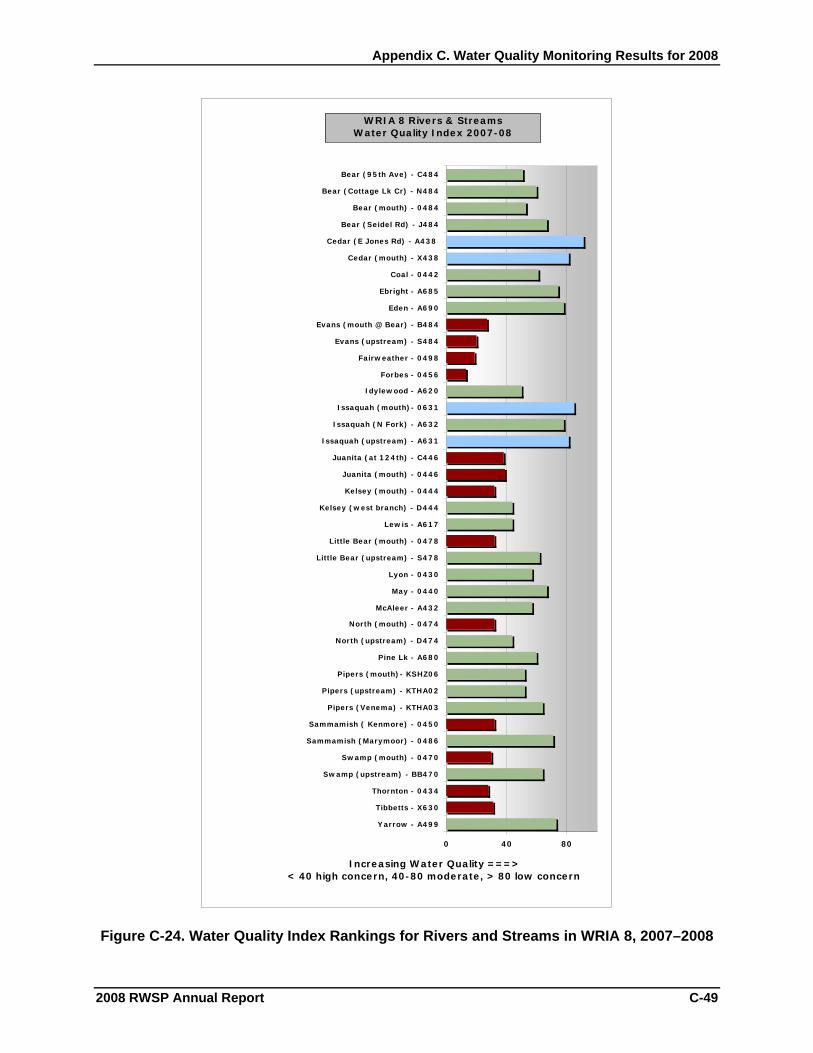
Appendix C. Water Quality Monitoring Results for 2008
0 40 80
Yarrow - A499
Tibbetts - X630
Thornton - 0434
Swamp (upstream) - BB470
Swamp (mouth) - 0470
Sammamish (Marymoor) - 0486
Sammamish ( Kenmore) - 0450
Pipers (Venema) - KTHA03
Pipers (upstream) - KTHA02
Pipers (mouth)- KSHZ06
Pine Lk - A680
North (upstream) - D474
North (mouth) - 0474
McAleer - A432
May - 0440
Lyon - 0430
Little Bear (upstream) - S478
Little Bear (mouth) - 0478
Lewis - A617
Kelsey (west branch) - D444
Kelsey (mouth) - 0444
Juanita (mouth) - 0446
Juanita (at 124th) - C446
Issaquah (upstream) - A631
Issaquah (N Fork) - A632
Issaquah (mouth)- 0631
Idylewood - A620
Forbes - 0456
Fairweather - 0498
Evans (upstream) - S484
Evans (mouth @ Bear) - B484
Eden - A690
Ebright - A685
Coal - 0442
Cedar (mouth) - X438
Cedar (E Jones Rd) - A438
Bear (Seidel Rd) - J484
Bear (mouth) - 0484
Bear (Cottage Lk Cr) - N484
Bear (95th Ave) - C484
Increasing Water Quality ===> < 40 high concern, 40-80 moderate, > 80 low concern
WRIA 8 Rivers & StreamsWater Quality Index 2007-08
Figure C-24. Water Quality Index Rankings for Rivers and Streams in WRIA 8, 2007–2008
2008 RWSP Annual Report C-49
Appendix C. Water Quality Monitoring Results for 2008
C-50 2008 RWSP Annual Report
Normative Streamflows
Streams in urban areas respond more quickly to rainfall than streams in forested areas. Because less rainfall is being absorbed by vegetation and soil, more surface runoff occurs. Higher, more rapid, and frequent pulses of runoff (“flashiness”) lead to flooding and channel erosion. From a biological perspective, streams with more frequent peak flows are disturbed more often. Organisms that survive in these conditions are those that have adapted to more frequent and severe disturbances (DeGasperi et al., 2009).16
Flows from twenty stream sites in King County, including five sites monitored by the U.S. Geological Survey, were measured and their flashiness calculated during the 2007–2008 water year (October 2007–September 2008) (Figure C-25). The “flashiness index” is based on the reciprocal of the fraction of days during the year that the flow rises above the annual mean daily flow. The stream flashiness index was also calculated for previous years using historical data. The number of streams where data were available ranges from one stream in 1941 to twenty-two streams in 2001. The median flashiness declined between 2006 and 2008, primarily from interannual variation resulting from variation in rainfall. In general, the median of the flashiness index scores across streams measured has increased between 1945 and 2008 (Figure C-26). These data suggest that increased urbanization has resulted in faster surface runoff and peak streamflow rise and fall (increased flashiness) than previously occurred in at least some streams.
16 DeGasperi, C.L., H.B. Berge, K.R. Whiting, J.J. Burkey, J.L. Cassin, and R.R. Fuerstenberg. 2009. Linking hydrologic alteration to biological impairment in urbanizing streams of the Puget Lowland, Washington, USA. Journal of the American Water Resources Association 45(2):512-533.
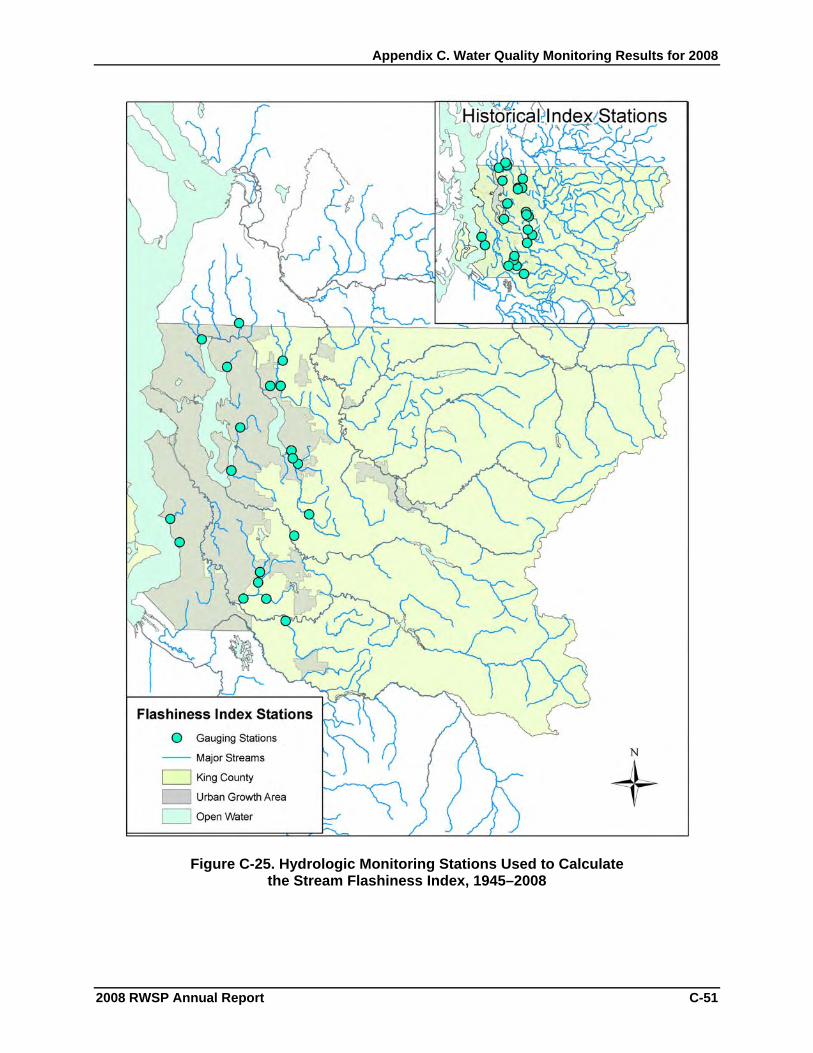
Appendix C. Water Quality Monitoring Results for 2008
Figure C-25. Hydrologic Monitoring Stations Used to Calculate the Stream Flashiness Index, 1945–2008
2008 RWSP Annual Report C-51

Appendix C. Water Quality Monitoring Results for 2008
C-52 2008 RWSP Annual Report
2.0
2.5
3.0
3.5
4.0
1940 1960 1980 2000
Year
Stre
am F
lash
ines
s
Figure C-26. Annual Median Stream Flashiness Index Scores, 1945–2008
Stream and River Sediment Monitoring Results The Stream Sediment Monitoring Program began in 1987. Monitoring between 1987 and 2002 in WRIAs 8 and 9 found concentrations of several metals, including arsenic, cadmium, copper, nickel, and zinc, above available sediment quality guidelines. The data also showed elevated concentrations of petroleum hydrocarbons. Using these data and new information, the county began an updated 10-year stream sediment monitoring program in 2004. The updated program was designed to address data gaps identified during the original program, monitor the effects of pollutant sources (point sources, stormwater, and other urban discharges), achieve a better understanding of sediment quality in entire stream basins, and determine long-term trends.
Additional parameters were added to those monitored in the original program. Samples collected through the updated program are analyzed for metals, organics, and physical parameters. All parameters are compared to sediment quality guidelines, including Ecology’s floating percentile guidelines and guidelines developed as part of the International Association for Great Lakes Research, to understand their effect on aquatic life.17
17 Smith, S. S., D.D. MacDonald, K.A. Keenleyside, C.G. Ingersoll, and L.J. Field. 1996. A preliminary evaluation of sediment quality assessment values for freshwater ecosystems. J. Great Lakes Res. 22(3): 624-638. Internat. Assoc. Great Lakes Res. Washington State Department of Ecology and Avocet Consulting. 2003. Development of freshwater sediment

Appendix C. Water Quality Monitoring Results for 2008
2008 RWSP Annual Report C-53
For trend analysis, 10 small wadeable streams were selected from the original program, allowing for use of historical metal and conventional data. Samples are collected yearly. Trends will be evaluated when sufficient data have been collected over time. For stream basin analysis, one-time samples are collected along each mile of a stream to monitor the processes that affect sediment quality in WRIAs 8 and 9. Approximately, three streams are monitored each year. All 30 streams in the program will be monitored by the end of the 10-year program. So far, Thornton, McAleer, Lyon, Swamp, North, Little Bear, Juanita, Forbes, Bear, Evans, Cottage Lake, Kelsey, and Coal Creeks—all in WRIA 8—have been monitored. Data from this program along with data from lake sediment and fish tissue samples are beginning to form a picture of the fate and transport pathway of these persistent chemicals.
Samples were collected from 93 stations in King County streams between 2004 and 2007. Results from analysis completed in 2008 indicate that while sediments at 36 of the stations were likely having no adverse effects on sediment biota, concentrations exceeded at least one sediment quality guideline at the other 57 stations (Figure C-27). Of these 57 stations, 25 had concentrations low enough that the effects were uncertain and 32 had concentration that were likely having adverse effects.
Chemicals that exceeded guidelines include metals, PAHs, and bis-2-ethylhexyl phthalate. Other chemicals that exceeded guidelines were organochlorines, including PCBs and banned insecticides such as DDT, DDD, DDE (DDD and DDE are byproducts of DDT), chlordane, and dieldrin. The presence of these organochlorines shows that chemicals can persist in the environment decades after being banned. These types of chemicals can accumulate in aquatic organisms and be taken up by organisms that are higher in the food chain (larger fish). A current advisory suggests limiting the consumption of some types of fish from Lake Washington because of high levels of some of these contaminants.
Samples collected in Issaquah, Springbrook, May, and Taylor Creeks in 2008 are still undergoing analysis.
quality values for use in Washington State. Phase II Report: Development and recommendation of SQVs for freshwater sediments in Washington State. Washington State Department of Ecology, Olympia, WA.

Appendix C. Water Quality Monitoring Results for 2008
Figure C-27. Stream Basin Sediment Sampling Results, 2004–2007
C-54 2008 RWSP Annual Report
Appendix C. Water Quality Monitoring Results for 2008
2008 RWSP Annual Report C-55
Wetland Monitoring for Carnation Treatment Plant Discharge King County’s Carnation Treatment Plant uses membrane-bioreactor technology to produce reclaimed-quality water. In early 2009, the treatment plant will begin to discharge effluent to a wetland at the Chinook Bend Natural Area just north of the City of Carnation.
Enhancements were made to the wetland in preparation for discharge. As part of its reclaimed water use permit application to the Washington State Departments of Ecology and Health, the county collected samples in 2006 to establish water and sediment quality at the wetland site before the enhancements. Water samples were collected twice in 2006, once during the summer dry season and once during the winter wet season at three locations: where surface water enters the wetland, in the middle of the open-water pond, and where water flows out of the wetland. Sediment samples were collected during the summer from the central area of the open-water pond, the shoreline of the pond, and the wet soils where groundwater is seeping into the pond. All samples were analyzed for organics, metals, and physical parameters. Data analysis results were reported in 2007.
Post-enhancement water samples were collected twice in 2008, once during the summer dry season and once during the winter wet season. Samples were collected at two locations: in the open-water pond and where the water flows into a new flow control structure that was installed as part of the wetland enhancement program. No sediment samples were collected in 2008. All samples were analyzed for the same organics, metals, and physical parameters as before. These parameters will be monitored again in 2009 and beyond to look for trends or any changes that may provide information on using reclaimed water to enhance wetlands for ecological benefit. Analysis and interpretation of data from both post-enhancement and post-discharge sampling will occur after post-discharge sampling has been completed.