appendix : cash flow analysis
TRANSCRIPT
FY 2008 MMI Fund Actuarial Review Appendix B: Cash Flow Analysis
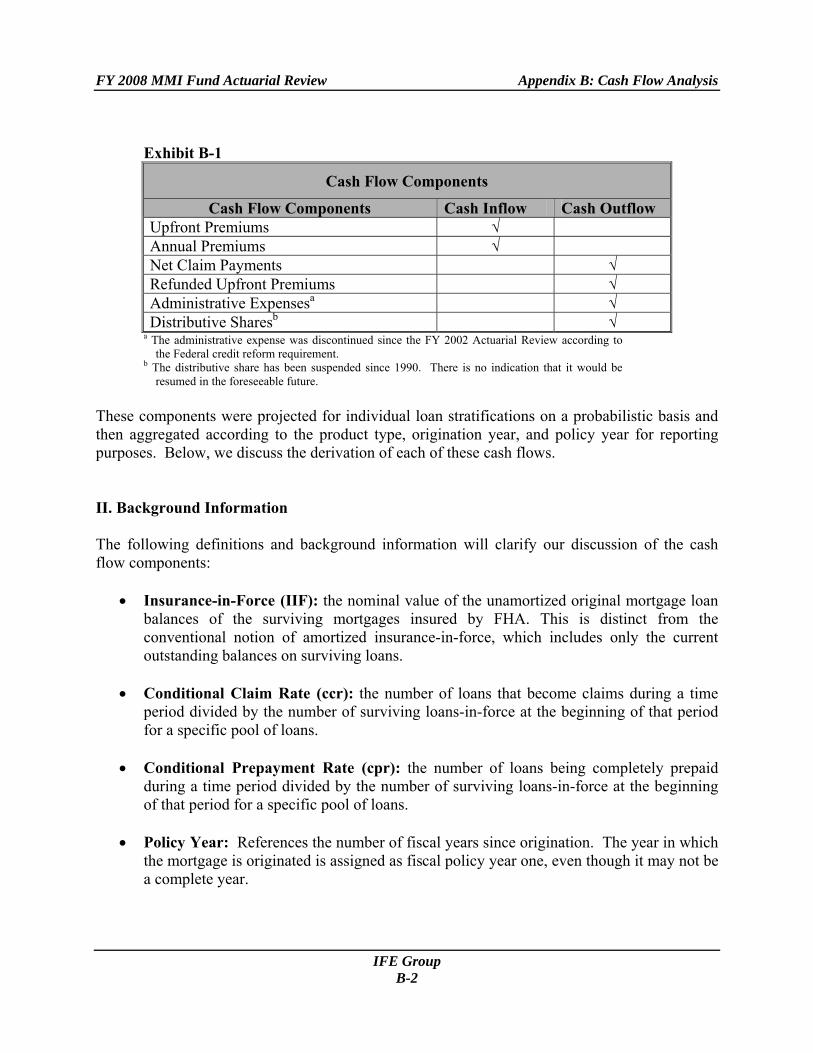
Appendix B: Cash Flow Analysis I. Introduction The calculation of the economic value of the MMI Fund involves the estimation of the present value of future cash flows generated by the existing portfolio and future books of business. This requires the projection of future prepayment and claim incidences and cash flow items associated with each type of outcome. This appendix describes the components of these cash flows The evaluation of the Fund's economic value is based on a discounted cash flow analysis similar to that used in corporate valuation. An investor would estimate the value of a firm as the present value of net assets plus the present value of new business expected to be undertaken. Assuming FHA continues to insure loans, the economic value of the MMI Fund is determined by valuing both its current portfolio of loans and its future books of business. In order to analyze future changes in the Fund's economic value, our model incorporates projections of the loan performance and information about the existing portfolio composition to project the Fund's various cash flow sources. The actuarial model used the projections from the econometric models discussed in Appendix A. We estimated econometric models for conditional claim and prepayment probabilities for individual loans depending on the loan type, origination year, age, interest rate, loan purpose, initial LTV ratio, credit score, refinancing incentive, relative house price, probability of negative equity, loan term, burnout, and other characteristics. Using detailed loan-level characteristics, we were able to estimate more accurately the prepayment and claim probabilities and then generate respective cash flows for individual loan stratifications. Based on the mortgage termination rates projected by the econometric model, the major components of cash flows are projected into the future. Future interest income is included in the present value discounting process. The relevant cash flow components are itemized in Exhibit B-1.
IFE Group B-1
FY 2008 MMI Fund Actuarial Review Appendix B: Cash Flow Analysis
Exhibit B-1
Cash Flow Components
Cash Flow Components Cash Inflow Cash Outflow Upfront Premiums √ Annual Premiums √ Net Claim Payments √ Refunded Upfront Premiums √ Administrative Expensesa √ Distributive Sharesb √
a The administrative expense was discontinued since the FY 2002 Actuarial Review according to the Federal credit reform requirement.
b The distributive share has been suspended since 1990. There is no indication that it would be resumed in the foreseeable future.
These components were projected for individual loan stratifications on a probabilistic basis and then aggregated according to the product type, origination year, and policy year for reporting purposes. Below, we discuss the derivation of each of these cash flows. II. Background Information The following definitions and background information will clarify our discussion of the cash flow components:
• Insurance-in-Force (IIF): the nominal value of the unamortized original mortgage loan balances of the surviving mortgages insured by FHA. This is distinct from the conventional notion of amortized insurance-in-force, which includes only the current outstanding balances on surviving loans.
• Conditional Claim Rate (ccr): the number of loans that become claims during a time
period divided by the number of surviving loans-in-force at the beginning of that period for a specific pool of loans.
• Conditional Prepayment Rate (cpr): the number of loans being completely prepaid
during a time period divided by the number of surviving loans-in-force at the beginning of that period for a specific pool of loans.
• Policy Year: References the number of fiscal years since origination. The year in which
the mortgage is originated is assigned as fiscal policy year one, even though it may not be a complete year.
IFE Group B-2
FY 2008 MMI Fund Actuarial Review Appendix B: Cash Flow Analysis
• Termination Year: the fiscal year in which a mortgage terminates through a claim, prepayment or other reasons.
• Unpaid Principle Balance (UPB) Factor: the principal balance outstanding at a given
time divided by the original mortgage amount. The UPB factor is calculated based only on amortization, given the original maturity, the type of mortgage, and the mortgage contract rate. For FRMs, the UPB factor for each quarter in the future can be directly computed using the initial contract rate and the amortization term. For ARMs, the UPB factor decreases at different rates depending on the interest rate of the particular loan, updated according to the contractual rate-adjustment rule. In this model, the contract interest rates of ARM loans are updated by using changes in the one-year Treasury rate as an approximation for changes in the underlying index, subject to limits implied by standard annual and lifetime rate-adjustment caps.
III. Cash Flow Components We now describe the different cash flow components. A. Premiums 1. Premium Structure The primary source of revenue to the Fund is the insurance premiums. If the Fund's mortgage insurance is priced to meet the expected liabilities, the insurance premiums collected and interest earned on them will on average cover all costs associated with mortgage loans insured by the Fund. According to current and past FHA mortgage insurance policies, the insurance premium has been structured in different ways during different time periods:
• For loans originated prior to September 1, 1983 the mortgage premium was collected on a monthly basis at an annualized rate of 0.50 percent of the outstanding principal balance for the period. To align this change with fiscal quarters, we assumed for this analysis that this annual premium policy was in effect through September 30, 1983.
• Between September 1, 1983 and June 30, 1991 the mortgage premium was based on a
percentage of the original mortgage amount at the time of origination. This amount was 3.80 percent for 30-year mortgages and 2.40 percent for 15-year mortgages.
• Effective July 1, 1991, the NAHA specified a new premium structure. This structure
specified an upfront premium of 3.80 percent for all product types except for 15-year non-streamline refinance loans (for which the upfront premium was set at 2.00 percent)
IFE Group B-3
FY 2008 MMI Fund Actuarial Review Appendix B: Cash Flow Analysis
and an annual renewal premium of 0.50 percent per year on the outstanding balance. The annual premium would cease at different policy years depending on the initial LTV of the loan.
• On October 1, 1992, the upfront premium was reduced from 3.80 percent to 3.00 percent.
The annual premium of 15-year mortgages was lowered to 0.25 percent or completely waived if the initial LTV ratio was less than 90 percent.
• As of April 17, 1994, FHA lowered the upfront premium rate on 30-year mortgages from
3.00 percent to 2.25 percent. To align this change with fiscal quarters, we started applying this policy change on April 1, 1994.
• Starting from October 1, 1996, FHA lowered the upfront premium rate on 30-year
mortgages for first-time homebuyers who receive homeowner counseling from 2.25 percent to 2.00 percent. This rate was further reduced to 1.75 percent for mortgages executed on or after September 22, 1997. This favorable treatment for borrowers with homeownership counseling was terminated shortly thereafter.
• Effective January 1, 2001, FHA lowered the upfront premium rate of all mortgages to 1.50 percent. The annual premium was reduced to 0.50 percent on the UPB and the annual premium would stop as soon as the current LTV ratio of the loan was below 78 percent according to the home price as of the loan origination date. The annual premium must be paid for a minimum of five years for 30-year mortgages.
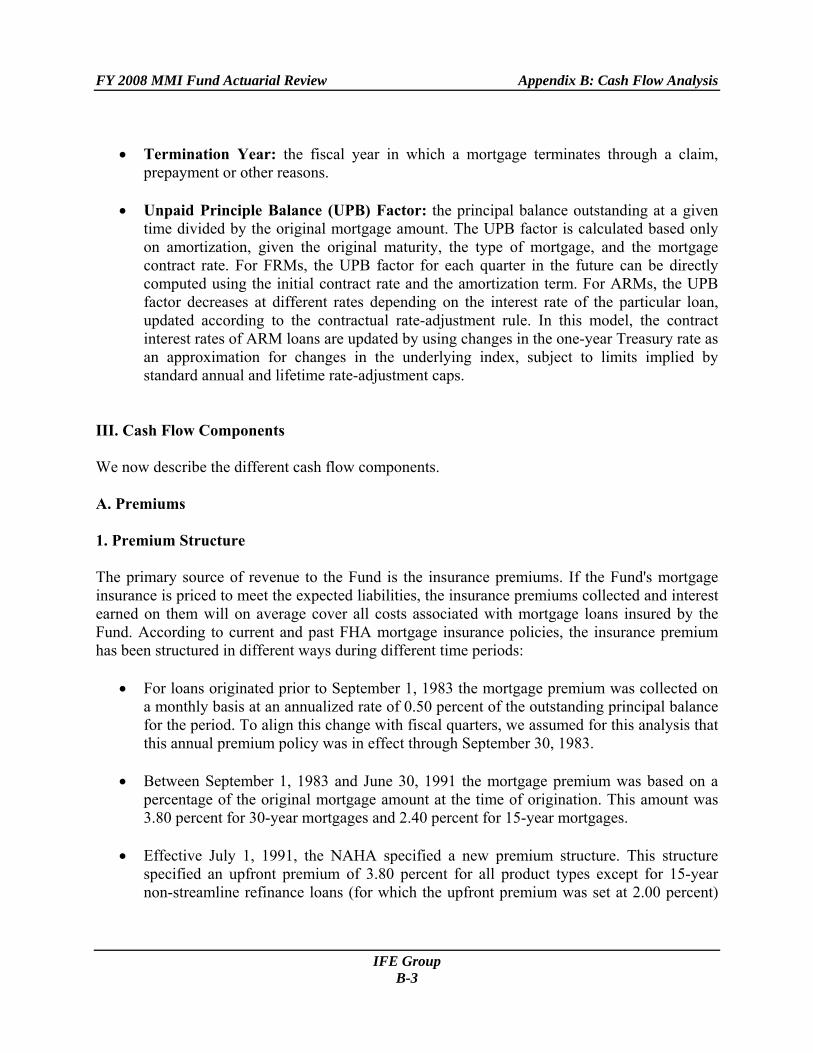
The upfront and annual premium rates are summarized in Exhibits B-2 and B-3. Exhibit B-2
Upfront Premium Rates for New FHA Originations
Fiscal Year 30yr Loans, Fixed or Adjustable Rate (%)
15yr Loans, Fixed or Adjustable Rate (%)
9/1/83 to 6/30/91 3.80 2.40 7/1/91 to 9/30/92 3.80 2.00/3.80b
10/1/92 to 4/16/94 3.00 2.00 4/17/94 to 9/30/96 2.25 2.00 10/1/96 to 9/21/97 2.25/2.00a 2.00 9/22/97 to 12/31/00 2.25/2.00/1.75a 2.00
1/1/01 to present 1.50 1.50 a For first-time homebuyers who received homeowner counseling. b For 15-year streamline refinance loans.
IFE Group B-4
FY 2008 MMI Fund Actuarial Review Appendix B: Cash Flow Analysis
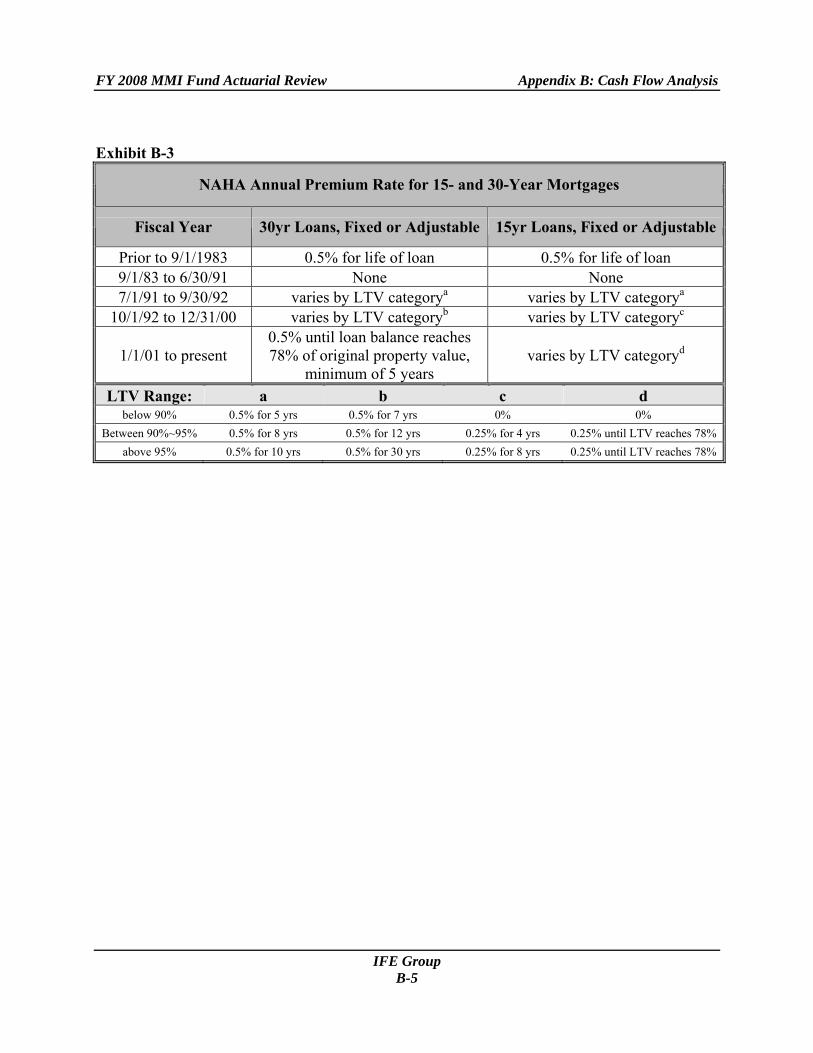
Exhibit B-3
NAHA Annual Premium Rate for 15- and 30-Year Mortgages
Fiscal Year 30yr Loans, Fixed or Adjustable 15yr Loans, Fixed or Adjustable
Prior to 9/1/1983 0.5% for life of loan 0.5% for life of loan 9/1/83 to 6/30/91 None None 7/1/91 to 9/30/92 varies by LTV categorya varies by LTV categorya
10/1/92 to 12/31/00 varies by LTV categoryb varies by LTV categoryc
1/1/01 to present 0.5% until loan balance reaches 78% of original property value,
minimum of 5 years varies by LTV categoryd
LTV Range: a b c d below 90% 0.5% for 5 yrs 0.5% for 7 yrs 0% 0%
Between 90%~95% 0.5% for 8 yrs 0.5% for 12 yrs 0.25% for 4 yrs 0.25% until LTV reaches 78% above 95% 0.5% for 10 yrs 0.5% for 30 yrs 0.25% for 8 yrs 0.25% until LTV reaches 78%
IFE Group B-5
FY 2008 MMI Fund Actuarial Review Appendix B: Cash Flow Analysis
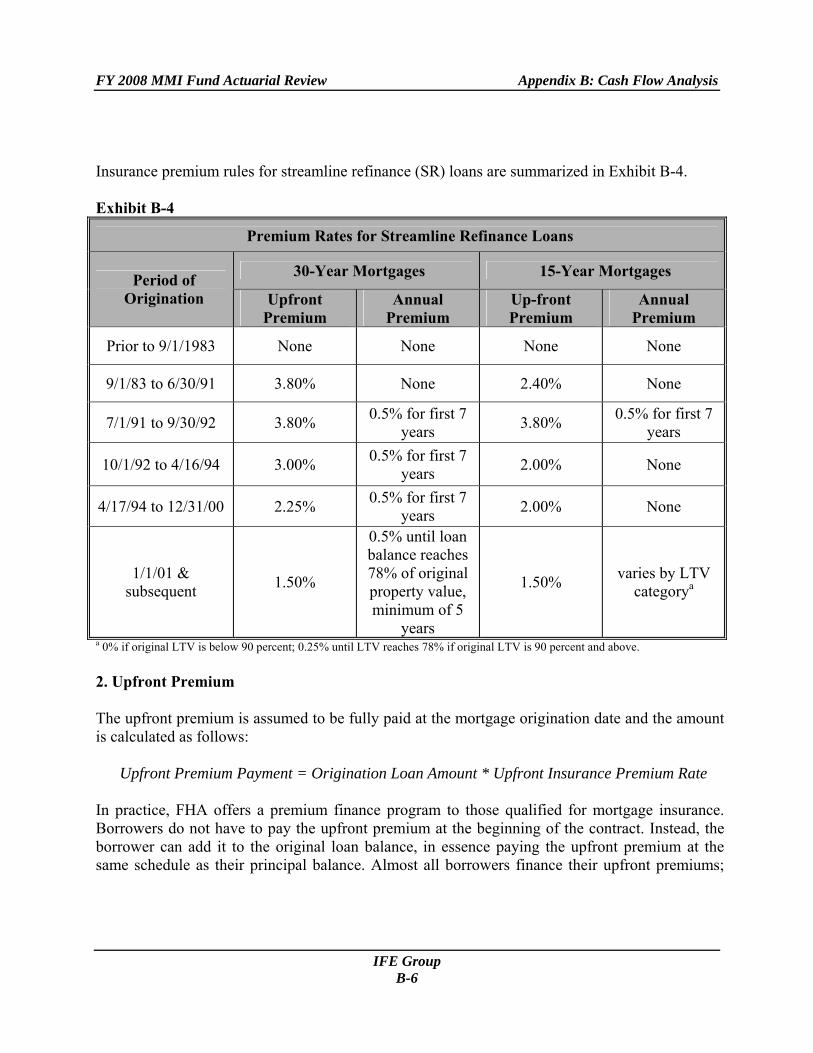
Insurance premium rules for streamline refinance (SR) loans are summarized in Exhibit B-4. Exhibit B-4
Premium Rates for Streamline Refinance Loans
30-Year Mortgages 15-Year Mortgages Period of Origination Upfront
Premium Annual
Premium Up-front Premium
Annual Premium
Prior to 9/1/1983 None None None None
9/1/83 to 6/30/91 3.80% None 2.40% None
7/1/91 to 9/30/92 3.80% 0.5% for first 7 years 3.80% 0.5% for first 7
years
10/1/92 to 4/16/94 3.00% 0.5% for first 7 years 2.00% None
4/17/94 to 12/31/00 2.25% 0.5% for first 7 years 2.00% None
1/1/01 & subsequent 1.50%
0.5% until loan balance reaches 78% of original property value, minimum of 5
years
1.50% varies by LTV categorya
a 0% if original LTV is below 90 percent; 0.25% until LTV reaches 78% if original LTV is 90 percent and above. 2. Upfront Premium The upfront premium is assumed to be fully paid at the mortgage origination date and the amount is calculated as follows:
Upfront Premium Payment = Origination Loan Amount * Upfront Insurance Premium Rate
In practice, FHA offers a premium finance program to those qualified for mortgage insurance. Borrowers do not have to pay the upfront premium at the beginning of the contract. Instead, the borrower can add it to the original loan balance, in essence paying the upfront premium at the same schedule as their principal balance. Almost all borrowers finance their upfront premiums;
IFE Group B-6
FY 2008 MMI Fund Actuarial Review Appendix B: Cash Flow Analysis
that is, the upfront premium is added to the original mortgage balance, so borrowers pay for it over time. 3. Annual Premium The annual premium is calculated as follows:
Annual Premium = Amortized UPB (excluding any upfront premiums) * Annual Insurance Premium Rate / 4
The annual premium is actually collected on a monthly basis. The above formula models the premium as being collected at the beginning of each quarter for purposes of our analysis. In addition, the termination rate will have impacts on annual premium flows. That is, all potential future annual premium income would no longer exist when the particular mortgage loan is prepaid or claimed. Although FHA is effectively insuring the financed upfront premiums, the annual premium is not assessed on the amount of the financed upfront premium. B. Losses Associated with Claims The MMI Fund’s largest expense component comes in the form of losses due to claims. FHA pays the claim to the lender when a lender files a claim. In most cases, FHA takes possession of the foreclosed property and sells the property to partially recover the loss. This particular type of claim is called a conveyance. Based on this practice, claim cash flows can be decomposed into two components:
• the cash outflow of the claim payment at the claim date and • the cash inflow of any net proceeds received in selling the conveyed property at the
property disposition date. For tractability, we simplify this two-step cash flow into one lump-sum amount. The single claim loss payment estimated in our model is
Claim Paymentt = Amortized Surviving UPBt * Conditional Claim Ratet * Loss Rate The Amortized Surviving UPBt is the amount of the unpaid balance of the loan after amortization multiplied by the probability that the loan will survive until the beginning of time t. The probability of survival is derived by dynamically simulating the loan subject to the projected conditional claim and conditional prepayment rates over individual time periods up to t. The
IFE Group B-7
FY 2008 MMI Fund Actuarial Review Appendix B: Cash Flow Analysis
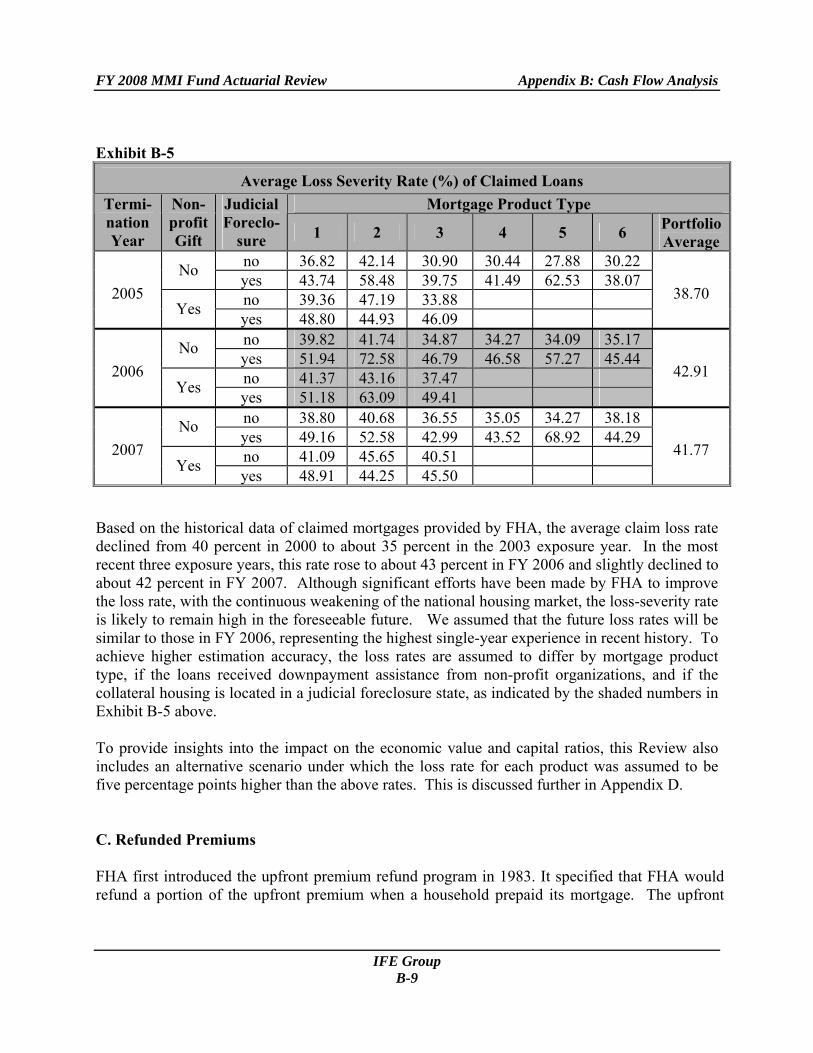
conditional claim rate is estimated from the multinomial mortgage termination model presented in Appendix A. Note that the claim rate and the prepayment rate are in terms of the number of loans instead of the UPB. Claim and prepayment rates do vary by loan size. The potential impact of the loan size difference is controlled in this analysis by categorizing loans into different local housing markets and into different relative house price categories. Loans within a specific stratification tend to have similar original mortgage loan amounts. As a result, using the rates in terms of the number of loans would yield a close approximation to the results by using the rates in terms of UPBs. The loss rate is usually referred to as the loss given default (LGD) or “severity” in the banking industry. It measures the amount of principal not recovered divided by the unpaid principal balance at the time of default. Exhibit B-5 shows the historical loss severity rate experience by termination year, mortgage product type, if the loans received downpayment assistance from non-profit organizations, and if the collateral housing is located in a judicial foreclosure state. It clearly shows that loss severity rates are higher among the judicial foreclosure states. The longer time required to dispose a foreclosed property in those states tends to increase the loss severity. We also observe that the loss rates of 15-year mortgages tend to be higher than other mortgage types. However, due to the low claim rate of the 15-year mortgage products, the impact of the higher loss rate is less severe than it appears. For property dispositions that occurred during FY 2005, FY 2006 and FY 2007, FHA’s loss rates averaged 38.70, 42.91, and 41.77 percent. Note that these must be weighted by portfolio weights rather than equally weighted averages of unpaid principal balance, respectively. FHA often expresses its loss rate in terms of a percentage of its acquisition cost, which is the sum of the unpaid principal balance and other allowable costs, e.g., unearned interest during the foreclosure period and foreclosure expenses, for which FHA reimburses the lender upon the filing of a claim when the property is conveyed to FHA. Under that definition, the loss rates reported by FHA would be lower than the rates presented in this Review.
IFE Group B-8
FY 2008 MMI Fund Actuarial Review Appendix B: Cash Flow Analysis
Exhibit B-5
Average Loss Severity Rate (%) of Claimed Loans Mortgage Product Type Termi-
nation Year
Non-profit Gift
Judicial Foreclo-
sure 1 2 3 4 5 6 Portfolio Average
no 36.82 42.14 30.90 30.44 27.88 30.22 No yes 43.74 58.48 39.75 41.49 62.53 38.07 no 39.36 47.19 33.88 2005
Yes yes 48.80 44.93 46.09 38.70
no 39.82 41.74 34.87 34.27 34.09 35.17 No yes 51.94 72.58 46.79 46.58 57.27 45.44 no 41.37 43.16 37.47 2006
Yes yes 51.18 63.09 49.41 42.91
no 38.80 40.68 36.55 35.05 34.27 38.18 No yes 49.16 52.58 42.99 43.52 68.92 44.29 no 41.09 45.65 40.51 2007
Yes yes 48.91 44.25 45.50 41.77
Based on the historical data of claimed mortgages provided by FHA, the average claim loss rate declined from 40 percent in 2000 to about 35 percent in the 2003 exposure year. In the most recent three exposure years, this rate rose to about 43 percent in FY 2006 and slightly declined to about 42 percent in FY 2007. Although significant efforts have been made by FHA to improve the loss rate, with the continuous weakening of the national housing market, the loss-severity rate is likely to remain high in the foreseeable future. We assumed that the future loss rates will be similar to those in FY 2006, representing the highest single-year experience in recent history. To achieve higher estimation accuracy, the loss rates are assumed to differ by mortgage product type, if the loans received downpayment assistance from non-profit organizations, and if the collateral housing is located in a judicial foreclosure state, as indicated by the shaded numbers in Exhibit B-5 above. To provide insights into the impact on the economic value and capital ratios, this Review also includes an alternative scenario under which the loss rate for each product was assumed to be five percentage points higher than the above rates. This is discussed further in Appendix D. C. Refunded Premiums FHA first introduced the upfront premium refund program in 1983. It specified that FHA would refund a portion of the upfront premium when a household prepaid its mortgage. The upfront
IFE Group B-9
FY 2008 MMI Fund Actuarial Review Appendix B: Cash Flow Analysis
premium was considered to be “earned” over the life of the loan. Upon prepayment, an approximation of the unearned upfront premium is returned to the borrower. Therefore, the amount of the refund depends on the time since origination that the mortgage is prepaid. The refund payments are calculated as follows:
Refund Payments = Original UPB * Upfront Premium Rate * Conditional Prepayment Rate * Refund Rate
In the past, borrowers could receive the upfront premium refund when they prepaid their mortgages before the maturity of the mortgage contract. In 2000, FHA changed its policy so that borrowers would obtain refunds only if they prepay within the first five years of their mortgage contracts. The most recent policy change at the end of 2004 eliminated refunds for early prepayments of any mortgages endorsed afterward, except for those occurring within 3 years following the original endorsement date and the borrower refinanced with a new FHA loan. The upfront premium refund schedules for different endorsement dates are presented in Exhibit B-6.
IFE Group B-10

FY 2008 MMI Fund Actuarial Review Appendix B: Cash Flow Analysis
Exhibit B-6 Percentage of Upfront Premium Refunded
9/1/83~12/31/93 1/1/94~ 12/31/00a
1/1/01 and laterb
12/8/2004 and laterc
Years since Origination 30-Year
Mortgages 15-Year
Mortgages All
Mortgages All
Mortgages
If Refinanced into Another FHA Loan
1 0.99 0.99 0.95 0.85 0.58 2 0.94 0.93 0.85 0.65 0.34 3 0.82 0.81 0.70 0.45 0.10 4 0.67 0.66 0.49 0.25 0.00 5 0.54 0.51 0.30 0.10 6 0.43 0.39 0.15 0.00 7 0.35 0.29 0.04 8 0.29 0.21 0.00 9 0.24 0.15 10 0.21 0.11 11 0.18 0.08 12 0.16 0.06 13 0.15 0.04 14 0.13 0.03 15 0.12 0.02 16 0.11 0.00 17 0.10 18 0.09 19 0.09 20 0.08 21 0.07 22 0.07 23 0.06 24 0.05 25 0.05 26 0.04 27 0.04 28 0.04 29 0.04 30 0.00
a Based on Mortgagee Letter 94-1, which provided a monthly schedule of refund rates b Based on Mortgagee Letter 00-38 c Based on Mortgagee Letter 05-03, which provided a monthly schedule of refund rates. Applicable only if refinanced into a new FHA loan.
IFE Group B-11
FY 2008 MMI Fund Actuarial Review Appendix B: Cash Flow Analysis
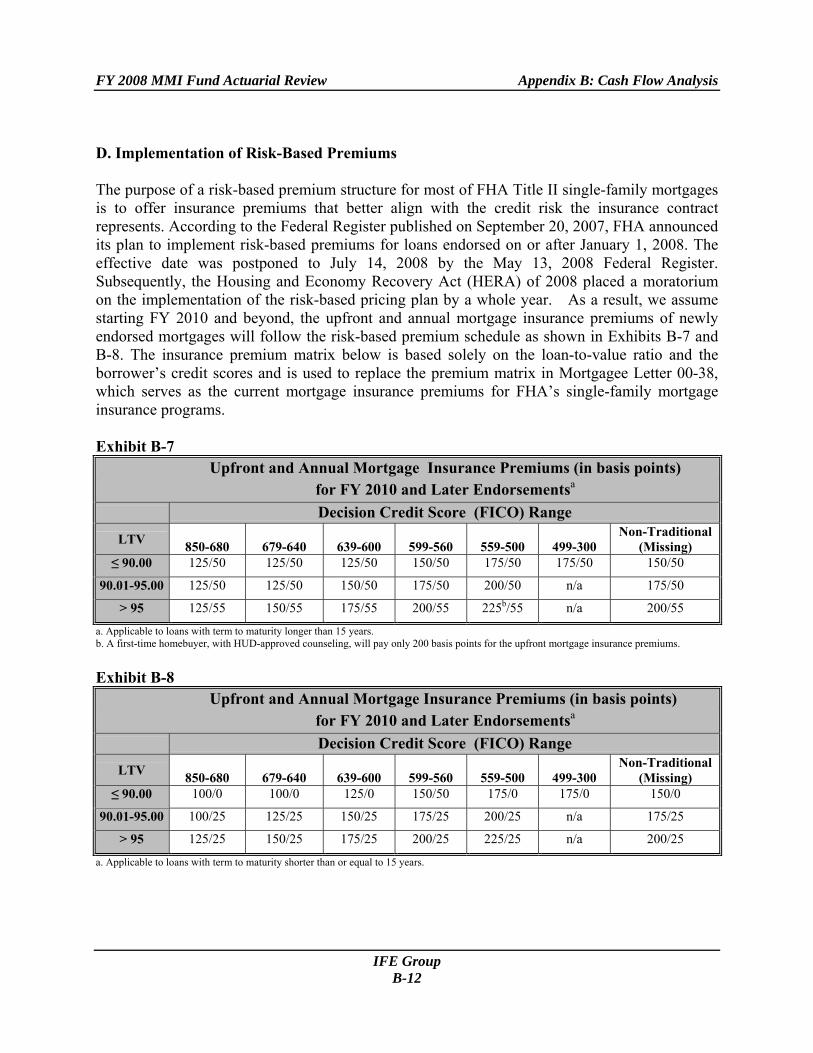
D. Implementation of Risk-Based Premiums The purpose of a risk-based premium structure for most of FHA Title II single-family mortgages is to offer insurance premiums that better align with the credit risk the insurance contract represents. According to the Federal Register published on September 20, 2007, FHA announced its plan to implement risk-based premiums for loans endorsed on or after January 1, 2008. The effective date was postponed to July 14, 2008 by the May 13, 2008 Federal Register. Subsequently, the Housing and Economy Recovery Act (HERA) of 2008 placed a moratorium on the implementation of the risk-based pricing plan by a whole year. As a result, we assume starting FY 2010 and beyond, the upfront and annual mortgage insurance premiums of newly endorsed mortgages will follow the risk-based premium schedule as shown in Exhibits B-7 and B-8. The insurance premium matrix below is based solely on the loan-to-value ratio and the borrower’s credit scores and is used to replace the premium matrix in Mortgagee Letter 00-38, which serves as the current mortgage insurance premiums for FHA’s single-family mortgage insurance programs. Exhibit B-7
Upfront and Annual Mortgage Insurance Premiums (in basis points) for FY 2010 and Later Endorsementsa
Decision Credit Score (FICO) Range
LTV 850-680
679-640
639-600
599-560
559-500
499-300
Non-Traditional (Missing)
≤ 90.00 125/50 125/50 125/50 150/50 175/50 175/50 150/50
90.01-95.00 125/50 125/50 150/50 175/50 200/50 n/a 175/50
> 95 125/55 150/55 175/55 200/55 225b/55 n/a 200/55
a. Applicable to loans with term to maturity longer than 15 years. b. A first-time homebuyer, with HUD-approved counseling, will pay only 200 basis points for the upfront mortgage insurance premiums. Exhibit B-8
Upfront and Annual Mortgage Insurance Premiums (in basis points) for FY 2010 and Later Endorsementsa
Decision Credit Score (FICO) Range
LTV 850-680
679-640
639-600
599-560
559-500
499-300
Non-Traditional (Missing)
≤ 90.00 100/0 100/0 125/0 150/50 175/0 175/0 150/0
90.01-95.00 100/25 125/25 150/25 175/25 200/25 n/a 175/25
> 95 125/25 150/25 175/25 200/25 225/25 n/a 200/25
a. Applicable to loans with term to maturity shorter than or equal to 15 years.
IFE Group B-12
FY 2008 MMI Fund Actuarial Review Appendix B: Cash Flow Analysis
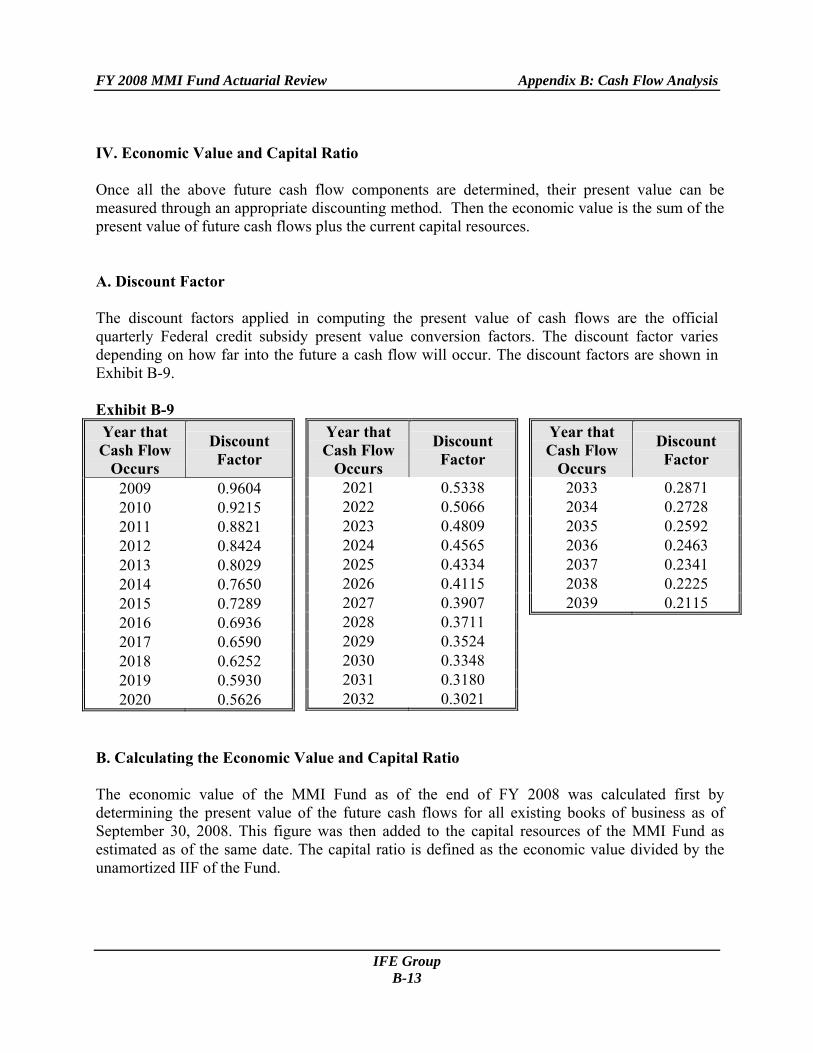
IV. Economic Value and Capital Ratio Once all the above future cash flow components are determined, their present value can be measured through an appropriate discounting method. Then the economic value is the sum of the present value of future cash flows plus the current capital resources. A. Discount Factor The discount factors applied in computing the present value of cash flows are the official quarterly Federal credit subsidy present value conversion factors. The discount factor varies depending on how far into the future a cash flow will occur. The discount factors are shown in Exhibit B-9. Exhibit B-9 Year that Cash Flow
Occurs
Discount Factor
2009 0.9604 2010 0.9215 2011 0.8821 2012 0.8424 2013 0.8029 2014 0.7650 2015 0.7289 2016 0.6936 2017 0.6590 2018 0.6252 2019 0.5930 2020 0.5626
Year that Cash Flow
Occurs
Discount Factor
2021 0.5338 2022 0.5066 2023 0.4809 2024 0.4565 2025 0.4334 2026 0.4115 2027 0.3907 2028 0.3711 2029 0.3524 2030 0.3348 2031 0.3180 2032 0.3021
Year that Cash Flow
Occurs
Discount Factor
2033 0.2871 2034 0.2728 2035 0.2592 2036 0.2463 2037 0.2341 2038 0.2225 2039 0.2115
B. Calculating the Economic Value and Capital Ratio The economic value of the MMI Fund as of the end of FY 2008 was calculated first by determining the present value of the future cash flows for all existing books of business as of September 30, 2008. This figure was then added to the capital resources of the MMI Fund as estimated as of the same date. The capital ratio is defined as the economic value divided by the unamortized IIF of the Fund.
IFE Group B-13
FY 2008 MMI Fund Actuarial Review Appendix B: Cash Flow Analysis
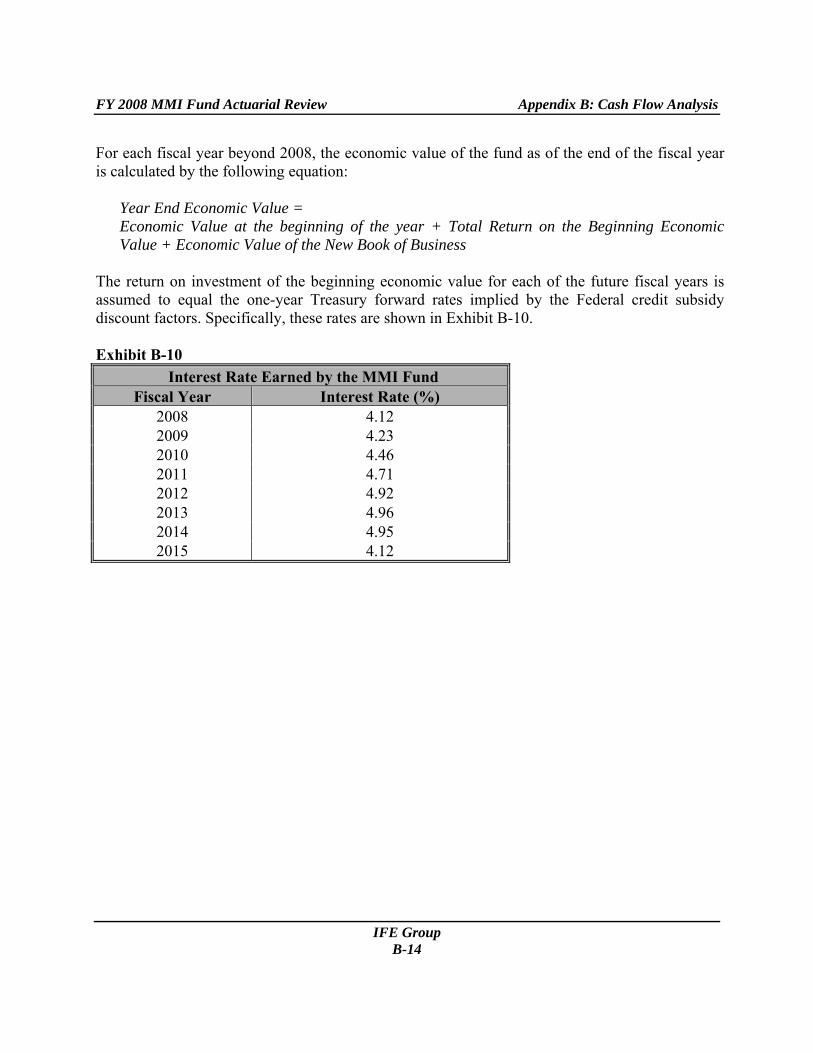
For each fiscal year beyond 2008, the economic value of the fund as of the end of the fiscal year is calculated by the following equation:
Year End Economic Value = Economic Value at the beginning of the year + Total Return on the Beginning Economic Value + Economic Value of the New Book of Business
The return on investment of the beginning economic value for each of the future fiscal years is assumed to equal the one-year Treasury forward rates implied by the Federal credit subsidy discount factors. Specifically, these rates are shown in Exhibit B-10. Exhibit B-10
Interest Rate Earned by the MMI Fund Fiscal Year Interest Rate (%)
2008 4.12 2009 4.23 2010 4.46 2011 4.71 2012 4.92 2013 4.96 2014 4.95 2015 4.12
IFE Group B-14