appendix d-12 modeled aircraft operations for noise ... · appendix d-12 (6-11-05).doc d-12-1...
TRANSCRIPT

Appendix D-12 MODELED AIRCRAFT OPERATIONS FOR
NOISE ASSESSMENT OF YEAR 2025 BUILD ALTERNATIVES 3 AND 4

Appendix D-12 (6-11-05).doc
D-12-1
APPENDIX D-12
Modeled Aircraft Operations for Noise Assessment of Year 2025 Build Alternatives 3 and 4
In order to compare to current planning policies of Loudoun and Fairfax counties and to be consistent with long-term planning efforts by the Metropolitan Washington Airports Authority (MWAA) for Washington Dulles International Airport (IAD), noise exposure for Year 2025 was assessed.
Activity Levels and Fleet Mix - As shown in Table D-12.1, the forecasted total number of aircraft operations for IAD for Year 2025 would be 986,577. This total is based on the Washington Dulles International Airport Updated Activity Forecasts and Simulation, November 2003 (HNTB, 2003). The annual average daily number of aircraft operations was the basis for developing noise contours for both the 2025 Build Alternatives. The total of Table D-12.1 corresponds to 2,703 annual average daily aircraft operations.
The make and model of aircraft used in these operations were also identified for the development of a fleet mix. Fleet mix refers to the various types of aircraft operating at IAD and included very specific information such as engine type, FAR Part 36 Noise Stage Certification, gross weight, and departure stage length. See the Flight Profiles and Performance Data section below for discussion of stage length. As fleet mix and aircraft operations data were derived, four groups of IAD users similar to ATCT counts were established: Air Passenger, Cargo, General Aviation (GA)/Air Taxi, and Military. Each identified aircraft type in each user group was assigned to an aircraft category. The aircraft categories for each group are listed in Table D-12.1.
The operation numbers and fleet mix for the 2025 Condition were developed from the Forecast’s Table 74. To be consistent with the Forecast’s average weekday peak month (AWDPM) schedule (Forecast’s Appendix E), Cargo operations were separated from the Forecast’s Wide-body Jet, Narrow-body Jet and Commercial Turboprop operations. In general, each aircraft type in the Forecast’s Table 5 was assigned to a (single) representative INM aircraft type. The assignment for Wide-body Jet, Narrow-body Jet, Regional Jet and Commercial Turboprop was primarily based on national trends except for Cargo, which was operator-specific. The generic aircraft designation “320” was distributed among INM’s A32023 and A320 types with the distribution from the existing conditions. The GA/Air Taxi operations were distributed among the same INM aircraft types in the existing (2002) condition with the same percentages of operations. The Military operations were distributed among the two specific jet INM types and one turboprop INM type consistent with the fleet mix found in the Forecast’s Appendix E. Application of the fleet mix to the average-daily aircraft operations figures produced the number of average-daily operations by aircraft type.
Tables D-12.2 through D-12.5 list the annual departure and arrival operations by representative INM aircraft type for each of the four groups. The operations information shown on these tables was used as input data to the INM for the 2025 Build Alternatives at IAD.
The distribution of flight operations among daytime (7:00 a.m. to 10:00 p.m.) and nighttime (10:00 p.m. to 7:00 a.m.) periods (“day-night mix”) was based on the Forecast’s Appendix E for arrivals and departures.

Appendix D-12 (6-11-05).doc
D-12-2
The Air Passenger flight operations were assigned the Passenger day-night mix (92 percent daytime for arrivals, 94 percent daytime for departures). The Cargo flight operations were assigned the Cargo day-night mix (32 percent daytime for arrivals, 29 percent daytime for departures). The GA/Air Taxi flight operations were assigned the combination of GA and Air Taxi day-night mixes (85 percent daytime) and the Military flight operations were assigned the Military day-night mix (100 percent daytime).

\Appendix D-12 (6-11-05).doc
D-12-3
TABLE D-12.1
SUMMARY OF ANNUAL AIRCRAFT FLIGHT OPERATIONS FOR 2025 BUILD ALTERNATIVES Washington Dulles International Airport
Environmental Impact Statement
Arrivals Departures Total Aircraft Family Aircraft Category Day Night Total Day Night Total Day Night
Grand Total
Wide-body Jet 49,606 4,314 53,920 50,686 3,234 53,920 100,292 7,548 107,840
Narrow-body Jet 159,950 13,909 173,859 163,426 10,429 173,855 323,376 24,338 347,714
Regional Jet 171,156 14,883 186,039 174,877 11,162 186,039 346,033 26,045 372,078 Air
Passenger
Commercial Turboprop 15,408 1,340 16,748 15,743 1,005 16,748 31,151 2,345 33,496
Wide-body Jet 2,345 4,990 7,335 2,126 5,210 7,336 4,471 10,200 14,671
Narrow-body Jet 500 1,061 1,561 453 1,108 1,561 953 2,169 3,122
Regional Jet 0 0 0 0 0 0 0 0 0 Air Cargo
Commercial Turboprop 166 354 520 151 369 520 317 723 1,040
Business Jet 34,766 6,135 40,901 34,766 6,135 40,901 69,532 12,270 81,802
Multi-Engine Turboprop 3,484 615 4,099 3,484 615 4,099 6,968 1,230 8,198
Twin-Engine Piston 2,763 488 3,251 2,763 488 3,251 5,526 976 6,502
General Aviation/ Air
Taxi Single-Engine Prop 807 142 949 807 142 949 1,614 284 1,898
Jet 2,550 - 2,550 2,546 - 2,546 5,096 - 5,096 Military
Turboprop 1,550 - 1,550 1,550 - 1,550 3,100 - 3,100
Total 445,051 48,231 493,282 453,378 39,897 493,275 898,429 88,128 986,557
Day/Night Distribution 90% 10% 100% 92% 8% 100% 91% 9% 100% Day = 7:00 a.m. to 10:00 p.m . Night = 10:00 p.m. to 7:00 a.m.
Note: Minor differences between total arrivals and total departures may exist due to rounding. Source: URS Corporation, 2004.

\Appendix D-12 (6-11-05).doc
D-12-4
ArrivalSL 1 (0-500nm) SL 2 (500-1000nm) SL 3 (1000-1500nm) SL 4 (1500-2500nm) SL 5 (2500-3500nm) SL 6 (3500-4500nm) SL 7 (4500nm-)
Day Night Day Night Day Night Day Night Day Night Day Night Day Night Day Night Total Day Night Total74720B 259 23 282 6 13 1 19 1 50 3 88 6 50 3 38 2 264 16 280 523 39 562747400 12,823 1,115 13,938 312 20 624 40 936 60 2,496 159 4,367 279 2,496 159 1,872 119 13,103 836 13,939 25,926 1,951 27,877767300 15,680 1,363 17,043 5,854 374 2,773 177 616 39 3,081 197 616 39 2,157 138 924 59 16,021 1,023 17,044 31,701 2,386 34,087767400 851 74 925 580 37 290 19 870 56 926 1,721 130 1,851767CF6767JT9777200 12,930 1,124 14,054 1,258 80 1,573 100 4,089 261 3,460 221 1,573 100 1,258 80 13,211 842 14,053 26,141 1,966 28,107777300 1,639 143 1,782 1,675 107 1,675 107 1,782 3,314 250 3,564A30062A310A330 1,987 173 2,160 1,015 65 1,015 65 2,030 130 2,160 4,017 303 4,320
A33034 410 36 446 419 27 419 27 446 829 63 892A340 3,027 263 3,290 619 39 928 59 1,546 99 3,093 197 3,290 6,120 460 6,580
DC1010DC1030MD11GE717200 10,468 910 11,378 1,258 80 5,977 381 3,460 221 10,695 682 11,377 21,163 1,592 22,755737300737400737500737700 3,170 276 3,446 972 62 972 62 1,296 83 3,240 207 3,447 6,410 483 6,893727EM1727EM2737800 24,928 2,168 27,096 8,076 515 11,493 734 3,727 238 2,174 139 25,470 1,626 27,096 50,398 3,794 54,192737N17757PW 25,432 2,211 27,643 8,865 566 6,114 390 3,668 234 7,337 468 25,984 1,658 27,642 51,416 3,869 55,285757RRA319 43,788 3,808 47,596 23,902 1,526 10,112 645 4,597 293 6,129 391 44,740 2,855 47,595 88,528 6,663 95,191A320 862 75 937 383 24 230 15 115 7 153 10 881 56 937 1,743 131 1,874
A32023 48,579 4,224 52,803 21,580 1,377 12,948 826 6,474 413 8,632 551 49,634 3,167 52,801 98,213 7,391 105,604A32123 2,723 237 2,960 2,782 178 2,782 178 2,960 5,505 415 5,920DC870
DC93LWF10065MD83
MD9025CL600 6,828 594 7,422 6,977 445 6,977 445 7,422 13,805 1,039 14,844CL601 149,781 13,024 162,805 119,636 7,636 33,401 2,132 153,037 9,768 162,805 302,818 22,792 325,610
EMB14L 14,547 1,265 15,812 14,863 949 14,863 949 15,812 29,410 2,214 31,624DHC6 8,877 772 9,649 9,070 579 9,070 579 9,649 17,947 1,351 19,298DHC8 6,531 568 7,099 6,673 426 6,673 426 7,099 13,204 994 14,198
DHC830GASEPF
SD330SF340
TOTAL 396,120 34,446 430,566 228,427 14,579 87,725 5,599 26,157 1,668 35,437 2,262 10,584 676 8,799 561 7,603 485 404,732 25,830 430,562 800,852 60,276 861,128
Departures by Stage Length (SL)
TotalDeparture Total Grand Total
NightAircraft
Category
Representative INM Aircraft
Type Day
Wide-body Jet
Narrow-body Jet
Regional Jet
Commercial Turboprop
TABLE D-12.2
AIR PASSENGER ANNUAL FLIGHT OPERATIONS FOR 2025 BUILD ALTERNATIVES Washington Dulles International Airport
Environmental Impact Statement
Day = 7:00 a.m. to 10:00 p.m. Night = 10:00 p.m. to 7:00 a.m. SL = Stage Length Source: Washington Dulles International Airport, Updated Activity Forecasts and Simulation, HNTB Corporation, November 2003. URS Corporation Analysis

\Appendix D-12 (6-11-05).doc
D-12-5
ArrivalSL 1 (0-500nm) SL 2 (500-1000nm) SL 3 (1000-1500nm) SL 4 (1500-2500nm) SL 5 (2500-3500nm) SL 6 (3500-4500nm) SL 7 (4500nm-)
Day Night Day Night Day Night Day Night Day Night Day Night Day Night Day Night Total Day Night Total74720B747400 216 460 676 98 240 98 240 196 480 676 412 940 1,352767300 287 610 897 260 637 260 637 897 547 1,247 1,794767400767CF6 166 354 520 151 369 151 369 520 317 723 1,040767JT9777200777300A30062 499 1,061 1,560 271 665 90 222 90 222 451 1,109 1,560 950 2,170 3,120A310 582 1,238 1,820 317 775 211 517 528 1,292 1,820 1,110 2,530 3,640A330
A33034A340
DC1010DC1030 20 44 64 3 8 9 23 6 15 18 46 64 38 90 128MD11GE 575 1,223 1,798 87 213 261 638 174 426 522 1,277 1,799 1,097 2,500 3,597717200737300737400737500737700 226 480 706 205 501 205 501 706 431 981 1,412727EM1727EM2737800737N17757PW757RR 274 581 855 165 405 83 202 248 607 855 522 1,188 1,710A319A320
A32023A32123DC870
DC93LWF10065MD83
MD9025CL600CL601
EMB14LDHC6DHC8
DHC830GASEPF
SD330 166 354 520 151 369 151 369 520 317 723 1,040SF340
TOTAL 3,011 6,405 9,416 1,610 3,942 571 1,400 83 202 90 222 278 681 98 240 2,730 6,687 9,417 5,741 13,092 18,833
Wide-body Jet
Narrow-body Jet
Regional Jet
Commercial Turboprop
NightAircraft
Category
Representative INM Aircraft
Type Day
Departures by Stage Length (SL)
TotalDeparture Total Grand Total
TABLE D-12.3
AIR CARGO ANNUAL FLIGHT OPERATIONS FOR 2025 BUILD ALTERNATIVES Washington Dulles International Airport
Environmental Impact Statement
Day = 7:00 a.m. to 10:00 p.m. Night = 10:00 p.m. to 7:00 a.m. SL = Stage Length
Source: Washington Dulles International Airport, Updated Activity Forecasts and Simulation, HNTB Corporation, November 2003.

\Appendix D-12 (6-11-05).doc
D-12-6
Arrival DepartureSL 1 (0-500nm) only
Total Day Night Total Day Night TotalCIT3 1,552 274 1,826 1,552 274 1,826 3,104 548 3,652
CL600 4,177 737 4,914 4,177 737 4,914 8,354 1,474 9,828CL601 1,792 316 2,108 1,792 316 2,108 3,584 632 4,216
CNA500 700 124 824 700 124 824 1,400 248 1,648CNA750 1,437 254 1,691 1,437 254 1,691 2,874 508 3,382EMB145 1,721 304 2,025 1,721 304 2,025 3,442 608 4,050FAL20 18 3 21 18 3 21 36 6 42GIIB 1,419 250 1,669 1,419 250 1,669 2,838 500 3,338GIV 3,317 585 3,902 3,317 585 3,902 6,634 1,170 7,804GV 1,011 178 1,189 1,011 178 1,189 2,022 356 2,378
IA1125 1,020 180 1,200 1,020 180 1,200 2,040 360 2,400LEAR25 4,195 740 4,935 4,195 740 4,935 8,390 1,480 9,870LEAR35 7,529 1,329 8,858 7,529 1,329 8,858 15,058 2,658 17,716MU3001 4,860 858 5,718 4,860 858 5,718 9,720 1,716 11,436SABR80 18 3 21 18 3 21 36 6 42C130HP 9 2 11 9 2 11 18 4 22CNA441 1,463 258 1,721 1,463 258 1,721 2,926 516 3,442DHC6 1,985 350 2,335 1,985 350 2,335 3,970 700 4,670
HS748A 9 2 11 9 2 11 18 4 22SD330 18 3 21 18 3 21 36 6 42
Twin-engine Piston
BEC58P 2,763 488 3,251 2,763 488 3,251 5,526 976 6,502
CNA172 40 7 47 40 7 47 80 14 94CNA206 197 35 232 197 35 232 394 70 464GASEPF 285 50 335 285 50 335 570 100 670GASEPV 285 50 335 285 50 335 570 100 670
Total 41,820 7,380 49,200 41,820 7,380 49,200 83,640 14,760 98,400
Day NightGrand Total
Representative INM Aircraft
TypeAircraft
Category
Single-engine Piston
Multi-engine Turboprop
Business Jet
TABLE D-12.4
GENERAL AVIATION / AIR TAXI ANNUAL FLIGHT OPERATIONS FOR 2025 BUILD ALTERNATIVES Washington Dulles International Airport
Environmental Impact Statement
Day = 7:00 a.m. to 10:00 p.m. Night = 10:00 p.m. to 7:00 a.m. SL = Stage Length
Source: Washington Dulles International Airport, Updated Activity Forecasts and Simulation, HNTB Corporation, November 2003. URS Corporation Analysis

\Appendix D-12 (6-11-05).doc
D-12-7
SL 1 (0-500nm) SL 2 (500-1000nm) SL 3 (1000-1500nm) SL 4 (1500-2500nm) SL 5 (2500-3500nm) SL 6 (3500-4500nm) SL 7 (4500nm-) Departure TotalDay Night Total Day Night Day Night Day Night Day Night Day Night Day Night Day Night Day Night Total Day Night Total
L1011 1,275 - 1,275 155 - 117 - 79 - 244 - 266 - 221 - 191 - 1,273 - 1,273 2,548 - 2,548 A310 1,275 - 1,275 155 - 117 - 79 - 244 - 266 - 221 - 191 - 1,273 - 1,273 2,548 - 2,548
Turboprop DHC6 1,550 - 1,550 1,550 - 1,550 - 1,550 3,100 - 3,100 Total 4,100 - 4,100 1,860 - 234 - 158 - 488 - 532 - 442 - 382 - 4,096 - 4,096 8,196 - 8,196
Grand Total
Jet
Aircraft Category
Representative INM Aircraft
Type
Departures by Stage Length (SL)Arrival
TABLE D-12.5
MILITARY ANNUAL FLIGHT OPERATIONS FOR 2025 BUILD ALTERNATIVES Washington Dulles International Airport
Environmental Impact Statement
Day = 7:00 a.m. to 10:00 p.m. Night = 10:00 p.m. to 7:00 a.m. SL = Stage Length
Source: Washington Dulles International Airport, Updated Activity Forecasts and Simulation, HNTB Corporation, November 2003.
Tier 2 Environmental Assessment, MWAA, 2002 NOTES:
1. Fleet mix based on Tier 2 Environmental Assessment, with exception of using INM aircraft type C130HNP instead of C130E. 2. Day/night split based on Updated IAD Activity Forecasts and Simulation, Hourly Distribution of Aircraft Arrivals (Table 3, p. 11) and
Departures (Table 4, p. 12) 3. Arrival/departure percentage split assumed 50%/50%. 4. Only available stage length with INM (Version 6.1) for INM aircraft types C130HP, DHC6 and KC135R is SL1. Stage length utilization for
L1011 and A310 based on average stage length utilization

App D-12 Page 8.doc\7/26/2005
D-12-8
Flight Profiles and Performance Data - INM contains reference noise and performance data on nearly all aircraft types operating at IAD, including aircraft with hushkits. Aircraft manufacturers provide the data to the FAA. The data are used to develop aircraft departure and arrival flight profiles, and the resultant noise exposure. Aircraft not specifically included in the database are modeled using appropriate substitution aircraft per the FAA’s pre-approved substitution list.
Flight profiles calculate the vertical paths of aircraft during departure and arrival to determine the altitude, speed, and engine thrust or power of an aircraft at any point along a flight track. INM uses this information to calculate noise exposure on the ground. Profiles are unique to each aircraft type and are based on user (e.g., airline) operation procedures, temperature, and aircraft weight.
Standard INM departure profiles were used in this document. Departing aircraft were modeled beginning with takeoff roll and ending when the aircraft reached an altitude of 10,000 feet above field elevation. The INM aircraft database contains departure flight profiles for each aircraft type, grouped by stage length. Stage length is a term used in airport planning and noise modeling referring to the distance in Nautical Air Miles (NM) to the destination airport. INM assumes each aircraft type’s weight increases with stage, or trip length, due to the need for more fuel, and also assumes each aircraft type’s takeoff distance and climb performance is different for each stage length. Heavy (long trip, high stage length) aircraft have increased takeoff distances and lower climb rates than lighter (short trip) aircraft, for a given aircraft type. Stage lengths are indexed according to the range of trip length. As shown in Appendix D-2, Table D-2.10, indices range from 1 through 7 for trip ranges of 500 NM to more than 4,500 NM, respectively. Tables D-12.2 through D-12.5 showed the distribution of departures by stage length.
The distribution of Air Passenger and Cargo departure operations among stage lengths was based on the destinations of the Forecast’s Year 2025 AWDPM schedule (event file) found in Appendix E of the Forecast. As using non-standard profiles was not within the scope of this study and because INM does not contain stage lengths other than stage length 1 for GA aircraft, GA/Air Taxi departure operations were constrained to stage length 1 (up to 500 nautical mile trip length). Identical to existing conditions, the distribution of Military jet departure operations among stage lengths was based on the resultant stage length distribution of all Air Passenger Wide-body Jets. Similarly, the distribution of Military turboprop operations among stage lengths as constrained to stage length 1 for the same reason provided above for the GA aircraft.
Arriving aircraft are not modeled with stage lengths as these aircraft consume most of their fuel during the flight, and land at typical landing weights. INM has a database of standard arrival flight profiles for each INM aircraft type. In accordance with FAA Order 1050.1E, arriving aircraft were modeled with a standard 3-degree descent angle for all approaches, beginning at an altitude of 7,000 feet above field elevation and ending with the aircraft touchdown and roll-out.
Appendix D-12 (6-11-05).doc
D-12-9
Annual Operations
Day Night
100% 600 0 1179
50% 1200 0 1179
100% 600 0 0
50% 1200 0 0100% 600 0 113150% 1200 0 1131
100% 200 30 050% 200 30 0Idle 200 30 0
Runw ay 19 L/R Hold-short area
191°
301°2
(turboprop)
2 (jet)
SF340
Dornier 328 DHC8 301°2 (turboprop)
Westwind / Astra
IA1125
Power Setting
(% RPM)
Duration per
Operation (seconds)
Canadair Regional
JetCL601
Runw ay 30 Hold-short
area
301°2 (jet)
Jetstream 41
Aircraft
INM Aircraft
ID Location
Magnetic Heading (degrees)
Number of Engines
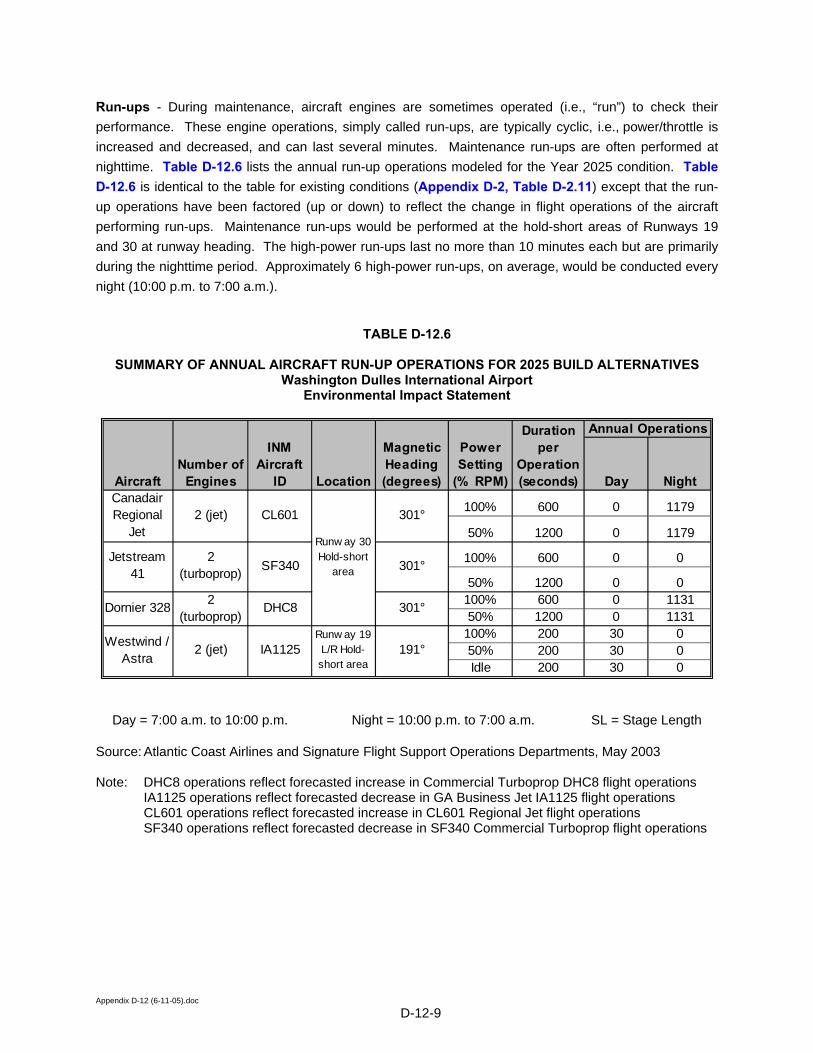
Run-ups - During maintenance, aircraft engines are sometimes operated (i.e., “run”) to check their performance. These engine operations, simply called run-ups, are typically cyclic, i.e., power/throttle is increased and decreased, and can last several minutes. Maintenance run-ups are often performed at nighttime. Table D-12.6 lists the annual run-up operations modeled for the Year 2025 condition. Table
D-12.6 is identical to the table for existing conditions (Appendix D-2, Table D-2.11) except that the run-up operations have been factored (up or down) to reflect the change in flight operations of the aircraft performing run-ups. Maintenance run-ups would be performed at the hold-short areas of Runways 19 and 30 at runway heading. The high-power run-ups last no more than 10 minutes each but are primarily during the nighttime period. Approximately 6 high-power run-ups, on average, would be conducted every night (10:00 p.m. to 7:00 a.m.).
TABLE D-12.6
SUMMARY OF ANNUAL AIRCRAFT RUN-UP OPERATIONS FOR 2025 BUILD ALTERNATIVES
Washington Dulles International Airport Environmental Impact Statement
Day = 7:00 a.m. to 10:00 p.m. Night = 10:00 p.m. to 7:00 a.m. SL = Stage Length
Source: Atlantic Coast Airlines and Signature Flight Support Operations Departments, May 2003 Note: DHC8 operations reflect forecasted increase in Commercial Turboprop DHC8 flight operations
IA1125 operations reflect forecasted decrease in GA Business Jet IA1125 flight operations CL601 operations reflect forecasted increase in CL601 Regional Jet flight operations SF340 operations reflect forecasted decrease in SF340 Commercial Turboprop flight operations

Appendix D-12 (6-11-05).doc
D-12-10
References FAA, 2002, Final Environmental Impact Statement, Potomac Consolidated TRACON Airspace Redesign, US Department of Transportation, Federal Aviation Administration, December 2002. HNTB, 2000, Aviation Activity Forecasts, Final Draft, HNTB Corporation, October 2000. HNTB, 2003, Washington Dulles International Airport Updated Activity Forecasts and Simulation, HNTB Corporation, November 2003.