appendix d: resolutions, documentsswrdc.org/content/files/planning/app_d.pdf · certificate of...
TRANSCRIPT
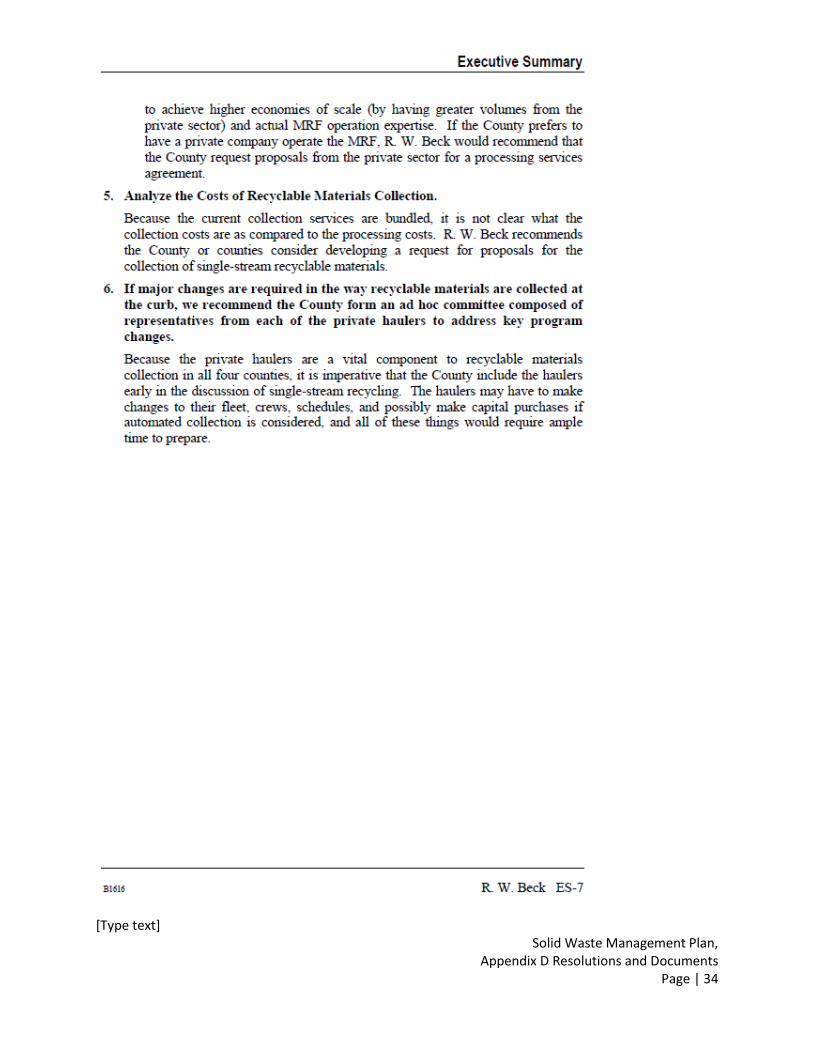
[Type text] Solid Waste Management Plan,
Appendix D Resolutions and Documents Page | 1
APPENDIX D: RESOLUTIONS, DOCUMENTS
RESOLUTION In Support of Lyon County Landfill Expansion Joint Review
of Certificate of Need Support of 50% Regional Recycling Rate ................................................... 2
Southwest Region 50 Percent Recycling Goal .............................................................................. 3
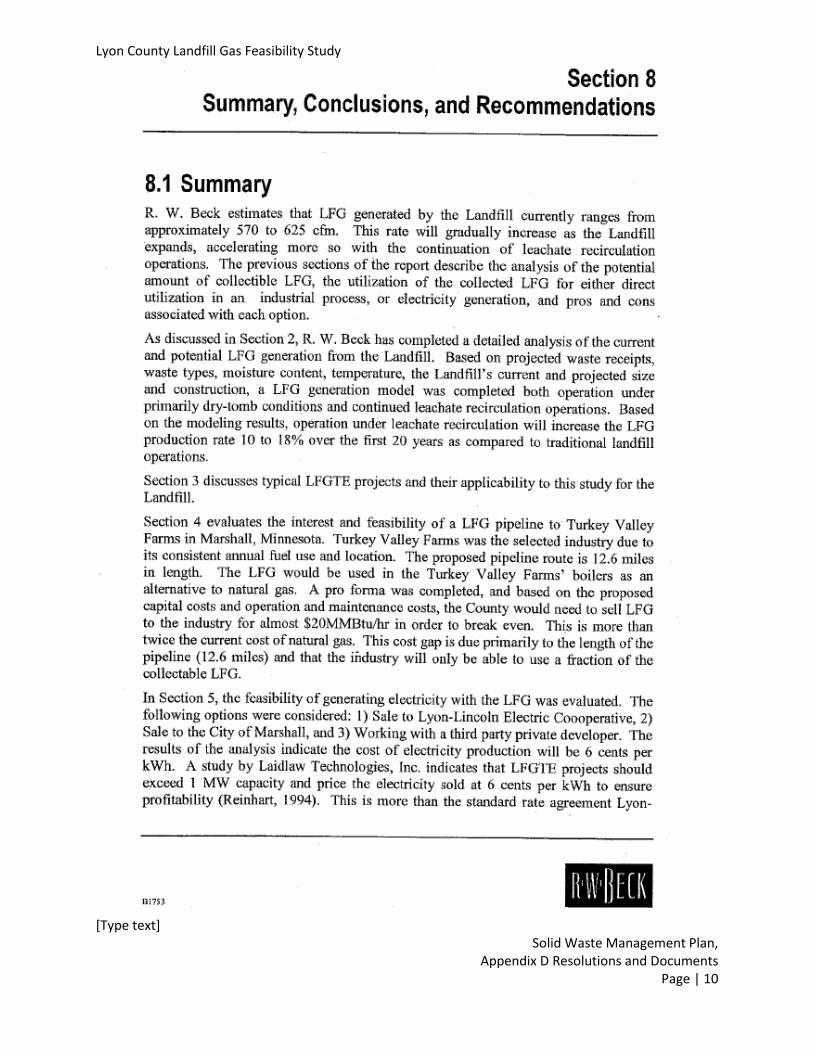
Lyon County Landfill Gas Feasibility Study Summary1 ................................................................ 10
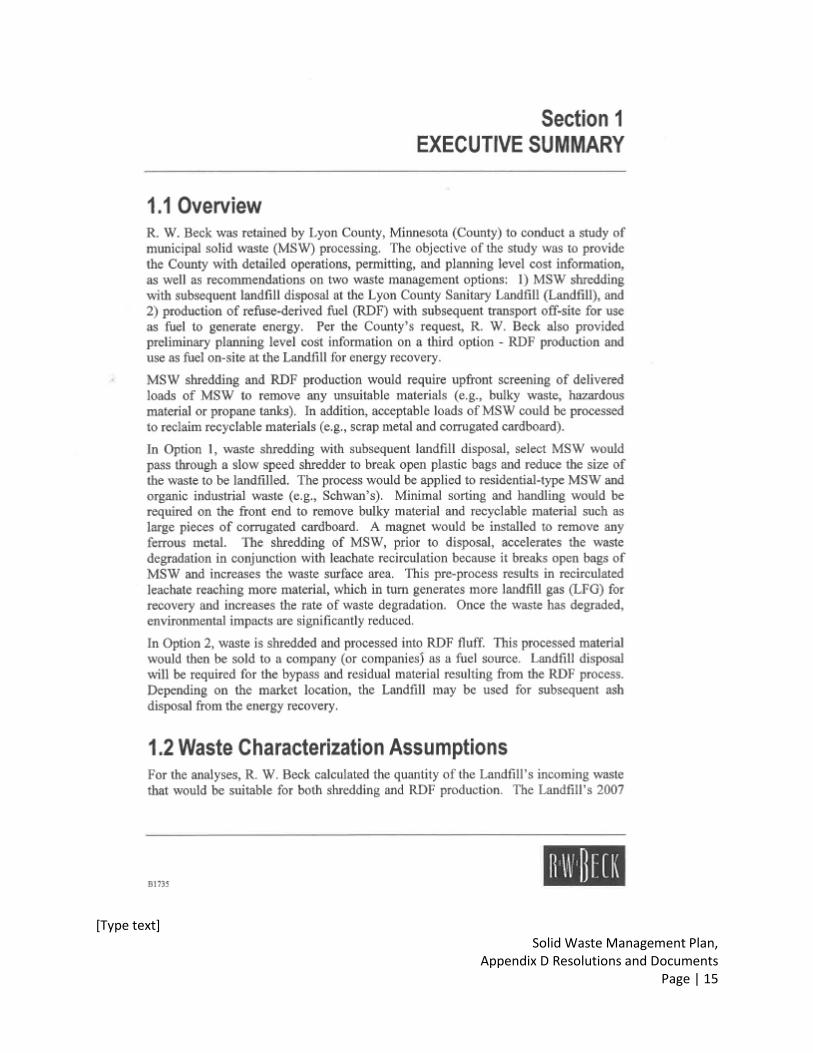
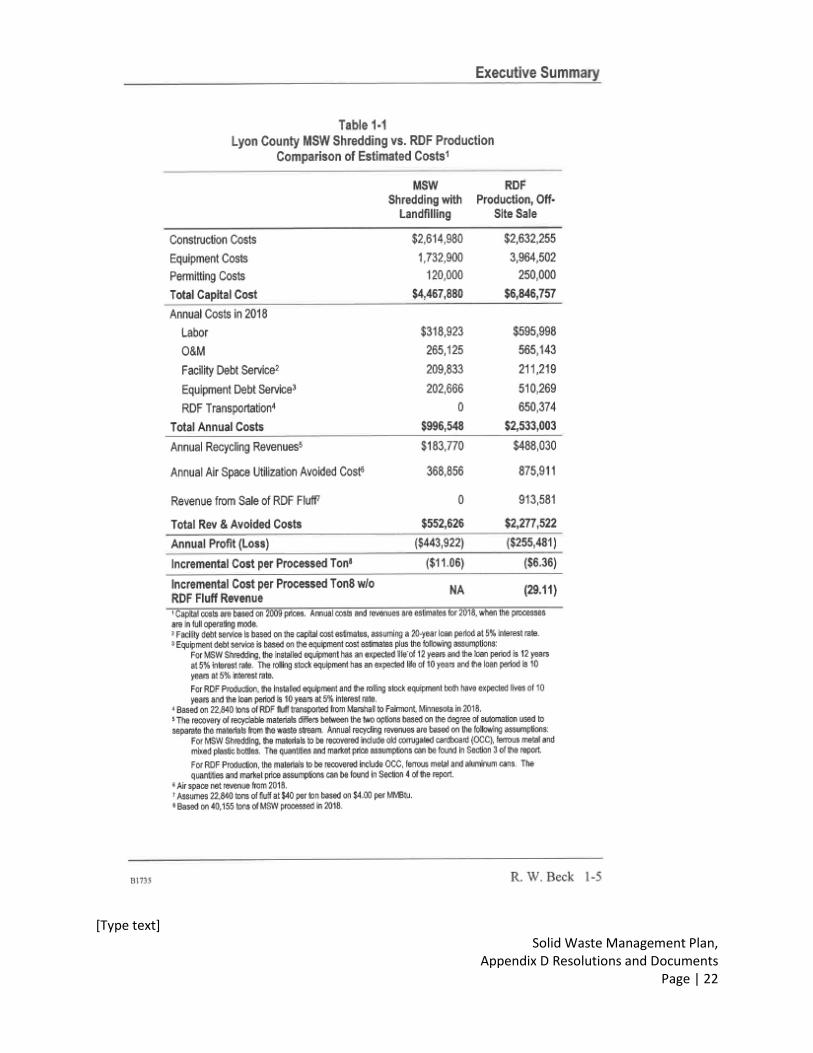
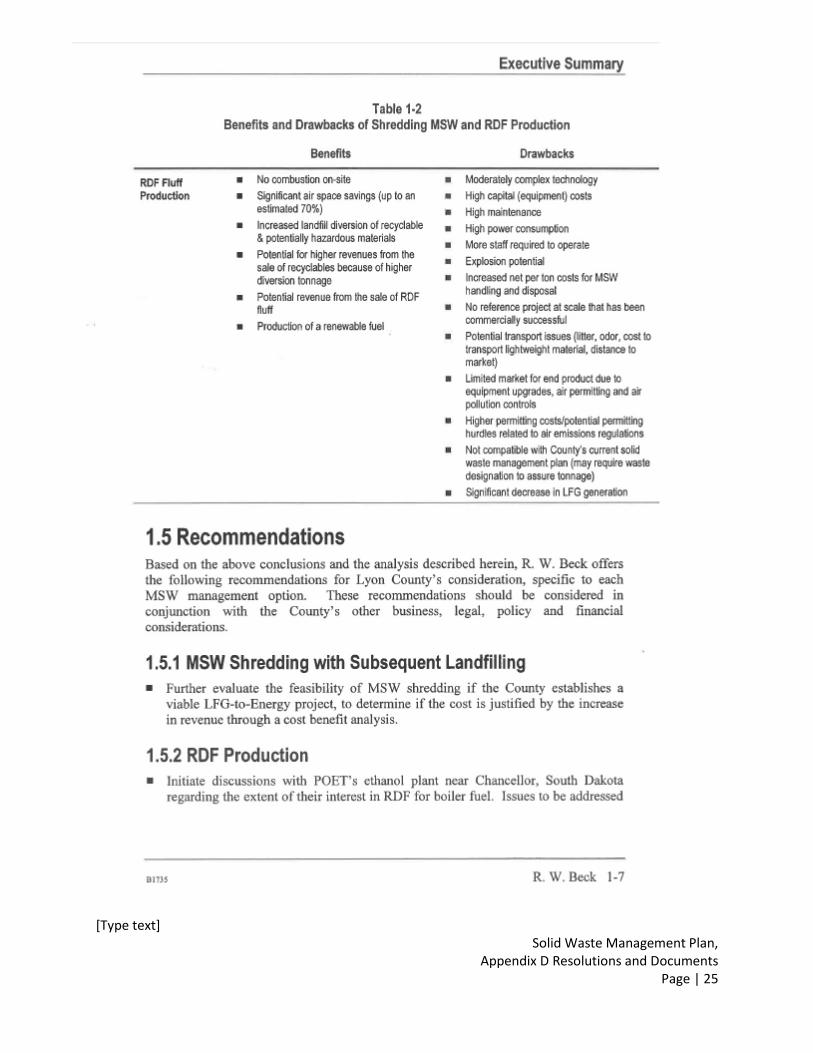
Lyon County Feasibility of Alternative Options for MSW Managements,
Executive Summary (2009)2 ........................................................................................................ 14
Lyon County Materials Recovery Facility Feasibility Study, Executive summary (2006)3 .......... 28
1 A copy of the full report is located in the Lyon County Environmental Office
2 A copy of the full study is located in the Lyon County Environmental Office
3 A copy of the full study is located in the Lyon County Environmental Office
[Type text] Solid Waste Management Plan,
Appendix D Resolutions and Documents Page | 2
RESOLUTION # In Support of Lyon County Landfill Expansion
Joint Review of Certificate of Need Support of 50% Regional Recycling Rate
Whereas, The Southwest Regional Solid Waste Commission is a twelve county Joint Powers Board, with its member counties located in the Southwest Minnesota. Whereas, The Southwest Regional Solid Waste Commission provide the greatest public service benefit possible for the entire contiguous twelve (12) county area encompassed by the Counties in planning, management, and implementation of methods to deal with solid waste in Southwest Minnesota. Whereas, Seven of the Twelve County membership of the Southwest Regional Solid Waste Commission waste goes to the Lyon County Regional Landfill. Whereas, The Southwest Regional Solid Waste Commission at its regularly scheduled meeting held March 26, 2007 passed to jointly review with the Minnesota Pollution Control Agency Lyon County’s Certificate of Need, following requirements of Minnesota Statutes 115A.917, 116D.04, Subd.2b, and Minnesota Rule 9215.890 to 9215.940. Whereas, The Southwest Solid Waste Administrators and the Southwest Regional Solid Waste Commission met, reviewed and discussed alternatives available to its members at their regularly scheduled meetings held in the months of May, July, September and November of 2007. Whereas, it was found there were no feasible and prudent alternatives available during this joint review to the counties located in the Southwest Region of Minnesota other than to increase recycling. Therefore, The Southwest Regional Solid Waste Commission supports and encourages Regional Recycling of 50% Recycling Rate (Base Rate) by 2014. Therefore, The Southwest Regional Solid Waste Commission will organize a Leadership Group on Recycling Initiatives to meet with the Southwest Solid Waste Administrators to develop a plan to conduct regional and individual county recycling activities, programs and improvements to meet 50% Regional Recycling Rate by 2014. Therefore, The Southwest Solid Waste Administrators will report to the newly established Leadership Group and to the Commission at their regularly scheduled meetings for their review, support and implementation. Therefore be it Resolved, The Southwest Regional Solid Waste Commission hereby supports the expansion of the Lyon County Regional Landfill and Regional Recycling Rate of 50% by 2014. Motion was made by Commissioner, __________________________________ and 2nd by Commissioner ____________________________ to adopt the resolution on this 28th day of January, 2008. ____________________________________ ______________________________ Chairman, Vice, Chairman
[Type text] Solid Waste Management Plan,
Appendix D Resolutions and Documents Page | 3
South West Region - 50 Percent Recycling Goal
Based upon the calendar year 2007 data, provided by Arlene Vee of the Minnesota Pollution Control Agency, the counties involved in the Southwest Regional Solid Waste Commission, have obtained a combined average recycling rate of 47.6 percent. The member counties’ 2008 base recycling rates range from 23.6 percent to 72.1 percent. Yard waste and source reduction credits taken by the respective counties are 7 to 8 percent. From the survey results obtained from the southwest regional counties, there are many commonalities, but also a fair degree of differences. The following statements are based upon the returned surveys from the member counties. Commonalities pertinent to this report include the following:
1. All counties report data from residential recycling. 2. Most counties report documented data from commercial recycling, and nearly as many
report some estimated commercial recycling data.
3. Most counties have all of their incorporated communities participating in curbside residential recycling pickup.
4. All counties provide some level of recycling drop off services for their rural residents
through recycling sheds, roll-off containers, or drop sites. 5. All counties provide educational programs and promotions through various venues to
maintain/increase public awareness of solid waste management and recycling programs.
6. Counties who have changed to single stream recycling have seen their recycling
tonnages increase. The examples cited by member counties, or other local units of government statewide, suggest increases of 30 to 50 percent, with some seeing increases of 100 percent.
7. Counties who have larger population centers with big box retailers, or businesses with
their own aggressive recycling programs, appear to be able to provide larger numbers in terms of recycling levels for corrugated cardboard and other fibers.
8. Generally, high recycling rate counties also have higher reported tonnages that are
generated by the commercial sector. Oftentimes, these tonnages are difficult to quantify and document because these generators are processing and marketing their own materials, without sending them through the county operated or contracted facility. Reporting by some of these businesses is sketchy at best.
Variances pertinent to this report would include the following:
1. Collection method for curbside recycling:
[Type text] Solid Waste Management Plan,
Appendix D Resolutions and Documents Page | 4
a. Three counties – single stream (all recyclables collected in one container) b. Three counties – dual stream (all recyclables collected into fibers and rigid
containers) c. Six counties – multi sort (recyclables collected into numerous categories)
In general, there is no direct correlation between the member counties recycling rates and the method of collection used in the counties. Where Counties have provided recycling carts (35-96 gal.) for single stream programs, an increase in participation rates have been experienced. Those counties who have changed to single stream have experienced an increase in recyclable tonnages.
2. There is a fairly substantial difference in what materials are accepted for recycling in the
various member counties. These differences may be attributed to several factors, such as who the contract haulers is, and where the materials are designated to be processed. As a rule, member counties that have their own processing facilities are often able to be more flexible as to what materials they are willing to accept. Key differences include:
a. Types of plastic containers accepted (#1, #2, #3, #4, and #5). Some counties accept
only #1 and #2 narrow necked containers, while others accept all five grades of plastic and films.
b. Types of cardboard and paper products accepted (paperboard/boxboard, junk mail, catalogs, phone books)
c. Glass acceptable (by various colors specifically) d. Non-typical materials such as light copper wire, plastic bags, pesticide containers,
etc.
3. There is additional variation between the member counties as to rules and requirements involving the management of solid waste and recyclables relating to ordinances, licensing, and promotion of recycling. The following information is based upon information provided by MPCA. a. Seven of the twelve counties currently have ordinances requiring residents to
recycle, and six also require businesses to recycle through their solid waste ordinance. In comparison to the statewide statistics, 21 of the 87 counties require residential recycling, and 20 of the 87 require business recycling.
b. Ten of the twelve counties require licensing for MSW haulers and nine of the twelve require recyclers to be licensed. This compares to just over half of the counties in the state having these requirements in place.
c. Six of the twelve counties have banned specific recyclables from landfills or the waste disposal system.
Relevant assessment factors that need to be considered to accomplish the goal of 50 percent
recycling rate by reporting year 2011 include the following:
1. Seek out more thorough and additional information from the commercial sector in our counties – simply gathering data from those commercial entities the counties may not have reached in the past. This would likely include a commercial sector audit, as most counties have indicated this has not been performed, and those who have performed

[Type text] Solid Waste Management Plan,
Appendix D Resolutions and Documents Page | 5
this, have indicated it has not been totally effective. Options counties could implement which may affect recycling total could include:
a. Consider developing a waste audit program with a goal to meet with all
commercial, institutional, and governmental entities along with programs to include waste haulers providing recycling services.
b. Consider ban on the disposal of recyclable materials.
2. Enhancing our residential recycling programs through activities and procedures that have been the most effective in our own member counties. This may include increased information and education, along with the possibility of adding an incentive to recycle (volume base, etc.) Options counties could implement which may affect recycling totals could include:
a. Consider development of a region wide, common recycling message that all
counties could use. This would provide a consistent message no matter where residents live, but individual county programs would still need to be promoted.
b. Consider developing region wide specific material recycling program for materials such as mattresses, carpets, etc.
c. Consider a ban on the disposal of recyclable materials
3. Monitor and evaluate the effectiveness of commercial recycling in our member counties. Research the possibility of adding commercial recycling collection into our contracts for hauling of recyclables. Work with contracted haulers to include this potential source for additional recycling tonnages.
4. Obtain information from those higher percentage recycling counties on what is included
in their reporting, in order to obtain more uniformity in the numbers reported. Enhancements to the annual reports could include recycling initiatives that are not being utilized in every county. Examples of this include the following:
a. Shoe recycling b. Mattress recycling c. An accounting of garage/yard sales d. An accounting of Goodwill and similar collection programs e. More accuracy in the accounting of on site waste disposal. More rural dwellers
are not active farmers and may be taking advantage of professional waste collection
f. Recycle away from home initiatives g. Education and enhancement of recycling benefits and programs in public schools
and post secondary education institutions h. Work with MPCA to refine some of the differences between “recycling” and
“beneficial use.” Continue to provide dialogue as to the source of additional tonnages that are not currently “reportable.” (tree debris ground into landscape mulch, tires for fuel, etc.)
5. Continue to make progress in our county and regional recycling rates, which have
generally been increasing from year to year. Attempt to determine if this is through

[Type text] Solid Waste Management Plan,
Appendix D Resolutions and Documents Page | 6
more recycling accomplishments, more complete reporting of recyclable tonnages, or combination of both. Envision what else can be done to continue this increase.
6. Explore educational or other mechanisms to decrease the amount of waste being
generated. Challenges looking forward:
1. Cities, who have organized collection of MSW and recyclables, have a “captive” audience. The service is provided, and their customers have a convenient way to participate. Rural residents do not have curbside, or home pickup service of recyclables. They can obtain MSW collection services from private waste haulers, but recyclable collection is through drop off sites. The breakdown of rural versus urban residents in the counties in the southwest region ranges from about 25 percent to nearly 45 percent being rural residents.
2. The value of recyclables, as can be validated by those counties who collect and market
their own recyclables, is much less than it was at the peak values from the recent past. The revenue derived from the sale of some recyclable products does not cover the costs associated with the collection, processing, storage, and transporting of goods.
3. Whether we live in communities, or in rural areas, we are all facing less stability in our
population base. Our population base is always changing, and more often than not, shrinking in the numbers of residents. We are seeing our collection costs continue to increase, and our population is decreasing. When we factor in the cost of collection only, we face a total recycling cost that is quite high.
4. The mix of people living in our communities and in our rural landscapes is changing
more rapidly than we had seen historically. People have moved off farms into town as the farms are sold off, or become part of a larger agricultural operation. Some people move to the country for what they perceive as peace, quiet, and the freedom to do anything they want. We are also facing some various degrees and types of diversity, which can prove to be challenging in obtaining cooperation in our environmental initiatives. The barriers we face may be language, political, cultural, or educational. Some of the key challenges appear to be some individuals lack of knowledge and/or lack of concern. The issues that we in the environmental field view as significant, may not even register with some members of the general public. It is our responsibility to find a way to reach these individuals. It is possible that we are going to have to rely less on traditional education and information practices, and look at other ways to educate our residents and our businesses. It is also possible that we are going to have to do this on a more frequent basis, simply because of the changing population.
5. Some member counties feel that additional enforcement efforts may be necessary to
boost recycling rates. As an example, if the burn barrel ban was initiated in the State of Minnesota, it would be necessary for member counties to assist with the enforcement of this ban. This ban would potentially add additional materials to the current recycling stream.
[Type text] Solid Waste Management Plan,
Appendix D Resolutions and Documents Page | 7
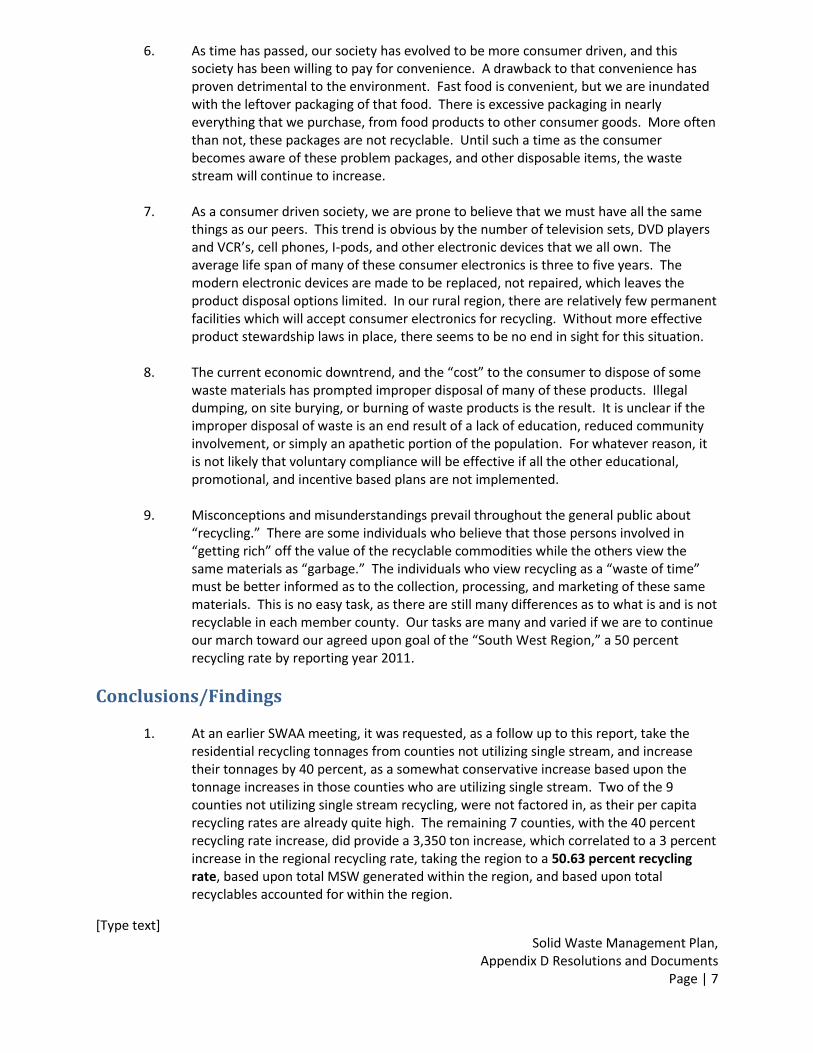
6. As time has passed, our society has evolved to be more consumer driven, and this society has been willing to pay for convenience. A drawback to that convenience has proven detrimental to the environment. Fast food is convenient, but we are inundated with the leftover packaging of that food. There is excessive packaging in nearly everything that we purchase, from food products to other consumer goods. More often than not, these packages are not recyclable. Until such a time as the consumer becomes aware of these problem packages, and other disposable items, the waste stream will continue to increase.
7. As a consumer driven society, we are prone to believe that we must have all the same
things as our peers. This trend is obvious by the number of television sets, DVD players and VCR’s, cell phones, I-pods, and other electronic devices that we all own. The average life span of many of these consumer electronics is three to five years. The modern electronic devices are made to be replaced, not repaired, which leaves the product disposal options limited. In our rural region, there are relatively few permanent facilities which will accept consumer electronics for recycling. Without more effective product stewardship laws in place, there seems to be no end in sight for this situation.
8. The current economic downtrend, and the “cost” to the consumer to dispose of some
waste materials has prompted improper disposal of many of these products. Illegal dumping, on site burying, or burning of waste products is the result. It is unclear if the improper disposal of waste is an end result of a lack of education, reduced community involvement, or simply an apathetic portion of the population. For whatever reason, it is not likely that voluntary compliance will be effective if all the other educational, promotional, and incentive based plans are not implemented.
9. Misconceptions and misunderstandings prevail throughout the general public about
“recycling.” There are some individuals who believe that those persons involved in “getting rich” off the value of the recyclable commodities while the others view the same materials as “garbage.” The individuals who view recycling as a “waste of time” must be better informed as to the collection, processing, and marketing of these same materials. This is no easy task, as there are still many differences as to what is and is not recyclable in each member county. Our tasks are many and varied if we are to continue our march toward our agreed upon goal of the “South West Region,” a 50 percent recycling rate by reporting year 2011.
Conclusions/Findings 1. At an earlier SWAA meeting, it was requested, as a follow up to this report, take the
residential recycling tonnages from counties not utilizing single stream, and increase their tonnages by 40 percent, as a somewhat conservative increase based upon the tonnage increases in those counties who are utilizing single stream. Two of the 9 counties not utilizing single stream recycling, were not factored in, as their per capita recycling rates are already quite high. The remaining 7 counties, with the 40 percent recycling rate increase, did provide a 3,350 ton increase, which correlated to a 3 percent increase in the regional recycling rate, taking the region to a 50.63 percent recycling rate, based upon total MSW generated within the region, and based upon total recyclables accounted for within the region.
[Type text] Solid Waste Management Plan,
Appendix D Resolutions and Documents Page | 8
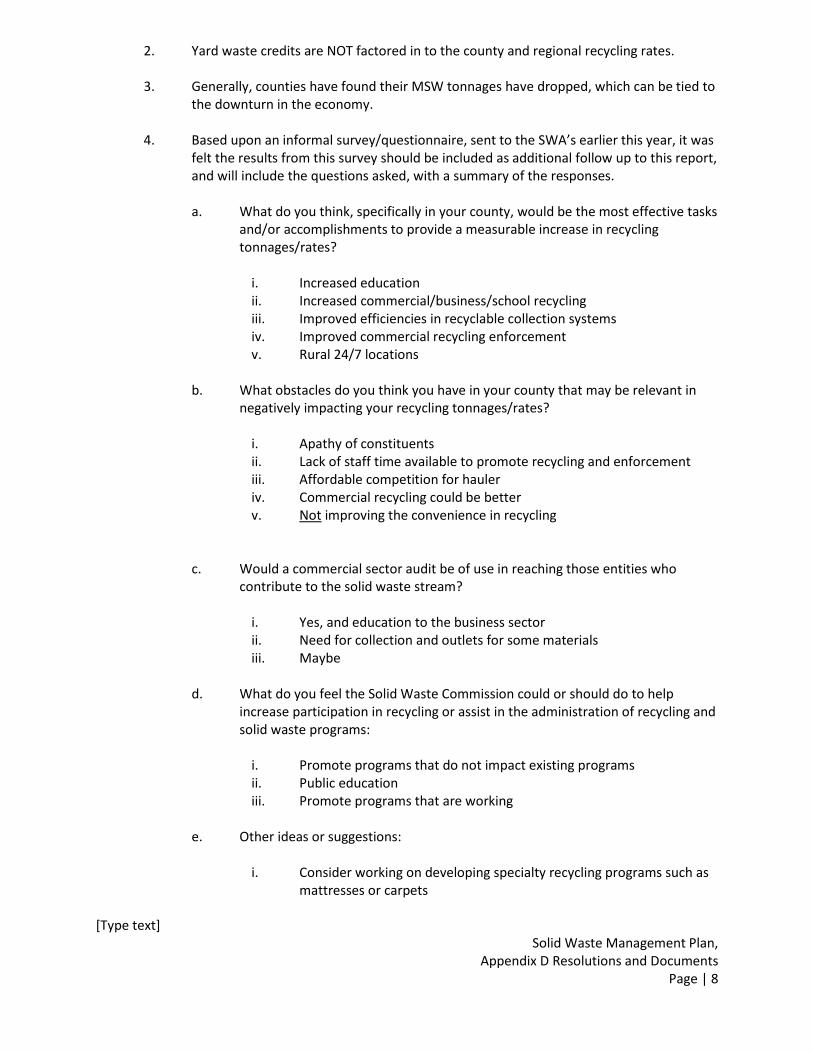
2. Yard waste credits are NOT factored in to the county and regional recycling rates. 3. Generally, counties have found their MSW tonnages have dropped, which can be tied to
the downturn in the economy. 4. Based upon an informal survey/questionnaire, sent to the SWA’s earlier this year, it was
felt the results from this survey should be included as additional follow up to this report, and will include the questions asked, with a summary of the responses.
a. What do you think, specifically in your county, would be the most effective tasks
and/or accomplishments to provide a measurable increase in recycling tonnages/rates?
i. Increased education ii. Increased commercial/business/school recycling iii. Improved efficiencies in recyclable collection systems iv. Improved commercial recycling enforcement v. Rural 24/7 locations
b. What obstacles do you think you have in your county that may be relevant in negatively impacting your recycling tonnages/rates?
i. Apathy of constituents ii. Lack of staff time available to promote recycling and enforcement iii. Affordable competition for hauler iv. Commercial recycling could be better v. Not improving the convenience in recycling
c. Would a commercial sector audit be of use in reaching those entities who contribute to the solid waste stream?
i. Yes, and education to the business sector ii. Need for collection and outlets for some materials iii. Maybe
d. What do you feel the Solid Waste Commission could or should do to help
increase participation in recycling or assist in the administration of recycling and solid waste programs:
i. Promote programs that do not impact existing programs ii. Public education iii. Promote programs that are working
e. Other ideas or suggestions:
i. Consider working on developing specialty recycling programs such as mattresses or carpets

[Type text] Solid Waste Management Plan,
Appendix D Resolutions and Documents Page | 9
ii. The SWA meetings do provide more ideas to bring back to our respective counties
iii. Focus on specific sectors at the SWA meetings, such as commercial recycling
f. What joint/regional activities do you feel would assist you in increasing recycling
or increasing the dollar value in your recycling activities?
i. Development of a regionwide recycling message that all counties would promote
ii. Joint activities such as CRT collections iii. Joint efforts to obtain regionalized staff, such as efforts made earlier iv. Joint programs and joint purchasing v. Licensing for all waste haulers throughout the region vi. Regionwide efforts and access to information in specific county
recycling contracts vii. Regionwide efforts and access to information in specific county solid
waste ordinances viii. Waste composition study
[Type text] Solid Waste Management Plan,
Appendix D Resolutions and Documents Page | 10
Lyon County Landfill Gas Feasibility Study

[Type text] Solid Waste Management Plan,
Appendix D Resolutions and Documents Page | 11

[Type text] Solid Waste Management Plan,
Appendix D Resolutions and Documents Page | 12

[Type text] Solid Waste Management Plan,
Appendix D Resolutions and Documents Page | 13
[Type text] Solid Waste Management Plan,
Appendix D Resolutions and Documents Page | 14
[Type text] Solid Waste Management Plan,
Appendix D Resolutions and Documents Page | 15

[Type text] Solid Waste Management Plan,
Appendix D Resolutions and Documents Page | 16

[Type text] Solid Waste Management Plan,
Appendix D Resolutions and Documents Page | 17

[Type text] Solid Waste Management Plan,
Appendix D Resolutions and Documents Page | 18

[Type text] Solid Waste Management Plan,
Appendix D Resolutions and Documents Page | 19

[Type text] Solid Waste Management Plan,
Appendix D Resolutions and Documents Page | 20

[Type text] Solid Waste Management Plan,
Appendix D Resolutions and Documents Page | 21
[Type text] Solid Waste Management Plan,
Appendix D Resolutions and Documents Page | 22

[Type text] Solid Waste Management Plan,
Appendix D Resolutions and Documents Page | 23

[Type text] Solid Waste Management Plan,
Appendix D Resolutions and Documents Page | 24
[Type text] Solid Waste Management Plan,
Appendix D Resolutions and Documents Page | 25

[Type text] Solid Waste Management Plan,
Appendix D Resolutions and Documents Page | 26
[Type text] Solid Waste Management Plan,
Appendix D Resolutions and Documents Page | 27
[Type text] Solid Waste Management Plan,
Appendix D Resolutions and Documents Page | 28

[Type text] Solid Waste Management Plan,
Appendix D Resolutions and Documents Page | 29
[Type text] Solid Waste Management Plan,
Appendix D Resolutions and Documents Page | 30
[Type text] Solid Waste Management Plan,
Appendix D Resolutions and Documents Page | 31
[Type text] Solid Waste Management Plan,
Appendix D Resolutions and Documents Page | 32

[Type text] Solid Waste Management Plan,
Appendix D Resolutions and Documents Page | 33
[Type text] Solid Waste Management Plan,
Appendix D Resolutions and Documents Page | 34

[Type text] Solid Waste Management Plan,
Appendix D Resolutions and Documents Page | 35