appendix e hydraulic design and evaluation of hydraulic ... broken down/appendix...1 cespk-ed-dh...
TRANSCRIPT

Appendix E
Hydraulic Design and Evaluation of Hydraulic Effects in the Mayhew Drain Area Associated with the American River Projects


1
CESPK-ED-DH February 2008 MEMORANDUM FOR RECORD SUBJECT: Mayhew Drain Closure Structure Hydraulic Design and Evaluation of Hydraulic Effects in the Mayhew Drain Area Associated With the American River Projects 1. Introduction The American River Projects consist of the Common Features Project and the Folsom Dam Modifications and Raise Projects. The Common Features Project was authorized by Congress as part of two WRDA bills in 1996 and 1999 (Public Laws 104-303 and 106-53, respectively). This project included a number of infrastructure features that were common to multiple flood damage reduction alternatives under consideration at that time, including seepage cutoff walls along the American River levees, a levee raise and seepage cutoff walls along the American River immediately east of Mayhew Drain, and a closure structure on Mayhew Drain. The Folsom Modification Project was authorized as part of WRDA 1999 and amended as part of the Energy and Water Development Appropriation Act of 2006 (Public Laws 106-53 and 109-103, respectively). The Folsom Dam Raise Project was authorized as part of the Energy and Water Development Appropriation Act of 2004 (Public Law 108-137). Under pre-Common Features conditions, the American River backs up Mayhew Drain during high flows. A closure structure is authorized as part of the Common Features Project along Mayhew Drain to prevent interior flooding from the American River as well as a possible levee breach along the Mayhew Drain. This Memorandum for Record summarizes the design methodology for the closure structure outlet culverts, based on design work completed in March 2007. The hydraulic model was further refined in late 2007 to provide additional information on the hydraulic effects of the American River Projects in the vicinity of the Mayhew Drain. The hydraulic effects of the closure structure were considered in the context of the entire Common Features Project. The closure structure is not a separable item within the authorized Common Features Project because the project would not function as designed without this feature. This memorandum summarizes an analysis of the hydraulic effects of the Common Features Project in the vicinity of the Mayhew Drain for four representative American River flood conditions. In addition, this memo includes a summary of the hydraulic effects of the Common Features Project when combined in the future with the Folsom Dam Modification and Raise Project. 2. References
1. Chow, V.T. Open-Channel Hydraulics. 1959. 2. Fontaine. Series 70 Square and Rectangular Flap Gates. PDF accessed at:
http://www.hfontaine.com/produit.php?product_id=9&cat_id=4 on May 30, 2007. 3. Rodney Hunt. Large flap valve chart provided by Mr. Gayle Williams on May 14,
2007 via email.

CESPK-ED-DH February 2008
2
4. Sacramento Area Flood Control Agency. Hydrologic and Hydraulic Studies Related to the Closure Structure at Mayhew Drain – Draft Technical Memorandum, February 2001.
5. United States Army Corps of Engineers. Hydraulic Design Criteria, Sheet 340-1, Flap Gates, Head Loss Coefficients. Revised November 1987.
6. United States Army Corps of Engineers. Feasibility Report, American River Watershed Investigation, California, December 1991.
7. United States Army Corps of Engineers. ETL-1110-2-367, Interior Flood Hydrology, March 31, 1995.
8. United States Army Corps of Engineers. Supplemental Information Report, American River Watershed Project, California, March 1996.
9. American River Watershed Project, California, 1st Addendum to the Supplemental Information Report, August 1997.
10. United States Army Corps of Engineers. American River Watershed Project, California, 2nd Addendum to the Supplemental Information Report, March 2002.
11. United States Army Corps of Engineers. Post Authorization Change Report, American River Watershed Project, Folsom Dam Modification and Folsom Dam Raise Projects, 2007.
3. Summary of Authorized Common Features Project and Folsom Modifications and Raise Projects The large flood event of 1986 prompted the Sacramento District of the Corps of Engineers to re-analyze the flood threat for the City and County, and it was determined that the greater Sacramento area had roughly a 65-year level of protection, as documented in Reference 6. At larger flows, control would likely be lost at Folsom Dam and flows much greater than the American River channel capacity would be released with a likely outcome of levee failures in the greater Sacramento area, including the areas both east and west of the Mayhew Drain. Levee failures in these locations would generate flood depths of 5 to 10 feet in the neighborhoods south of the American River. In partial response to this identified flood risk, levee improvements were authorized by Congress as part of WRDA 1996. These improvements, for the most part, involved construction of seepage cutoff walls along 22 miles of American River levees. Part of this included the stretch of American River up to the west levee of the Mayhew Drain. Further levee improvements were authorized by Congress as part of WRDA 1999. This additional authorization included improvements to the American River levee upstream of the Mayhew Drain so that it had the same protection as the American River levee below the Mayhew Drain. It was determined by the District that a three foot levee raise, construction of a seepage cutoff wall in this area and the Mayhew Drain closure structure would provide the same river conveyance capacity as the WRDA 1996 features. These WRDA 1996 and WRDA 1999 features are commonly referred to as the American River portion of the Common Features Project. WRDA 1996 also authorized Folsom Reoperation and this is considered part of the Common Features analysis. Besides the Common Features Project, other work in the overall American River Watershed Program includes the Folsom Dam Modifications Project and the Folsom Dam Raise Project. These two Folsom Dam projects further reduce the risk of flooding to the Sacramento area. This memorandum summarizes the hydraulic design of the
CESPK-ED-DH February 2008
3
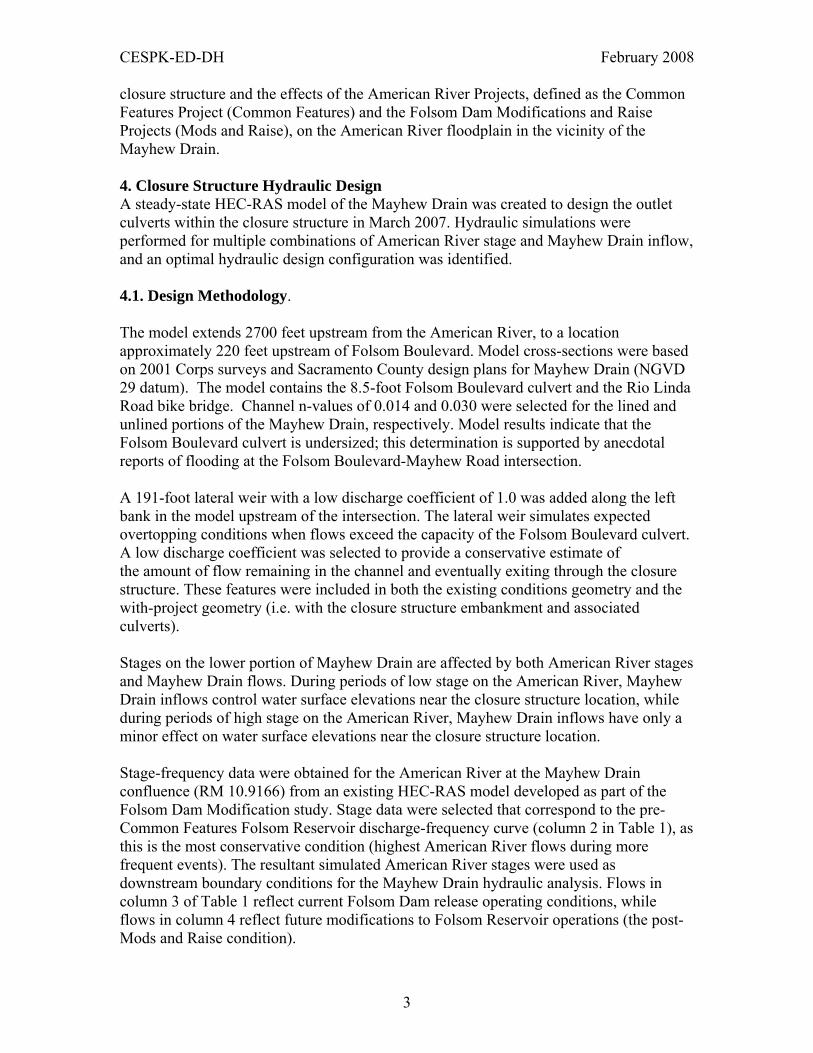
closure structure and the effects of the American River Projects, defined as the Common Features Project (Common Features) and the Folsom Dam Modifications and Raise Projects (Mods and Raise), on the American River floodplain in the vicinity of the Mayhew Drain. 4. Closure Structure Hydraulic Design A steady-state HEC-RAS model of the Mayhew Drain was created to design the outlet culverts within the closure structure in March 2007. Hydraulic simulations were performed for multiple combinations of American River stage and Mayhew Drain inflow, and an optimal hydraulic design configuration was identified. 4.1. Design Methodology. The model extends 2700 feet upstream from the American River, to a location approximately 220 feet upstream of Folsom Boulevard. Model cross-sections were based on 2001 Corps surveys and Sacramento County design plans for Mayhew Drain (NGVD 29 datum). The model contains the 8.5-foot Folsom Boulevard culvert and the Rio Linda Road bike bridge. Channel n-values of 0.014 and 0.030 were selected for the lined and unlined portions of the Mayhew Drain, respectively. Model results indicate that the Folsom Boulevard culvert is undersized; this determination is supported by anecdotal reports of flooding at the Folsom Boulevard-Mayhew Road intersection. A 191-foot lateral weir with a low discharge coefficient of 1.0 was added along the left bank in the model upstream of the intersection. The lateral weir simulates expected overtopping conditions when flows exceed the capacity of the Folsom Boulevard culvert. A low discharge coefficient was selected to provide a conservative estimate of the amount of flow remaining in the channel and eventually exiting through the closure structure. These features were included in both the existing conditions geometry and the with-project geometry (i.e. with the closure structure embankment and associated culverts). Stages on the lower portion of Mayhew Drain are affected by both American River stages and Mayhew Drain flows. During periods of low stage on the American River, Mayhew Drain inflows control water surface elevations near the closure structure location, while during periods of high stage on the American River, Mayhew Drain inflows have only a minor effect on water surface elevations near the closure structure location. Stage-frequency data were obtained for the American River at the Mayhew Drain confluence (RM 10.9166) from an existing HEC-RAS model developed as part of the Folsom Dam Modification study. Stage data were selected that correspond to the pre-Common Features Folsom Reservoir discharge-frequency curve (column 2 in Table 1), as this is the most conservative condition (highest American River flows during more frequent events). The resultant simulated American River stages were used as downstream boundary conditions for the Mayhew Drain hydraulic analysis. Flows in column 3 of Table 1 reflect current Folsom Dam release operating conditions, while flows in column 4 reflect future modifications to Folsom Reservoir operations (the post-Mods and Raise condition).

CESPK-ED-DH February 2008
4
Table 1: Flow Frequency Data for the American River Downstream of Folsom Dam Flow Frequency
Computed Return Period, yrs
Pre-Common Features Peak Folsom Dam Release, cfs
Post-Common Features Peak Folsom Dam Release, cfs
Post-Mods and Raise Peak Folsom Dam Release, cfs
15 115,000 115,000 115,000 50 115,000 115,000 115,000 63 115,000 115,000 115,000 85 180,000 N/A 115,000 100 234,000 160,000 115,000 200 432,000 432,000 160,000 250 530,000 N/A 188,000 400 543,000 N/A 449,000 500 578,000 578,000 534,000
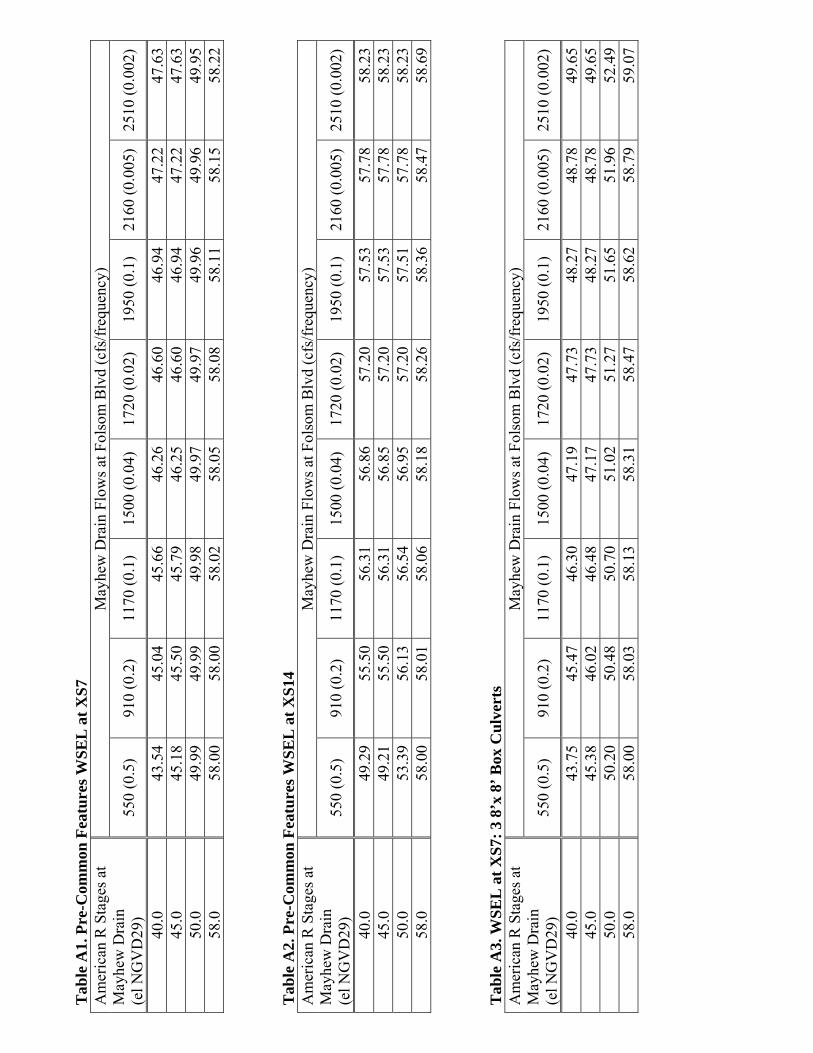
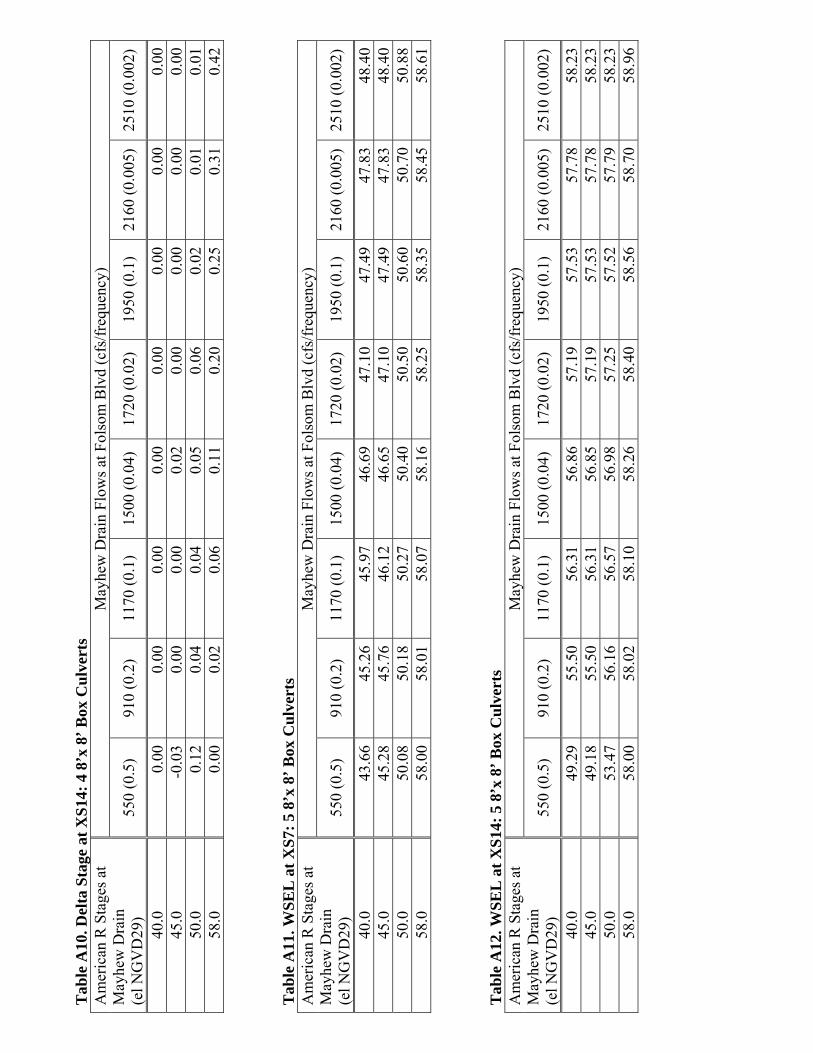
The flows shown for the pre-Common Features time frame are as reported in the 1991 Feasibility Study (Reference 6). The post-Common Features flows are as reported in the 1996 Supplemental Information Report (Reference 8). The post-Mods and Raise flows are as reported in the 2007 PAC Report (Reference 11). Mayhew Drain inflows were obtained from an existing HEC-1 model developed by Camp, Dresser, and McKee, Inc. as part of a March 2001 study completed for SAFCA (Reference 4). Flows were available for the 0.5, 0.2, 0.1, 0.04, 0.02, 0.01, 0.005, and 0.002 probability events. These models were reviewed, found to be satisfactory for this analysis, and used to generate peak flows for the above probability events. 4.2. Design Results. Hydraulic simulations were performed for multiple combinations of American River stage and Mayhew Drain inflows. Several different closure structure culvert configurations were evaluated: 1) two 9’x 9’ box culverts; 2) three 9’x 9’ box culverts; 3) three 8’x 8’ box culverts; 4) four 8’x 8’ box culverts; and 5) five 8’x 8’ box culverts. It was eventually determined that an 8-foot flap gate was a standard size, while a 9-foot flap gate would require a special order. Analyses then focused on a design configuration utilizing a standard 8-foot culvert dimension. It was found that the largest incremental decrease in stage occurred between three 8’x 8’ box culverts and four 8’x 8’ box culverts. Adding a fifth culvert produced only a small incremental decrease in stage at relatively frequent flows. A set of four 8’x 8’ box culverts was selected as the final design based on this optimization analysis. The results of these analyses are summarized in Tables A1 through A14 in Appendix A. 5. American River Projects Hydraulic Effects Analysis Methodology. Local agency concerns about the hydraulic effects of the closure structure prompted further investigation into this subject in late 2007. The existing HEC-RAS model was refined and converted to an unsteady model to allow assessment of volume-related effects. In addition, an existing FLO-2D model of the south American River floodplain was utilized to evaluate extents of overland flooding.

CESPK-ED-DH February 2008
5
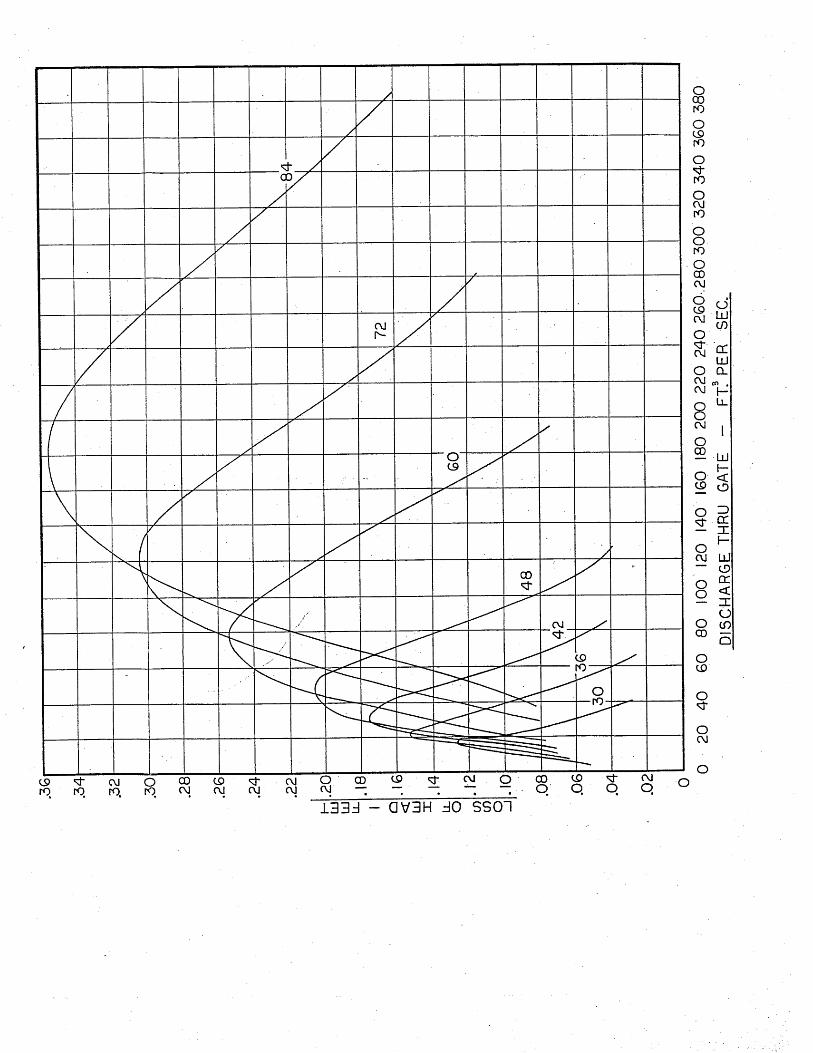
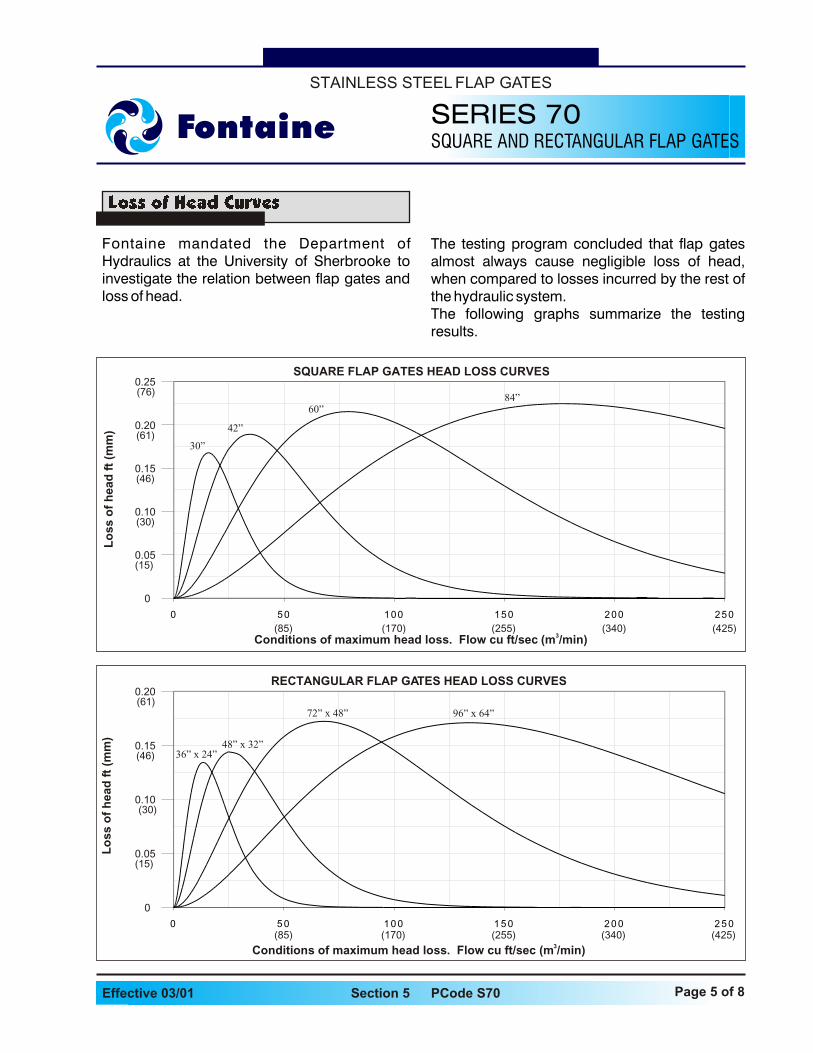
Three American River flood event scenarios were evaluated: 1) a low flow which did not create a risk of levee failure under pre-Common Features conditions, referred to herein as a non-failure flow; 2) the 100-year flow; and 3) the 200-year flow. A brief description of flood conditions is also included for flows above the post-Mods and Raise capacity of the system. 5.1. HEC-RAS Model Setup. The existing HEC-RAS model used for the closure structure outlet design was refined as follows. The model was extended an additional 100 feet upstream to reduce boundary condition effects on the lateral weir at Folsom Boulevard. Channel n-values were raised from 0.014 to 0.030 along the uppermost 250 feet of the model channel, based on a site review that indicated that this portion of the channel lacked the concrete lining observed further downstream. The hydraulic model was not calibrated, as no calibration data were available for this portion of the Mayhew Drain. A sensitivity analysis was performed on the n-values as part of the refinement effort, however, to evaluate the effects of increasing and decreasing the selected roughness coefficients. The results of this analysis are presented in Section 6.2. The Mayhew Drain inflow hydrographs obtained from SAFCA exhibit periodic rapid increases and decrease during low flows that appear to be an artifact of the HEC-1 modeling process. These minor ‘spikes’ were removed from the inflow hydrographs to increase stability of the unsteady HEC-RAS model. The closure structure gate loss assumptions were reviewed for this analysis. Because HEC-RAS does not have a direct method of modeling flap gates, an estimate of the flap gate loss was made from available literature and included in the model by increasing the exit loss. Three sources were reviewed for selection of an appropriate flap gate loss: USACE Hydraulic Design Criteria Sheet 340-1, Flap Gates Head Loss Coefficients; Rodney Hunt gate loss data; and Fontaine gate loss data (see Appendix B). Each reference identified a slightly different flap gate loss. USACE Hydraulic Design Criteria Sheet 340-1 is based on tests of submerged 18- to 30-inch diameter gates, and resulted in a loss of 0.35 feet for the final project design at peak flow. Rodney Hunt is the manufacturer of the current project gates, but did not have gate loss data specific to the 8-foot by 8-foot project gates. Rodney Hunt instead provided a loss chart for circular flap gates up to 7 feet in diameter. The resultant maximum gate loss was about 0.35 feet for a flow of 180 cfs; at the peak project design discharge of 240 cfs per culvert, the gate loss was 0.32 feet. Finally, flap gate loss data were available from another manufacturer, Fontaine, for gates very similar in size and dimension to the project gates. The maximum loss estimated from the Fontaine data for a 7-foot square gate was 0.23 feet at 175 cfs, or about 0.21 feet at the 240 cfs design flow. After review of these sources, a final flap gate loss value of 0.35 feet was selected for use in the HEC-RAS model. This value was generated in the model by increasing the exit loss to 1.8 so that a head loss of 0.35 feet was achieved at the structure exit for the peak project design discharge of 240 cfs.
CESPK-ED-DH February 2008
6
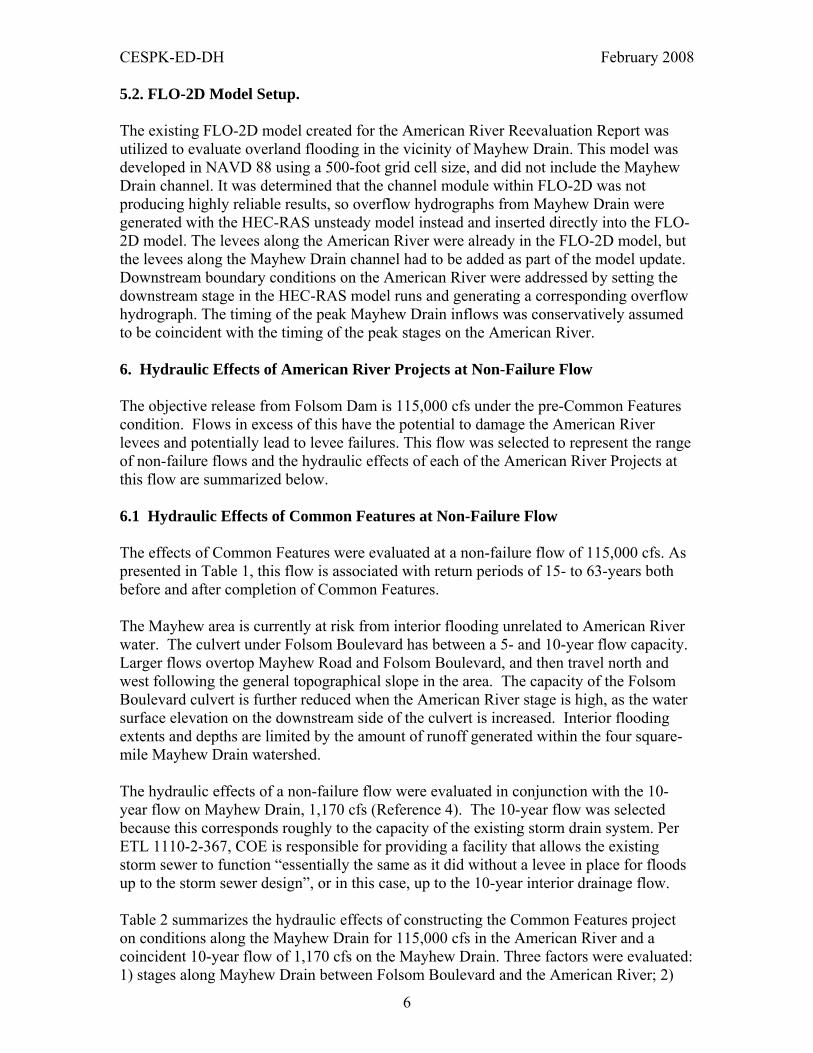
5.2. FLO-2D Model Setup. The existing FLO-2D model created for the American River Reevaluation Report was utilized to evaluate overland flooding in the vicinity of Mayhew Drain. This model was developed in NAVD 88 using a 500-foot grid cell size, and did not include the Mayhew Drain channel. It was determined that the channel module within FLO-2D was not producing highly reliable results, so overflow hydrographs from Mayhew Drain were generated with the HEC-RAS unsteady model instead and inserted directly into the FLO-2D model. The levees along the American River were already in the FLO-2D model, but the levees along the Mayhew Drain channel had to be added as part of the model update. Downstream boundary conditions on the American River were addressed by setting the downstream stage in the HEC-RAS model runs and generating a corresponding overflow hydrograph. The timing of the peak Mayhew Drain inflows was conservatively assumed to be coincident with the timing of the peak stages on the American River. 6. Hydraulic Effects of American River Projects at Non-Failure Flow The objective release from Folsom Dam is 115,000 cfs under the pre-Common Features condition. Flows in excess of this have the potential to damage the American River levees and potentially lead to levee failures. This flow was selected to represent the range of non-failure flows and the hydraulic effects of each of the American River Projects at this flow are summarized below. 6.1 Hydraulic Effects of Common Features at Non-Failure Flow The effects of Common Features were evaluated at a non-failure flow of 115,000 cfs. As presented in Table 1, this flow is associated with return periods of 15- to 63-years both before and after completion of Common Features. The Mayhew area is currently at risk from interior flooding unrelated to American River water. The culvert under Folsom Boulevard has between a 5- and 10-year flow capacity. Larger flows overtop Mayhew Road and Folsom Boulevard, and then travel north and west following the general topographical slope in the area. The capacity of the Folsom Boulevard culvert is further reduced when the American River stage is high, as the water surface elevation on the downstream side of the culvert is increased. Interior flooding extents and depths are limited by the amount of runoff generated within the four square-mile Mayhew Drain watershed. The hydraulic effects of a non-failure flow were evaluated in conjunction with the 10-year flow on Mayhew Drain, 1,170 cfs (Reference 4). The 10-year flow was selected because this corresponds roughly to the capacity of the existing storm drain system. Per ETL 1110-2-367, COE is responsible for providing a facility that allows the existing storm sewer to function “essentially the same as it did without a levee in place for floods up to the storm sewer design”, or in this case, up to the 10-year interior drainage flow. Table 2 summarizes the hydraulic effects of constructing the Common Features project on conditions along the Mayhew Drain for 115,000 cfs in the American River and a coincident 10-year flow of 1,170 cfs on the Mayhew Drain. Three factors were evaluated: 1) stages along Mayhew Drain between Folsom Boulevard and the American River; 2)

CESPK-ED-DH February 2008
7
peak flow leaving the channel at Folsom Boulevard; and 3) total volume of flow leaving the channel at Folsom Boulevard. Table 2. Hydraulic Effects of Common Features on Mayhew Drain at 115,000 cfs WSEL at Cross-
Section 7 (ft NGVD 29)
Peak Flow Leaving Channel at Folsom Blvd (cfs)
Volume of Flow Leaving Channel at Folsom Blvd (ac-ft)
Pre-Common Features 50.08 202 8.61 Post-Common Features 50.46 204 8.79 Delta +0.38 +2
(1.0% increase) +0.18
(2.1% increase) The stage at Cross-Section 7, which is located between the closure structure and Folsom Boulevard (see Figure 1), increases by 0.38 ft with construction of the Common Features Project. The resultant stage, 50.46 ft, does not cause flooding in any adjacent areas. The crown of Folsom Boulevard is at about 55.5 ft and the top of the parapet wall on the pedestrian bridge across Mayhew Drain is at 57.8 ft. One storm drain discharges to the east side of Mayhew Drain downstream of Folsom Boulevard. The lowest drainage inlet connected to that storm drain is located in the neighborhood to the northeast of the Folsom Boulevard-Mayhew Road intersection, and has a grate elevation of 53.2 ft. With a post-Common Features difference of 2.7 feet between the grate inlet and water surface elevations in Mayhew Drain, the stage in Mayhew Drain downstream of Folsom Boulevard will not cause flooding in the adjacent, hydraulically connected neighborhood. Figure 2 presents water surface profiles along the Mayhew Drain for both pre- and post-Common Features conditions. The peak flow leaving the Mayhew Drain channel due to the undersized culvert at Folsom Boulevard will increase by 2 cfs under post-Common Features conditions. This corresponds to a 1.0% increase over the pre-Common Features peak. The total volume of interior flow leaving the Mayhew Drain channel due to the undersized culvert at Folsom Boulevard will increase by 0.18 acre-feet. This is a 2.1% increase in total volume over pre-Common Features conditions. Overtopping flows that leave the Mayhew Drain channel upstream of Folsom Boulevard are unconfined and travel across the floodplain, following the general ground slope to the west. Flow depths can reasonably be assumed to disperse to a depth of 3 to 6 inches due to the unconfined nature of the flow. At a depth of 3 inches, the additional volume of water estimated to leave the Mayhew Drain (0.18 acre-feet) is equivalent to a 177’ by 177’ area, and at a depth of 6 inches, the additional volume of water is equivalent to a 125’ by 125’ area. Based on this evaluation, the estimated increases in peak discharge and total overflow volume are not considered significant and the Common Features Project is therefore not considered to impact the Mayhew area under a non-failure flow of 115,000 cfs on the American River.
CESPK-ED-DH February 2008
8
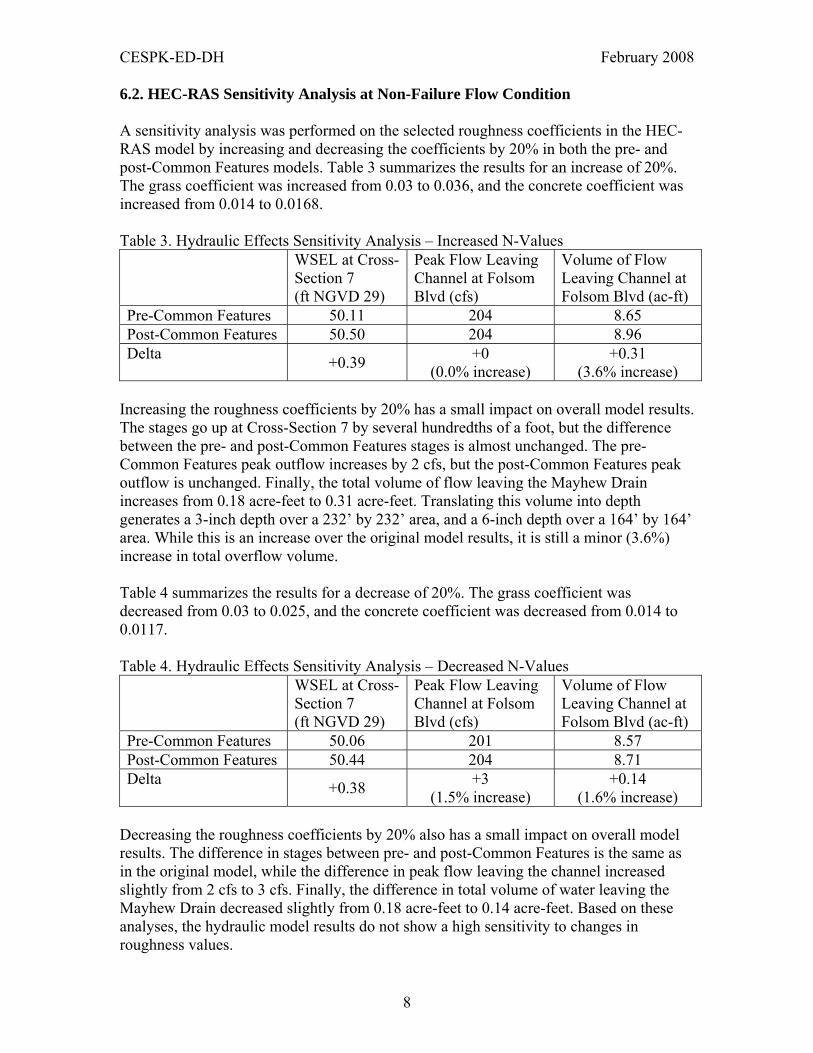
6.2. HEC-RAS Sensitivity Analysis at Non-Failure Flow Condition A sensitivity analysis was performed on the selected roughness coefficients in the HEC-RAS model by increasing and decreasing the coefficients by 20% in both the pre- and post-Common Features models. Table 3 summarizes the results for an increase of 20%. The grass coefficient was increased from 0.03 to 0.036, and the concrete coefficient was increased from 0.014 to 0.0168. Table 3. Hydraulic Effects Sensitivity Analysis – Increased N-Values WSEL at Cross-
Section 7 (ft NGVD 29)
Peak Flow Leaving Channel at Folsom Blvd (cfs)
Volume of Flow Leaving Channel at Folsom Blvd (ac-ft)
Pre-Common Features 50.11 204 8.65 Post-Common Features 50.50 204 8.96 Delta +0.39 +0
(0.0% increase) +0.31
(3.6% increase) Increasing the roughness coefficients by 20% has a small impact on overall model results. The stages go up at Cross-Section 7 by several hundredths of a foot, but the difference between the pre- and post-Common Features stages is almost unchanged. The pre-Common Features peak outflow increases by 2 cfs, but the post-Common Features peak outflow is unchanged. Finally, the total volume of flow leaving the Mayhew Drain increases from 0.18 acre-feet to 0.31 acre-feet. Translating this volume into depth generates a 3-inch depth over a 232’ by 232’ area, and a 6-inch depth over a 164’ by 164’ area. While this is an increase over the original model results, it is still a minor (3.6%) increase in total overflow volume. Table 4 summarizes the results for a decrease of 20%. The grass coefficient was decreased from 0.03 to 0.025, and the concrete coefficient was decreased from 0.014 to 0.0117. Table 4. Hydraulic Effects Sensitivity Analysis – Decreased N-Values WSEL at Cross-
Section 7 (ft NGVD 29)
Peak Flow Leaving Channel at Folsom Blvd (cfs)
Volume of Flow Leaving Channel at Folsom Blvd (ac-ft)
Pre-Common Features 50.06 201 8.57 Post-Common Features 50.44 204 8.71 Delta +0.38 +3
(1.5% increase) +0.14
(1.6% increase) Decreasing the roughness coefficients by 20% also has a small impact on overall model results. The difference in stages between pre- and post-Common Features is the same as in the original model, while the difference in peak flow leaving the channel increased slightly from 2 cfs to 3 cfs. Finally, the difference in total volume of water leaving the Mayhew Drain decreased slightly from 0.18 acre-feet to 0.14 acre-feet. Based on these analyses, the hydraulic model results do not show a high sensitivity to changes in roughness values.

CESPK-ED-DH February 2008
9
6.3 Hydraulic Effects of Mods and Raise at Non-Failure Flow As discussed above, non-failure flow conditions include floods up to the 63-year event. For events up to this frequency, the peak release from Folsom Dam is 115,000 cfs with Common Features in place. The peak release from Folsom Dam at this frequency stays at 115,000 cfs under post-Mods and Raise conditions. Therefore, the 2 cfs increase in overflow and 0.18 acre-feet increase in total overflow volume at Folsom Boulevard will occur for post-Mods and Raise as well. Therefore, the combined effects of the Common Features Project and the Mods and Raise Projects are not considered to impact the Mayhew area. 7. Hydraulic Effects of American River Projects at the Computed 100-Year Flow The floodplain associated with the 100-year flow is the regulatory floodplain for the Federal Emergency Management Agency and therefore a key reference point for evaluation of the hydraulic effects of each of the American River Projects. 7.1 Hydraulic Effects of Common Features at the Computed 100-Year Flow The pre-Common Features 100-year floodplain is shown in Figure 3 and was taken from the 1991 American River Watershed feasibility report (Reference 6). This map shows inundation throughout most of the area around the Mayhew Drain due to overtopping of the levee just east of the Drain and levee failures. The 100-year flow estimated in the 1991 analysis was 234,000 cfs. The post-Common Features 100-year flow is 160,000 cfs. The hydraulic effects of this flow were evaluated in conjunction with a 10-year flow on the Mayhew Drain, which is considered a reasonably likely coincident discharge. The resultant post-Common Features 100-year floodplain is shown in Figure 3. The Mayhew Drain overflow hydrograph was determined using an unsteady HEC-RAS model. This hydrograph was inserted into a two-dimensional FLO-2D model to evaluate the movement of the Mayhew Drain overflows across the south American River floodplain. The post-Common Features floodplain in the Mayhew area results from residual interior flooding from Mayhew Drain. A comparison of the pre- and post-Common Features 100-year floodplains indicates that the Common Features Project produces a substantial net reduction in flooding within the southern American River floodplain. This is a result of several factors: the peak 100-year discharge is reduced from 234,000 cfs to 160,000 cfs, and the Common Features slurry walls, levee raise and closure structure reduce the risk of levee overtopping or levee failure. 7.2 Hydraulic Effects of Mods and Raise at the Computed 100-Year Flow The pre-Common Features 100-year flow was 234,000 cfs. With the Common Features Project and with the re-operation agreement of Folsom Dam, the 100-year flow drops to 160,000 cfs. With completion of the Mods and Raise Projects at Folsom Dam, the 100-year flow in the American River will be further reduced to 115,000 cfs. The residual

CESPK-ED-DH February 2008
10
floodplain in the Mayhew area associated with a flow of 115,000 cfs on the American River and the 10-year flow on the Mayhew Drain was determined using FLO-2D. This floodplain is presented in Figure 3, and comparison with the 1991 and pre-Common Features floodplains indicates a further reduction in the size of the residual floodplain under post-Mods and Raise conditions. 8. Hydraulic Effects of American River Projects on the 200-Year Flood Event The 200-year flood event was evaluated to determine the hydraulic effects of the American River Projects at flows greater than the 100-year flood event but less than system capacity. 8.1 Hydraulic Effects of Common Features at the 200-Year Flow The pre-Common Features 200-year flow was 432,000 cfs. With the Common Features Project and with the re-operation agreement of Folsom Dam, the 200-year flow will continue to be 432,000 cfs. In either case, this flow rate greatly exceeds the capacity of the Common Features Project of 160,000 cfs, and the City of Sacramento as well as the Mayhew area would be severely flooded. Therefore, Common Features does not change the flooding condition of the Mayhew area under this flow scenario. 8.2 Hydraulic Effects of Mods and Raise at the 200-Year Flood Event The pre- and post-Common Features 200-year flow is 432,000 cfs. With the addition of the Mods and Raise Projects at Folsom Dam, the 200-year flow in the American River will be reduced to 160,000 cfs. For the 200-year flood event, flooding conditions in the Mayhew area will go from severe flooding of the entire city under pre-Common Features conditions to localized flooding from Mayhew Drain under post-Mods and Raise conditions. Therefore, for the 200-year flood scenario, the overall Common Features/Mods/Raise Projects will greatly benefit the Mayhew area. 9. Hydraulic Effects of American River Projects at Flows Greater Than System Capacity For flood events greater than the capacity of all currently authorized projects, widescale flooding of the city, including the Mayhew area, would occur under pre- and post-Common Features conditions. Widespread flooding will also occur under post-Mods and Raise conditions, although peak flows will be reduced (see Table 1). Therefore, for this evaluation condition, the overall Common Features/Mods/Raise Project does not negatively change the flooding condition of the Mayhew area, and actually slightly improves it. 10. Impacts of Not Including Closure Structure in Overall Common Features Project All of the analysis presented above reflects the closure structure being completed as part of the post-Common Features conditions, as well as post-Mods and Raise conditions. The closure structure is necessary to prevent high flows in the American River from backing up and spilling at Folsom Boulevard. This would occur when 160,000 cfs was being released from Folsom Dam. Also of significant concern is the potential for a levee

CESPK-ED-DH February 2008
11
breach on either the east or west levee of the Mayhew Drain in the absence of a closure structure. The residual floodplain associated with a levee breach along the Mayhew Drain at 160,000 cfs in the American River and without the closure structure in place is presented in Figure 4. The primary alternative to the closure structure is to improve the east and west levees of the Mayhew Drain to project standards and modify the crossing at Folsom Boulevard. This alternative would be more costly than the currently proposed closure structure at the mouth of Mayhew Drain. 11. Conclusion The American River Project consists of the Common Features Project and the Folsom Dam and Modifications and Raise Projects. The Corps of Engineers (COE) is now in the final phase of design and construction of the American River portion of the Common Features Project. Sacramento County has raised concerns about the hydraulic effects of one component of the Common Features Project, the closure structure, on flood conditions in the vicinity of Mayhew Drain. The closure structure must be evaluated as part of the larger Common Features Project, which would not function as authorized to convey 160,000 cfs without that component. The hydraulic effects of the Common Features Project were evaluated for four flood scenarios: 1) non-failure event; 2) 100-year event; 3) 200-year event and 4) at flows greater than system capacity. During a non-failure flood event, the Common Features Project generates the following hydraulic effects:
• 0.38 feet increase in stage in Mayhew Drain between Folsom Boulevard and the American River to a final elevation of 50.46 feet NGVD 29; this is 2.7 feet below the grate elevation of the lowest connected storm drain.
• 2 cfs increase in overflow leaving Mayhew Drain above Folsom Boulevard • 0.18 acre-feet increase in total overflow volume leaving Mayhew Drain above
Folsom Boulevard; this is equivalent to a 177’ by 177’ area at a depth of 3 inches and a 125’ by 125’ area at a depth of 6 inches.
These incremental hydraulic effects generated by completion of the Common Features Project are not anticipated to cause any significant additional damages beyond pre-Common Features conditions. Completion of the Mods and Raise Projects will not change these effects. During the 100-year flood event, the south American River floodplain will be reduced from widespread inundation to a small area of residual flooding in the vicinity of the Mayhew Drain. This area of residual flooding will be further reduced upon completion of the Mods and Raise Projects. All three floodplains are presented in Figure 3. During the 200-year flood event, no change will occur in the south American River floodplain under Common Features. The peak 200-year discharge will remain 432,000 cfs, which will cause widespread flooding. Completion of the Mods and Raise Projects will reduce the peak 200-year discharge to 160,000 cfs. This will again reduce the south
CESPK-ED-DH February 2008
12
American River floodplain from extensive inundation to a small area of residual flooding in the vicinity of Mayhew Drain. For flood events greater than the capacity of all currently authorized projects, widescale flooding of the city, including the Mayhew area, would occur under every condition. Implementation of the Common Features and Mods and Raise Projects would not alter flooding conditions within the City of Sacramento. Overall, the Common Features and Mods and Raise Projects will provide a substantial improvement in flood conditions in the vicinity of the Mayhew Drain. For questions on the technical content of this report, contact Lea Adams, P.E., Hydraulic Design Section, (916) 557-7143.
Greg Kukas, P.E. Hydraulic Design Section Chief CESPK-ED-DH

FIGURES


Mayhew Drain
¹0 0.04 0.08 0.12 0.160.02
Miles
AMERICAN RIVER PROJECTS
U.S. ARMY CORPS OF ENGINEERSSACRAMENTO DISTRICT
MAYHEW DRAINHEC-RAS CROSS-SECTION LOCATIONS
MAP SCALE
Figure 1
XS 7
Closure Structure Location
Folsom Boulevard
American River
XS 14


050
010
0015
0020
0025
0030
00
2030405060
May
hew
Dra
in
Mai
n C
hann
el D
ista
nce
(ft)
Elevation (ft)
Lege
nd
WS
Max
WS
- 11
5kP
rj
WS
Max
WS
- E
xist
115k
Gro
und
1.52
3 3.5
3.7 closure structure4.2
5
5.25 D/S Face of Ped Bridge
6
7
8 9
11 Folsom Blvd
1415 Lateral Weir
17
RIV
ER
-1 R
each
-1
1 in
Hor
iz. =
500
ft
1 in
Ver
t. =
8 ft


Mayhew Drain
¹0 0.1 0.2 0.3 0.40.05
Miles
AMERICAN RIVER PROJECTS
U.S. ARMY CORPS OF ENGINEERSSACRAMENTO DISTRICT
COMPARISON OF100-YR FLOODPLAINS
MAP SCALE
Figure 3
Legend - 100-Year FloodplainPost-Mods and RaiseWP160k - Max Depth1991


Mayhew Drain
¹0 0.6 1.2 1.8 2.40.3
Miles
AMERICAN RIVER PROJECTS
U.S. ARMY CORPS OF ENGINEERSSACRAMENTO DISTRICT
RESIDUAL FLOODPLAIN FROM LEVEE FAILURE ALONG MAYHEW DRAIN
MAP SCALE
Figure 4


APPENDIX A

Tab
le A
1. P
re-C
omm
on F
eatu
res W
SEL
at X
S7
May
hew
Dra
in F
low
s at F
olso
m B
lvd
(cfs
/freq
uenc
y)
Am
eric
an R
Sta
ges a
t M
ayhe
w D
rain
(e
l NG
VD
29)
550
(0.5
) 91
0 (0
.2)
1170
(0.1
) 15
00 (0
.04)
17
20 (0
.02)
19
50 (0
.1)
2160
(0.0
05)
2510
(0.0
02)
40.0
43
.54
45.0
445
.66
46.2
646
.60
46.9
447
.22
47.6
3 45
.0
45.1
8 45
.50
45.7
946
.25
46.6
046
.94
47.2
247
.63
50.0
49
.99
49.9
949
.98
49.9
749
.97
49.9
649
.96
49.9
5 58
.0
58.0
0 58
.00
58.0
258
.05
58.0
858
.11
58.1
558
.22
Tab
le A
2. P
re-C
omm
on F
eatu
res W
SEL
at X
S14
May
hew
Dra
in F
low
s at F
olso
m B
lvd
(cfs
/freq
uenc
y)
Am
eric
an R
Sta
ges a
t M
ayhe
w D
rain
(e
l NG
VD
29)
550
(0.5
) 91
0 (0
.2)
1170
(0.1
) 15
00 (0
.04)
17
20 (0
.02)
19
50 (0
.1)
2160
(0.0
05)
2510
(0.0
02)
40.0
49
.29
55.5
056
.31
56.8
657
.20
57.5
357
.78
58.2
3 45
.0
49.2
1 55
.50
56.3
156
.85
57.2
057
.53
57.7
858
.23
50.0
53
.39
56.1
356
.54
56.9
557
.20
57.5
157
.78
58.2
3 58
.0
58.0
0 58
.01
58.0
658
.18
58.2
658
.36
58.4
758
.69
Tab
le A
3. W
SEL
at X
S7: 3
8’x
8’ B
ox C
ulve
rts
May
hew
Dra
in F
low
s at F
olso
m B
lvd
(cfs
/freq
uenc
y)
Am
eric
an R
Sta
ges a
t M
ayhe
w D
rain
(e
l NG
VD
29)
550
(0.5
) 91
0 (0
.2)
1170
(0.1
) 15
00 (0
.04)
17
20 (0
.02)
19
50 (0
.1)
2160
(0.0
05)
2510
(0.0
02)
40.0
43
.75
45.4
746
.30
47.1
947
.73
48.2
748
.78
49.6
5 45
.0
45.3
8 46
.02
46.4
847
.17
47.7
348
.27
48.7
849
.65
50.0
50
.20
50.4
850
.70
51.0
251
.27
51.6
551
.96
52.4
9 58
.0
58.0
0 58
.03
58.1
358
.31
58.4
758
.62
58.7
959
.07

Tab
le A
4. W
SEL
at X
S14:
3 8
’x 8
’ Box
Cul
vert
s M
ayhe
w D
rain
Flo
ws a
t Fol
som
Blv
d (c
fs/fr
eque
ncy)
A
mer
ican
R S
tage
s at
May
hew
Dra
in
(el N
GV
D29
) 55
0 (0
.5)
910
(0.2
) 11
70 (0
.1)
1500
(0.0
4)
1720
(0.0
2)
1950
(0.1
) 21
60 (0
.005
) 25
10 (0
.002
)
40.0
49
.29
55.5
056
.31
56.8
557
.19
57.5
357
.78
58.2
3 45
.0
49.1
7 55
.50
56.3
256
.86
57.1
957
.53
57.7
858
.23
50.0
53
.60
56.2
056
.60
57.0
257
.28
57.5
857
.82
58.2
3 58
.0
58.0
0 58
.04
58.1
558
.39
58.5
758
.76
58.9
759
.27
Tab
le A
5. D
elta
Sta
ge a
t XS7
: 3 8
’x 8
’ Box
Cul
vert
s M
ayhe
w D
rain
Flo
ws a
t Fol
som
Blv
d (c
fs/fr
eque
ncy)
A
mer
ican
R S
tage
s at
May
hew
Dra
in
(el N
GV
D29
) 55
0 (0
.5)
910
(0.2
) 11
70 (0
.1)
1500
(0.0
4)
1720
(0.0
2)
1950
(0.1
) 21
60 (0
.005
) 25
10 (0
.002
)
40.0
0.
21
0.43
0.64
0.93
1.13
1.33
1.56
2.02
45
.0
0.20
0.
520.
690.
921.
131.
331.
562.
02
50.0
0.
21
0.49
0.72
1.05
1.30
1.69
2.00
2.54
58
.0
0.00
0.
030.
110.
260.
390.
510.
640.
85
Tab
le A
6. D
elta
Sta
ge a
t XS1
4: 3
8’x
8’ B
ox C
ulve
rts
May
hew
Dra
in F
low
s at F
olso
m B
lvd
(cfs
/freq
uenc
y)
Am
eric
an R
Sta
ges a
t M
ayhe
w D
rain
(e
l NG
VD
29)
550
(0.5
) 91
0 (0
.2)
1170
(0.1
) 15
00 (0
.04)
17
20 (0
.02)
19
50 (0
.1)
2160
(0.0
05)
2510
(0.0
02)
40.0
0.
00
0.00
0.00
-0.0
1-0
.01
0.00
0.00
0.00
45
.0
-0.0
4 0.
000.
010.
01-0
.01
0.00
0.00
0.00
50
.0
0.21
0.
070.
060.
070.
080.
070.
040.
00
58.0
0.
00
0.03
0.09
0.21
0.31
0.40
0.50
0.58

Tab
le A
7. W
SEL
at X
S7: 4
8’x
8’ B
ox C
ulve
rts
May
hew
Dra
in F
low
s at F
olso
m B
lvd
(cfs
/freq
uenc
y)
Am
eric
an R
Sta
ges a
t M
ayhe
w D
rain
(e
l NG
VD
29)
550
(0.5
) 91
0 (0
.2)
1170
(0.1
) 15
00 (0
.04)
17
20 (0
.02)
19
50 (0
.1)
2160
(0.0
05)
2510
(0.0
02)
40.0
43
.69
45.3
246
.07
46.8
347
.27
47.7
148
.11
48.7
7 45
.0
45.3
1 45
.84
46.2
246
.81
47.2
747
.71
48.1
148
.77
50.0
50
.12
50.2
850
.40
50.6
050
.75
50.9
151
.06
51.5
8 58
.0
58.0
0 58
.02
58.0
958
.21
58.3
258
.44
58.5
758
.79
Tab
le A
8. W
SEL
at X
S14:
4 8
’x 8
’ Box
Cul
vert
s M
ayhe
w D
rain
Flo
ws a
t Fol
som
Blv
d (c
fs/fr
eque
ncy)
A
mer
ican
R S
tage
s at
May
hew
Dra
in
(el N
GV
D29
) 55
0 (0
.5)
910
(0.2
) 11
70 (0
.1)
1500
(0.0
4)
1720
(0.0
2)
1950
(0.1
) 21
60 (0
.005
) 25
10 (0
.002
)
40.0
49
.29
55.5
056
.31
56.8
657
.20
57.5
357
.78
58.2
3 45
.0
49.1
8 55
.50
56.3
156
.87
57.2
057
.53
57.7
858
.23
50.0
53
.51
56.1
756
.58
57.0
057
.26
57.5
357
.79
58.2
4 58
.0
58.0
0 58
.03
58.1
258
.29
58.4
658
.61
58.7
859
.11
Tab
le A
9. D
elta
Sta
ge a
t XS7
: 4 8
’x 8
’ Box
Cul
vert
s M
ayhe
w D
rain
Flo
ws a
t Fol
som
Blv
d (c
fs/fr
eque
ncy)
A
mer
ican
R S
tage
s at
May
hew
Dra
in
(el N
GV
D29
) 55
0 (0
.5)
910
(0.2
) 11
70 (0
.1)
1500
(0.0
4)
1720
(0.0
2)
1950
(0.1
) 21
60 (0
.005
) 25
10 (0
.002
)
40.0
0.
15
0.28
0.41
0.57
0.67
0.77
0.89
1.14
45
.0
0.13
0.
340.
430.
560.
670.
770.
891.
14
50.0
0.
13
0.29
0.42
0.63
0.78
0.95
1.10
1.63
58
.0
0.00
0.
020.
070.
160.
240.
330.
420.
57
Tab
le A
10. D
elta
Sta
ge a
t XS1
4: 4
8’x
8’ B
ox C
ulve
rts
May
hew
Dra
in F
low
s at F
olso
m B
lvd
(cfs
/freq
uenc
y)
Am
eric
an R
Sta
ges a
t M
ayhe
w D
rain
(e
l NG
VD
29)
550
(0.5
) 91
0 (0
.2)
1170
(0.1
) 15
00 (0
.04)
17
20 (0
.02)
19
50 (0
.1)
2160
(0.0
05)
2510
(0.0
02)
40.0
0.
00
0.00
0.00
0.00
0.00
0.00
0.00
0.00
45
.0
-0.0
3 0.
000.
000.
020.
000.
000.
000.
00
50.0
0.
12
0.04
0.04
0.05
0.06
0.02
0.01
0.01
58
.0
0.00
0.
020.
060.
110.
200.
250.
310.
42
Tab
le A
11. W
SEL
at X
S7: 5
8’x
8’ B
ox C
ulve
rts
May
hew
Dra
in F
low
s at F
olso
m B
lvd
(cfs
/freq
uenc
y)
Am
eric
an R
Sta
ges a
t M
ayhe
w D
rain
(e
l NG
VD
29)
550
(0.5
) 91
0 (0
.2)
1170
(0.1
) 15
00 (0
.04)
17
20 (0
.02)
19
50 (0
.1)
2160
(0.0
05)
2510
(0.0
02)
40.0
43
.66
45.2
645
.97
46.6
947
.10
47.4
947
.83
48.4
0 45
.0
45.2
8 45
.76
46.1
246
.65
47.1
047
.49
47.8
348
.40
50.0
50
.08
50.1
850
.27
50.4
050
.50
50.6
050
.70
50.8
8 58
.0
58.0
0 58
.01
58.0
758
.16
58.2
558
.35
58.4
558
.61
Tab
le A
12. W
SEL
at X
S14:
5 8
’x 8
’ Box
Cul
vert
s M
ayhe
w D
rain
Flo
ws a
t Fol
som
Blv
d (c
fs/fr
eque
ncy)
A
mer
ican
R S
tage
s at
May
hew
Dra
in
(el N
GV
D29
) 55
0 (0
.5)
910
(0.2
) 11
70 (0
.1)
1500
(0.0
4)
1720
(0.0
2)
1950
(0.1
) 21
60 (0
.005
) 25
10 (0
.002
)
40.0
49
.29
55.5
056
.31
56.8
657
.19
57.5
357
.78
58.2
3 45
.0
49.1
8 55
.50
56.3
156
.85
57.1
957
.53
57.7
858
.23
50.0
53
.47
56.1
656
.57
56.9
857
.25
57.5
257
.79
58.2
3 58
.0
58.0
0 58
.02
58.1
058
.26
58.4
058
.56
58.7
058
.96

Tab
le A
13. D
elta
Sta
ge a
t XS7
: 5 8
’x 8
’ Box
Cul
vert
s M
ayhe
w D
rain
Flo
ws a
t Fol
som
Blv
d (c
fs/fr
eque
ncy)
A
mer
ican
R S
tage
s at
May
hew
Dra
in
(el N
GV
D29
) 55
0 (0
.5)
910
(0.2
) 11
70 (0
.1)
1500
(0.0
4)
1720
(0.0
2)
1950
(0.1
) 21
60 (0
.005
) 25
10 (0
.002
)
40.0
0.
12
0.22
0.31
0.43
0.50
0.55
0.61
0.77
45
.0
0.10
0.
260.
330.
400.
500.
550.
610.
77
50.0
0.
09
0.19
0.29
0.43
0.53
0.64
0.74
0.93
58
.0
0.00
0.
010.
050.
110.
170.
240.
300.
39
Tab
le A
14. D
elta
Sta
ge a
t XS1
4: 6
8’x
8’ B
ox C
ulve
rts
May
hew
Dra
in F
low
s at F
olso
m B
lvd
(cfs
/freq
uenc
y)
Am
eric
an R
Sta
ges a
t M
ayhe
w D
rain
(e
l NG
VD
29)
550
(0.5
) 91
0 (0
.2)
1170
(0.1
) 15
00 (0
.04)
17
20 (0
.02)
19
50 (0
.1)
2160
(0.0
05)
2510
(0.0
02)
40.0
0.
00
0.00
0.00
0.00
-0.0
10.
000.
000.
00
45.0
-0
.03
0.00
0.00
0.00
-0.0
10.
000.
000.
00
50.0
0.
08
0.03
0.03
0.03
0.05
0.01
0.01
0.00
58
.0
0.00
0.
010.
040.
080.
140.
200.
230.
27


APPENDIX B


Page 5 of 8Effective 03/01
Fontaine mandated the Department of Hydraulics at the University of Sherbrooke to investigate the relation between flap gates and loss of head.
The testing program concluded that flap gates almost always cause negligible loss of head, when compared to losses incurred by the rest of the hydraulic system.The following graphs summarize the testing results.
0 5 0 1 0 0 1 5 0 2 0 0 2 5 0
3Conditions of maximum head loss. cu ft/sec (m /minFlow )
RECTANGULAR FLAP GATES HEAD LOSS CURVES
Lo
ss
of
head
)ft
(mm
0.20(61)
0.15(46)
0.10(30)
0.05(15)
0
(170)(85) (255) (340) (425)
36” x 24”48” x 32”
72 48”” x 96” x 64”
0 50 100 150 200 250
0.25(76)
0.20(61)
0.15(46)
0.10(30)
0.05(15)
0
(170)(85) (255) (340) (425)
30”
42”
60”84”
3Conditions of maximum head loss. Flow (m /min)cu ft/sec
SQUARE FLAP GATES HEAD LOSS CURVES
Lo
ss
of
head
ft(m
m)
SERIES 70SQUARE AND RECTANGULAR FLAP GATES
STAINLESS STEEL FLAP GATES
PCode S70Section 5