appendix g geotechnical exploration report
TRANSCRIPT

Initial Study 1095 Rollins Road Apartments
APPENDIX G
GEOTECHNICAL EXPLORATION REPORT

Initial Study 1095 Rollins Road Apartments
This page intentionally left blank

Copyright © 2018 by ENGEO Incorporated. This document may not be reproduced in whole or in part by any means whatsoever, nor may it be quoted or excerpted without the express written consent of ENGEO Incorporated.
1095 ROLLINS ROAD BURLINGAME, CALIFORNIA
GEOTECHNICAL EXPLORATION
SUBMITTED TO Ms. Kristen Gates
Hanover R.S. Limited Partnership 5847 San Felipe, Suite 3600
Houston, TX 77057
PREPARED BY ENGEO Incorporated
July 27, 2018
PROJECT NO.
14140.000.000

GEOTECHNICAL ENVIRONMENTAL
WATER RESOURCES CONSTRUCTION SERVICES
6399 San Ignacio Avenue, Suite 150 San Jose, CA 95119 (408) 574-4900 Fax (888) 279-2698 www.engeo.com
Project No. 14140.000.000
July 27, 2018 Ms. Kristen Gates Hanover R.S. Limited Partnership 5847 San Felipe, Suite 3600 Houston, TX 77057 Subject: 1095 Rollins Road Burlingame, California GEOTECHNICAL EXPLORATION Dear Ms. Gates: ENGEO prepared this geotechnical report for Hanover R.S. Limited Partnership as outlined in our agreement dated July 19, 2017. We characterized the subsurface conditions at the site to provide the enclosed geotechnical recommendations for design. Our experience and that of our profession clearly indicate that the risk of costly design, construction, and maintenance problems can be significantly lowered by retaining the design geotechnical engineering firm to review the project plans and specifications and provide geotechnical observation and testing services during construction. Please let us know when working drawings are nearing completion, and we will be glad to discuss these additional services with you. If you have any questions or comments regarding this report, please call and we will be glad to discuss them with you. Sincerely, ENGEO Incorporated Todd Bradford, PE Josef J. Tootle, GE tb/jjt/jf

Hanover R.S. Limited Partnership 1095 Rollins Road 14140.000.000 Geotechnical Exploration
i of ii July 27, 2018
TABLE OF CONTENTS
LETTER OF TRANSMITTAL 1.0 INTRODUCTION .................................................................................................. 1
1.1 PURPOSE AND SCOPE .................................................................................................... 1 1.2 PROJECT LOCATION ........................................................................................................ 1 1.3 PROJECT DESCRIPTION .................................................................................................. 1
2.0 FINDINGS ............................................................................................................ 2
2.1 FIELD EXPLORATION ....................................................................................................... 2 2.2 GEOLOGY AND SEISMICITY ............................................................................................ 2
2.2.1 Geology .................................................................................................................. 2 2.2.2 Seismicity ............................................................................................................... 3
2.3 SITE HISTORY ................................................................................................................... 3 2.4 SURFACE CONDITIONS ................................................................................................... 3 2.5 SUBSURFACE CONDITIONS ............................................................................................ 4 2.6 GROUNDWATER CONDITIONS ....................................................................................... 4 2.7 LABORATORY TESTING ................................................................................................... 4
3.0 CONCLUSIONS ................................................................................................... 4
3.1 UNDOCUMENTED FILL ..................................................................................................... 5 3.2 SHALLOW GROUNDWATER ............................................................................................ 5 3.3 SEISMIC HAZARDS ........................................................................................................... 5
3.3.1 Ground Rupture ..................................................................................................... 5 3.3.2 Ground Shaking ..................................................................................................... 6 3.3.3 Liquefaction/Cyclic Softening ................................................................................. 6
3.4 SOIL CORROSION POTENTIAL ........................................................................................ 7 3.5 2016 CBC SEISMIC DESIGN PARAMETERS ................................................................... 7
4.0 CONSTRUCTION MONITORING ........................................................................ 8
5.0 SITE RECOMMENDATIONS ............................................................................... 8
5.1 DEMOLITION AND STRIPPING ......................................................................................... 8 5.2 NON-ENGINEERED FILL REMOVAL ................................................................................ 8
6.0 FOUNDATION RECOMMENDATIONS ............................................................... 9
6.1 MAT FOUNDATIONS ......................................................................................................... 9
6.1.1 Settlement .............................................................................................................. 9 6.1.2 Uplift Forces ........................................................................................................... 9 6.1.3 Subgrade Treatment for Structural Mat Foundations .......................................... 10
6.2 WATERPROOFING .......................................................................................................... 10
7.0 BASEMENT WALLS AND NON-BUILDING RETAINING WALLS ................... 10
7.1 BASEMENT WALL LATERAL SOIL PRESSURES .......................................................... 10 7.2 SEISMIC DESIGN CONSIDERATIONS ........................................................................... 11 7.3 NON-BUILDING RETAINING WALL LATERAL SOIL PRESSURES ............................... 11
7.3.1 Wall Drainage ....................................................................................................... 11

Hanover R.S. Limited Partnership 1095 Rollins Road 14140.000.000 Geotechnical Exploration
TABLE OF CONTENTS (Continued)
ii of ii July 27, 2018
8.0 EXCAVATION DEWATERING AND SHORING ................................................ 11
8.1 TEMPORARY SHORING ................................................................................................. 12 8.2 CONSTRUCTION DEWATERING .................................................................................... 12 8.3 PRE-CONSTRUCTION SURVEY AND CONSTRUCTION MONITORING ..................... 12
9.0 SECONDARY SLAB-ON-GRADE ..................................................................... 13
9.1 SUBGRADE PREPARATION ........................................................................................... 13 9.2 SUITABLE FILL MATERIALS ........................................................................................... 13 9.3 PLACEMENT OF FILL ...................................................................................................... 13 9.4 DRAINAGE ....................................................................................................................... 14
10.0 PAVEMENT DESIGN ......................................................................................... 14
10.1 FLEXIBLE PAVEMENT .................................................................................................... 14 10.2 RIGID PAVEMENT ........................................................................................................... 14 10.3 AGGREGATE BASE COMPACTION ............................................................................... 15
11.0 UTILITIES........................................................................................................... 15
12.0 LIMITATIONS AND UNIFORMITY OF CONDITIONS ....................................... 16
SELECTED REFERENCES FIGURES APPENDIX A – Exploration Logs
APPENDIX B – Laboratory Test Data
APPENDIX C – CPT Data
APPENDIX D – Liquefaction Analysis

Hanover R.S. Limited Partnership 1095 Rollins Road 14140.000.000 Geotechnical Exploration
Page | 1 July 27, 2018
1.0 INTRODUCTION 1.1 PURPOSE AND SCOPE ENGEO prepared this geotechnical report for design of the proposed mixed-use development in Burlingame, California. We prepared this report as outlined in our agreement dated July 19, 2017. Hanover R.S. Limited Partnership authorized ENGEO to conduct the following scope of services: Review available literature and geologic maps Subsurface field exploration Soil laboratory testing Data analysis and conclusions Report preparation This report was prepared for the exclusive use of our client and their consultants for design of this project. In the event that any changes are made in the character, design or layout of the development, we must be contacted to review the conclusions and recommendations contained in this report to evaluate whether modifications are recommended. This document may not be reproduced in whole or in part by any means whatsoever, nor may it be quoted or excerpted without our express written consent. 1.2 PROJECT LOCATION The approximately 1.1-acre project site is located at 1095 Rollins Road in Burlingame California. The rectangular-shaped project site is bound to the north by Rollins Road, to the east and south by multi-story apartment buildings, and to the west by a gas station. The San Francisco Bay shoreline is located approximately 1,200 feet to the north of the site. The site is currently occupied by a restaurant building and an elevated tennis court. 1.3 PROJECT DESCRIPTION Based on our review of the provided information, we understand the project will consist of a podium structure with one level of below-grade parking and up to six levels of mixed-use above-grade construction. Various areas within the one-level basement will be deepened an additional level to accommodate mechanical car-stackers. We understand from speaking with you that you intend to excavate the entire site to the depth of the car stacker pits, construct your foundation elements, then backfill where needed to achieve the design basement elevation. Construction of underground utilities, retaining walls, flatwork, and landscaping will also be part of the proposed development. Structural loads and grading plans were not available for our review at the time of our exploration. We assume that structural loads will be representative for this type of construction. We assume from the review of the floor plan that the basement level of parking and car stacker pits will require approximately 10 feet and 20 feet of cut, respectively.

Hanover R.S. Limited Partnership 1095 Rollins Road 14140.000.000 Geotechnical Exploration
Page | 2 July 27, 2018
2.0 FINDINGS 2.1 FIELD EXPLORATION Our field exploration included drilling three borings and advancing three cone penetration tests (CPTs) at various locations on the site. We performed our field exploration between June 12 and June 13, 2018. We established the exploration locations by visual sighting from existing features and should be considered accurate only to the degree implied by the method used. We observed drilling of the three borings at the locations shown on the Site Plan, Figure 2. An ENGEO representative observed the drilling and logged the subsurface conditions at each location. We retained a truck-mounted drill rig and crew to advance the borings using 4-inch-diameter rotary wash methods. The borings were advanced to depths ranging from approximately 60 to 70 feet below ground surface (bgs). We permitted and backfilled the borings in accordance with the requirements of San Mateo County Environmental Health. We obtained soil samples at various intervals using standard penetration test (SPT) samplers with a 2-inch-outside-diameter (O.D. split-spoon sampler) and California Modified samplers with 2½-inch-inside-diameter (I.D.). We obtained the blow counts shown on our bore logs with an automatic trip, 140-pound hammer with a 30-inch free fall. Unless otherwise indicated, the blows per foot recorded on the boring log represent the accumulated number of blows to drive the last 1 foot of penetration; the blow counts have not been converted using any correction factors. When sampler driving was difficult, penetration was recorded only as inches penetrated for 50 hammer blows. Additionally, we retained the services of a subcontractor with a CPT rig to advance three cone penetration tests to depths of up to 80 feet below ground surface (bgs) in general accordance with ASTM D-5778. Measurements include the tip resistance to penetration of the cone (Qc), the resistance of the surface sleeve (Fs), and pore pressure (U) (Robertson and Campanella, 1988). Pore pressure dissipation tests were performed to measure the approximate subsurface phreatic surface. We provide additional information about specific subsurface conditions at each location in our boring logs in Appendix A and CPT interpretations in Appendix B. The soil type, color, consistency, and visual classification provided in the logs are in general accordance with the Unified Soil Classification System. The logs graphically depict the subsurface conditions encountered at the time of the exploration. 2.2 GEOLOGY AND SEISMICITY 2.2.1 Geology The site is located in the Coast Ranges geomorphic province of California. The Coast Ranges are dominated by a series of northwest-trending ridges and valleys formed by faulting and folding of the earth’s crust. As shown on the Geologic Map prepared by Pampeyan (1994), artificial fill (af) is mapped on the site (Figure 3). Historical development of the San Francisco Bay shoreline resulted in placement of artificial fill material over substantial portions of modern estuaries, marshlands, tributaries, and creek beds in an effort to reclaim land (Nichols and Wright, 1971). Historical mapping of the area shows the project site to be located within a former tidal marsh that was subsequently filled during development of the area.

Hanover R.S. Limited Partnership 1095 Rollins Road 14140.000.000 Geotechnical Exploration
Page | 3 July 27, 2018
2.2.2 Seismicity Numerous small earthquakes occur every year in the San Francisco Bay Region, and larger earthquakes have been recorded and can be expected to occur in the future. The distance and maximum anticipated moment magnitude of the nearest active faults are listed in Table 2.2.2-1. In addition, Figure 5 shows the approximate locations of these faults and significant historic earthquakes recorded within the San Francisco Bay Region. An active fault is defined by the State Mining and Geology Board as one that has had surface displacement within Holocene time (about the last 11,000 years) (Bryant and Hart, 2007). TABLE 2.2.2-1: Active Faults Capable of Producing Significant Ground Shaking at the Site
FAULT NAME DISTANCE FROM SITE (MILES) MAXIMUM MOMENT MAGNITUDE San Andreas 2.3 8.1 San Gregorio Connected 8.9 7.5 Monte Vista-Shannon 12.0 6.5 Hayward-Rodgers Creek 15.9 7.3 Calaveras 24.4 7.0 Mount Diablo Thrust 26.5 6.7 Green Valley Connected 29.5 6.8 Greenville Connected 35.2 7.0
The site is not located within a currently designated Alquist-Priolo Earthquake Fault Zone and no known surface expression of active faults is believed to exist within the site. Fault rupture through the site, therefore, is not anticipated. As shown in Figure 4, the site is located within a State of California Seismic Hazard Zone (CGS, 2016) for areas that may be susceptible to liquefaction. Soil liquefaction results from loss of strength during cyclic loading, such as imposed by earthquakes. The soil most susceptible to liquefaction is clean, loose, saturated, uniformly graded, fine-grained sand. Empirical evidence indicates that loose to medium-dense gravel, silty sand, low-plasticity silt, and some low-plasticity clay are also potentially liquefiable. 2.3 SITE HISTORY We reviewed individual aerial photographs of the site dated 1946, 1956, 1968, 1980, 1987, 1993, 2000, 2002, 2005, 2009, 2010, 2012, and 2014 and a topographic map dated 1896 that were available online at http://www.historicaerials.com. Based on our review, the property was previously situated on the border of marshland and the historic San Francisco Bay shoreline. Efforts to extend the shoreline further into the bay through the placement of fill material are evident in the 1946 photography. The site appears to have been completely filled by 1956 while the existing restaurant building and elevated tennis court structure appear by 1980. The site has remained relatively unchanged since 1980. 2.4 SURFACE CONDITIONS The project site appears relatively flat and is currently occupied by a restaurant building, an elevated tennis court structure, and minor landscaping.

Hanover R.S. Limited Partnership 1095 Rollins Road 14140.000.000 Geotechnical Exploration
Page | 4 July 27, 2018
2.5 SUBSURFACE CONDITIONS The site is underlain by between 5 and 15 feet of undocumented fill consisting of sandy lean clay, clayey sand, gravely clay, and fat clay with sand. Beneath the undocumented fill, we encountered an approximately 10-foot-thick layer of loose to medium-dense clayey sand. Following the sand deposit, we generally encountered lean clay, sandy clay, and fat clay to the bottom of our explorations. We also observed an approximately 5-foot-thick layer of high clay content medium dense sand at around 30 to 35 feet bgs. We also noted a lens of dense clayey sand at 55 feet bgs in Borings 1-B2 and 1-B3 Consult Figure 2 and boring logs (Appendix A) for specific subsurface conditions at each location. 2.6 GROUNDWATER CONDITIONS During our CPT exploration, we performed pore pressure dissipation tests that indicated a groundwater level approximately 13 feet bgs. However, we performed environmental sampling during the preparation of a Phase II Environmental Site Assessment (ENGEO, 2018) where we observed groundwater at approximately 5 feet bgs. Additionally, historical high groundwater level in the area is mapped by the California Geological survey at a depth of less than 10 feet bgs (Figure 6). We recommend that the design groundwater elevation of the project be assumed to be 5 feet bgs. Fluctuations in the level of groundwater may occur due to variations in rainfall, tidal fluctuation, irrigation practice, and other factors not evident at the time measurements were made. 2.7 LABORATORY TESTING We performed laboratory tests on select soil samples to evaluate their engineering properties. For this project, we performed laboratory testing as shown in the table below. TABLE 2.7-1: Laboratory Testing
SOIL CHARACTERISTIC TESTING METHOD
Natural Unit Weight ASTM D7263 Natural Moisture Content ASTM D2216 Plasticity Index (Wet Method) ASTM D4318 Grain Size Distribution ASTM D6913 Percent Passing #200 Sieve ASTM D1140 Triaxial Compression – Unconsolidated, Undrained (TXUU) ASTM D2850 Unconfined Compression ASTM D2166
3.0 CONCLUSIONS From a geotechnical engineering viewpoint, in our opinion, the proposed project may be designed as planned, provided the geotechnical recommendations in this report are properly incorporated into the design plans and specifications.

Hanover R.S. Limited Partnership 1095 Rollins Road 14140.000.000 Geotechnical Exploration
Page | 5 July 27, 2018
The primary geotechnical considerations influencing the project are: The presence of undocumented fill. Shallow groundwater. Liquefaction-induced settlement. 3.1 UNDOCUMENTED FILL During our investigation, we encountered fill extending between 7 and 15 feet below existing grade in all three of our borings. Based on the floor plan, the majority of undocumented fill will be removed for the excavation of the parking garage. Structures built at grade may be potentially influenced by the presence of undocumented fill. Non-engineered fill can undergo excessive settlement, especially under new fill or building loads. We present fill removal recommendations in Section 5.2. for the existing fill. 3.2 SHALLOW GROUNDWATER Given the final design depth of the proposed excavation for the planned structure, groundwater will influence the excavation and the bottom of the excavation. As such, temporary construction dewatering, and design of below-grade portions of the structure for hydrostatic conditions and waterproofing are anticipated. Shallow groundwater can: 1. Delay grading activities, especially compacting soil below basement elevations. 2. Require construction dewatering. 3. Cause moisture damage to sensitive floor coverings. 4. Transmit moisture vapor through slabs causing excessive mold/mildew build-up, fogging of
windows, and damage to computers and other sensitive equipment. 5. Require waterproofing for the proposed basement structures. 3.3 SEISMIC HAZARDS Potential seismic hazards resulting from a nearby moderate to major earthquake can generally be classified as primary and secondary. The primary effect is ground rupture, also called surface faulting. The common secondary seismic hazards include ground shaking and liquefaction induced damages. The following sections present a discussion of these hazards as they apply to the site. Based on topographic and lithologic data, the risk of regional subsidence or uplift, lateral spreading, and landslides is considered low to negligible at the site. The Association of Bay Area Governments does not map the project site within a potential tsunami inundation zone. Given the proximity to the San Francisco Bay and low elevation, you should consult your civil engineer regarding flooding potential. 3.3.1 Ground Rupture Since there are no known active faults crossing the property and the site is not located within an Earthquake Fault Special Study Zone, it is our opinion that ground rupture is unlikely at the subject property.

Hanover R.S. Limited Partnership 1095 Rollins Road 14140.000.000 Geotechnical Exploration
Page | 6 July 27, 2018
3.3.2 Ground Shaking An earthquake of moderate to high magnitude generated within the San Francisco Bay Region could cause considerable ground shaking at the site, similar to that which has occurred in the past. To mitigate the shaking effects, structures should be designed using sound engineering judgment and the 2007 California Building Code (CBC) requirements, as a minimum. Seismic design provisions of current building codes generally prescribe minimum lateral forces, applied statically to the structure, combined with the gravity forces of dead-and-live loads. The code-prescribed lateral forces are generally considered to be substantially smaller than the comparable forces that would be associated with a major earthquake. Therefore, structures should be able to: (1) resist minor earthquakes without damage, (2) resist moderate earthquakes without structural damage but with some nonstructural damage, and (3) resist major earthquakes without collapse but with some structural as well as nonstructural damage. Conformance to the current building code recommendations does not constitute any kind of guarantee that significant structural damage would not occur in the event of a maximum magnitude earthquake; however, it is reasonable to expect that a well-designed and well-constructed structure will not collapse or cause loss of life in a major earthquake (SEAOC, 1996). 3.3.3 Liquefaction/Cyclic Softening Soil liquefaction results from loss of strength during cyclic loading, such as imposed by earthquakes. The soil considered most susceptible to liquefaction is clean, loose, saturated, uniformly graded, fine-grained sand. Empirical evidence indicates that loose to medium dense gravel, silty sand, low-plasticity silt, and some low-plasticity clay are also potentially liquefiable. We performed liquefaction analysis using the computer software CLiq Version 2.0 developed by GeoLogismiki. We performed our analysis based on procedures by Robertson (2009). We estimated the Cyclic Stress Ratio (CSR) using a MCE Geometric Mean Peak Ground Acceleration (PGAM) value of 0.82g as outlined in the CBC and moment magnitude of 8.1 based on the characteristic magnitude of the nearby San Andreas fault. We evaluated the liquefaction potential for the soil encountered below a groundwater depth of 5 feet bgs. The results of our analyses indicate there are some minor subsurface layers potentially susceptible to liquefaction. 3.3.3.1 Liquefaction-Induced Settlement Deformation of the ground surface is a common result of liquefaction. Vertical settlement may result from densification of the deposit or volume loss from venting to the ground surface. Densification occurs as excess pore pressures dissipate, resulting in vertical settlement at the ground surface. We calculated potential liquefaction-induced settlement estimates using the program Cliq for soils in the top 50 feet of the site. The procedures used in Cliq are based on the methods published by Zhang, G., Robertson, P.K., and Brachman, R. (2002). Additionally, we performed laboratory testing on some of the transitional silts and clays that showed as potentially liquefiable in the CPT analysis. Based on fine-grained liquefaction triggering screening procedures outlined in Bray and Sancio (2006), the silt and clay beginning at approximately 40 feet bgs is not susceptible to liquefaction. We estimate approximately 1 inch of liquefaction-induced ground surface settlement and approximately ½ inch of liquefaction-induced building settlement. We estimate that differential
Hanover R.S. Limited Partnership 1095 Rollins Road 14140.000.000 Geotechnical Exploration
Page | 7 July 27, 2018
settlement over a span of 50 feet during a seismic event will be approximately half of the total settlement. 3.3.3.2 Surface Manifestation We also evaluated the capping effect of overlying non-liquefiable soil, based on guidelines provided by Ishihara (1985) and Youd and Garris (1995). For liquefaction-induced ground failure to occur, the pore water pressure generated within the liquefied strata must exert a force sufficient to break through the overlying soil and vent to the surface resulting in sand boils or fissures. We assessed conditions assuming that future grades will approximately match the existing grades. Based on our analysis, the project site surrounding the building is likely to exhibit surface manifestations of liquefied material in the form of sand boils and fissures. 3.4 SOIL CORROSION POTENTIAL As part of this study, we collected three soil samples from various areas across the site and at varying depths. The samples were combined and then sent to CERCO Analytical, who performed testing according to ASTM Test Methods for pH, resistivity, sulfate, and chloride. At the time of this publication, the test results were not available for review. We will provide the results and evaluation under separate cover at a later date. 3.5 2016 CBC SEISMIC DESIGN PARAMETERS The 2016 CBC utilizes design criteria set forth in the 2010 ASCE 7 Standard. Based on the subsurface conditions encountered, and the anticipated basement excavation removals, we characterized the site as Site Class D in accordance with the 2016 CBC. We provide the 2016 CBC seismic design parameters in Table 3.5-1 below, which include design spectral response acceleration parameters based on the mapped Risk-Targeted Maximum Considered Earthquake (MCER) spectral response acceleration parameters. TABLE 3.5-1: 2016 CBC Seismic Design Parameters, Latitude: 37.3337 Longitude: -121.90628
PARAMETER VALUE
Site Class D Mapped MCER Spectral Response Acceleration at Short Periods, SS (g) 2.11 Mapped MCER Spectral Response Acceleration at 1-second Period, S1 (g) 1.00 Site Coefficient, FA 1.00 Site Coefficient, FV 1.50 MCER Spectral Response Acceleration at Short Periods, SMS (g) 2.11 MCER Spectral Response Acceleration at 1-second Period, SM1 (g) 1.50 Design Spectral Response Acceleration at Short Periods, SDS (g) 1.41 Design Spectral Response Acceleration at 1-second Period, SD1 (g) 1.00 Mapped MCE Geometric Mean (MCEG) Peak Ground Acceleration, PGA (g) 0.50 Site Coefficient, FPGA 1.00 MCEG Peak Ground Acceleration adjusted for Site Class effects, PGAM (g) 0.82 Long period transition-period, TL 12 sec

Hanover R.S. Limited Partnership 1095 Rollins Road 14140.000.000 Geotechnical Exploration
Page | 8 July 27, 2018
4.0 CONSTRUCTION MONITORING Our experience and that of our profession clearly indicate that the risk of costly design, construction, and maintenance problems can be significantly lowered by retaining the design geotechnical engineering firm to: 1. Review the final grading and foundation plans and specifications prior to construction to
evaluate whether our recommendations have been implemented, and to provide additional or modified recommendations, as needed. This also allows us to check if any changes have occurred in the nature, design or location of the proposed improvements and provides the opportunity to prepare a written response with updated recommendations.
2. Perform construction monitoring to check the validity of the assumptions we made to prepare
this report. Excavation, shoring, and earthwork operations should be performed under the observation of our representative to check that the site is properly prepared, the selected fill materials are satisfactory, and that placement and compaction of the fills has been performed in accordance with our recommendations and the project specifications. Sufficient notification to us prior to earthwork is important.
If we are not retained to perform the services described above, then we are not responsible for any party’s interpretation of our report (and subsequent addenda, letters, and verbal discussions). 5.0 SITE RECOMMENDATIONS 5.1 DEMOLITION AND STRIPPING After demolition of the existing buildings, the site should be cleared of all obstructions, including existing foundations and debris that are not cleared by the excavation of the proposed parking garage. Any existing underground utilities at the site should be identified and either properly abandoned or relocated. Holes resulting from the removal of underground obstructions extending below the proposed finish grades should be cleared and backfilled with suitable properly compacted fill. Areas containing surface vegetation or organic-laden topsoil should be stripped to an appropriate depth to remove these materials. The amount of actual stripping should be determined in the field by the geotechnical engineer at the time of construction. Stripped materials should be removed from the site or stockpiled for later use in landscaping, if desired. 5.2 NON-ENGINEERED FILL REMOVAL As previously mentioned, we encountered up to 15 feet of non-engineered fill at the site. Such fill can undergo excessive and non-uniform settlement under new loads. We recommend removing all non-engineered fill within the building footprint and, if necessary, replacing it with moisture conditioned and compacted fill. In areas to receive other improvements, including site retaining walls, secondary slabs on grade, or flatwork we recommend removing at least 5 feet of non-engineered fill and replacing it with moisture conditioned and compacted fill. We should have an ENGEO representative onsite to determine if the 5 feet of removal is sufficient to create a stable base.

Hanover R.S. Limited Partnership 1095 Rollins Road 14140.000.000 Geotechnical Exploration
Page | 9 July 27, 2018
6.0 FOUNDATION RECOMMENDATIONS Based on the available soil data and anticipated structure type, the proposed structure can be supported on a mat foundation. The major considerations in foundation design at the site are the building loads, hydrostatic pressures, and potential uplift forces. Generally, a mat foundation will help bridge areas of localized settlement. Due to shallow groundwater and depth of excavation, the mat foundation should be designed for uplift forces. 6.1 MAT FOUNDATIONS The structure may be supported on a rigid mat foundation. The thickness of the mat will be driven by the structural design. Mat foundations should be thick enough to resist hydrostatic uplift pressures. Provided the remedial grading recommendations provided in Section 6.1.3 are incorporated during construction, the structural mat may be designed to impose an average allowable bearing pressure of at most 4,500 pounds per square foot (psf) for dead-plus-live loads. The allowable bearing capacity may be increased to 5,500 psf in areas of loading concentration. These values may be increased by one-third when considering transient loads, such as wind or seismic. If a spring constant is needed for design, a modulus of subgrade reaction (ks) of 100 pounds per square inch per inch of deflection (psi/in) can be used with a maximum allowable pressure of 4,000 psf. Resistance to lateral loads may be provided by frictional resistance between the foundation concrete and the subgrade soil and by passive earth pressure acting against the side of the foundation. A coefficient of friction of 0.30 can be used between concrete and the subgrade. An equivalent fluid unit weight of 250 pcf may be used for passive pressure. 6.1.1 Settlement We recommend mat foundation design consider the following settlement considerations: TABLE 6.1.1-1: Settlement Considerations
TOTAL SEISMICALLY INDUCED SETTLEMENT (INCHES)
TOTAL STATIC SETTLEMENT (INCHES)
½ 1¼ We anticipate the weight of the soil being excavated will offset a portion of the proposed dead loads of the structure. As shown in the current floor plans, we anticipate that static settlement below the bottom of the mat will be approximately 1¼ inch under allowable bearing pressures. Differential settlement over a distance of 50 feet will be approximately half the total settlement. Most of the static settlement will occur during construction. 6.1.2 Uplift Forces We anticipate that the basement-level garage will be below the groundwater level and will have to be designed for hydrostatic uplift loads. Uplift resistance can be provided by the weight of the foundation elements and structural loads. Additional resistance to uplift may be provided by

Hanover R.S. Limited Partnership 1095 Rollins Road 14140.000.000 Geotechnical Exploration
Page | 10 July 27, 2018
installing hold-down anchors, if necessary. However, given the intermittent layers of liquefiable material, the anchors would need to be extended to a depth that is likely cost prohibitive. For planning purposes, the anchor capacity should be evaluated using an ultimate bond strength between grout and soil of 1,400 psf. This value assumes the grout is placed under pressure during casing withdrawal and may be increased by 30 percent for wind and seismic loading. Due to the intermittent potentially liquefiable layers underlying the site, the adhesion between grout and the soil should begin at 30 feet bgs. The anchors should be spaced no closer than 3 times the shaft diameter and have a minimum embedment length of 50 feet bgs. The design-build contractor should design based on an appropriate bond capacity and this value should be verified in the field based on load testing. We should review appropriate design documentation to assure that our geotechnical recommendations are being followed by the anchor designer. 6.1.3 Subgrade Treatment for Structural Mat Foundations The mat foundation should be placed neat against the undisturbed soil. The pad subgrade should not be allowed to dry before placing concrete. The pad subgrade should be checked by a representative of our firm prior to concrete placement for compliance with these moisture requirements and to confirm the adequacy of the bearing soil. Soft or loose soil present at the bottom of the excavation should be removed and replaced with engineered fill or lean concrete. To reduce the disturbance of the mat subgrade once prepared, we recommend that the subgrade be covered with a “rat” or “mud” slab of lean concrete at least 2 inches thick. 6.2 WATERPROOFING We recommend that the design groundwater level for the project be assumed to be at a depth of 10 feet bgs. Due to operational concerns, potential settlement impacts on nearby buildings and agency permissions, we recommend that permanent dewatering not be considered, and recommend that the concrete slabs and walls that will be constructed below the design groundwater elevation be waterproofed and designed to resist hydrostatic and/or uplift pressures. The waterproofing should be designed by a consultant that specializes in permanent waterproofing construction. 7.0 BASEMENT WALLS AND NON-BUILDING RETAINING WALLS 7.1 BASEMENT WALL LATERAL SOIL PRESSURES The garage basement walls will act as retaining walls. Basement walls should be designed for at-rest lateral loading conditions. We recommend placing a drain behind all walls above the design groundwater level to reduce hydrostatic pressure; if a drain is not feasible, hydrostatic pressure should be added to the equivalent fluid pressure. Recommendations for wall drainage follow in a later section. Some miscellaneous cantilever retaining walls may be required and can be designed for active lateral loading conditions. The recommended lateral equivalent fluid pressures (static case) are presented below: TABLE 7.1-1: Lateral Earth Pressures
LOADING CONDITION DRAINED PRESSURE (PCF)
UNDRAINED PRESSURE (PCF)
Cantilevered (Active) 45 80 Restrained (At-Rest) 65 90

Hanover R.S. Limited Partnership 1095 Rollins Road 14140.000.000 Geotechnical Exploration
Page | 11 July 27, 2018
The design groundwater level should be assumed to be located at approximately 5 feet below ground surface. Permanent dewatering is not recommended; therefore, basement walls should be designed to resist hydrostatic pressures. Where surcharge loads from vehicles are expected within a distance equal to the height of the walls, the walls should be designed for an additional uniform lateral pressure of 100 psf to be applied over the entire height of the wall or 10 feet, whichever is less. 7.2 SEISMIC DESIGN CONSIDERATIONS Seismic conditions need to be considered in the design of the garage basement retaining walls. Under seismic conditions, the active incremental seismic force along the face of a retaining wall should be added to the static active pressures, and can be calculated as follows:
ΔP = 15 x H2
Where H is the design height of the wall (in feet) and ΔP is the active incremental seismic force in pounds per foot of wall. This force has a horizontal direction and should be applied at 0.3 x H from the base of the wall. This force should be combined with the appropriate active equivalent pressure, regardless if the wall is cantilevered or restrained. 7.3 NON-BUILDING RETAINING WALL LATERAL SOIL PRESSURES Passive pressures acting on retaining walls may be assumed as 250 pounds per cubic foot (pcf), provided that the area in front of the retaining wall is level for a distance of at least 10 feet or three times the depth of foundation, whichever is greater. The upper 1 foot of soil should be excluded from passive pressure computations unless it is confined by pavement or concrete slab. Active pressures may be taken from Table 7.1-1. Non-building retaining walls may be supported on continuous footings designed with an allowable bearing capacity of 1,500 psf. 7.3.1 Wall Drainage Unless the non-building retaining walls are designed for hydrostatic pressures, these walls should be provided with drainage facilities. Wall drainage may be provided using a 4-inch-diameter perforated pipe embedded in Class 2 permeable material, or free-draining gravel surrounded by synthetic filter fabric. The width of the drain blanket should be at least 12 inches. The drain blanket should extend to about 1 foot below the finished grades. As an alternative, prefabricated synthetic wall drain panels can be used. The upper 1 foot of wall backfill should consist of clayey soils. Drainage should be collected by perforated pipes and directed a sump or, if feasible, drained into the storm drain system. All backfill should be placed in accordance with recommendations provided above for engineered fill. Light equipment should be used during backfill compaction to minimize possible overstressing of the walls. 8.0 EXCAVATION DEWATERING AND SHORING Excavation dewatering and shoring are temporary works that are typically the responsibility of the contractor to design, install, maintain and monitor. An experienced shoring and dewatering system designer should be retained to select and design these systems. The following sections

Hanover R.S. Limited Partnership 1095 Rollins Road 14140.000.000 Geotechnical Exploration
Page | 12 July 27, 2018
provide some general considerations that should be incorporated into shoring and dewatering system design. Geotechnical shoring design recommendations are dependent on performance criteria, the type of system selected and construction sequencing. 8.1 TEMPORARY SHORING Temporary shoring pressures for the anticipated final excavation configuration are provided in Figure 6. Passive pressures shown may be applied over two pier diameters. As information regarding construction equipment types and adjacent building loads become available, we can provide surcharge load recommendations to account for heavy construction equipment as well as the existing buildings adjacent the excavation. Additionally, once excavation and shoring sequencing is established, we will provide appropriate intermediate pressure diagrams to address the various stages of construction. Given the proposed excavation depth, it may be necessary to restrain the shoring by using a single-level or multi-level system of tie-back anchors or to provide internal bracing. Prior to tie-back design and construction, permission from the neighboring properties will have to be obtained if tie-backs are to encroach into those adjacent properties. Tie-back anchors may be installed to avoid adjacent underground utilities. For planning purposes, the anchor capacity should be evaluated using an ultimate bond strength between grout and soil of 1,400 psf. The tiebacks may be installed through the selected shoring system with 15 to 20 degree inclinations. 8.2 CONSTRUCTION DEWATERING There are a number of variables that will influence the effectiveness of a dewatering system, including the number, depth, screened interval, and pumping rate of wells. The local sewer agency may prohibit the discharge of groundwater into the system or may charge a fee to do so. The water level should be maintained at least 3 feet below the bottom of the deepest excavation during construction. The selection of equipment, actual depth, and spacing of the wells should be determined by the dewatering designer/contractor. The dewatering system implemented should be selected to have minimal impact on the groundwater level surrounding the proposed excavation. 8.3 PRE-CONSTRUCTION SURVEY AND CONSTRUCTION MONITORING Excavation construction will take place adjacent to existing buildings, streets, improvements, and underground utilities. We recommend that a pre-construction survey (e.g. crack survey) and monitoring program for the surrounding culverts, buildings, roadways, utilities, etc. that may be affected by construction activities be performed before and during construction. This survey will form a basis for any damage claims and also assist the contractor in assessing the performance of the shoring or excavation slopes. The pre-construction survey should record the elevation and horizontal position of critical installations within 50 feet minimum and may consist of photographs, video tapes, topographic survey, etc. We also recommend that a system of construction monitoring be installed. This may consist of inclinometers and groundwater monitoring wells that are installed within a distance of 5 to 15 feet from the excavation towards the existing buildings. Vibration monitoring should be considered during operations of heavy equipment such as pile driving, demolition, etc. In addition, a

Hanover R.S. Limited Partnership 1095 Rollins Road 14140.000.000 Geotechnical Exploration
Page | 13 July 27, 2018
settlement survey should initially be performed on a weekly basis during excavation and on a monthly basis, approximately one month after the excavation has been completed, at a minimum. 9.0 SECONDARY SLAB-ON-GRADE Secondary slabs include exterior walkways, patios, and steps. Secondary slabs-on-grade should be designed specifically for their intended use and loading requirements. Cracking of the exterior flatwork is normal as it is part of the concrete curing process and should be expected. Frequent control joints should be provided during slab construction for control of cracking. As a minimum requirement, slabs-on-grade should be reinforced with steel bars; in our experience, welded wire mesh may not be sufficient to control slab cracking. The Structural Engineer should design the actual slab reinforcement. Exterior slabs should slope away from the building to prevent water from flowing toward the foundations. Consideration should be given to lightly moistening the site soils just prior to concrete placement.
9.1 SUBGRADE PREPARATION Following demolition and stripping, all areas to receive minor fills, secondary slabs-on-grade, or pavements should be scarified to a depth of at least 12 inches, moisture conditioned and compacted to the requirements for engineered fill, presented below. The finished subgrade should be firm and non-yielding under the weight of compaction equipment. 9.2 SUITABLE FILL MATERIALS Site soil containing less than 3 percent organics are suitable for use as engineered fill. With the exception of the high plastic clay noted in the northern portion of the site, the site material is suitable for reuse as fill. The geotechnical engineer should be informed if any soil import is contemplated. A sample of the proposed import material should be submitted to the geotechnical engineer for evaluation prior to delivery at the site. 9.3 PLACEMENT OF FILL
After removal of any soft soils and loose fill, the exposed non-yielding surface of all areas to receive minor fills, secondary slabs-on-grade, or pavements should be scarified to a depth of 12 inches, moisture conditioned, and recompacted to provide adequate bonding with the initial lift of fill. All fills should be placed in thin lifts. The lift thickness should not exceed 12 inches or the depth of penetration of the compaction equipment used, whichever is less. The following compaction control requirements should be applied to onsite materials: Test Procedures: ASTM D-1557. Required Moisture Content: Not less than 3 percentage points above
optimum moisture content. Required Relative Compaction: Minimum 90 percent

Hanover R.S. Limited Partnership 1095 Rollins Road 14140.000.000 Geotechnical Exploration
Page | 14 July 27, 2018
Relative compaction refers to the in-place dry density of soil expressed as a percentage of the maximum dry density of the same material. 9.4 DRAINAGE Improper drainage may result in fill saturation with consequent loss of compaction and fill strength. It is very important that the perimeter of the structure be positively graded at all times to provide for rapid removal of surface water. Ponding of water or seepage toward foundation systems at any time during or after construction must be prevented. Ponding of stormwater must not be permitted on the building during prolonged periods of inclement weather. Stormwater from roof downspouts should be conveyed in closed drain systems to a solid pipe that discharges to the street or storm drain system. 10.0 PAVEMENT DESIGN 10.1 FLEXIBLE PAVEMENT For design, we assumed a Resistance (R-Value) of 5. The design sections may be reduced based on R-Value testing of samples collected from actual pavement subgrade. Using a range of traffic indices, we developed the following recommended pavement sections using Chapter 630 of the Caltrans Highway Design Manual (including the asphalt factor of safety), presented in the table below.
TABLE 10.1-1: Recommended Asphalt Concrete Pavement Sections
TRAFFIC INDEX SECTION
HOT MIX ASPHALT (INCHES)
CLASS 2 AGGREGATE BASE (INCHES)
5 3 10 6 3½ 13 7 4 16 8 5 18
The civil engineer should determine the appropriate traffic indices based on the estimated traffic loads and frequencies. 10.2 RIGID PAVEMENT Concrete pavement sections can be used to resist heavy loads and turning forces in areas such as fire lanes or trash enclosures. Final design of rigid pavement sections, and accompanying reinforcement, should be performed based on estimated traffic loads and frequencies. We recommend the following minimum design sections for rigid pavements: A minimum section of 6 inches of Portland Cement concrete over 6 inches of Caltrans Class
2 Aggregate Base.
Concrete pavement should have a minimum 28-day compressive strength of 3,500 psi.

Hanover R.S. Limited Partnership 1095 Rollins Road 14140.000.000 Geotechnical Exploration
Page | 15 July 27, 2018
Provide minimum control joint spacing in accordance with Portland Cement Association guidelines.
As an additional measure to improve performance, rigid pavements may be constructed with
thickened edges extending at least beneath the aggregate base and 2 inches into compacted soil to reduce water infiltration, where adjacent to landscaped areas.
10.3 AGGREGATE BASE COMPACTION Aggregate base should be compacted at or above optimum moisture and a minimum of 95 percent relative compaction. Aggregate Base should meet the requirements for ¾-inch maximum Class 2 Aggregate Base in accordance with Section 26-1.02a of the latest Caltrans Standard Specifications. 11.0 UTILITIES We anticipate that differential settlement between the building and surrounding unimproved areas could be up to approximately 1 inch. Entry and pipe connections should be assessed to confirm the anticipated differential settlement can be tolerated; otherwise, flexible entry and pipe connections may be considered. We recommend that utility trench backfilling be done under the observation of a geotechnical engineer. Pipe zone backfill (i.e., material beneath and immediately surrounding the pipe) may consist of a well-graded import or native material less than ¾ inch in maximum dimension. Trench zone backfill (i.e., material placed between the pipe zone backfill and the ground surface) may consist of native soil compacted in accordance with recommendations for engineered fill. Where import material is used for pipe zone backfill, we recommend it consist of fine- to medium-grained sand or a well-graded mixture of sand and gravel, and that this material not be used within 2 feet of finish grades. In general, uniformly graded gravel should not be used for pipe or trench zone backfill due to the potential for migration of: (1) soil into the relatively large void spaces present in this type of material, and (2) water along trenches backfilled with this type of material. All utility trenches entering buildings and paved areas must be provided with an impervious seal consisting of native materials or concrete where the trenches pass under the building perimeter or curb lines. The impervious plug should extend at least 3 feet to either side of the crossing. This is to prevent surface water percolation into the sands under foundations and pavements where such water would remain trapped in a perched condition. Care should be exercised where utility trenches are located beside foundation areas. Utility trenches constructed parallel to foundations should be located entirely above a plane extending down from the lower edge of the footing at an angle of 45 degrees. Utility companies and Landscape Architects should be made aware of this information. Utility trenches in areas to be paved should be constructed in accordance with City of Burlingame requirements. Compaction of trench backfill by jetting is not an appropriate method of compaction. If there appears to be a conflict between the City or other agency requirements and the recommendations contained in this report, this should be brought to the Owner’s attention for resolution prior to submitting bids.

Hanover R.S. Limited Partnership 1095 Rollins Road 14140.000.000 Geotechnical Exploration
Page | 16 July 27, 2018
12.0 LIMITATIONS AND UNIFORMITY OF CONDITIONS This report presents geotechnical recommendations for design of the improvements discussed in Section 1.3 for the 1095 Rollins Road project. If changes occur in the nature or design of the project, we should be allowed to review this report and provide additional recommendations, if any. It is the responsibility of the owner to transmit the information and recommendations of this report to the appropriate organizations or people involved in design of the project, including but not limited to developers, owners, buyers, architects, engineers, and designers. The conclusions and recommendations contained in this report are solely professional opinions and are valid for a period of no more than 2 years from the date of report issuance. We strived to perform our professional services in accordance with generally accepted geotechnical engineering principles and practices currently employed in the area; no warranty is expressed or implied. There are risks of earth movement and property damages inherent in building on or with earth materials. We are unable to eliminate all risks or provide insurance; therefore, we are unable to guarantee or warrant the results of our services. This report is based upon field and other conditions discovered at the time of report preparation. We developed this report with limited subsurface exploration data. We assumed that our subsurface exploration data is representative of the actual subsurface conditions across the site. Considering possible underground variability of soil, rock, stockpiled material, and groundwater, additional costs may be required to complete the project. We recommend that the owner establish a contingency fund to cover such costs. If unexpected conditions are encountered, notify ENGEO immediately to review these conditions and provide additional and/or modified recommendations, as necessary. Our services did not include soil volume change factors or flood potential. In addition, our geotechnical exploration did not include work to determine the existence of possible hazardous materials. If any hazardous materials are encountered during construction, notify the proper regulatory officials immediately. This document must not be subject to unauthorized reuse, that is, reusing without written authorization of ENGEO. Such authorization is essential because it requires ENGEO to evaluate the document’s applicability given new circumstances, not the least of which is passage of time. Actual field or other conditions will necessitate clarifications, adjustments, modifications or other changes to ENGEO’s documents. Therefore, ENGEO must be engaged to prepare the necessary clarifications, adjustments, modifications or other changes before construction activities commence or further activity proceeds. If ENGEO’s scope of services does not include onsite construction observation, or if other persons or entities are retained to provide such services, ENGEO cannot be held responsible for any or all claims arising from or resulting from the performance of such services by other persons or entities, and from any or all claims arising from or resulting from clarifications, adjustments, modifications, discrepancies or other changes necessary to reflect changed field or other conditions. We determined the lines designating the interface between layers on the exploration logs using visual observations. The transition between the materials may be abrupt or gradual. The exploration logs contain information concerning samples recovered, indications of the presence of various materials such as clay, sand, silt, rock, existing fill, etc., and observations of groundwater encountered. The field logs also contain our interpretation of the subsurface

Hanover R.S. Limited Partnership 1095 Rollins Road 14140.000.000 Geotechnical Exploration
Page | 17 July 27, 2018
conditions between sample locations. Therefore, the logs contain both factual and interpretative information. Our recommendations are based on the contents of the final logs, which represent our interpretation of the field logs.

Hanover R.S. Limited Partnership 1095 Rollins Road 14140.000.000 Geotechnical Exploration
July 27, 2018
SELECTED REFERENCES American Society of Civil Engineers. Minimum Design Loads for Buildings and other Structures
ASCE 7-10. Reston: American Society of Civil Engineers. 2010. American Concrete Institute, 2008, Building Code Requirements for Structural Concrete
(ACI 318-08) and Commentary (ACI 318R-08). BDE Architects, Development Concept, 1095 Rollins Road, Burlingame, California, June 20, 2018. Bray, J. D. and Sancio, R. B.,2006 “Assessment of the liquefaction susceptibility of fine-grained
soils,” Journal of Geotechnical and Geoenvironmental Engineering, ASCE, Vol. 132, No. 9, pp. 1165-1177.
Bryant, W. and Hart, E., 2007, Special Publication 42, “Fault-Rupture Hazard Zones in California”, Interim Revision 2007, California Department of Conservation. California Building Standards Commission, 2016 California Building Code, Volumes 1 and
2.Sacramento, California. ENGEO, Phase II Environmental Site Assessment, 1095 Rollins Road, Burlingame, California;
June 11, 2018, Project No. 14140.000.000. Ishihara, K., 1985. Stability of natural deposits during earthquakes, in Proceedings, 11th
International Confernece on Soil Mechanics and Foundation Engineering, San Francisco, A. A. Balkema, Rotterdam, pp.321-376
Nichols, D.R. and Wright, N.A., 1971, Preliminary Map of Historic Margins of Marshland, San
Francisco Bay, California, Open-File Map, USGS. Pampeyan E.H., 1994, Geologic Map of Montara Mountain and San Mateo, 7½ quadrangles, San Mateo County, California, USGS. Robertson, P. K. and Campenella, R. G. (1988), Guidelines for Geotechnical Design Using CPT
and CPTU Data. Robertson, P. K. (2009), Performance based earthquake design using the CPT, Gregg Drilling and
Testing, Inc. Robertson, P. K. and Lisheng, S., 2010, Estimation of Seismic Compression in dry soils using the
CPT. Fifth International Conference on Recent Advances in Geotechnical Earthquake. SEAOC, 1996, Recommended Lateral Force Requirements and Tentative Commentary. Southern California Earthquake Center (1999), Recommended Procedures For Implementation of
DMG Special Publication 117 Guidelines for Analyzing and Mitigating Liquefaction in California.
United States Geological Survey (2008). Uniform California Earthquake Rupture Forecast.

Hanover R.S. Limited Partnership 1095 Rollins Road 14140.000.000 Geotechnical Exploration
SELECTED REFERENCES (Continued)
July 27, 2018
United States Geological Survey (2010). Quaternary Fault and Fold Database of the United States. Youd, T. L. and I. M. Idriss, 2001, Liquefaction Resistance of Soils: Summary Report from the 1996
NCEER and 1998 NCEER/NSF Workshop on Evaluation of Liquefaction Resistance of Soils.
Zhang, G. Robertson. P.K, Brachman, R., 2002, Estimating Liquefaction Induced Ground
Settlements from the CPT, Canadian Geotechnical Journal, 39: pp 1168-1180.

FIGURES FIGURE 1: Vicinity Map FIGURE 2: Site Plan FIGURE 3: Regional Geologic Map FIGURE 4: Seismic Hazard Zone Map FIGURE 5: Regional Faulting and Seismicity Map FIGURE 6: Regional Groundwater Map FIGURE 7: Lateral Earth Pressure for Temporary Shoring

0
0 FEET
METERS
20001000
VICINITY MAP1095 ROLLINS ROAD
BURLINGAME, CALIFORNIA
14110.000.000
AS SHOWN 1
SITE


0
0 FEET
METERS
20001000
REGIONAL GEOLOGIC MAP1095 ROLLINS ROAD
BURLINGAME, CALIFORNIA
14110.000.000
AS SHOWN 3
SITE
Qm
QTsQamQacQsr
Qoa
Qf1
EXPLANATION
QcTme
ARTIFICIAL FILL
SEDIMENTARY DEPOSITS
MEDIUM-GRAINED ALLUVIUM (HOLOCENE)
COARSE-GRAINED ALLUVIUM (HOLOCENE)
COLLUVIUM
BAY MUD
OLDER ALLUVIUM (PLEISTOCENE)
COLMA FORMATION
MERCED FORMATION
GEOLOGIC CONTACT-DASHED WHEREGRADATIONAL OR APPROXIMATELY LOCATED
FAULT-DASHED WHERE INFERRED,DOTTED WHERE CONCEALED, QUERIEDWHERE EXISTENCE IS DOUBTFUL.

0
0 FEET
METERS
20001000
SEISMIC HAZARD ZONE MAP1095 ROLLINS ROAD
BURLINGAME, CALIFORNIA
14110.000.000
AS SHOWN 4
SITE
EXPLANATIONLIQUEFACTIONAREAS WHERE HISTORIC OCCURRENCE OF LIQUEFACTION, OR LOCALGEOLOGICAL, GEOTECHNICAL AND GROUNDWATER CONDITIONS INDICATEA POTENTIAL FOR PERMANENT GROUND DISPLACEMENTS SUCH THATMITIGATION AS DEFINED IN PUBLIC RESOURCES CODE SECTION 2693(c)WOULD BE REQUIRED

ORTIGALITA
GREENVILLE
SANG
REG
OR
IO
SANANDREAS
HAYWARD
POINTREYES
SANANDREAS
CONCORD
GR
EENVALLEY
VACA
SANJOAQUIN
TOLAY
RODGERSCREEK
CO
RD
ELIA
MIDWAY
SILVERCREEK
SANJOSE
MONTE VISTA SHANNON
BERROCAL
ZAYANTE
VERGELES
SARGENT
DUNNIGAHHILLS
MAACAMA
CALAVERAS
CARNEGIE CORAL HOLLOW
WEST
NAPA
BENNETTVALLEY
HUN
TINGC
REEK
- BERR
YESSA
ALEXANDER-REDWOOD
HILL
GEYSERPEAK
COLLAYOMI
ANTIOCH
BEARM
OU
NTAIN
S
BEARMOUNTAINS
MELONES
BEARMOUNTAINS
TAHOE
- SIERRAFRONTAL
GE
GR
EA
TV
AL
LE
YF
AU
LT
GR
EA
TV
AL
LE
YF
AU
LT
SAN ANDREAS
Santa Cruz Santa Clara
Merced
San MateoMariposa
Alameda
Stanislaus
Contra CostaSan Joaquin
MarinTuolumne
CalaverasSolano
AmadorSacramento
NapaSonoma Alpine
YoloEl Dorado
Lake
SanFrancisco
0
0
MILES
KILOMETERS
15
30
EXPLANATION
MAGNITUDE 7+
MAGNITUDE 6-7
MAGNITUDE 5-6
HISTORIC FAULT
HOLOCENE FAULT
QUATERNARY FAULT
HISTORIC BLIND THRUSTFAULT ZONE
SITE
REGIONAL FAULTING AND SEISMICITY1095 ROLLINS ROAD
BURLINGAME, CALIFORNIA
14140.000.000
AS SHOWN 5

0
0 FEET
METERS
20001000
REGIONAL GROUNDWATER MAP1095 ROLLINS ROAD
BURLINGAME, CALIFORNIA
14110.000.000
AS SHOWN 6
SITE
EXPLANATION
GROUNDWATER CONTOUR
afemaf
Qhbm
ac ARTIFICIAL STREAM CHANNELS
ARTIFICIAL FILL OVER ESTUARINE MUD
ARTIFICIAL UNDIFFERENTIATED FILL
SAN FRANCISCO BAY MUD
QhfQha
QhcQpfQc
UNDIFFERENTIATED ALLUVIUM (HOLOCENE)
ALLUVIAL FAN (HOLOCENE)
ALLUVIAL SEDIMENTS (LATE PLEISTOCENE TO HOLOCENE)
OLD ALLUVIAL FAN (PLEISTOCENE)
COLMA FORMATION

SHORING
BOTTOM OFOVEREXCAVATION
250D
H
30H
0.2H
1'
D
100psf*
10'
STREET TRAFFICSURCHARGE
*DESIGNER SHOULD CONFIRM THAT THIS VALUEIS ADEQUATE. (SHOULD BE INCREASED IFLARGE EQUIPMENT OR STOCKPILED SOIL ISLOCATED ADJACENT TO SHORING)
NOTES:
1. ASSUME GROUNDWATER WILL BE MAINTAINEDA MINIMUM OF THREE FEET BELOW BOTTOMOF EXCAVATION.
2. D AND H ARE TO BE IN FEET.
3. SAFETY FACTOR TO BE INCLUDED BYDESIGNER.
4. ASSUMES LEVEL GROUND SURFACE AT TOPOF SHORING.
5. ASSUMES AT LEAST ONE LEVEL OF TIEBACKSOR INTERNAL BRACING.
6. D MUST BE ADEQUATE TO PROVIDE STABILITYTO THE BOTTOM OF THE EXCAVATION ANDPREVENT PIPING OF WATER.
7. SURCHARGE LOADS FROM ADJACENTBUILDINGS AND IMPROVEMENTS NOTINCLUDED.
1095 ROLLINS ROAD
BURLINGAME, CALIFORNIA
14140.000.000
NO SCALE 7
APPENDIX A BORING LOG KEY EXPLORATION LOGS

KEY TO BORING LOGS
3" 12"
(S.P.T.) Number of blows of 140 lb. hammer falling 30" to drive a 2-inch O.D. (1-3/8 inch I.D.) sampler
* Unconfined compressive strength in tons/sq. ft., asterisk on log means determined by pocket penetrometer
MOISTURE CONDITION
DRYDamp but no visible waterMOIST
Visible freewaterWET
LINE TYPES
Solid - Layer Break
_ _ _ _ _ _ Dashed - Gradational or approximate layer break
Groundwater level during drilling
Stabilized groundwater level
SAMPLER SYMBOLS
California (2.5" O.D.) sampler
GROUND-WATER SYMBOLS
Modified California (3" O.D.) sampler
MAJOR TYPES
CLEAR SQUARE SIEVE OPENINGSGRAIN SIZES
Dames and Moore Piston
200 40 10 4 3/4 "
MORE THAN HALFCOARSE FRACTION
IS LARGER THANNO. 4 SIEVE SIZE
GP - Poorly graded gravels or gravel-sand mixtures
SC - Clayey sand, sand-clay mixtures
CH - Fat clay with high plasticity
OH - Highly plastic organic silts and clays
PT - Peat and other highly organic soils
Dusty, dry to touch
SILTS AND CLAYS LIQUID LIMIT GREATER THAN 50 %
U.S. STANDARD SERIES SIEVE SIZE
SILTS AND CLAYS LIQUID LIMIT 50 % OR LESS
CO
AR
SE
-GR
AIN
ED
SO
ILS
MO
RE
TH
AN
HA
LF O
F M
AT
'L L
AR
GE
R T
HA
N #
200
SIE
VE
Continuous Core
Bag Samples
FIN
E-G
RA
INE
D S
OIL
S M
OR
ET
HA
N H
ALF
OF
MA
T'L
SM
ALL
ER
TH
AN
#20
0 S
IEV
E
For fine-grained soils with 15 to 29% retained on the #200 sieve, the words "with sand" or "with gravel" (whichever is predominant) are added to the group name.
For fine-grained soil with >30% retained on the #200 sieve, the words "sandy" or "gravelly" (whichever is predominant) are added to the group name.
CLEAN GRAVELS WITHLESS THAN 5% FINES
GRAVELS
GRAVELS WITH OVER 12 % FINES
HIGHLY ORGANIC SOILS
SANDS WITH OVER 12 % FINES
SANDS
GM - Silty gravels, gravel-sand and silt mixtures
GC - Clayey gravels, gravel-sand and clay mixtures
SW - Well graded sands, or gravelly sand mixtures
SP - Poorly graded sands or gravelly sand mixtures
SM - Silty sand, sand-silt mixtures
ML - Inorganic silt with low to medium plasticity
CL - Inorganic clay with low to medium plasticity
MORE THAN HALFCOARSE FRACTIONIS SMALLER THANNO. 4 SIEVE SIZE
CLEAN SANDS WITHLESS THAN 5% FINES
CONSISTENCYRELATIVE DENSITY
FINE
STRENGTH*
OVER 4
1/2-1
0-1/41/4-1/2
1-22-4
SILTSAND
CLAYS
VERY STIFFHARD
STIFF
VERY SOFTSOFT
SILTS AND CLAYSBLOWS/FOOT
0-4
COARSEMEDIUM
MEDIUM STIFF10-3030-50
OVER 50
4-10VERY LOOSE
BOULDERSCOBBLESCOARSEFINE
SAND GRAVEL
(S.P.T.)
MEDIUM DENSEDENSE
LOOSE
SANDS AND GRAVELS
VERY DENSE
GW - Well graded gravels or gravel-sand mixtures
OL - Low plasticity organic silts and clays
MH - Elastic silt with high plasticity
DESCRIPTION
S.P.T. - Split spoon sampler
Shelby Tube
Grab Samples
NR No Recovery

LEAN CLAY WITH SAND (CL), dark yellowish brown,moist, medium plasticity, some fine sand, some organics [FILL]
CLAYEY SAND (SC), light yellowish brown, moist,medium plasticity, fine- to medium-grained sand [FILL]
FAT CLAY WITH SAND (CH), grayish green, mediumstiff, moist, high plasticity, trace organics and wood [FILL]
Becomes soft
More gravels at 14'
CLAYEY SAND WITH GRAVEL (SC), dark yellowishbrown to olive brown, medium dense, moist, mediumplasticity, angular fine- to coarse-grained sand, clay
Increasing fine gravel content, decreasing fines content.
6
2
<50 psi
34
20
64
87
24
33
40
54
18
55.3 67.2
800*
732
TV
UC
S. Waganaar / TBBritton ExplorationMud Rotary140 lb. Auto Trip
Geotechnical Exploration1095 Rollins Road
Burlingame, CA14140.000.000
DATE DRILLED:HOLE DEPTH:
HOLE DIAMETER:SURF ELEV (WGS84):
6/13/2018Approx. 61½ ft.4.0 in.Approx. 12 ft.
Dep
th in
Fee
t
5
10
15
20
25
Sam
ple
Typ
eLOGGED / REVIEWED BY:DRILLING CONTRACTOR:
DRILLING METHOD:HAMMER TYPE:
DESCRIPTION
Wat
er L
evel
Blo
w C
ount
/Foo
t
Liqu
id L
imit
Pla
stic
Lim
it
Pla
stic
ity In
dex
Fin
es C
onte
nt(%
pas
sing
#20
0 si
eve)
Moi
stur
e C
onte
nt(%
dry
wei
ght)
Dry
Uni
t Wei
ght
(pcf
)
She
ar S
tren
gth
(psf
)*f
ield
app
roxi
mat
ion
Atterberg Limits
Unc
onfin
ed S
tren
gth
(tsf
)*f
ield
app
roxi
mat
ion
Str
engt
h T
est T
ype
Log
Sym
bol
LATITUDE: 37.588639 LONGITUDE: -122.360325E
leva
tion
in F
eet
10
5
0
-5
-10
LOG OF BORING 1-B1LO
G -
GE
OT
EC
HN
ICA
L_S
U+
QU
W/ E
LEV
109
5 R
OLL
INS
RD
.GP
J E
NG
EO
INC
.GD
T 7
/20
/18

SANDY LEAN CLAY (CL), pale yellow to olive, moist,medium plasticity, medium- to coarse-grained sand
Gravel lense
CLAYEY SAND WITH GRAVEL (SC), dark yellowishbrown mottled with pale yellowish red, very stiff, moist,medium plasticity, some fine to coarse gravel, 54% fine tocoarse sand
LEAN CLAY WITH SAND (CL), pale yellow to lightyellowish brown, stiff, moist, medium plasticity, some finesand
Color change to yellowish brown
SANDY CLAY WITH GRAVEL (CL), yellowish brown, stiff,moist, medium plasticity, fine to coarse sand, fine tomedium gravel
21
19
40
29
24
79
33
29.1 96.4 3520
1.5*
UU
PP
S. Waganaar / TBBritton ExplorationMud Rotary140 lb. Auto Trip
Geotechnical Exploration1095 Rollins Road
Burlingame, CA14140.000.000
DATE DRILLED:HOLE DEPTH:
HOLE DIAMETER:SURF ELEV (WGS84):
6/13/2018Approx. 61½ ft.4.0 in.Approx. 12 ft.
Dep
th in
Fee
t
30
35
40
45
50
Sam
ple
Typ
eLOGGED / REVIEWED BY:DRILLING CONTRACTOR:
DRILLING METHOD:HAMMER TYPE:
DESCRIPTION
Wat
er L
evel
Blo
w C
ount
/Foo
t
Liqu
id L
imit
Pla
stic
Lim
it
Pla
stic
ity In
dex
Fin
es C
onte
nt(%
pas
sing
#20
0 si
eve)
Moi
stur
e C
onte
nt(%
dry
wei
ght)
Dry
Uni
t Wei
ght
(pcf
)
She
ar S
tren
gth
(psf
)*f
ield
app
roxi
mat
ion
Atterberg Limits
Unc
onfin
ed S
tren
gth
(tsf
)*f
ield
app
roxi
mat
ion
Str
engt
h T
est T
ype
Log
Sym
bol
LATITUDE: 37.588639 LONGITUDE: -122.360325E
leva
tion
in F
eet
-15
-20
-25
-30
-35
LOG OF BORING 1-B1LO
G -
GE
OT
EC
HN
ICA
L_S
U+
QU
W/ E
LEV
109
5 R
OLL
INS
RD
.GP
J E
NG
EO
INC
.GD
T 7
/20
/18

SANDY CLAY WITH GRAVEL (CL), yellowish brown, stiff,moist, medium plasticity, fine to coarse sand, fine tomedium gravel
Decreasing gravel content
FAT CLAY (CH), grayish green, very stiff to hard, moist,high plasticity, trace organics and wood fragments
End boring at 61.5 feet below ground surface.Groundwater was not measured due to drilling methodused.
53
31
3.5* PP
S. Waganaar / TBBritton ExplorationMud Rotary140 lb. Auto Trip
Geotechnical Exploration1095 Rollins Road
Burlingame, CA14140.000.000
DATE DRILLED:HOLE DEPTH:
HOLE DIAMETER:SURF ELEV (WGS84):
6/13/2018Approx. 61½ ft.4.0 in.Approx. 12 ft.
Dep
th in
Fee
t
55
60
Sam
ple
Typ
eLOGGED / REVIEWED BY:DRILLING CONTRACTOR:
DRILLING METHOD:HAMMER TYPE:
DESCRIPTION
Wat
er L
evel
Blo
w C
ount
/Foo
t
Liqu
id L
imit
Pla
stic
Lim
it
Pla
stic
ity In
dex
Fin
es C
onte
nt(%
pas
sing
#20
0 si
eve)
Moi
stur
e C
onte
nt(%
dry
wei
ght)
Dry
Uni
t Wei
ght
(pcf
)
She
ar S
tren
gth
(psf
)*f
ield
app
roxi
mat
ion
Atterberg Limits
Unc
onfin
ed S
tren
gth
(tsf
)*f
ield
app
roxi
mat
ion
Str
engt
h T
est T
ype
Log
Sym
bol
LATITUDE: 37.588639 LONGITUDE: -122.360325E
leva
tion
in F
eet
-40
-45
LOG OF BORING 1-B1LO
G -
GE
OT
EC
HN
ICA
L_S
U+
QU
W/ E
LEV
109
5 R
OLL
INS
RD
.GP
J E
NG
EO
INC
.GD
T 7
/20
/18

ASPHALT 3 inches thickGRAVELLY CLAY (CL), dark grayish green, moist,medium plasticity
LEAN CLAY (CL), dark brownish gray, stiff, moist,medium plasticity, trace fine to medium angular sand
LEAN CLAY WITH SAND (CL), yellowish brown mottledwith light grayish green, stiff, moist, medium plasticity,some fine to medium sand, trace fine gravel
CLAYEY SAND WITH GRAVEL (SC), yellowish brown,dense, moist, fine to coarse gravel
SANDY LEAN CLAY (CL), yellowish brown to darkyellowish brown, stiff, moist, medium plasticity, fine tomedium grained sand
Some fine to medium gravel
Transitions to pale olive
18
13
17
18
16
28
39
28
16
20
14
12
19
14
14
80
18.4
14.4
23.8
20.2
121.4
103.4
111.1
1214
5480
2104
1.25* PP
UC
UU
UU
S. Waganaar / TBBritton ExplorationMud Rotary140 lb. Auto Trip
Geotechnical Exploration1095 Rollins Road
Burlingame, CA14140.000.000
DATE DRILLED:HOLE DEPTH:
HOLE DIAMETER:SURF ELEV (WGS84):
6/12/2018 71.5 ft.4.0 in.Approx. 12 ft.
Dep
th in
Fee
t
5
10
15
20
25
Sam
ple
Typ
eLOGGED / REVIEWED BY:DRILLING CONTRACTOR:
DRILLING METHOD:HAMMER TYPE:
DESCRIPTION
Wat
er L
evel
Blo
w C
ount
/Foo
t
Liqu
id L
imit
Pla
stic
Lim
it
Pla
stic
ity In
dex
Fin
es C
onte
nt(%
pas
sing
#20
0 si
eve)
Moi
stur
e C
onte
nt(%
dry
wei
ght)
Dry
Uni
t Wei
ght
(pcf
)
She
ar S
tren
gth
(psf
)*f
ield
app
roxi
mat
ion
Atterberg Limits
Unc
onfin
ed S
tren
gth
(tsf
)*f
ield
app
roxi
mat
ion
Str
engt
h T
est T
ype
Log
Sym
bol
LATITUDE: 37.588509 LONGITUDE: -122.359657E
leva
tion
in F
eet
10
5
0
-5
-10
LOG OF BORING 1-B2LO
G -
GE
OT
EC
HN
ICA
L_S
U+
QU
W/ E
LEV
109
5 R
OLL
INS
RD
.GP
J E
NG
EO
INC
.GD
T 7
/20
/18

SANDY LEAN CLAY (CL), yellowish brown to darkyellowish brown, stiff, moist, medium plasticity, fine tomedium grained sand
CLAYEY SAND (SC), brown to dark brown, wet, fine tocoarse sand, pockets of clayier material
SANDY CLAY (CL), pale olive, soft to medium stiff, moist,medium plasticity, 15-20% fine to coarse sand
LEAN CLAY (CL), brown, very stiff to hard, slightly moistto moist, medium plasticity, veins of black
CLAYEY SAND WITH GRAVEL (SC), yellowish red todark yellowish brown, stiff to very soft, moist, mediumplasticity, fine to coarse sand, fine to medium gravel, activeweathering of gravels
Becoming more plastic, decreasing sand content
CLAY (CL), olive brown to yellowish brown, very stiff tohard, moist, medium plasticity, trace fine to coarse sandand fine gravel, veins of black and white weathering
Transitions to pale olive mottled with yellowish red
21
12
24
13
18
35
47
18
22
17
25
43
21.9
29.7
108.4 4680
4.5*
2.25*
3.0*
1.5*
UU
PP
PP
PP
PP
S. Waganaar / TBBritton ExplorationMud Rotary140 lb. Auto Trip
Geotechnical Exploration1095 Rollins Road
Burlingame, CA14140.000.000
DATE DRILLED:HOLE DEPTH:
HOLE DIAMETER:SURF ELEV (WGS84):
6/12/2018 71.5 ft.4.0 in.Approx. 12 ft.
Dep
th in
Fee
t
30
35
40
45
50
Sam
ple
Typ
eLOGGED / REVIEWED BY:DRILLING CONTRACTOR:
DRILLING METHOD:HAMMER TYPE:
DESCRIPTION
Wat
er L
evel
Blo
w C
ount
/Foo
t
Liqu
id L
imit
Pla
stic
Lim
it
Pla
stic
ity In
dex
Fin
es C
onte
nt(%
pas
sing
#20
0 si
eve)
Moi
stur
e C
onte
nt(%
dry
wei
ght)
Dry
Uni
t Wei
ght
(pcf
)
She
ar S
tren
gth
(psf
)*f
ield
app
roxi
mat
ion
Atterberg Limits
Unc
onfin
ed S
tren
gth
(tsf
)*f
ield
app
roxi
mat
ion
Str
engt
h T
est T
ype
Log
Sym
bol
LATITUDE: 37.588509 LONGITUDE: -122.359657E
leva
tion
in F
eet
-15
-20
-25
-30
-35
LOG OF BORING 1-B2LO
G -
GE
OT
EC
HN
ICA
L_S
U+
QU
W/ E
LEV
109
5 R
OLL
INS
RD
.GP
J E
NG
EO
INC
.GD
T 7
/20
/18

SANDY SILT (ML), olive brown, medium dense, saturated,low plasticity, rapid dilatancy, fine sand, trace coarse sand
Sands and gravels in cuttings
CLAYEY SAND WITH GRAVEL (SC), olive brown, dense,wet, fine to coarse sand, fine to coarse gravel
FAT CLAY (CH), grayish green, very stiff, moist, highplasticity, trace organics, wood fragments, trace fine tomedium sand
Trace coarse sand
Increasing fine- to coarse-grained sand content
End boring at 71.5 feet below ground surface.Groundwater was not measured due to drilling methodused.
14
34
17
38
46
2.75*
1.5*
3.0*
PP
PP
PP
S. Waganaar / TBBritton ExplorationMud Rotary140 lb. Auto Trip
Geotechnical Exploration1095 Rollins Road
Burlingame, CA14140.000.000
DATE DRILLED:HOLE DEPTH:
HOLE DIAMETER:SURF ELEV (WGS84):
6/12/2018 71.5 ft.4.0 in.Approx. 12 ft.
Dep
th in
Fee
t
55
60
65
70
Sam
ple
Typ
eLOGGED / REVIEWED BY:DRILLING CONTRACTOR:
DRILLING METHOD:HAMMER TYPE:
DESCRIPTION
Wat
er L
evel
Blo
w C
ount
/Foo
t
Liqu
id L
imit
Pla
stic
Lim
it
Pla
stic
ity In
dex
Fin
es C
onte
nt(%
pas
sing
#20
0 si
eve)
Moi
stur
e C
onte
nt(%
dry
wei
ght)
Dry
Uni
t Wei
ght
(pcf
)
She
ar S
tren
gth
(psf
)*f
ield
app
roxi
mat
ion
Atterberg Limits
Unc
onfin
ed S
tren
gth
(tsf
)*f
ield
app
roxi
mat
ion
Str
engt
h T
est T
ype
Log
Sym
bol
LATITUDE: 37.588509 LONGITUDE: -122.359657E
leva
tion
in F
eet
-40
-45
-50
-55
LOG OF BORING 1-B2LO
G -
GE
OT
EC
HN
ICA
L_S
U+
QU
W/ E
LEV
109
5 R
OLL
INS
RD
.GP
J E
NG
EO
INC
.GD
T 7
/20
/18

ASPHALT 3 inches thickCLAYEY SAND WITH GRAVEL (SC), yellowish brown,slightly moist, fine to medium gravel. [FILL]
CLAYEY SAND (SC), yellowish brown, slightly moist,10-20% fines content. [FILL]
LEAN CLAY WITH SAND AND GRAVEL (CL), dark brownto dark yellowish brown, medium stiff, moist, mediumplasticity, fine to coarse sand, fine grained gravel. [FILL]
SANDY CLAY WITH GRAVEL (CL), yellowish brown, soft,very moist, medium plasticity, 20-30% fine to coarse sand,10-20% fine to coarse gravel, max size 2". [FILL]
CLAYEY SAND WITH GRAVEL (SC), yellowish brown,loose, very moist, sand grains are angular to subangular,some fine gravel.
LEAN CLAY WITH SAND (CL), dark reddish brownmottled with yellowish brown, very stiff, moist, mediumplasticity, medium coarse subrounded sand.
21
6
9
19
28
27 18 9 24
0.75*
3.5*
PP
PP
S. Waganaar / TBBritton ExplorationMud Rotary140 lb. Auto Trip
Geotechnical Exploration1095 Rollins Road
Burlingame, CA14140.000.000
DATE DRILLED:HOLE DEPTH:
HOLE DIAMETER:SURF ELEV (WGS84):
6/12/2018 61.5 ft.4.0 in.Approx. 13 ft.
Dep
th in
Fee
t
5
10
15
20
25
Sam
ple
Typ
eLOGGED / REVIEWED BY:DRILLING CONTRACTOR:
DRILLING METHOD:HAMMER TYPE:
DESCRIPTION
Wat
er L
evel
Blo
w C
ount
/Foo
t
Liqu
id L
imit
Pla
stic
Lim
it
Pla
stic
ity In
dex
Fin
es C
onte
nt(%
pas
sing
#20
0 si
eve)
Moi
stur
e C
onte
nt(%
dry
wei
ght)
Dry
Uni
t Wei
ght
(pcf
)
She
ar S
tren
gth
(psf
)*f
ield
app
roxi
mat
ion
Atterberg Limits
Unc
onfin
ed S
tren
gth
(tsf
)*f
ield
app
roxi
mat
ion
Str
engt
h T
est T
ype
Log
Sym
bol
LATITUDE: 37.588131 LONGITUDE: -122.359511E
leva
tion
in F
eet
10
5
0
-5
-10
LOG OF BORING 1-B3LO
G -
GE
OT
EC
HN
ICA
L_S
U+
QU
W/ E
LEV
109
5 R
OLL
INS
RD
.GP
J E
NG
EO
INC
.GD
T 7
/20
/18

CLAYEY SAND WITH GRAVEL (SC), yellowish brown,medium dense, moist, clay is medium plasticity, finegravel.
LEAN CLAY WITH SAND (CL), pale olive to pale yellow,very stiff, moist, medium plasticity, fine to coarse sand,trace fine grave, active weathering of gravels.
SANDY CLAY (CL), yellowish brown, stiff to very stiff,moist, low to medium plasticity, 15-25% fine sand.
CLAYEY SAND WITH GRAVEL (SC), dark yellowishbrown, very stiff, wet, medium plasticity, fine to coarsesand, 15-20% fines, 5% fine gravelSANDY LEAN CLAY (CL), dark yellowish brown, very stiff,moist, medium plasticity, 25-30% fine sand
CLAYEY GRAVEL WITH SAND (GC), yellowish brown,dense, wet, medium plasticity, fine to coarse gravel, maxsize 2", fine to coarse sand
46
9
27
18
26
47
19.7 111.5 2120
2.0*
3.0*
1.5*
2.5*
PP
PP
PP
UU
PP
S. Waganaar / TBBritton ExplorationMud Rotary140 lb. Auto Trip
Geotechnical Exploration1095 Rollins Road
Burlingame, CA14140.000.000
DATE DRILLED:HOLE DEPTH:
HOLE DIAMETER:SURF ELEV (WGS84):
6/12/2018 61.5 ft.4.0 in.Approx. 13 ft.
Dep
th in
Fee
t
30
35
40
45
50
Sam
ple
Typ
eLOGGED / REVIEWED BY:DRILLING CONTRACTOR:
DRILLING METHOD:HAMMER TYPE:
DESCRIPTION
Wat
er L
evel
Blo
w C
ount
/Foo
t
Liqu
id L
imit
Pla
stic
Lim
it
Pla
stic
ity In
dex
Fin
es C
onte
nt(%
pas
sing
#20
0 si
eve)
Moi
stur
e C
onte
nt(%
dry
wei
ght)
Dry
Uni
t Wei
ght
(pcf
)
She
ar S
tren
gth
(psf
)*f
ield
app
roxi
mat
ion
Atterberg Limits
Unc
onfin
ed S
tren
gth
(tsf
)*f
ield
app
roxi
mat
ion
Str
engt
h T
est T
ype
Log
Sym
bol
LATITUDE: 37.588131 LONGITUDE: -122.359511E
leva
tion
in F
eet
-15
-20
-25
-30
-35
LOG OF BORING 1-B3LO
G -
GE
OT
EC
HN
ICA
L_S
U+
QU
W/ E
LEV
109
5 R
OLL
INS
RD
.GP
J E
NG
EO
INC
.GD
T 7
/20
/18

CLAYEY SAND WITH GRAVEL (SC), yellowish brown,dense, wet, medium plasticity, fine to coarse sand, finegravel
POORLY GRADED GRAVEL WITH CLAY (GP), yellowishbrown to brown, dense, wet, subrounded, 5-10% fines
CLAYEY SAND (SC), yellowish brown, dense, wet,medium plasticity, subangular, angular, fine to coarsegravel
FAT CLAY (CH), grayish green, very stiff, moist, highplasticity, fine sand, trace organics
End boring at 61.5 feet below ground surface.Groundwater was not measured due to drilling methodused.
35
45
28
3.0* PP
S. Waganaar / TBBritton ExplorationMud Rotary140 lb. Auto Trip
Geotechnical Exploration1095 Rollins Road
Burlingame, CA14140.000.000
DATE DRILLED:HOLE DEPTH:
HOLE DIAMETER:SURF ELEV (WGS84):
6/12/2018 61.5 ft.4.0 in.Approx. 13 ft.
Dep
th in
Fee
t
55
60
Sam
ple
Typ
eLOGGED / REVIEWED BY:DRILLING CONTRACTOR:
DRILLING METHOD:HAMMER TYPE:
DESCRIPTION
Wat
er L
evel
Blo
w C
ount
/Foo
t
Liqu
id L
imit
Pla
stic
Lim
it
Pla
stic
ity In
dex
Fin
es C
onte
nt(%
pas
sing
#20
0 si
eve)
Moi
stur
e C
onte
nt(%
dry
wei
ght)
Dry
Uni
t Wei
ght
(pcf
)
She
ar S
tren
gth
(psf
)*f
ield
app
roxi
mat
ion
Atterberg Limits
Unc
onfin
ed S
tren
gth
(tsf
)*f
ield
app
roxi
mat
ion
Str
engt
h T
est T
ype
Log
Sym
bol
LATITUDE: 37.588131 LONGITUDE: -122.359511E
leva
tion
in F
eet
-40
-45
LOG OF BORING 1-B3LO
G -
GE
OT
EC
HN
ICA
L_S
U+
QU
W/ E
LEV
109
5 R
OLL
INS
RD
.GP
J E
NG
EO
INC
.GD
T 7
/20
/18

APPENDIX B LABORATORY TEST DATA
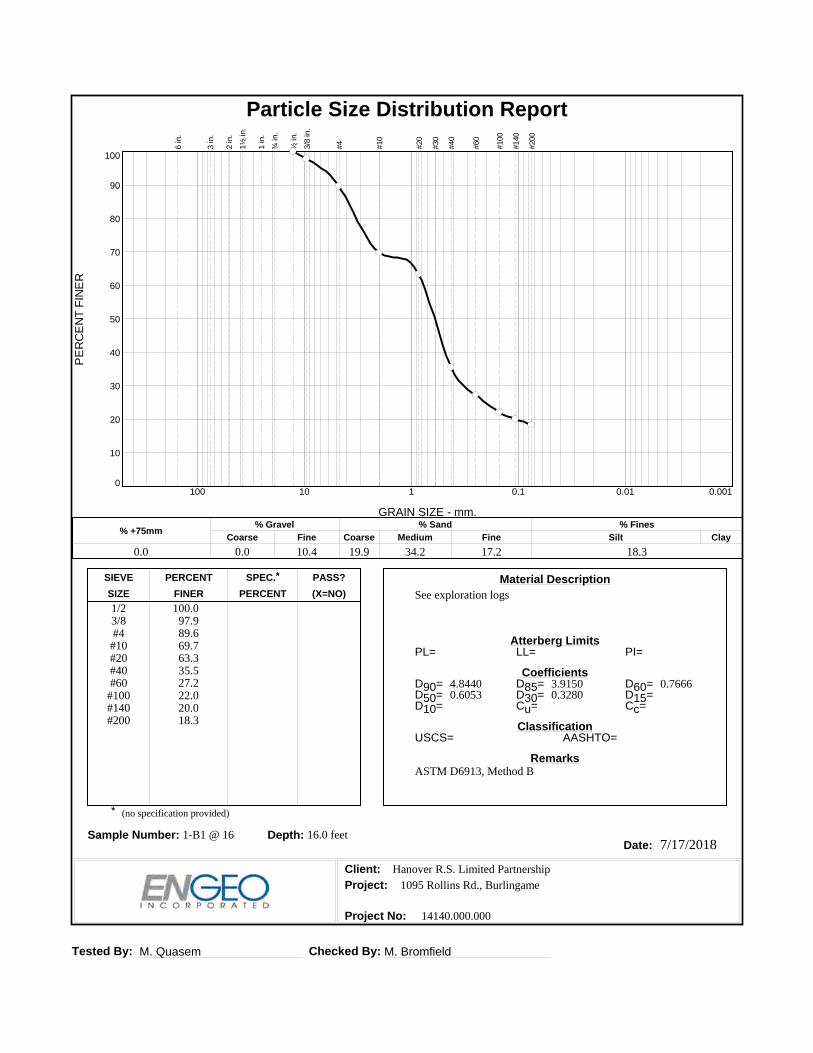
Tested By: M. Quasem Checked By: M. Bromfield
7/17/2018
(no specification provided)
PL= LL= PI=
D90= D85= D60=D50= D30= D15=D10= Cu= Cc=
USCS= AASHTO=
*
See exploration logs1/23/8#4#10#20#40#60
#100#140#200
100.097.989.669.763.335.527.222.020.018.3
4.8440 3.9150 0.76660.6053 0.3280
ASTM D6913, Method B
Hanover R.S. Limited Partnership
1095 Rollins Rd., Burlingame
14140.000.000
Material Description
Atterberg Limits
Coefficients
Classification
Remarks
Sample Number: 1-B1 @ 16 Depth: 16.0 feetDate:
Client:
Project:
Project No:
SIEVE PERCENT SPEC.* PASS?
SIZE FINER PERCENT (X=NO)
PE
RC
EN
T FI
NE
R
0
10
20
30
40
50
60
70
80
90
100
GRAIN SIZE - mm.
0.0010.010.1110100
% +75mmCoarse
% Gravel
Fine Coarse Medium
% Sand
Fine Silt
% Fines
Clay
0.0 0.0 10.4 19.9 34.2 17.2 18.3
6 in
.
3 in
.
2 in
.1½
in.
1 in
.¾
in.
½ in
.3/
8 in
.
#4 #10
#20
#30
#40
#60
#100
#140
#200
Particle Size Distribution Report

Tested By: M. Quasem Checked By: M. Bromfield
7/17/2018
(no specification provided)
PL= LL= PI=
D90= D85= D60=D50= D30= D15=D10= Cu= Cc=
USCS= AASHTO=
*
See exploration logs#200 78.5
ASTM D1140, Method BDry Sampel Weight = 88.59; Soak Time = 4 hrs
Hanover R.S. Limited Partnership
1095 Rollins Rd., Burlingame
14140.000.000
Material Description
Atterberg Limits
Coefficients
Classification
Remarks
Sample Number: 1-B1 @ 31 Depth: 31 feetDate:
Client:
Project:
Project No:
SIEVE PERCENT SPEC.* PASS?
SIZE FINER PERCENT (X=NO)
PE
RC
EN
T FI
NE
R
0
10
20
30
40
50
60
70
80
90
100
GRAIN SIZE - mm.
0.0010.010.1110100
% +75mmCoarse
% Gravel
Fine Coarse Medium
% Sand
Fine Silt
% Fines
Clay
78.5
6 in
.
3 in
.
2 in
.1½
in.
1 in
.¾
in.
½ in
.3/
8 in
.
#4 #10
#20
#30
#40
#60
#100
#140
#200
Particle Size Distribution Report

Tested By: M. Quasem Checked By: M. Bromfield
7/17/2018
(no specification provided)
PL= LL= PI=
D90= D85= D60=D50= D30= D15=D10= Cu= Cc=
USCS= AASHTO=
*
See exploration logs1
3/41/23/8#4#10#20#40#60
#100#140#200
100.094.793.491.287.472.361.454.346.939.636.033.4
7.6381 3.9508 0.73750.3091
ASTM D6913, Method B
Hanover R.S. Limited Partnership
1095 Rollins Rd., Burlingame
14140.000.000
Material Description
Atterberg Limits
Coefficients
Classification
Remarks
Sample Number: 1-B1 @ 36 Depth: 36.0 feetDate:
Client:
Project:
Project No:
SIEVE PERCENT SPEC.* PASS?
SIZE FINER PERCENT (X=NO)
PE
RC
EN
T FI
NE
R
0
10
20
30
40
50
60
70
80
90
100
GRAIN SIZE - mm.
0.0010.010.1110100
% +75mmCoarse
% Gravel
Fine Coarse Medium
% Sand
Fine Silt
% Fines
Clay
0.0 5.3 7.3 15.1 18.0 20.9 33.4
6 in
.
3 in
.
2 in
.1½
in.
1 in
.¾
in.
½ in
.3/
8 in
.
#4 #10
#20
#30
#40
#60
#100
#140
#200
Particle Size Distribution Report

Tested By: M. Quasem Checked By: M. Bromfield
7/17/2018
(no specification provided)
PL= LL= PI=
D90= D85= D60=D50= D30= D15=D10= Cu= Cc=
USCS= AASHTO=
*
See exploration logs1/23/8#4#10#20#40#60
#100#140#200
100.096.091.875.354.541.122.419.819.714.0
4.0500 3.0289 1.10760.6370 0.3168 0.0787
ASTM D6913, Method B
Hanover R.S. Limited Partnership
1095 Rollins Rd., Burlingame
14140.000.000
Material Description
Atterberg Limits
Coefficients
Classification
Remarks
Sample Number: 1-B2 @ 11 Depth: 11.0 feetDate:
Client:
Project:
Project No:
SIEVE PERCENT SPEC.* PASS?
SIZE FINER PERCENT (X=NO)
PE
RC
EN
T FI
NE
R
0
10
20
30
40
50
60
70
80
90
100
GRAIN SIZE - mm.
0.0010.010.1110100
% +75mmCoarse
% Gravel
Fine Coarse Medium
% Sand
Fine Silt
% Fines
Clay
0.0 0.0 8.2 16.5 34.2 27.1 14.0
6 in
.
3 in
.
2 in
.1½
in.
1 in
.¾
in.
½ in
.3/
8 in
.
#4 #10
#20
#30
#40
#60
#100
#140
#200
Particle Size Distribution Report

Tested By: M. Quasem Checked By: M. Bromfield
7/17/2018
(no specification provided)
PL= LL= PI=
D90= D85= D60=D50= D30= D15=D10= Cu= Cc=
USCS= AASHTO=
*
See exploration logs#200 80.1
20 39 19
GS: ASTM D1140, Method BDry Sample Weight = 121.78; Soak Time = 4 hrsPI: ASTM D4318, Wet method
Hanover R.S. Limited Partnership
1095 Rollins Rd., Burlingame
14140.000.000
Material Description
Atterberg Limits
Coefficients
Classification
Remarks
Sample Number: 1-B2 @ 16 Depth: 16.0 feetDate:
Client:
Project:
Project No:
SIEVE PERCENT SPEC.* PASS?
SIZE FINER PERCENT (X=NO)
PE
RC
EN
T FI
NE
R
0
10
20
30
40
50
60
70
80
90
100
GRAIN SIZE - mm.
0.0010.010.1110100
% +75mmCoarse
% Gravel
Fine Coarse Medium
% Sand
Fine Silt
% Fines
Clay
80.1
6 in
.
3 in
.
2 in
.1½
in.
1 in
.¾
in.
½ in
.3/
8 in
.
#4 #10
#20
#30
#40
#60
#100
#140
#200
Particle Size Distribution Report

Tested By: M. Quasem Checked By: M. Bromfield
7/17/2018
(no specification provided)
PL= LL= PI=
D90= D85= D60=D50= D30= D15=D10= Cu= Cc=
USCS= AASHTO=
*
See exploration logs#200 42.8
ASTM D1140, Method BDry Sample Weight = 796.3; Soak Time = 4 hrs
Hanover R.S. Limited Partnership
1095 Rollins Rd., Burlingame
14140.000.000
Material Description
Atterberg Limits
Coefficients
Classification
Remarks
Sample Number: 1-B2 @ 36 Depth: 36.0 feetDate:
Client:
Project:
Project No:
SIEVE PERCENT SPEC.* PASS?
SIZE FINER PERCENT (X=NO)
PE
RC
EN
T FI
NE
R
0
10
20
30
40
50
60
70
80
90
100
GRAIN SIZE - mm.
0.0010.010.1110100
% +75mmCoarse
% Gravel
Fine Coarse Medium
% Sand
Fine Silt
% Fines
Clay
42.8
6 in
.
3 in
.
2 in
.1½
in.
1 in
.¾
in.
½ in
.3/
8 in
.
#4 #10
#20
#30
#40
#60
#100
#140
#200
Particle Size Distribution Report

Tested By: M. Bromfield Checked By: M. Quasem
7/17/2018
(no specification provided)
PL= LL= PI=
D90= D85= D60=D50= D30= D15=D10= Cu= Cc=
USCS= AASHTO=
*
See exploration logs#200 24.4
18 27 9
GS: ASTM D1140, Method BDry Sample Weight = 120.11; Soak Time = 4 hrsPI: ASTM D4318, Wet method
Hanover R.S. Limited Partnership
1095 Rollins Rd., Burlingame
14140.000.000
Material Description
Atterberg Limits
Coefficients
Classification
Remarks
Sample Number: 1-B3 @ 10 Depth: 10.0 feetDate:
Client:
Project:
Project No:
SIEVE PERCENT SPEC.* PASS?
SIZE FINER PERCENT (X=NO)
PE
RC
EN
T FI
NE
R
0
10
20
30
40
50
60
70
80
90
100
GRAIN SIZE - mm.
0.0010.010.1110100
% +75mmCoarse
% Gravel
Fine Coarse Medium
% Sand
Fine Silt
% Fines
Clay
24.4
6 in
.
3 in
.
2 in
.1½
in.
1 in
.¾
in.
½ in
.3/
8 in
.
#4 #10
#20
#30
#40
#60
#100
#140
#200
Particle Size Distribution Report

BORING/SAMPLE ID 1-B2 1-B2
DEPTH (ft) 5.0 46.0Method A or B B B%MOISTURE 18.4 29.7
BORING/SAMPLE ID
DEPTH (ft)Method A or B%MOISTURE
BORING/SAMPLE ID
DEPTH (ft)Method A or B%MOISTURE
BORING/SAMPLE ID
DEPTH (ft)Method A or B%MOISTURE
BORING/SAMPLE ID
DEPTH (ft)Method A or B%MOISTURE
PROJECT NAME: 1095 Rollins Rd, Burlingame DATE: 07/10/18
PROJECT NUMBER: 14140.000.000
CLIENT: Hanover R.S. Limited Partnership
PHASE NUMBER: 002
Tested by: M. Bromfield Reviewed by: M. Quasem
MOISTURE CONTENT DETERMINATIONASTM D2216
Lab Address: 3420 Fostoria Way, Suite E San Ramon, CA 94583. Phone No. (925) 355-9047.

Tested By: M. Bromfield Checked By: M. Quasem
LIQUID AND PLASTIC LIMITS TEST REPORT
PLA
STI
CIT
Y IN
DE
X
0
10
20
30
40
50
60
LIQUID LIMIT0 10 20 30 40 50 60 70 80 90 100 110
CL-ML
CL or O
L
CH or O
H
ML or OL MH or OH
Dashed line indicates the approximateupper limit boundary for natural soils
4
7
MATERIAL DESCRIPTION LL PL PI %<#40 %<#200 USCS
Project No. Client: Remarks:
Project:
Depth: 6.0 feet Sample Number: 1-B1 @ 6
Depth: 11.0 feet Sample Number: 1-B1 @ 11
Depth: 5.0 feet Sample Number: 1-B2 @ 5
Depth: 16.0 feet Sample Number: 1-B2 @ 16
Depth: 21.0 feet Sample Number: 1-B2 @ 21
See exploration logs 64 24 40
See exploration logs 87 32 55
See exploration logs 28 16 12
See exploration logs 39 20 19 80.1
See exploration logs 28 14 14
14140.000.000 Hanover R.S. Limited Partnership
ASTM D4318, Wet methodASTM D4318, Wet methodASTM D4318, Wet methodPI: ASTM D4318, Wet methodGS: ASTM D1140, Method BASTM D4318, Wet method
1095 Rollins Rd., Burlingame

Tested By: M. Bromfield M. Quasem M. Bromfield Checked By: M. Quasem
LIQUID AND PLASTIC LIMITS TEST REPORT
PLA
STI
CIT
Y IN
DE
X
0
10
20
30
40
50
60
LIQUID LIMIT0 10 20 30 40 50 60 70 80 90 100 110
CL-ML
CL or O
L
CH or O
H
ML or OL MH or OH
Dashed line indicates the approximateupper limit boundary for natural soils
4
7
MATERIAL DESCRIPTION LL PL PI %<#40 %<#200 USCS
Project No. Client: Remarks:
Project:
Depth: 26.0 feet Sample Number: 1-B2 @ 26
Depth: 46.0 feet Sample Number: 1-B2 @ 46
Depth: 10.0 feet Sample Number: 1-B3 @ 10
See exploration logs 35 18 17
See exploration logs 47 22 25
See exploration logs 27 18 9 24.4
14140.000.000 Hanover R.S. Limited Partnership
ASTM D4318, Wet methodASTM D4318, Wet methodPI: ASTM D4318, Wet methodGS: ASTM D1140, Method B
1095 Rollins Rd., Burlingame

SPECIMENBEFORE TEST
PROJECT NAME:
PROJECT NO:
CLIENT:
LOCATION:
PHASE NO:
See exploration logsSee exploration logs
- --
2.650
Test Remarks
Liquid Limit
DESCRIPTIONSPECIMEN
6.05
-
2.8535.692.36
0.05
2.415
1215
6.462.26
M. BromfieldTested By:
733366
Saturation (%)Void Ratio
Diameter (in)
Unconfined Compressive Strength (psf)
Height (in)Height-To-Diameter Ratio
6070.05
Undrained Shear Strength (psf)Strain Rate (in./min.)
TEST DATA
Specific GravityStrain at Failure (%)
1-B1 @ 11
Test Date:
Reviewed By:
Burlingame, CA
14140.000.000
2.650
3420 Fostoria Way, Suite E, San Ramon, CA 94583 | T (925) 355-9047 | F (888) 279-2698 | www.engeo.com
1-B2 @ 11
Plastic Limit
2.35
002
07/12/18
M. Quasem
1095 Rollins Rd, Burlingame
Hanover R.S. Limited Partnership
UNCONFINED COMPRESSION TEST REPORT (ASTM D2166)
Moisture Content (%)Dry Density (pcf)
14.51-B1 @ 11 1-B2 @ 11
55.3
121.4100.00.36
67.2100.01.46
0
200
400
600
800
1000
1200
1400
0 2 4 6 8 10 12
Cor
rect
ed C
ompr
essi
ve S
tres
s (p
sf)
Axial Strain (%)
Compressive Stress vs. Axial Strain Curve(s)
1-B1 @ 11 1-B2 @ 11

1-B2@31 1-B2@16 1-B2@21 [email protected] 23.76 20.19 21.8796.41 103.21 111.06 108.44
100.00 100.00 100.00 100.000.72 0.60 0.49 0.532.410 2.429 2.410 2.4235.031 5.078 5.040 5.070
- - - -- - - -
2.650 2.650 2.650 2.6502.088 2.091 2.091 2.092
1-B2@31 1-B2@16 1-B2@21 [email protected] 23.76 20.19 21.87
100.00 100.00 100.00 100.000.05 0.05 0.05 0.05
3518.9 5474.7 2105.3 4692.115.008 14.670 14.981 14.495
1396.8 907.2 1094.4 1296.0n/a n/a n/a n/a
4915.7 6381.9 3199.7 5988.11396.8 907.2 1094.4 1296.0
1759.5 2737.4 1052.6 2346.0n/a n/a n/a n/a
Project InformationProject Name:Project Number:Location:Client:
Cohesion at Failure with a Zero Friction Angle (Ø=0)
Sample Number:
Before TestWater Content (%)Dry Density (pcf)Saturation (%)
σ1 (psf)
Water Content (%)
Cell (psf)
Plastic LimitSpecific Gravity
Saturation (%)
After TestHeight-to-Diameter Ratio
Back (psf)
Peak Deviator Stress (psf)Strain Rate (in/min)
EN GEOUnconsolidated Undrained Triaxial Test (ASTM D2850)
07/1
3/18
Dat
e:C
heck
ed B
y:G
. Cri
ste
Burlingame, CAJob Number:14140.000.000
Friction Angle Ø
σ3 (psf)
Cohesion, c (psf) 0.0
Dat
e:07
/13/
18
Height (in)
Liquid Limit
Void Ratio
Specimen
M. Q
uase
m
Multiple
Diameter (in)
14140.000.000Boring Number: Multiple
1095 Rollins Rd, Burlingame
Hanover R.S. Limited Partnership
Axial Strain @ Failure (%)
Tes
ted
By:
Cell Pressure
Principle Stresses at Failure
0.00
Mohr-Coulomb Parameters with a Non-zero Friction Angle (Ø≠0)
Description: See exploration logs
0
750
1500
2250
3000
0 1000 2000 3000 4000 5000 6000 7000
Sh
ear
Str
ess
(psf
)
Normal Stress (psf)
Mohr Circles
1-B1@31 1-B2@16 1-B2@21 1-B2@26
01,
000
2,00
03,
000
4,00
05,
000
6,00
0
0.0 5.0 10.0 15.0
Str
ess
(psf
)
Strain (%)
Stress-Strain Curve
Lab Address: 3420 Fostoria Way, Suite E, San Ramon, CA 94583. Phone No. (925) 355-9047.

111.48100.00
0.482.4205.010
--
2.6502.070
100.000.05
2129.114.669
1598.4n/a
3727.51598.4
1064.6n/a
Project InformationProject Name:Project Number:Location:Client:
Cohesion at Failure with a Zero Friction Angle (Ø=0)
Sample Number:
Before TestWater Content (%)Dry Density (pcf)Saturation (%)
σ1 (psf)
Water Content (%)
Cell (psf)
Plastic LimitSpecific Gravity
Saturation (%)
After TestHeight-to-Diameter Ratio
Back (psf)
Peak Deviator Stress (psf)Strain Rate (in/min)
EN GEOUnconsolidated Undrained Triaxial Test (ASTM D2850)
07/1
6/18
Dat
e:C
heck
ed B
y:G
. Cri
ste
Burlingame, CAJob Number:14140.000.000
Friction Angle Ø
σ3 (psf)
Cohesion, c (psf) 0.0
Dat
e:07
/16/
18
Height (in)
Liquid Limit
Void Ratio
Specimen
M. Q
uase
m
1-B3@36
Diameter (in)
14140.000.000Boring Number: 1-B3
1095 Rollins Rd, Burlingame
Hanover R.S. Limited Partnership
Axial Strain @ Failure (%)
Tes
ted
By:
Cell Pressure
Principle Stresses at Failure
0.00
Mohr-Coulomb Parameters with a Non-zero Friction Angle (Ø≠0)
Description: See exploration logs
0
200
400
600
800
1000
1200
1000 1600 2200 2800 3400 4000
Sh
ear
Str
ess
(psf
)
Normal Stress (psf)
Mohr Circles
1-B3@36
050
01,
000
1,50
02,
000
0.0 5.0 10.0 15.0
Str
ess
(psf
)
Strain (%)
Stress-Strain Curve
Lab Address: 3420 Fostoria Way, Suite E, San Ramon, CA 94583. Phone No. (925) 355-9047.

APPENDIX C CPT DATA
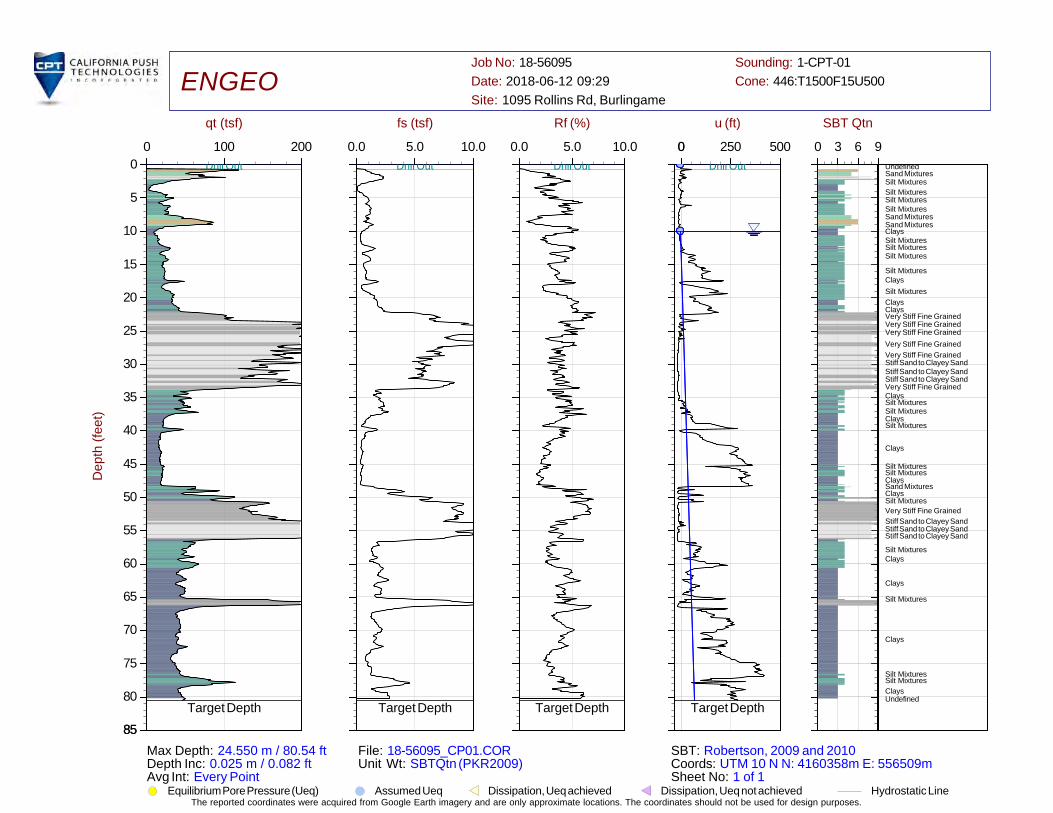
The reported coordinates were acquired from Google Earth imagery and are only approximate locations. The coordinates should not be used for design purposes.
0 100 2000
5
10
15
20
25
30
35
40
45
50
55
60
65
70
75
80
8585
qt (tsf)
Dep
th (f
eet)
0.0 5.0 10.0
fs (tsf)
0.0 5.0 10.0
Rf (%)
0 250 5000
u (ft)
0 3 6 9
SBT Qtn
ENGEOJob No: 18-56095Date: 2018-06-12 09:29Site: 1095 Rollins Rd, Burlingame
Sounding: 1-CPT-01Cone: 446:T1500F15U500
Max Depth: 24.550 m / 80.54 ftDepth Inc: 0.025 m / 0.082 ftAvg Int: Every Point
File: 18-56095_CP01.CORUnit Wt: SBTQtn (PKR2009)
SBT: Robertson, 2009 and 2010Coords: UTM 10 N N: 4160358m E: 556509m Sheet No: 1 of 1
UndefinedSand MixturesSilt MixturesSilt MixturesSilt MixturesSilt MixturesSand MixturesSand MixturesClaysSilt MixturesSilt MixturesSilt Mixtures
Silt MixturesClaysSilt MixturesClaysClaysVery Stiff Fine GrainedVery Stiff Fine GrainedVery Stiff Fine GrainedVery Stiff Fine GrainedVery Stiff Fine GrainedStiff Sand to Clayey SandStiff Sand to Clayey SandStiff Sand to Clayey SandVery Stiff Fine GrainedClaysSilt MixturesSilt MixturesClaysSilt Mixtures
Clays
Silt MixturesSilt MixturesClaysSand MixturesClaysSilt MixturesVery Stiff Fine GrainedStiff Sand to Clayey SandStiff Sand to Clayey SandStiff Sand to Clayey Sand
Silt MixturesClays
Clays
Silt Mixtures
Clays
Silt MixturesSilt MixturesClaysUndefined
Target Depth Target Depth Target Depth Target Depth
Equilibrium Pore Pressure (Ueq) Assumed Ueq Hydrostatic LineDissipation, Ueq not achievedDissipation, Ueq achieved
Drill Out Drill Out Drill Out Drill Out

The reported coordinates were acquired from Google Earth imagery and are only approximate locations. The coordinates should not be used for design purposes.
0 100 2000
5
10
15
20
25
30
35
40
45
50
55
60
65
70
75
80
8585
qt (tsf)
Dep
th (f
eet)
0.0 5.0 10.0
fs (tsf)
0.0 5.0 10.0
Rf (%)
0 250 5000
u (ft)
0 3 6 9
SBT Qtn
ENGEOJob No: 18-56095Date: 2018-06-12 07:54Site: 1095 Rollins Rd, Burlingame
Sounding: 1-CPT-02Cone: 446:T1500F15U500
Max Depth: 24.550 m / 80.54 ftDepth Inc: 0.025 m / 0.082 ftAvg Int: Every Point
File: 18-56095_CP02.CORUnit Wt: SBTQtn (PKR2009)
SBT: Robertson, 2009 and 2010Coords: UTM 10 N N: 4160351m E: 556534m Sheet No: 1 of 1
UndefinedSandsSand MixturesSilt MixturesSilt Mixtures
Silt MixturesSand MixturesSand Mixtures
Very Stiff Fine GrainedClaysClays
Silt Mixtures
ClaysClaysClaysSilt MixturesSilt MixturesSilt MixturesSilt MixturesClays
Clays
Silt MixturesClaysClaysSilt MixturesClaysVery Stiff Fine Grained
Silt MixturesSilt MixturesClaysClaysClaysClays
ClaysSilt MixturesVery Stiff Fine GrainedVery Stiff Fine GrainedStiff Sand to Clayey SandStiff Sand to Clayey SandSilt MixturesClaysSilt Mixtures
Clays
Silt Mixtures
ClaysSilt MixturesSilt MixturesClays
UndefinedTarget Depth Target Depth Target Depth Target Depth
Equilibrium Pore Pressure (Ueq) Assumed Ueq Hydrostatic LineDissipation, Ueq not achievedDissipation, Ueq achieved
Drill Out Drill Out Drill Out Drill Out

The reported coordinates were acquired from Google Earth imagery and are only approximate locations. The coordinates should not be used for design purposes.
0 100 2000
5
10
15
20
25
30
35
40
45
50
55
60
65
70
75
80
8585
qt (tsf)
Dep
th (f
eet)
0.0 5.0 10.0
fs (tsf)
0.0 5.0 10.0
Rf (%)
0 250 5000
u (ft)
0 3 6 9
SBT Qtn
ENGEOJob No: 18-56095Date: 2018-06-12 10:54Site: 1095 Rollins Rd, Burlingame
Sounding: 1-CPT-03Cone: 446:T1500F15U500
Max Depth: 24.550 m / 80.54 ftDepth Inc: 0.025 m / 0.082 ftAvg Int: Every Point
File: 18-56095_CP03.CORUnit Wt: SBTQtn (PKR2009)
SBT: Robertson, 2009 and 2010Coords: UTM 10 N N: 4160323m E: 556526m Sheet No: 1 of 1
UndefinedStiff Sand to Clayey SandSand MixturesSand MixturesClaysVery Stiff Fine GrainedSand MixturesSilt MixturesSand MixturesSilt MixturesVery Stiff Fine GrainedSilt MixturesClaysClaysClaysSilt MixturesClaysSilt MixturesClaysStiff Sand to Clayey SandVery Stiff Fine GrainedStiff Sand to Clayey SandStiff Sand to Clayey SandVery Stiff Fine GrainedStiff Sand to Clayey Sand
Silt MixturesClaysClaysClaysClaysSilt MixturesClaysSilt MixturesSilt MixturesSilt MixturesClaysSilt MixturesSilt MixturesSilt MixturesClaysStiff Sand to Clayey SandStiff Sand to Clayey SandStiff Sand to Clayey SandSand MixturesSilt Mixtures
Clays
Silt Mixtures
Clays
Silt MixturesClaysSilt Mixtures
Clays
UndefinedTarget Depth Target Depth Target Depth Target Depth
Equilibrium Pore Pressure (Ueq) Assumed Ueq Hydrostatic LineDissipation, Ueq not achievedDissipation, Ueq achieved
Drill Out Drill Out Drill Out Drill Out

APPENDIX D LIQUEFACTION ANALYSIS

L I Q U E F A C T I O N A N A L Y S I S R E P O R T
Input parameters and analysis dataRobertson (2009)Robertson (2009)Based on Ic value8.100.82
G.W.T. (in-situ):G.W.T. (earthq.):Average results interval:Ic cut-off value:Unit weight calculation:
Project title : 1095 Rollins Road, 14140.000.000 Location : Burlingame, California
ENGEO
CPT file : 1-CPT1
10.00 ft5.00 ft32.60Based on SBT
Yes20.00 ft2.00 tsfYesNo
Clay like behaviorapplied:Limit depth applied:Limit depth:MSF method:
All soilsYes50.00 ftMethod based
Summary of liquefaction potential
CLiq v.2.2.1.4 - CPT Liquefaction Assessment Software - Report created on: 7/25/2018, 12:35:56 PMProject file: G:\Active Projects\_14000 to 15999\14140\14140000000\GEX\Analysis\Liquefaction\Liq analysis.clq
1

This software is licensed to: ENGEO Incorporated CPT name: 1-CPT1
C P T b a s i c i n t e r p r e t a t i o n p l o t s ( n o r m a l i z
CLiq v.2.2.1.4 - CPT Liquefaction Assessment Software - Report created on: 7/25/2018, 12:35:56 PM 2Project file: G:\Active Projects\_14000 to 15999\14140\14140000000\GEX\Analysis\Liquefaction\Liq analysis.clq
SBTn legend1. Sensitive fine grained2. Organic material3. Clay to silty clay
4. Clayey silt to siltyclay5. Silty sand to sandy silt6. Clean sand to silty sand
7. Gravely sand to sand8. Very stiff sand toclayey sand9. Very stiff fine grained
Input parameters and analysis dataRobertson (2009)Robertson (2009)Based on Ic value8.100.8210.00 ft
Depth to water table (erthq.):Average results interval:Ic cut-off value:Unit weight calculation:Excavation:Excavation depth:
5.00 ft32.60Based on SBTYes20.00 ft
2.00 tsfYesNoAll soilsYes50.00 ft

This software is licensed to: ENGEO Incorporated CPT name: 1-CPT1
L i q u e f a c t i o n a n a l y s i s o v e r a l l p l o t
CLiq v.2.2.1.4 - CPT Liquefaction Assessment Software - Report created on: 7/25/2018, 12:35:56 PM 3Project file: G:\Active Projects\_14000 to 15999\14140\14140000000\GEX\Analysis\Liquefaction\Liq analysis.clq
F.S. color scheme LPI color schemeInput parameters and analysis dataRobertson (2009)Robertson (2009)Based on Ic value8.100.8210.00 ft
Depth to water table (erthq.):Average results interval:Ic cut-off value:Unit weight calculation:Excavation:Excavation depth:
5.00 ft32.60Based on SBTYes20.00 ft
2.00 tsfYesNoAll soilsYes50.00 ft
Almost certain it will liquefyVery likely to liquefyLiquefaction and no liq. are equally likelyUnlike to liquefyAlmost certain it will not liquefy
Very high riskHigh riskLow risk

L I Q U E F A C T I O N A N A L Y S I S R E P O R T
Input parameters and analysis dataRobertson (2009)Robertson (2009)Based on Ic value8.100.82
G.W.T. (in-situ):G.W.T. (earthq.):Average results interval:Ic cut-off value:Unit weight calculation:
Project title : 1095 Rollins Road, 14140.000.000 Location : Burlingame, California
ENGEO
CPT file : 1-CPT2
10.00 ft5.00 ft32.60Based on SBT
Yes20.00 ft2.00 tsfYesNo
Clay like behaviorapplied:Limit depth applied:Limit depth:MSF method:
All soilsYes50.00 ftMethod based
Summary of liquefaction potential
CLiq v.2.2.1.4 - CPT Liquefaction Assessment Software - Report created on: 7/25/2018, 12:35:57 PMProject file: G:\Active Projects\_14000 to 15999\14140\14140000000\GEX\Analysis\Liquefaction\Liq analysis.clq
4

This software is licensed to: ENGEO Incorporated CPT name: 1-CPT2
C P T b a s i c i n t e r p r e t a t i o n p l o t s ( n o r m a l i z
CLiq v.2.2.1.4 - CPT Liquefaction Assessment Software - Report created on: 7/25/2018, 12:35:57 PM 5Project file: G:\Active Projects\_14000 to 15999\14140\14140000000\GEX\Analysis\Liquefaction\Liq analysis.clq
SBTn legend1. Sensitive fine grained2. Organic material3. Clay to silty clay
4. Clayey silt to siltyclay5. Silty sand to sandy silt6. Clean sand to silty sand
7. Gravely sand to sand8. Very stiff sand toclayey sand9. Very stiff fine grained
Input parameters and analysis dataRobertson (2009)Robertson (2009)Based on Ic value8.100.8210.00 ft
Depth to water table (erthq.):Average results interval:Ic cut-off value:Unit weight calculation:Excavation:Excavation depth:
5.00 ft32.60Based on SBTYes20.00 ft
2.00 tsfYesNoAll soilsYes50.00 ft

This software is licensed to: ENGEO Incorporated CPT name: 1-CPT2
L i q u e f a c t i o n a n a l y s i s o v e r a l l p l o t
CLiq v.2.2.1.4 - CPT Liquefaction Assessment Software - Report created on: 7/25/2018, 12:35:57 PM 6Project file: G:\Active Projects\_14000 to 15999\14140\14140000000\GEX\Analysis\Liquefaction\Liq analysis.clq
F.S. color scheme LPI color schemeInput parameters and analysis dataRobertson (2009)Robertson (2009)Based on Ic value8.100.8210.00 ft
Depth to water table (erthq.):Average results interval:Ic cut-off value:Unit weight calculation:Excavation:Excavation depth:
5.00 ft32.60Based on SBTYes20.00 ft
2.00 tsfYesNoAll soilsYes50.00 ft
Almost certain it will liquefyVery likely to liquefyLiquefaction and no liq. are equally likelyUnlike to liquefyAlmost certain it will not liquefy
Very high riskHigh riskLow risk

L I Q U E F A C T I O N A N A L Y S I S R E P O R T
Input parameters and analysis dataRobertson (2009)Robertson (2009)Based on Ic value8.100.82
G.W.T. (in-situ):G.W.T. (earthq.):Average results interval:Ic cut-off value:Unit weight calculation:
Project title : 1095 Rollins Road, 14140.000.000 Location : Burlingame, California
ENGEO
CPT file : 1-CPT3
10.00 ft5.00 ft32.60Based on SBT
Yes20.00 ft2.00 tsfYesNo
Clay like behaviorapplied:Limit depth applied:Limit depth:MSF method:
All soilsYes50.00 ftMethod based
Summary of liquefaction potential
CLiq v.2.2.1.4 - CPT Liquefaction Assessment Software - Report created on: 7/25/2018, 12:35:58 PMProject file: G:\Active Projects\_14000 to 15999\14140\14140000000\GEX\Analysis\Liquefaction\Liq analysis.clq
7

This software is licensed to: ENGEO Incorporated CPT name: 1-CPT3
C P T b a s i c i n t e r p r e t a t i o n p l o t s ( n o r m a l i z
CLiq v.2.2.1.4 - CPT Liquefaction Assessment Software - Report created on: 7/25/2018, 12:35:58 PM 8Project file: G:\Active Projects\_14000 to 15999\14140\14140000000\GEX\Analysis\Liquefaction\Liq analysis.clq
SBTn legend1. Sensitive fine grained2. Organic material3. Clay to silty clay
4. Clayey silt to siltyclay5. Silty sand to sandy silt6. Clean sand to silty sand
7. Gravely sand to sand8. Very stiff sand toclayey sand9. Very stiff fine grained
Input parameters and analysis dataRobertson (2009)Robertson (2009)Based on Ic value8.100.8210.00 ft
Depth to water table (erthq.):Average results interval:Ic cut-off value:Unit weight calculation:Excavation:Excavation depth:
5.00 ft32.60Based on SBTYes20.00 ft
2.00 tsfYesNoAll soilsYes50.00 ft

This software is licensed to: ENGEO Incorporated CPT name: 1-CPT3
L i q u e f a c t i o n a n a l y s i s o v e r a l l p l o t
CLiq v.2.2.1.4 - CPT Liquefaction Assessment Software - Report created on: 7/25/2018, 12:35:58 PM 9Project file: G:\Active Projects\_14000 to 15999\14140\14140000000\GEX\Analysis\Liquefaction\Liq analysis.clq
F.S. color scheme LPI color schemeInput parameters and analysis dataRobertson (2009)Robertson (2009)Based on Ic value8.100.8210.00 ft
Depth to water table (erthq.):Average results interval:Ic cut-off value:Unit weight calculation:Excavation:Excavation depth:
5.00 ft32.60Based on SBTYes20.00 ft
2.00 tsfYesNoAll soilsYes50.00 ft
Almost certain it will liquefyVery likely to liquefyLiquefaction and no liq. are equally likelyUnlike to liquefyAlmost certain it will not liquefy
Very high riskHigh riskLow risk


Initial Study 1095 Rollins Road Apartments
This page intentionally left blank