appendix g - the fundÃo tailings dam...
TRANSCRIPT

Fundão Tailings Dam Review Panel Report on the Immediate Causes of the Failure of the Fundão Dam
August 25, 2016
APPENDIX G Seepage Modeling

Fundão Tailings Dam Review Panel Report on the Immediate Causes of the Failure of the Fundão Dam
August 25, 2016 Page G-i
Appendix G Seepage Modeling
TABLE OF CONTENTS
G1 INTRODUCTION .............................................................................................................................. 1 G2 PHASE 0 MODEL – DESIGN CONCEPT ............................................................................................ 1
G2.1 Ph0 Model Preamble ...................................................................................................... 1 G2.2 Fundão Dam TSF Concept ............................................................................................... 1
G2.2.1 Concept Reconstruction Source Data ........................................................... 1 G2.2.2 Concept Design Limitations Acknowledgment ............................................. 2 G2.2.3 Final Concept Description ............................................................................. 2 G2.2.4 Design Basis Summary .................................................................................. 5
G2.3 Ph0 Model Construction ................................................................................................. 7 G2.3.1 Model Code ................................................................................................... 7 G2.3.2 Model Construction ...................................................................................... 7 G2.3.3 Drain Modeling and Model Evolution .......................................................... 9 G2.3.4 Base Case (Ph0-1) ....................................................................................... 10 G2.3.5 Drain Permeability Variance (Ph0-2 Series) ................................................ 10 G2.3.6 Recharge Stress (Ph0-3 Series) ................................................................... 15 G2.3.7 Tailings Permeability and Anisotropy (Ph0-4 Series) .................................. 15 G2.3.8 Vertical Permeability Effects (Ph0-5 Series) ............................................... 17 G2.3.9 Drain Flow Conditions ................................................................................. 17
G3 PHASE 1 MODEL – AS-BUILT CONDITIONS .................................................................................. 21 G3.1.1 Ph1 Model Preamble .................................................................................. 21 G3.1.2 Ph0 Model Considerations.......................................................................... 21
G3.2 TSF As-Built Conditions ................................................................................................. 21 G3.3 Ph1 Model Construction ............................................................................................... 24
G3.3.1 Ph1 Model Limits ........................................................................................ 24 G3.3.2 Ph1 Geological Basis ................................................................................... 25 G3.3.3 Ph1 Domain, Nodes and Layers .................................................................. 26 G3.3.4 Drains and Other Boundary Conditions ...................................................... 28 G3.3.5 Model Timing and Stress Periods ............................................................... 31 G3.3.6 TSF Raise/Construction Process ................................................................. 32 G3.3.7 Consolidation Water ................................................................................... 37
G3.4 Ph1 Model Calibration .................................................................................................. 37 G3.4.1 Material Parameters ................................................................................... 38 G3.4.2 Steady State Calibration ............................................................................. 38

Fundão Tailings Dam Review Panel
Report on the Immediate Causes of the Failure of the Fundão DamAppendix G - Seepage Modeling
TABLE OF CONTENTS (continued)
August 25, 2016 Page G-ii
G3.4.3 Transient Calibration .................................................................................. 43 G3.5 Transient Model Results ............................................................................................... 53
G3.5.1 Left Abutment Discussion ........................................................................... 55 G3.5.2 Right Abutment Discussion ......................................................................... 58 G3.5.3 Flow Paths and Particle Seeds .................................................................... 60
G3.6 Ph2 Model – Scenario Run: No Slimes “Tongues”, Left Abutment .............................. 62 G4 SUMMARY OF FINDINGS ............................................................................................................. 63
List of Tables
Table G2-1 Ph0 model material parameters .................................................................................... 6 Table G2-2 Numerical comparison between phreatic and confined modeling modes ................... 9 Table G3-1 Ph1 model material parameters .................................................................................. 38 Table G3-2 Steady state calibration reference list ......................................................................... 39 Table G3-3 Summary of steady state model calibration ............................................................... 40 Table G3-4 Summary of transient model calibration parameters ................................................. 44 Table G3-5 Summary of transient model calibration ..................................................................... 47
List of Figures
Figure G2-1 Concept design Dike 1 and Dike 2 general arrangement and crest elevations ............. 4 Figure G2-2 Concept design Fundão Dam drainage elements .......................................................... 4 Figure G2-3 Concept design Fundão Dam final elevation 920 m ...................................................... 5 Figure G2-4 Fundão Dam TSF conceptual section ............................................................................. 5 Figure G2-5 Ph0 model domain, node discretization, main drain elements plan view .................... 8 Figure G2-6 Ph0 model section Dike 2 through Dike 1 showing material permeability contrasts ... 8 Figure G2-7 Ph0 model drain flux predictions for variance simulations of drain performance ..... 11 Figure G2-8 Ph0 series, model Sections 1, 2 and 3 location plan ................................................... 13 Figure G2-9 Ph0-1, Ph0-2a/2b/2c/2d results: reducing drain performance scenarios ................... 14 Figure G2-10 Ph0-1, Ph0-3a/3b results: recharge variation scenarios ............................................. 16 Figure G2-11 Ph0-1, Ph0-5a/5b/5c results: reducing permeability scenarios .................................. 18 Figure G2-12 Particle seeds (upper) and flow vectors in the Principal Foundation Drain (lower) ... 20 Figure G3-1 General arrangement of the Fundão Dam in November, 2015 .................................. 23 Figure G3-2 Ph1 model extent (yellow) with regional geology and Ph0 extent (red) .................... 25 Figure G3-3 Ph1 model mesh/node distribution (green) and key breaklines (red) ........................ 27 Figure G3-4 Model cross section showing general layer distribution ............................................. 28 Figure G3-5 Composite hydrograph showing piezometric trends during period of El. 826 m
blanket drain operation, up to El. 850 m ..................................................................... 29

Fundão Tailings Dam Review Panel
Report on the Immediate Causes of the Failure of the Fundão DamAppendix G - Seepage Modeling
TABLE OF CONTENTS (continued)
August 25, 2016 Page G-iii
Figure G3-6 Fundão Dam TSF life cycle with model stress periods ................................................ 32 Figure G3-7 Sectional distribution of slimes and sand within the TSF ............................................ 34 Figure G3-8 Zones of slimes stratigraphy ........................................................................................ 35 Figure G3-9 Example of pond definition in Fundão, representing open water bodies and slimes 36 Figure G3-10 Calibrated steady state model, measured vs. modeled heads ................................... 41 Figure G3-11 Event map showing recorded seepage and failure related incidents ......................... 42 Figure G3-12 Calibrated transient model hydrographs, measured versus modeled, line AA .......... 45 Figure G3-13 Calibrated transient model hydrographs, measured versus modeled, line BB ........... 45 Figure G3-14 Calibrated transient model hydrographs, measured versus modeled, line 01 ........... 46 Figure G3-15 Calibrated transient model hydrographs, measured versus modeled, line 02 ........... 46 Figure G3-16 Calibrated transient model hydrographs, measured versus modeled, line 03 ........... 47 Figure G3-17 Calibrated transient model, measured versus modeled heads .................................. 48 Figure G3-18 Calibrated transient model drain flows, measured vs. modeled ................................ 49 Figure G3-19 Transient model phreatic conditions, November, 2015.............................................. 51 Figure G3-20 Transient model unsaturated isopach map, November, 2015 .................................... 52 Figure G3-21 Section location reference map ................................................................................... 54 Figure G3-22 Left abutment water table and head contours Sections 01, 02 and 03, t=1800 days 56 Figure G3-23 Facility head conditions for model layer El. 850 m ..................................................... 57 Figure G3-24 Facility head conditions, Longitudinal Section, looking upstream .............................. 58 Figure G3-25 Right abutment water table and head contours sections AA, BB and DD, t=1800 days
..................................................................................................................................... 59 Figure G3-26 Flow paths from particle seeds on the El. 860 m blanket drain, forward tracking (l)
and back tracking (r) .................................................................................................... 60 Figure G3-27 Particle tacking, 90-day travel (day 1710 to 1800), seed placement upper tailings
sand .............................................................................................................................. 61 Figure G3-28 Longitudinal Section with water table from calibrated model (upper), Scenario 1
(lower), t=1800 Days .................................................................................................... 62

Fundão Tailings Dam Review Panel
Report on the Immediate Causes of the Failure of the Fundão DamAppendix G - Seepage Modeling
August 25, 2016 Page G-1
G1 INTRODUCTION
This appendix presents the results of the three-dimensional seepage modeling of the Fundão Dam. This work was completed in order to provide phreatic and pressure condition data to inform parallel engineering assessments of the facility. This work is presented across two main sections.
Section G2 presents the construction of the Phase 0 (Ph0) series of models which are 3D FEFLOW, steady state simulations of the design concept for the TSF. This modeling was completed to assess the various design components of the original system as they relate to internal water management, and to stress these conditions and develop an understanding of their broader response and influence ahead of Phase 1 (Ph1) as-built modeling.
Section G3 presents the construction of the Ph1 model, which is a real time transient reconstruction of the as-built conditions of the Tailings Storage Facility (TSF) from El. 830 m to the time of failure in November, 2015. This reconstruction leans heavily on the results of the Ph0 modeling, and was developed in close liaison with the GIS based reconstruction of the facility (Appendix B), and the various engineering studies associated with characterizing base data and assessing performance conditions of the facility.
This work includes a scenario variation, being a transient simulation of the post El. 830 m facility reconstructed with the absence of slimes “tongues” on the left abutment. This Phase 2 (Ph2) model was completed to assess variability in phreatic conditions on the left abutment had the slimes extent not encroached toward and beneath the dam.
G2 PHASE 0 MODEL – DESIGN CONCEPT
G2.1 Ph0 Model Preamble
The Ph0 model provides a reconstruction of the design concept for the Fundão Dam, based on documentation and project records preceding the final design/construction of the Starter Dam (generally, pre-2007). The model was constructed to assess the hydraulic performance of the structure with particular reference to the phreatic surface, drain flux, areas of emergent seepage and seasonal rainfall effects.
This model does not assess as constructed conditions or the performance of mitigation features designed and constructed into the facility as it matured. This is addressed in the Ph1 model in Section G3.
G2.2 Fundão Dam TSF Concept
G2.2.1 Concept Reconstruction Source Data
Reconstruction of the design concept was undertaken using several key sources of information, of most relevance:
A series of 43 drawing files dated August 8, 2006 to September 29, 2006 (see Appendix A Attachment A1).

Fundão Tailings Dam Review Panel
Report on the Immediate Causes of the Failure of the Fundão DamAppendix G - Seepage Modeling
August 25, 2016 Page G-2
A number of explanatory Power Point presentations created by the design engineer, the most relevant of which is dated September 30, 2006[59].
Technical report by Pimenta de Ávila (2006a)[60]: provides an overarching descriptive summary of the operational / design intent understood to be for the purpose of project tendering. The date of this report matches the 43 drawing files (Appendix A Attachment A1), and the general description was sufficient to gather an understanding of the fundamental operational intent of the facility.
Technical report by Pimenta de Ávila (2006b)[61]: an update of Pimenta (2006a).
Technical report by Pimenta de Ávila (2007)[62]: provides justification for design modifications including the removal of Dike 3 which post-dates the two earlier design reports.
Other reports, data, plans and spreadsheets were reviewed and have generally been referenced and summarized in accompanying technical appendices to the main report.
G2.2.2 Concept Design Limitations Acknowledgment
As the concept design evolved over a period of time, no singular definitive description exists. In order to construct a suitable concept model, a project description was developed using each of the bodies of evidence available. This Ph0 model needed to honor the fundamental design premises applied at the time, and also needed to include each of the primary elements of construction required for its successful development. In doing so, and because of the changing nature of design, it is acknowledged that some elements of the TSF concept may not have carried through to this final model or may be reported elsewhere in a slightly different arrangement. For the purposes of this work, however, the model constructed and presented in Section G2.2.3 is considered the most appropriate representation of the design concept at the time.
G2.2.3 Final Concept Description
The final concept design applied in the Ph0 model comprises:
A Starter Dam (Dike 1) and an upstream Dike 2 located between Dike 1 and the Germano Dam.
Dike 2 was designed to retain slimes, while Dike 1 was designed to retain sand tailings.
The TSF was to be raised from Dike 1 using the upstream construction method and tailings sand to form each respective raise. Sand tailings were then to be spigotted from the crest of the raised Dike 1, with a beach design slope of 1V:100H and a minimum beach width of 200 m.
The placement of sand tailings behind Dike 1 was to be at a rate that maintained a +5 m elevation gain on the placement of slimes behind Dike 2.
Drains were included in accord with the design with the general principal was drainage to be sufficient to achieve a free draining TSF. The drain elements included:
an upstream blanket on the face of Dike 1;

Fundão Tailings Dam Review Panel
Report on the Immediate Causes of the Failure of the Fundão DamAppendix G - Seepage Modeling
August 25, 2016 Page G-3
left and right abutment drains connecting with the Dike 1 upstream blanket;
a Principal Foundation Drain along the thalweg of the original Fundão Creek, and extending upstream to Dike 2;
a vertical chimney drain in Dike 2, connected to a horizontal blanket underneath Dike 2 on the downstream side, which then connected with the Principal Foundation Drain; and
drainage galleries connecting to the Principal Foundation Drain from minor-thalwegs.
The facility was modeled at a final design elevation of El. 920 m. The general arrangement of conceptual layouts described above are provided on Figure G 2-1, Figure G 2-2, Figure G 2-3 and Figure G 2-4.
Of note, the minimum 200 m beach width is shown on Figure G 2-3 as calculated from the crest of the final Dike 1. The extent of tailings sand however continues further upstream. This was selected as the concept design option because it more accurately reflects the upstream construction of tailings over slimes behind Dike 2; it does not conflict with the minimum 200 m beach width design requirement, and it increases the distance to the constant head of the slimes interface. Two other options for modeling the slimes/sand interface were considered possible at the concept level but were not carried forward, namely:
Option 1 is vertical abutment between the two materials (slimes and sand directly over Dike 2) through centerline construction; however, this conflicts with the 200 m minimum beach width requirement in the area of the Dike 1 right abutment.
Option 2 is vertical abutment between the two materials at the “Dike 1 crest minus 200 m interface”; however, this then presented difficulty in representing either of centerline or upstream construction methods over Dike 2.

Fundão Tailings Dam Review Panel
Report on the Immediate Causes of the Failure of the Fundão DamAppendix G - Seepage Modeling
August 25, 2016 Page G-4
Figure G 2-1 Concept design Dike 1 and Dike 2 general arrangement and crest elevations
Figure G 2-2 Concept design Fundão Dam drainage elements

Fundão Tailings Dam Review Panel
Report on the Immediate Causes of the Failure of the Fundão DamAppendix G - Seepage Modeling
August 25, 2016 Page G-5
Figure G 2-3 Concept design Fundão Dam final elevation 920 m
Figure G 2-4 Fundão Dam TSF conceptual section
G2.2.4 Design Basis Summary
G2.2.4.1 Facility Design
Material Sources and Bulk Geometry:
Mill separated waste stream comprising a segregated slimes and sand tailings.
Starter Dam (Dike 1) constructed of compacted saprolite.

Fundão Tailings Dam Review Panel
Report on the Immediate Causes of the Failure of the Fundão DamAppendix G - Seepage Modeling
August 25, 2016 Page G-6
Slimes retention Dike 2 constructed of compacted saprolite.
Dike 1 raises comprised of compacted sand tailings.
Construction Approach:
Both Dike 1 and Dike 2 are constructed using the upstream construction method with tailings sand used for Dike 1 above the Starter Dam.
Sand tailings are spigotted from the inside crest of Dike 1 with a minimum 200 m beach length.
Sand tailings deposition to stay +5 m above deposition of slimes.
For each drain geometry defined in the concept model, an equivalent bulk drain permeability aligned with the FEFLOW model geometry was developed to represent an equivalent drain performance to that of the concept design. The specific detail in the concept design drains is not possible to replicate in the FEFLOW domain at the scale modeled.
Table G 2-1 Ph0 model material parameters
Material / Property Base Value Source Material Properties (Hydraulic Conductivity (K) cm/s, storage unitless)
Slimes Kxy 1.2 x10⁻⁶
Material parameters are derived from MDGEO[63] and MDGEO[7], both of which refer to parameters used in 2009
as part of the design planning.
Slimes Sy 0.2 Slimes Kh/Kv 1 Sand tailings (spigot) Kxy 5.0 x10⁻⁴
Sand tailings (spigot) Sy 0.2 Sand tailings (spigot) Kh/Kv 2 Sand tailings (berm) Kxy 1.0 x10⁻⁴
Sand tailings (berm) Sy 0.2 Sand tailings (berm) Kh/Kv 2 Foundation Kxy 1.2 x10⁻⁷
Foundation Sy 0.2 Foundation Kh/Kv 1
Drainage Elements (Hydraulic Conductivity (K) cm/s)Dike 1 U/S Blanket Kxyz 3.1 x10+1
Drain material parameters are derived equivalents from 2006 concept level drawing files (Appendix A Attachment
A1).
Dike 2 Chimney Kxyz 5.0 x10+0 Dike 1 Thalweg Drain Kxyz 5.6 x10+1
Dike 1 L&R Abut Drain Kxyz 3.1 x10+1 Finger Drains Kxyz 5.6 x10+1 Dike 2 Horiz. blanket Kxyz 5.0 x10+0
Recharge (m/day) Rainfall Recharge Tailings 9.4 x10⁻⁴ Average wet season conditions assuming 90% of rainfall
falls during 6-month period, highest recharge on spigotted sand, slimes controlled by pond constant head.
Rainfall Recharge Comp. Tail. 4.7 x10⁻⁴
Rainfall Recharge Baserock 4.7 x10⁻⁵ Pipe Recharge (Spigot) 90 L/s Distributed to sand beach as increased recharge.

Fundão Tailings Dam Review Panel
Report on the Immediate Causes of the Failure of the Fundão DamAppendix G - Seepage Modeling
August 25, 2016 Page G-7
G2.3 Ph0 Model Construction
G2.3.1 Model Code
The selection of the modeling platform required that the model code have:
the ability to translate the conceptual understanding into the numerical environment;
the ability to simulate three-dimensional flow in a complex hydrogeological setting of steeply contrasting material parameters;
the ability to simulate discrete permeable and non-permeable features, and anisotropy effects;
the ability to bring increased focus and detail to areas of greatest interest;
the ability to generate depth variant pressure data under transient analysis;
the ability to conduct particle tracking analysis;
recognition as industry standard software for the type of modeling being conducted; and
flexibility to allow revision as and when new data becomes available.
The three-dimensional, finite-element model platform FEFLOW was selected to meet the objectives and requirements of this investigation and those of the Ph1 modeling. Model runs were constructed under saturated, steady state and transient conditions, for each of the Ph0, Ph1 and Ph2 models.
G2.3.2 Model Construction
The Ph0 model was constructed using the concept model developed in Civil 3D and described in earlier sections. Natural ground was represented by 5 m interval contours, and the topography of the dams and the slope of the raises were built in accord with design principles.
G2.3.2.1 Domain, Nodes and Layers
Model cells were more finely refined in the dam and slope areas to 5 m dimension, with nodes aligned along iso-elevation contours of the dam’s respective raises. Inside the model domain, cells higher than El. 920 m and above the Starter Dam downstream face were set as inactive.
The Ph0 model has ~393,000 elements across 19 layers. There is a 1 m thick layer below natural ground to represent excavations and drains, with 8 layers of 5 m thickness between natural ground and top of Dike 1 at El .830 m. Between El. 830 m and El. 920 m, the top two layers are assigned a 5 m thickness, and the remaining 8 layers are 10 m thick. For the “pinched-out” layers within the model, minimum thickness was established at 0.1 m.
This level of layering detail was required for two purposes – to permit fair representation of the concept landform geometry of Dike 1, and to permit testing of TSF hydraulic performance through consideration of consolidation effects.

Fundão Tailings Dam Review Panel
Report on the Immediate Causes of the Failure of the Fundão DamAppendix G - Seepage Modeling
August 25, 2016 Page G-8
Figure G 2-5 Ph0 model domain, node discretization, main drain elements plan view
Figure G 2-6 Ph0 model section Dike 2 through Dike 1 showing material permeability contrasts

Fundão Tailings Dam Review Panel
Report on the Immediate Causes of the Failure of the Fundão DamAppendix G - Seepage Modeling
August 25, 2016 Page G-9
G2.3.3 Drain Modeling and Model Evolution
As the primary design intent was efficient drainage of the sand, appropriate representation of drains was largely responsible for the direction in which modeling evolved.
G2.3.3.1 Drainage Elements
The Dike 1 upstream blanket, Dike 2 foundation blanket and chimney drain, and Principal Foundation Drain were modeled as high conductivity zones based on their respective dimension and equivalent bulk material properties. The respective drain conductivity was scaled over the modeled area to maintain the same conductance between the model and the concept design. For example, the Dike 2 chimney drain is 1 m wide by design, but the smallest discretization in the model in this area is 5 m. Model input conductivity is consequently one-fifth of the value in the concept design.
G2.3.3.2 Model Mode
Because of the highly conductive design underdrain(s) and the several orders of magnitude in difference between the design element permeability and material properties of the slimes and sand, phreatic and unsaturated modes proved numerically unstable.
A confined modeling approach was adopted with long-term transient simulations applied to simulate quasi steady state conditions. A check was included in the simulation to review each model cell’s hydraulic condition; when a cell is dry it is “frozen” to prevent water flowing in the dry cells. However, the vertical permeability is maintained to allow recharge inflow as well as dry cell rewetting.
Consideration of the suitability of the application of confined versus unconfined modeling modes is provided in Table G 2-2.
Table G 2-2 Numerical comparison between phreatic and confined modeling modes
Attribute Confined mode Phreatic mode
Conductance Each model cell is fully conductive
The cells below the water table or with 100% saturation are fully conductive. The cell above the water table or with 0% saturation are not conductive, or apply “residual thickness” to maintain minimal conductance. The cells intersected by the water table or with saturation greater than “residual thickness” and less than 100%, apply the true water thickness to numerically derive conductance.
Storage
Each cell uses specific storage (ss) to account for storage
water during hydraulic head changes
The cells below water table, or with 100% saturation, use specific storage (ss). The cells above the water table, or with 0% saturation, have no storage account; FEFLOW applies a negligible number to maintain numerical stability. The cells intersected by the water table, or with saturation greater than “residual thickness” and less than 100%, apply specific storage (Sy).
Numerical formulation
Linear simultaneous equations with respect to
hydraulic head Non-linear simultaneous equations with respect to hydraulic head
Fundão Tailings Dam Review Panel
Report on the Immediate Causes of the Failure of the Fundão DamAppendix G - Seepage Modeling
August 25, 2016 Page G-10
For a long-term transient simulation, as the model converges and approaches a quasi-steady state condition, storage becomes negligible. Under such conditions the difference between confined and phreatic modes is the conductance above the water table or layer saturation less than 100%. Also, under unconfined or phreatic conditions, where a discrete element is used to represent the “drain”, if it becomes exposed above the water table it turns off immediately, which has a sudden consequence on the performance of the whole drain and can block the remainder of the drain from flow transferal.
G2.3.3.3 Ph0 Model Calibration
Model calibration was not required or undertaken for the Ph0 model. This model is a reconstruction of the design intent only.
G2.3.3.4 Scenarios and Results
A model base case was run to evaluate the performance of the TSF in accordance with the concept model defined in Section G2.2. To account for inconsistencies or uncertainties in the conceptual understanding, a suite of additional runs was deployed to build a database of responses of the system to various stress and material parameter variances. This approach tests the basic design concept and presents “stress” scenarios which are plausible in their likelihood of occurrence, and which may affect the manner in which the TSF, particularly the drains, perform.
This process is also critical in informing the development of the Ph1 model (Section G3).
G2.3.4 Base Case (Ph0-1)
G2.3.4.1 Model Descriptions
The base case scenario is as described in Section G2.2. This model run is referred to as Ph0-1.
G2.3.4.2 Scenario Results
The base case model simulated a freely drained sand stockpile, with drain discharge from the Principal Foundation Drain at the base of Fundão Dam of the order of 28 L/s. No flow was predicted to reach either of the Dike 1 abutment drains, and no areas of Dike 1 exhibited emergent seepage.
Of the 28 L/s reporting to the Principal Foundation Drain, about 12 L/s is from incident recharge, 14.5 L/s from the constant head of the ponded reservoir, and the balance is change in storage.
In terms of phreatic conditions, the stockpile was efficiently drained, with complete drainage occurring over the alignment of the main drain. Away from drains the stockpile maintained partial saturation under modeled conditions.
G2.3.5 Drain Permeability Variance (Ph0-2 Series)
G2.3.5.1 Model Descriptions
Four drain permeability variance scenarios were run, with bulk drain performance modified by a reducing order of magnitude in each case. Drain conductance is determined for the base case as a

Fundão Tailings Dam Review Panel
Report on the Immediate Causes of the Failure of the Fundão DamAppendix G - Seepage Modeling
August 25, 2016 Page G-11
single material parameter unique to each drain, which accounts for the respective materials in their design and their distribution, across each drain profile. These model runs therefore do not apply a set value for all drains, but rather a diminishing performance scenario from their design intent for each.
Drain permeability was reduced for each run by a factor of 10, 100, 1000 and 10,000 from the Ph0-1 conditions. All other base case parameters remained unchanged. These model runs are referred to as Ph0-2a/2b/2c/2d.
G2.3.5.2 Scenario Results
The results of the various drain performance simulations are largely predictable and consistent with expected conceptual response. Reducing drain performance raises the phreatic surface, reduces flow in the Principal Foundation Drain, and triggers flow in the higher abutment drains as the overall system increases in saturation. Emergent seepage from Dike 1 is also triggered, and eventually dominates as the exit mechanism of water once drain permeability merges closer to that of the overlying material, or becomes stressed due to geometric limitations. Figure G 2-7 provides a summary of drain flux reporting to either the Principal Foundation Drain, the left or right abutment drains, or as emergent seepage on the downstream face of Dike 1.
Figure G 2-7 Ph0 model drain flux predictions for variance simulations of drain performance
Observations to note from these results:
Total flux out diminishes as drain performance diminishes – this is a function of increased saturation of the sand profile, and increased water withheld in storage.
For scenarios 2a and 2b, results are effectively the same, and show little variation from the base case. All water for 2a and 2b is conveyed via the Principal Foundation Drain, with no emergent seepage reaching the abutment drains or the dike face. Under these conditions the structure continues to meet the concept design intent, maintaining a largely drained sand mass with drain conductance capable of discharging predicted system inflows.

Fundão Tailings Dam Review Panel
Report on the Immediate Causes of the Failure of the Fundão DamAppendix G - Seepage Modeling
August 25, 2016 Page G-12
For scenario 2c, however, a change occurs – flux out via the Principal Foundation Drain reduces by about 80%, flow commences in both abutment drains (albeit low), and discharge emerges on the Dike 1 downstream face, representing about 50% of total flux out. Conceptually, the effectiveness of the Principal Foundation Drain is now compromised and the system increases in saturation, which triggers discharge from other (higher) exit options.
Scenarios 2d and 2e are more extreme versions of 2c, with drain conductance in 2e roughly equivalent to sand tailings permeability. This similarity in permeability explains the loss in performance of the abutment drains in these later scenarios.
Sectional representation of these scenarios is provided in a series of cross sections which shows three “stock” sections of results compared with the base case Ph0-1 results. The upper section (Section 11) follows the main thalweg and hence represents the orientation of the Principal Foundation Drain to its exit at the toe of Dike 1. By virtue of the design effect of Dike 1, this section shows the most “drained” area of the TSF, and because of this is a conservative representation of seepage face conditions on the downstream side of Dike 1. The middle section (Section 2) is through Dike 2 and Dike 1, which does not align with the Principal Foundation Drain but is provided to show predicted influence of main drain elements from both dikes, and the hydraulic relationship with the slimes which are stored behind Dike 2. The lower section (Section 3) is a longitudinal section aligned along the crest El. 920 m of the final dam, and is intended to show varying degrees of saturation near to and away from the area of the Principal Foundation Drain and the abutment drains, and thereby provide a sense of overall system saturation from scenario to scenario. These section locations are shown on Figure G 2-8.
1 These section references should not be confused with reference to Sections 01, 02 and 03 in other elements of reporting.

Fundão Tailings Dam Review Panel
Report on the Immediate Causes of the Failure of the Fundão DamAppendix G - Seepage Modeling
August 25, 2016 Page G-13
Figure G 2-8 Ph0 series, model Sections 1, 2 and 3 location plan
The following additional observations are provided from Figure G 2-9:
The base case and Drain K/10 (2a) scenarios predict high performance of the drains resulting in desaturation of the sand tailings over the drains in both cases. The chimney drain is shown to be particularly effective in Dike 2.
Although scenario 2b does not show appreciable change in flux from the base case and 2a models, this scenario does show the system starting to saturate. Of note, in Section 1 around 30 m of head is maintained over the Principal Foundation Drain, and this is reaffirmed in Section 3 showing the system building a saturated profile across the TSF. Section 1 indicates that this scenario has not yet triggered abutment drain flow or Dike 1 face seepage; however, the profile in the Starter Dam of Dike 1 has changed.
Scenarios 2c, 2d and 2e show saturation of the system building and emergence of seepage faces on the downstream of Dike 1. Predicted elevations of seepage for 2a, 2b and 2c respectively for Section 1 are approximately El. 843 m, El. 859 m and El. 864 m.

Fundão Tailings Dam Review Panel
Report on the Immediate Causes of the Failure of the Fundão DamAppendix G - Seepage Modeling
August 25, 2016 Page G-14
Figure G 2-9 Ph0-1, Ph0-2a/2b/2c/2d results: reducing drain performance scenarios

Fundão Tailings Dam Review Panel
Report on the Immediate Causes of the Failure of the Fundão DamAppendix G - Seepage Modeling
August 25, 2016 Page G-15
G2.3.6 Recharge Stress (Ph0-3 Series)
G2.3.6.1 Model Descriptions
Two scenarios were considered for increasing hydraulic stress through increase in recharge, which simulates a consequence of increased rainfall or spigotting activity. The first run represented doubling of recharge. The second run increased recharge to 40% of rainfall, which is the equivalent of ~100 L/s (on tailings sand) simulated, with the balance of water not recharging into the sand assumed to have either evaporated or flowed to the pond to be handled with excess surface water.
Recharge into the upper model layer was the only parameter varied in these runs. All other base case parameters remained unchanged. These model runs are referred to as Ph0-3a/3b.
G2.3.6.2 Scenario Results
These scenarios assess the performance of the drain system, as designed, to carry and discharge these additional seepage loads.
Increasing recharge resulted in predictable responses in the system, with increased flux-in balanced as an increased flux-out of the Principal Foundation Drain. Neither of these scenarios triggered abutment drain flow or emergent seepage on Dike 1, and neither of these scenarios appreciably changed the phreatic conditions across the TSF.
Each of these scenarios showed an increase in flux-in consistent with the revised boundary conditions imposed. Although moderate increases in phreatic conditions (Figure G 2-10) are a direct reflection of the increased flux-in, neither scenario affects the TSF performance sufficiently to compromise its drained design intent.
G2.3.7 Tailings Permeability and Anisotropy (Ph0-4 Series)
G2.3.7.1 Model Descriptions
These runs explored the effect of variability in tailings sand permeability through increase and decrease of bulk permeability by a half order of magnitude. These are effectively a sensitivity check on this material parameter aimed at determining their bulk effect on TSF saturation profiles.
Only bulk permeability of the sand tailings was modified. All other base case parameters remained unchanged. These model runs are referred to as Ph0-4a/4b.
Variation in anisotropy is more directed at testing an assumed parameter in the base case that has the potential to impact structure hydraulic performance. Only anisotropy of the sand tailings was modified. All other base case parameters remained unchanged. This model run is referred to as Ph0-4c.

Fundão Tailings Dam Review Panel
Report on the Immediate Causes of the Failure of the Fundão DamAppendix G - Seepage Modeling
August 25, 2016 Page G-16
Figure G 2-10 Ph0-1, Ph0-3a/3b results: recharge variation scenarios
SECTION 1
SECTION 2
SECTION 3
Model
Base Model
Recharge Stress x 2
Recharge Stres x 9

Fundão Tailings Dam Review Panel
Report on the Immediate Causes of the Failure of the Fundão DamAppendix G - Seepage Modeling
August 25, 2016 Page G-17
G2.3.7.2 Scenario Results
Variation of bulk material parameters and tailings sand anisotropy showed little effect on the performance of the system. In each of these runs, the Principal Foundation Drain maintained its performance in removing water from the system (ranging in flow between 20 L/s and 31 L/s), with neither abutment drain flow triggered or emergent seepage apparent on Dike 1.
G2.3.8 Vertical Permeability Effects (Ph0-5 Series)
G2.3.8.1 Model Descriptions
Two scenarios were evaluated applying variability in material parameters to simulate the effect of permeability varying with stress; the first being a single order of magnitude permeability reduction from surface to base of facility (considered conservative as up to 2.5 orders of magnitude change over a similar stress scenario, as described in Vaughan (1994)), and the second scenario representing the same change in permeability but with a more pronounced degree of anisotropy (Kh:Kv of 10:1, rather than 5:1).
All other base case parameters remained unchanged. These model runs are referred to as Ph0-5a/5b/5c.
G2.3.8.2 Scenario Results
With reducing permeability limiting the release of water, raised phreatic conditions result. A combination of the reducing permeability with more contrasting anisotropy provides additional impediment to downward seepage. In neither scenario, however, did the Principal Foundation Drain fail to achieve its design intent (Figure G 2-11).
G2.3.9 Drain Flow Conditions
As an alternate check of drain performance, an analytical assessment was completed to evaluate the capacity of the drains for the base case scenario, and to assess the nature of flows likely to occur.
G2.3.9.1 Analytically Derived Drain Capacity
Fell et al. (2005) present an analytical solution derived by Cedergren (1972) to estimate discharge capacity of a horizontal drain without pressurization. Applying this method, a discharge estimate of 259 L/s was assessed for the Principal Foundation Drain beneath the Starter Dam, which is significantly greater than the model predicted flow discussed earlier.
The drain was also assessed under saturated (pressurized) conditions applying a hydraulic gradient of 1:10 (representing 20 m head on the upstream side of the Starter Dam over 200 m of drain reach). Under this scenario, the drain has an estimated capacity of ~2,300 L/s.

Fundão Tailings Dam Review Panel
Report on the Immediate Causes of the Failure of the Fundão DamAppendix G - Seepage Modeling
August 25, 2016 Page G-18
Figure G 2-11 Ph0-1, Ph0-5a/5b/5c results: reducing permeability scenarios
SECTION 1
SECTION 2
SECTION 3
Model
Base Model
Vertical Permeability V1
Vertical Permeability V2

Fundão Tailings Dam Review Panel
Report on the Immediate Causes of the Failure of the Fundão DamAppendix G - Seepage Modeling
August 25, 2016 Page G-19
G2.3.9.2 Laminar Versus Turbulent Flow
These two analytical solutions represent a flow velocity in the Principal Foundation Drain of 0.006 m/sec (without pressurization) and 0.056 m/sec (saturated, induced gradient). Converting these flow velocities to a Reynolds number results in values of 27 and 243 respectively (unitless). As a general guide, Reynolds number values greater than 30 can be regarded as turbulent flow conditions, and between 10 and 30 they represent non-linear laminar flow.
These results indicate probable non-laminar or turbulent flows; however, it is noted that these are at the derived maximum flow capacity for each scenario. Lowering flow for the un-pressurized solution to ~50 L/s lowers the Reynolds number to 5, more indicative of lineal, laminar flow.
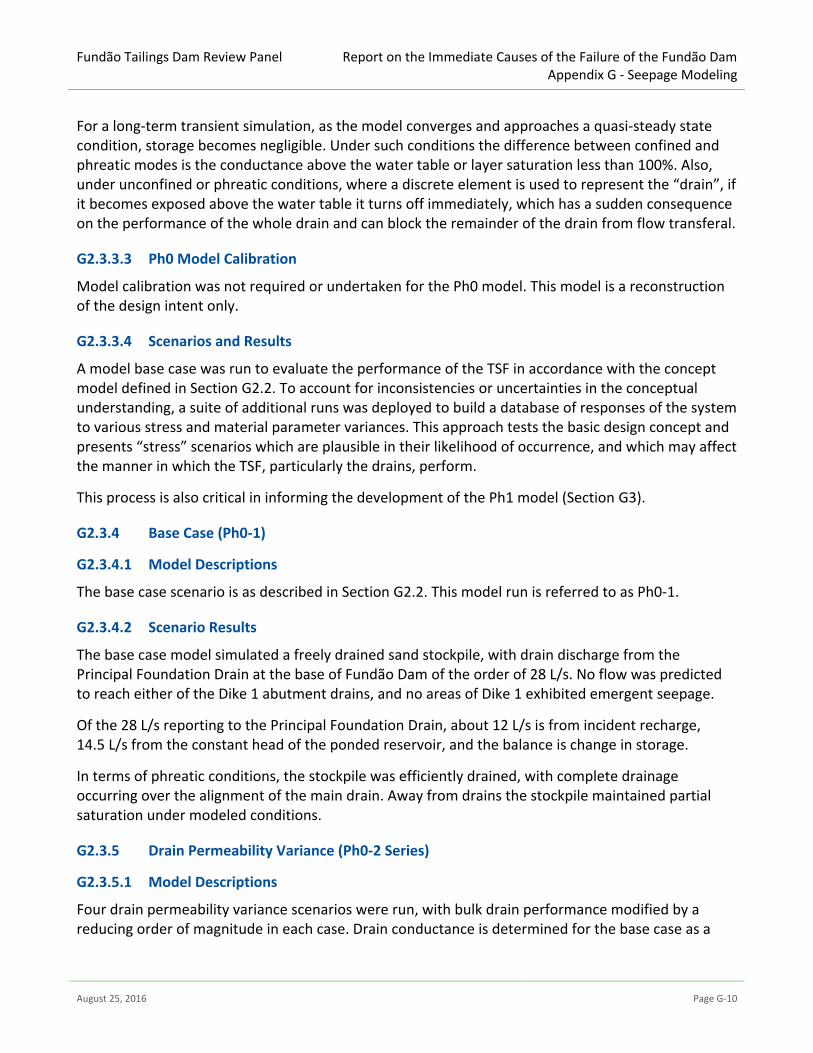
G2.3.9.3 Flow Paths and Particle Seeds
Flow conditions for the Principal Foundation Drain from the base case numerical model are shown on Figure G 2-12. Particle seed tracking clearly shows the drain influence, and in more detail the flow vectors show the accelerated groundwater movement as it enters the drain. In this model, the highest flow velocity was 0.0013 m/sec, which is about 20% of the analytical solution for the un-pressurized system.
The FEFLOW base case simulation predicted drain flows of the order of 28 L/s. Accordingly, flow vector derived groundwater velocity is expected to be lower than the analytically derived velocity for the maximum capacity drain.
A final observation from the numerical modeling results (for the base case, Ph0-1 scenario) shown on Figure G 2-12 is the acceleration of groundwater flow in close proximity to the drain. This is the area where the strong contrast in material permeability between sand tailings and drain permeability is most prominent and could result in complex local flow regimes with localized very high groundwater velocities.
Fundão Tailings Dam Review Panel
Report on the Immediate Causes of the Failure of the Fundão DamAppendix G - Seepage Modeling
August 25, 2016 Page G-20
Figure G 2-12 Particle seeds (upper) and flow vectors in the Principal Foundation Drain (lower)

Fundão Tailings Dam Review Panel
Report on the Immediate Causes of the Failure of the Fundão DamAppendix G - Seepage Modeling
August 25, 2016 Page G-21
G3 PHASE 1 MODEL – AS-BUILT CONDITIONS
G3.1.1 Ph1 Model Preamble
Numerical modeling was required to generate piezometric data in areas of the TSF where no or limited monitoring exists, and to create a transient record of the facility to augment the conceptual understanding, and to inform engineering studies being undertaken in parallel to this work.
The Phase 1 (Ph1) model provides a reconstruction of the as-built Fundão Dam, based on documentation and project records, reporting notes, photographic records, material balances and time sequenced reconstruction of the life-cycle of the facility. The model presents the hydraulic performance of the structure with particular reference to the phreatic surface, drain flux, areas of emergent seepage and zones of increased or decreased pore-water pressure.
G3.1.2 Ph0 Model Considerations
Key considerations taken from Ph0 work applied in the development of the Ph1 model are:
The model maintains very good numerical stability and reasonable run times, as well as plausible water balance and hydraulic stress responses through application of the confined solution. This avoids the complexity and numerical instability that phreatic mode presents.
The model produces comparable results to analytical solutions, and numerical modifications to the model result in predictable simulation outcomes. Boundary conditions and fundamental concepts developed in the Ph0 modeling appear sound and should be translated into the Ph1 model where appropriate.
Vertical gradients, within the TSF and in relation to foundation materials, need to be considered. This is particularly the case where extensive low permeability horizons (slimes) may be present and may provide varying (to complete) degrees of local confinement. Coupled with this is the potential for additional water that may be released at depth through consolidation processes.
Key attributes with the greatest potential to materially impact TSF performance are:
drain performance;
material anisotropy and changing permeability with depth (consolidation effects);
the extent, present and lateral continuity of low permeability horizons (slimes); and
system geometry.
G3.2 TSF As-Built Conditions
The full description of the Fundão Dam construction and operation is complex and detailed. It is not intended to reproduce this history in this appendix, although a clear depiction of the life of the facility can be reviewed through the main report text complemented with the various appendices, with Appendix B being the most relevant.

Fundão Tailings Dam Review Panel
Report on the Immediate Causes of the Failure of the Fundão DamAppendix G - Seepage Modeling
August 25, 2016 Page G-22
Key elements of dam construction of relevance to the Ph1 model do merit restatement:
The Starter Dam (Dike 1), the upstream Dike 2 located between Dike 1 and the Germano facility, and Old Dike 1A and New Dike 1A located behind Dike 1.
The Principal Foundation Drain, which was aligned along the thalweg of the valley before tailings deposition commenced, was decommissioned upstream of Dike 1. This drain, however, was not decommissioned beneath the Starter Dam, and this feature (with the remnants of the Auxiliary Drain) continued to exert influence and discharge water up until failure. The remnants of the Principal Foundation Drain were retained for the numerical simulation and are complemented with the vertical drain in the Starter Dam which also was not decommissioned.
Similarly, the Contingency Drains on the left and right abutments of the Fundão Dam became redundant elements of the drainage system once the El. 826 m blanket drain was commissioned. These were also blocked on the upstream of the dam, so were not included in the numerical simulation.
The El. 826 m blanket drain was constructed as a consequence of the failed original drain components, documented elsewhere in this report. This drain is strongly influential on the phreatic conditions of the facility and has been included in the Ph1 model domain.
The El. 860 m blanket drain was completed immediately prior to failure. Although its period of operation was brief, its performance and influence on local conditions is critical in understanding left abutment phreatic performance. In particular, the geometry of this feature, as it steps up the slope to El. 870 m, is important in the simulation of phreatic conditions in this area.
The Main Gallery and Secondary Gallery have not been included in the numerical domain as these features were concrete conduits and do not have an effect on material permeability and the surrounding seepage regime.
The blanket on the upstream face of the Starter Dam (Dike 1) was not included as it was decommissioned before the commencement of the El. 826 m blanket drain.
Representation of slimes and sand deposition is important in defining TSF geometry and has been the subject of substantial reconstruction effort. This reconstruction has not only sought to understand the distribution of the relative mine waste products, but has also followed the management processes for water control and deposition of tailings. Geological partitioning within the TSF is strongly based on this slimes/sand interface work, and was a major undertaking as part of the Ph1 model construction process.
Pond location and elevation has similarly attracted substantial effort to reconstruct development and movement with changing construction activity, and similarly exerts an important influence on the phreatic performance of the TSF.

Fundão Tailings Dam Review Panel
Report on the Immediate Causes of the Failure of the Fundão DamAppendix G - Seepage Modeling
August 25, 2016 Page G-23
The modified geometry of the system, particularly the realignment of the crest along the left abutment (the setback), has been represented in the model domain consistent with actual construction.
The general arrangement of the TSF in November, 2015 is provided on Figure G 3-1. The above elements of the facility and the material parameters and monitoring data used in the numerical simulation are discussed further in subsequent sections.
Figure G 3-1 General arrangement of the Fundão Dam in November, 2015

Fundão Tailings Dam Review Panel
Report on the Immediate Causes of the Failure of the Fundão DamAppendix G - Seepage Modeling
August 25, 2016 Page G-24
G3.3 Ph1 Model Construction
The model design basis for the Ph1 model was to develop a calibrated, three-dimensional groundwater flow model for the Fundão Dam, to be used to predict:
phreatic conditions and head data for the facility;
changes to phreatic conditions in the facility with specific reference to changing surface geometry, construction activity and the effectiveness of various drains;
location of zones of intermittent emergent seepage with time;
a water balance of the facility; and
transient vertical gradient development where possible to do so.
The model is not to assess the performance of original design concepts, but is to apply the as-built knowledge of the facility and produce steady state and transient output to support conceptualization of the system and to inform independent stability analysis work.
Further, the transient model commences with the TSF at El. 830 m. The performance and consequent decommissioning of the drains below this elevation are not relevant to the reconstruction of conditions above the El. 826 m blanket drain. The initial construction period from start of operation to El. 830 m is represented by a single steady state model. The facility is then modeled under transient conditions from El. 830 m to a final elevation of El. 900 m. Details of this model architecture are provided in Section G3.3.5.
G3.3.1 Ph1 Model Limits
The model domains for both Ph0 and Ph1 models are shown on Figure G 3-2. The Ph1 domain is constrained by the surface water catchment reporting to the TSF, with the exception of the southwest extent which is bounded by the adjacent Germano facility. The model domain covers a planar area of 5,289,037 m2.

Fundão Tailings Dam Review Panel
Report on the Immediate Causes of the Failure of the Fundão DamAppendix G - Seepage Modeling
August 25, 2016 Page G-25
Figure G 3-2 Ph1 model extent (yellow) with regional geology and Ph0 extent (red)
G3.3.2 Ph1 Geological Basis
Although the Ph1 model is focused on the tailings, the domain has been vertically extended to a nominal depth of ~2x the maximum depth of the placed tailings. This is to provide sufficient depth definition to permit development of deeper flow regimes if required. In applying this detail, regional geology has been assumed in the absence of deep drill information.
Dam construction elements and regional geology used in the model comprise:
Dam construction:
Tailings sand (spigotted) Slimes Compacted sand from berm construction Mixed slimes/sand zones
Drain construction materials:
Natural ground Weathered, altered and fresh phyllite Structural alignments (included for potential sensitivity analysis)

Fundão Tailings Dam Review Panel
Report on the Immediate Causes of the Failure of the Fundão DamAppendix G - Seepage Modeling
August 25, 2016 Page G-26
G3.3.3 Ph1 Domain, Nodes and Layers
G3.3.3.1 Model Domain
The model was discretized using six-noded three-dimensional prism elements. A process of mesh refinement based on hierarchical areas of model interest (such as drains) was used to arrive at the final mesh configuration.
G3.3.3.2 Node Distribution
Variable density node distribution was applied to bring numerical focus to areas requiring the most detail. This has been achieved through use of “breaklines” to control location of nodes, and application of broad internal zoning to capture areas where increasing detail is needed. Breaklines used include lineal drain features, slope definition of final landforms (bench and berm details on Dike 1 including the rotated axis on the left abutment), TSF lateral extents, internal natural drainage alignments and internal constructed features such as Dike 2.
Node density in increasing level of detail is:
Most coarse nodal distributions are applied in the northeast where limited topographic control is available and the model domain is only extended in order to capture the surface hydrology catchment. Element size in this zone is about 100 m.
The topography outside the extent of the TSF and for which good elevation control is available has the next level of nodal density applied. Element size in this zone is about 60 m.
The TSF upstream of Dike 2 has element sizes of about 15 m.
The TSF upstream of Dike 1, and downstream of Dike 2 and the overflow, which is comprised of sand tailings, slimes, and compacted sand, and is inclusive of most constructed drain elements, has elements sized at about 10 m.
The final level of increased node density was applied directly to the left abutment, Dike 1 and Grota da Vale areas, with element sizes of about 5 m.
There are 31,845 elements per layer, across 49 layers, for 1,560,405 model elements. Figure G 3-3 provides nodal distribution (green) and breaklines (red) used in model discretization.

Fundão Tailings Dam Review Panel
Report on the Immediate Causes of the Failure of the Fundão DamAppendix G - Seepage Modeling
August 25, 2016 Page G-27
Figure G 3-3 Ph1 model mesh/node distribution (green) and key breaklines (red)
G3.3.3.3 Ph1 Model Layering
The Ph1 model was constructed in accord with the conceptual description of tailings morphology provided in Appendix B. The uppermost slice of the model was set as topography, and the base of the model was set at El. 690 m. The Ph1 model has 49 layers, comprising:
44 layers representing inside the TSF limits between El. 790 m to El. 900 m+. Layer thickness varies but within the TSF is generally 2.5 m or less per layer; and
5 layers representing El. 690 m to El. 790 m, comprising basement (weathered to fresh phyllite).
Layer definition is based on the application of a discretized tailings zone of variable total thickness constructed of a sequence of 2.5 m thick unique tailings horizons. This detail permits extraction of depth specific (model predicted) pressure with time, and assists in bringing numerical stability to the model by addressing the wide contrast in material parameters between slimes, sand and drains.
Figure G 3-4 shows an example of this, with basement (brown), slimes (green), sand (blue), compacted sand (yellow) and the El. 826 m blanket drain (orange), with red representing inactive model cells.

Fundão Tailings Dam Review Panel
Report on the Immediate Causes of the Failure of the Fundão DamAppendix G - Seepage Modeling
August 25, 2016 Page G-28
Figure G 3-4 Model cross section showing general layer distribution
One limitation of this approach is that tailings horizons need to be assigned the nearest 2.5 m elevation in the model. This represents a potential vertical error of +/-1.25 m. This vertical error, however, should be placed into context by considering the overall confidence in slimes distribution and elevation post-deposition (Appendix B). The true thickness of the slimes horizons across the TSF remains largely uncertain. The 2.0 m thickness of slimes logged in SP-07 at the left abutment is a post consolidated thickness. Also, slimes interface mapping assigned elevation to the slimes horizons at the time they were deposited (still visible at surface) and specific to the dates available for the respective survey data or aerial image. This approach was well suited to reconstructing the morphology of the TSF; however, it is not possible to assess with confidence true depositional or true post consolidated thicknesses. Other than limited drill control, no data exists to verify this.
The 2.5 m thick layers assigned in the FEFLOW domain are therefore considered an acceptable representation of pre- to post-consolidated conditions, and remain within the bounds of ~3 months deposition (assuming 10 m to 12 m raise rates per annum), which is the maximum stress period interval defined and discussed in Section G3.3.5.
G3.3.4 Drains and Other Boundary Conditions
G3.3.4.1 Drain Discussion
An important observation from the Ph0 modeling is the hydraulic response of the system to the three broadly contrasting material types of slimes, sands and drains, and in particular, the general performance of the TSF under a variety of drain stress induced through diminishing drain permeability. An outcome of the Ph0 work identified that numerical modeling of the Fundão Dam is not an exercise in subtle material parameter contrasts. Rather, it is an exercise in understanding and representing the geometric distributions of these broadly contrasting material types, and correctly applying boundary conditions and stresses to each of them. The most powerful and relevant boundary affecting the TSF is the location and performance of the internal drains.
Models Ph0-2a/2b/2c/2d (Section G2.3.5) showed drain performance was not seriously affected until three orders of magnitude reduction in permeability from design intent occurred. This concept is further supported with analytical assessment of drain capacity (Section G2.3.9) which indicated up to 2,300 L/s flow was possible under reasonable hydraulic gradients and pressurized conditions, which is well in excess of expected water balance components.

Fundão Tailings Dam Review Panel
Report on the Immediate Causes of the Failure of the Fundão DamAppendix G - Seepage Modeling
August 25, 2016 Page G-29
Piezometric data in the area of the right abutment and the El. 826 m blanket drain (Appendix E) showed that conditions across and behind the blanket drain had largely reached a quasi-steady state condition relatively quickly after the commissioning of the drain. This drain, together with the remnants of the Principal Foundation Drain and the Auxiliary Drain (within the Starter Dam), provide good control of phreatic conditions in this area of Fundão Dam, with minimal vertical variation in piezometric response between El. 790 m and El. 835 m after El. 826 m blanket drain commissioning. Also of note from this data is the more variable piezometric responses of instrumentation located further away and in higher elevations from the El. 826 m blanket drain, indicating the diminishing effectiveness of the drain with increasing distance and elevation.
Figure G 3-5 Composite hydrograph showing piezometric trends during period of El. 826 m
blanket drain operation, up to El. 850 m A degree of variability in the permeability of these drains can therefore be absorbed before detrimental impact, resulting in substantial change to the hydraulic profile, occurs. This does not negate the possibility that incorrect drain construction may have impacted hydraulic performance of the system. Rather, the Ph0 modeling and analytical drain performance, together with the piezometric data for the right abutment, brings greater focus to the geometry of the overall TSF as being a more critical factor to drain “efficiency” than drain permeability alone.
The likelihood is therefore that increasing distance from active and operating drains is a driving factor to heightened phreatic conditions and emergent seepage events. This effect is made more prominent with the presence of slimes horizons, a topic discussed further in Section G3.5.1. These interpretations are also reflected in the operational response by the site to construct the El. 860 m blanket drain and commence construction of a similar drain on the right abutment at the time of failure.
Notes:1. Piezometric levels are grouped by instrumentation sections. See Appendix E Attachment E1 for grouping.2. Piezometric levels for Sections 01, 03 and left abutment piezometers are not shown as they are above the maximum elevation range shown.
785
790
795
800
805
810
815
820
825
830
835
840
845
850
785
790
795
800
805
810
815
820
825
830
835
840
845
850
2010-01-01 2011-01-01 2012-01-01 2013-01-01 2014-01-01 2015-01-01 2016-01-01
Piez
omet
ric Le
vel /
Res
ervo
ir El
evat
ion
(m)
Piez
omet
ric Le
vel /
Res
ervo
ir El
evat
ion
(m)
SpillwayToeAABBDDFF
HHJJLLNNMM02
Reservoir El.
El. 826 m Blanket Drain

Fundão Tailings Dam Review Panel
Report on the Immediate Causes of the Failure of the Fundão DamAppendix G - Seepage Modeling
August 25, 2016 Page G-30
G3.3.4.2 Drain Representation in the Ph1 Model
Drain representation in the numerical domain is a relatively simple application of expected drain material parameters adjusted to model geometry. For the most part, and because the El. 826 m and El. 860 m blanket drains were geometrically broad sequences of high permeability material rather than narrow and finite lineal arrangements, their representation in the model was much closer to as-built conditions than other drain elements. The most important aspect of their inclusion was therefore correct spatial representation, especially for their base elevations.
Activation of these drains was achieved through sequenced raising of the overall facility from El. 830 m, with the model turning layers “active” as their respective elevations fell below the elevation of the TSF surface at any particular time step. The drains continued to remain active until the end of the simulation, with their ability to convey or discharge water constrained or enabled depending on adjacent and overlying material conditions.
A summary of the drain elements and the manner of their inclusion is provided, with their respective locations/distributions shown on Figure G 3-1:
El. 826 m blanket drain is represented as a horizontal blanket of high permeability material consistent with as-built records. The model includes lineal representation of the Kananets® in direct connection with the drain material to assist in rapid removal of water.
El. 860 m blanket drain is represented as a horizontal blanket of high permeability material consistent with as-built records. Importantly, this drain “steps up” to El. 870 m perpendicular to the slope on the left abutment, in accord with the physical construction of this feature.
Principal Foundation Drain and Auxiliary Drain are modeled as high permeability lineal drains beneath Dike 1, represented consistent with as-built knowledge with only the remnants of these active drains inside the Starter Dam geometry.
The series of left abutment drains is a lineal drain feature constructed along the left abutment and suspected to be in direct connection with the El. 860 m blanket drain. Although this was not confirmed, the drains were known to have a defined outlet in the form of a buried pipe under the setback plateau. Either way, water collected by these drains were conveyed out of the system in a controlled manner. The feature is represented in the numerical domain consistent with the interpretation of its extent and timing described in Appendix B.
The material parameters of the drains were not adjusted in the calibration process. This is because the Ph0 modeling showed that minor modification of their material parameters had little impact on their performance or their influence on broader phreatic conditions. Further, initial manual calibration using their design material parameters resulted in early “good” response to adjacent piezometers, indicating no need to modify their performance for local calibration purposes.
Modification of their performance was only considered in the event their operation in the numerical domain had much broader influence, which was not the case.

Fundão Tailings Dam Review Panel
Report on the Immediate Causes of the Failure of the Fundão DamAppendix G - Seepage Modeling
August 25, 2016 Page G-31
G3.3.4.3 Other Boundary Conditions
The following boundary conditions were established in the mine area FEFLOW model:
Constrained seepage face conditions were established across the face of the dam. The constraints on the seepage face dictate that once phreatic conditions intersect Slice 1 (the top of the upper active layer in the model at the time of the simulation), water is removed from the system and reports to the water balance as an outflow. This numerical representation of seepage faces is established to reflect the physical process of emerging seepage due to rising phreatic conditions “daylighting” at surface.
No flow boundary conditions were established at the model base and on the outer vertical limits of the model domain to reflect the effect of groundwater divides along major catchment boundaries.
Constant head conditions were applied to ponds for each of the stress periods defined, including the area of exposed slimes across the TSF. These conditions were triggered and active only when their presence was confirmed through reconstruction of the TSF morphology (Appendix B).
Recharge was applied across Slice 1 according to the areal distribution of rainfall described in Table G 3-1.
Consolidation effects were included as an important transient boundary condition, and are described in more detail in Section G3.3.7.
G3.3.5 Model Timing and Stress Periods
Transient FEFLOW simulations are controlled by established model duration and time steps, transient boundary conditions and/or material changes over time. The time power functions and time steps which introduce these stresses to the model domain are developed for unique model inputs in order to best represent their time-influence on the model simulation.
Geometric changes to the domain through adjustment to model stress periods are based on a starting model under steady state conditions of El. 830 m (~November, 2010), followed by quarterly geometric changes until November, 2013, and monthly changes to November, 2015. The model is constructed of daily time-steps to permit extraction of output coincident with the timing of relevant events. A summary of the model stress periods mapped against failure events and drain activity is provided on Figure G 3-6. The transient model (Ph1) starts on December 1, 2010 and ends on November 5, 2015.
Conditions prior to the commissioning of the El. 826 m blanket drain were not included in this transient simulation. Under-performing drain elements (e.g., the drainage blanket on the upstream face of the Starter Dam) were decommissioned prior to the El. 826 m blanket drain. The concrete conduits (Main and Secondary Galleries) do not affect material permeability and were similarly decommissioned albeit after the El. 826 m blanket drain. They therefore provide no hydraulic influence on the system (other than where remnant features of these drains remain) of relevance to

Fundão Tailings Dam Review Panel
Report on the Immediate Causes of the Failure of the Fundão DamAppendix G - Seepage Modeling
August 25, 2016 Page G-32
the period leading up to the November, 2015 failure. Modeling of these features was considered a redundant process that would only add unnecessary complexity to the simulation.
Figure G 3-6 Fundão Dam TSF life cycle with model stress periods
G3.3.6 TSF Raise/Construction Process
The adaptation of the as-built construction process to the numerical domain required representation of the following time dependent elements:
elevation, distribution and lateral extent of slimes;
elevation, distribution of sand tailings (including compacted berms);
spatial distribution and elevation of drains (discussed in Section G3.3.4); and
spatial distribution and changing elevation of intermittent ponds.
G3.3.6.1 Slimes Elevation and Distribution
The slimes exert significant influence on the hydraulic performance of the TSF. They represent a source of water; they control the main elevation of the slimes pond; they impede vertical flow where they exist as discrete layers; they provide confinement to underlying permeable materials; and they laterally skew the regional distribution of the phreatic surface. Translating their distribution and elevation (Appendix B) into the FEFLOW domain and matching this transient record to the stress periods assigned was a time consumptive and detailed process, made further challenging by the need to match other construction activity of the TSF such as sand placement and ponds.
J F M A M J J A S O N D J F M A M J J A S O N D J F M A M J J A S O N D J F M A M J J A S O N D J F M A M J J A S O N D J F M A M J J A S O N D J F M A M J J A S O N D J F M A M J J A S O N D
Drain Activity Log Dike 1 Upstream Drainage Blanket Dike 1 Contingency Drains Dike 1 Principal Foundation Drain Dike 1 Auxiliary Foundation Drain Dike 1 El. 826 m Blanket Drain / Kananets Dike 1 El. 860 m Blanket Drain Dike 1 Right Abutment El. 940 m Drain Vale Toe DrainIncidents Internal drain piping failure Main Gallery settlement
Left abutment seepage at El. 845 m Secondary Gallery sinkhole
Left abutment saturation at El. 855 mLeft abutment seepage at El. 855 mLeft abutment seepage at El. 860 m, cracks on slope
Left abutment upwelling at El. 860, cracks on crestRight abutment seepage at El. 855 mAugust 2014 slope movementsRight abutment seepage at El. 860 mLeft abutment saturation at El. 867 mLeft abutment saturation at El. 820 mLeft abutment saturation at El. 820 m
Fundão Dam Failure
MODEL STRESS PERIODS
2014 2015
Transient, quarterly stress periodsTransient, monthly stress
periods
2008 2009 2010 2011 2012 2013
Steady State starter model

Fundão Tailings Dam Review Panel
Report on the Immediate Causes of the Failure of the Fundão DamAppendix G - Seepage Modeling
August 25, 2016 Page G-33
Appendix B details the method used to reconstruct the history of slimes and sand deposition in the TSF, and should be read in conjunction with this appendix. The process is detailed and required the spatial cataloguing of aerial photography and survey data against operational reports, material balances, site photography, decant locations and general construction activity records.
The design intent of the facility (Section G2.2) was to separate slimes and sand deposition behind Dike 1 and Dike 2, respectively, maintain a positive sand elevation (+5 m) above slimes, and maintain a minimum beach distance of 200 m between the crest of the dam and the slimes. This design intent, however, was not met all of the time, resulting in periods of slimes encroachment toward and in some cases beneath the dam crest. Such events resulted in discrete slimes horizons being deposited within the sand body (below and above), as depicted on Figure G 3-7 (reproduced from Appendix B).
Each 2.5 m slice of the FEFLOW model was assigned a material parameter distribution consistent with the slimes/sand tailings morphology, also accounting for areas of compacted sand and drain construction. The sequence was built from the bottom up to a final elevation of El. 900 m, with parallel matching of pond extents and elevations. This resulted in a single mass of tailings to final survey data of November, 2015. Slimes elevations were then “stepped down” in 2.5 m increments to reverse-construct the history of the TSF in accord with model time stress periods, while maintaining consistent elevation changes to those of the overall facility and representing the slimes/sand model geometry in the FEFLOW domain.
A total of 29 unique system models were produced using this technique, with their active representation in the numerical domain determined by the time period of the model. Those model cells outside the active domain were “inactive” until the TSF elevation triggered otherwise.
Figure G 3-8 shows an example of the aerial photography used to define the slimes, as well as the transition from predominantly slimes to interbedded slimes to isolated slimes, upstream of Dike 1. This transition concept is discussed in Appendix B. For the FEFLOW model, however, actual mapped horizons of slimes were used consistent with the interpretation presented on Figure G 3-7, and assigned to layers in accord with the 2.5 m structure previously described.

Fundão Tailings Dam Review Panel
Report on the Immediate Causes of the Failure of the Fundão DamAppendix G - Seepage Modeling
August 25, 2016 Page G-34
Figure G 3-7 Sectional distribution of slimes and sand within the TSF
Slimes mapped using topography Slimes mapped using monthly reports

Fundão Tailings Dam Review Panel
Report on the Immediate Causes of the Failure of the Fundão DamAppendix G - Seepage Modeling
August 25, 2016 Page G-35
Figure G 3-8 Zones of slimes stratigraphy
G3.3.6.2 Tailings Sand Distribution
Mapping the distribution of sands was a simpler process, with the sand distributions assigned to the 2.5 m FEFLOW layers in the same manner as the slimes, using the same base data and interpretation method as that used for slimes (Appendix B).
However, an additional consideration of the sands distribution was the representation of the tailings beach and the dam crest for each of the stress periods. Because the beach distributions and dam crest were not directly relatable to the slimes elevation, a technique to permit transient geometric representation of these features was developed using a combination of slimes elevation/time, and corresponding survey data (which was generally available for each of the stress periods required).
The process involved resampling of the survey data for the time stamp that each of the 2.5 m slimes layers represented, with isopachs created of sand thickness over slimes elevation for +1.8 m, +3.3 m, +7.8 m, etc. These isopachs represented the areas of the model layers above the slimes that were active for each of the consequent 2.5 m raises (the +1.3 m step difference is to permit more than 50% of the overlying layer to be sand before the layer becomes active). Turning these particular cells active in parallel with the slimes layers then recreated the beach geometry, albeit coarse, of the sand between the dam crest and the slimes pond.
This process had a secondary benefit for the modeling exercise. In addition to permitting a more realistic geometry to be represented, it allowed numerical identification within the modeling domain of the sand layers (nodes) as they first became active. Using this trigger, application of a consolidation

Fundão Tailings Dam Review Panel
Report on the Immediate Causes of the Failure of the Fundão DamAppendix G - Seepage Modeling
August 25, 2016 Page G-36
water production curve for sand (Section G3.3.7) permitted model derived calculation of produced water, which was rapidly released from sands soon after their “activation”. This water showed good correlation to spigot water estimates (Section G3.4.2.2), and because this water was produced when the sand was first deposited, and in response to actual raises, it proved a faster and more reliable manner in which to account for spigot water in the water balance.
The alternative to this was to map spigot locations and create spatial discharge zones for the entire modeling period, and then artificially assign enhanced incident recharge to represent spigotting effects. The former approach was adopted as it was more efficient, it produced water in alignment with sand material properties, and it produced water in the areas of active tailings raise automatically in the model domain without the need for manual intervention and creation of additional synthetic data.
G3.3.6.3 Pond Elevation and Distribution
Pond distribution and elevation was imported into the model aligned with model stress periods and slimes elevation. Figure G 3-9 shows an example of pond distribution as assigned in the model.
Figure G 3-9 Example of pond definition in Fundão, representing open water bodies and slimes
Ponds were defined by their elevation and the duration of their life. Ponds over slimes were maintained throughout the simulation with elevation aligned with the slimes elevation. Other ponds were typically intermittent in nature and often of small size; however, they were included if their location was determined to be a likely long term stress on the system. Short lived ponds on sand tailings (typically associated with local construction activity) were excluded from the model domain unless their existence and persistence could be correlated with piezometric data.

Fundão Tailings Dam Review Panel
Report on the Immediate Causes of the Failure of the Fundão DamAppendix G - Seepage Modeling
August 25, 2016 Page G-37
The pond timeline presented in Appendix B provides a detailed summary of pond distribution and elevation.
G3.3.7 Consolidation Water
Water produced through consolidation is an important consideration for three reasons:
1. For sands, it represents the rapid and immediate release of excess water from the spigotting process.
2. For slimes:
It accounts for water released at depth, which is of importance if this is released under confined conditions, or contributes to overlying sands which are already receiving substantial recharge through both spigotting and natural recharge.
It accounts for water release in the main body of slimes which serves to maintain the main TSF pond elevation, which is ultimately controlled through decanting.
3. For both materials, because of the rapid rate of rise observed across the TSF (Appendix B), the production of this water and the depth of its release become important considerations in understanding pore-water pressure changes that may have occurred.
G3.3.7.1 Consolidation Process
The relationship between void ratio (e) and effective vertical stress (σv); and hydraulic conductivity (K) and void ratio (e) were formulated based on a series of consolidation model results (Appendix F).
For each active cell, the consolidation process is modeled with the effective vertical stress calculated by the overlying weight of material (mixture density of slime, sand and water 1,900 kg/m3), resulting in a consequent calculated pressure in the cell at each time step. The residual void ratio is tracked for each cell as water is expelled, noting that residual void ratio reduces as consolidation takes effect.
At each time step, the model loops back to each cell to recheck the consolidation condition. If the effective stress is less than or equal to 11.0 kPa (equivalent to the effective stress of a saturated top cell at the cell center), then the water expelling rate is assigned as 0 and the consolidation process ceases. Through this process, the release of consolidation water is modeled as a natural process, not a fixed flow rate, and is linked to the material properties of the respective tailings material.
This process operates independent of FEFLOW modeling code.
G3.4 Ph1 Model Calibration Substantial effort had been completed before transient model calibration commenced, which permitted advancement of model complexity and detail whilst maintaining a relatively stable numerical condition and lean run times, and achievement of good quality interim results throughout the model development process. This included:
Completion of the Ph0 modeling (Section G2) which permitted understanding of parameter sensitivity and identification of major stresses requiring the most detailed assessment. This

Fundão Tailings Dam Review Panel
Report on the Immediate Causes of the Failure of the Fundão DamAppendix G - Seepage Modeling
August 25, 2016 Page G-38
work also assisted in developing the model construction approach to permit reasonable model run times to be maintained, and to model predicted results consistent with expected outcomes.
Completion of steady state Ph1 modeling to readdress model elements in light of the reconstruction of the as-built TSF. This element of the project also included additional stresses being periodically tested to track that model output remained consistent with expected outcomes, and that model run efficiency was not unduly compromised.
Completion of parallel studies to reaffirm boundary condition assumptions and inform the stress period definition and transient stresses needed to be included in the final model.
G3.4.1 Material Parameters
Table G 3-1 provides a summary of material parameters applied in the calibrated Ph1 model.
G3.4.2 Steady State Calibration
An initial steady state calibrated model of the October/November 2015 TSF was completed to meet two objectives:
1. Reaffirm suitability of model stresses and boundaries, translated from the Ph0 mode and applied to the as-built conditions in Ph1.
2. Create a base model from which the El. 830 m starter model for the Ph1 transient simulation could commence.
Table G 3-1 Ph1 model material parameters
Parameter Data/Range/Approach
Hydraulic conductivity
(K)
Storage (S)
Material Kxy cm/s Kv cm/s Sy Ss TSF (Sand) 5.0 x10⁻⁴ 2.3 x10⁻⁴ 0.20 1.0 x10⁻⁵ Sand/slimes 3.5 x10⁻⁴ 1.7 x10⁻⁴ 0.20 1.0 x10⁻⁵ Slimes 1.2 x10⁻⁶ 5.8 x10⁻⁷ 0.20 1.0 x10⁻⁵ Dike 1/Dike 2/Raise (saprolite) 1.0 x10⁻⁴ 5.2 x10⁻⁵ 0.20 1.0 x10⁻⁵ Underdrain 1.0 x10⁻¹ 1.0 x10⁻¹ 0.35 1.0 x10⁻⁵ Base rock 1.2 x10⁻⁷ 1.2 x10⁻⁷ 0.20 1.0 x10⁻⁵
Precipitation/ Recharge (mm/mo)
(constrained to highest active
cells only)
Starting Values (% Mean Monthly RF)
TSF Sand … 20% Compacted Sand… 10% Dike/Basement… 5%
Pond Recharge Coupled with the consolidation water produced through the slimes, maintained (removed) through assignment of the pond elevation as an equivalent constant head.
Germano Mean RF (mm)Jan 235Feb 142Mar 273Apr 80May 41Jun 17Jul 13Aug 6Sep 36Oct 130Nov 352Dec 401

Fundão Tailings Dam Review Panel
Report on the Immediate Causes of the Failure of the Fundão DamAppendix G - Seepage Modeling
August 25, 2016 Page G-39
Parameter Data/Range/ApproachDrain
Permeability See above. Starting values from Ph0 model.
Consolidation Water
The effective stress of each cell is calculated at each time step. Based on the given gradient of void ratio vs. log of the effective stress, the expelled water through void ratio reduction is determined within that cell. At the same time the void ratio is updated until it reaches the minimum value: then the consolidation process terminates. The expelled water is applied as a water source for each cell as recharge into the model at depth.
The steady state calibration used 56 monitoring locations across the TSF, with head elevations measured in late October, 2015 ranging between ~El. 790 m and ~El. 880 m. These data were filtered from the complete record by excluding sites which did not have an October 26, 2015 (or close to this) measurement record, excluding sites with questionable records or survey information (Appendix E), and excluding data for which the record lay at or below the base elevation of the bottom of the screen/intake zone.
This resulted in the list of piezometers provided in Table G 3-2. Flow records for drains measured on October 26, 2015 were applied to assess model predicted flows; these included:
The El. 826 m blanket drain (Kananets®) 252.0 m3/h 70.0 L/s
Fundão base drain (Principal Foundation Drain) 9.7 m3/h 2.7 L/s
Grota da Vale 34.5 m3/h 9.6 L/s
The model was run applying the same starting material parameters and boundary condition assumptions as those described in the Ph0 modeling. Manual model adjustments were made until a suitable calibration was achieved, with the final steady state model reflecting minimal change to Ph0 model assumptions with the addition of reducing permeability of the sand tailings with depth, similar to the Ph0-5 scenarios presented in Section G2.3.8.
Table G 3-2 Steady state calibration reference list
Line Reference Measured Line Reference Measured Line Reference Measured
AA 16PI003 812.57 DD 24PI046 804.25 LL 24PI058 808.22
AA 16PI004 827.28 DD 24LI021 804.93 LL 24PI059 807.80
AA 16PI005 844.07 DD 24LI029 800.67 LL 24LI027 804.26
AA 16PI020 864.82 DD 16PI017 800.37 MM 24PI060 812.58
AA 24LI017 824.36 DD 16PI018 800.63 MM 24LI028 807.04
AA 24LI018 816.26 FF 24PI041 801.44 NN 16PI001 808.47
AA 16LI010 844.42 FF 24PI048 802.88 NN 16PI002 813.04
AA 16LI011 837.56 FF 24PI050 800.21 01 16PI016 876.05
AA 16LI013 856.54 FF 24LI022 797.47 01 16PI015 871.99

Fundão Tailings Dam Review Panel
Report on the Immediate Causes of the Failure of the Fundão DamAppendix G - Seepage Modeling
August 25, 2016 Page G-40
Line Reference Measured Line Reference Measured Line Reference Measured
BB 16LI001 830.27 FF 24LI030 795.86 01 16PI013 869.10
BB 16LI002 838.70 HH 24PI052 794.80 02 16LI014 877.54
BB 16LI012 852.65 HH 24PI053 797.03 02 16PI012 869.41
BB 16PI006 837.23 HH 24LI023 794.34 02 16PI010 866.21
BB 24PI044 818.83 HH 24LI024 792.05 02 16PI007 852.70
BB 24LI019 808.31 JJ 24PI054 796.18 03 16LI016 878.01
BB 24LI020 800.75 JJ 24PI055 797.58 03 16PI014 873.32
DD 24PI045 807.86 JJ 24PI056 792.28 03 16PI011 869.26
DD 24PI039 809.74 JJ 24PI062 797.36 03 16PI009 864.86
DD 24PI047 805.55 JJ 24LI026 792.20
A summary of calibration statistics for the steady state Ph1 model is provided in Table G 3-3. Scaled RMS below 10% generally indicates an acceptable calibration; however, this is not always the case and other metrics should also be evaluated. Of equal or greater importance is that the calibrated model reproduces the groundwater flow processes in terms of representing the conceptual understanding within the numerical environment. A good indicator of this is usually achieved through review of the model residuals and the model water balance.
Table G 3-3 Summary of steady state model calibration
Statistical Metric Calibration Metrics: Steady State Model Number of primary head calibration targets 56
Root Mean Square Error 11.47 m Scaled RMS 7.1 %
Mean Sum of Residuals 5.30 m Scaled Mean Sum of Residuals 5.9 %
Water balance error <1 %
G3.4.2.1 Model Residuals
Model residuals are provided on Figure G 3-10 and show a generally good correlation of measured to modeled heads across the range of data assessed. Model residuals ranged between -18.5 m and +5.8 m, with an average of -3.2 m. The scaled mean sum of residuals was also acceptably low at 5.9% (Table G 3-3). These data indicate a good predictive capacity of the model under steady state conditions.

Fundão Tailings Dam Review Panel
Report on the Immediate Causes of the Failure of the Fundão DamAppendix G - Seepage Modeling
August 25, 2016 Page G-41
Figure G 3-10 Calibrated steady state model, measured vs. modeled heads
G3.4.2.2 Steady State Water Balance
The mass balance error of the steady state model is the difference between model inflows and model outflows. An error of around 1% for steady state simulations2 is usually considered acceptable (Anderson and Woessner 1991). The steady state water budget and mass balance error are presented below. The model produced a water balance error of -0.1 L/s, which is well below the target 1%, reflecting both good model stability and numerical representation of the conceptual setting. A summary of the major water balance components for this model is provided:
WATER IN
Pond inflow (constant head) + 32.4 L/s
Recharge (rainfall) + 80.1 L/s
Total In + 112.5 L/s
2 Transient simulations are expected to have larger water balance errors as they reflect the time step change and consequent transient stresses that are applied throughout the model run.

Fundão Tailings Dam Review Panel
Report on the Immediate Causes of the Failure of the Fundão DamAppendix G - Seepage Modeling
August 25, 2016 Page G-42
WATER OUT
El. 826 m blanket drain flow - 96.0 L/s
Principal Foundation Drain flow - 10.9 L/s
Emergent seepage - 5.7 L/s
Total Out - 112.6 L/s
IMBALANCE
Water In – Water Out - 0.1 L/s
An additional observation of the steady state model is that the results predicted emergent seepage (~5.7 L/s) under steady state conditions at two locations on the left and right abutments. These locations are each coincident with 2015 seepage observations, as shown on Figure G 3-11 (from Appendix B Attachment B8). This predicted seepage breakout is an indication of sound translation of the conceptual setting into the numerical environment.
Figure G 3-11 Event map showing recorded seepage and failure related incidents

Fundão Tailings Dam Review Panel
Report on the Immediate Causes of the Failure of the Fundão DamAppendix G - Seepage Modeling
August 25, 2016 Page G-43
G3.4.2.3 Steady State Calibration Summary
The results indicated a good quality steady state model calibration and strong translation of the conceptual understanding of the TSF into the numerical environment. This model was assessed as suitable and consequently advanced to the transient analysis.
The calibrated model was reconstructed to the El. 830 m TSF geometry and run again to steady state to create an El. 830 m starting condition for the commencement of the transient simulation. The transient analysis was then constructed in accordance with the earlier descriptions and calibration manually undertaken using a similar process to that applied to the steady state model.
The transient calibration process is described in the following sections.
G3.4.3 Transient Calibration
As the model was strongly responsive to broad scale changes associated with the representation of boundary conditions and far less responsive to subtle variations in material parameters, manual calibration proved sufficient to achieve a suitable calibration. The quality of this transient calibration has been assessed using five approaches, each discussed in the following sections:
visual observation of model predicted hydrographs against a suite of measured data for elevations greater than El. 830 m;
statistical analysis of the predictive capacity of the model in the same manner as that presented for the steady state calibration;
analysis of transient predicted drain flows against measured data;
review of the transient water balance at the October/November 2015 condition; and
visual observation of system dynamics and comparison with the conceptual understanding – this is particularly the case for areas of “thin” unsaturated zones and/or areas of model predicted emergent seepage.
G3.4.3.1 Transient Model Calibration Modifications
The model was run applying the same starting material parameters and boundary condition assumptions as those described in the model construction process. Calibration was achieved through application of the approaches developed in scenarios Ph0-4 and Ph0-5 (Sections G2.3.7 and G2.3.8). Tailings sand permeability was adjusted through the consolidation water production process applying diminishing permeability values with depth.
A summary of transient calibration values is provided in Table G 3-4.

Fundão Tailings Dam Review Panel
Report on the Immediate Causes of the Failure of the Fundão DamAppendix G - Seepage Modeling
August 25, 2016 Page G-44
Table G 3-4 Summary of transient model calibration parameters
Parameter Data/Range/ApproachHydraulic
conductivity (K)
Storage (S)
Material Kh cm/s Kv cm/s Sy Ss TSF (Sand) 6.9 x10⁻⁴ to 4.5 x10⁻³ 3.5 x10⁻⁴ to 1.6 x10⁻³ 0.20 1.0 x10⁻⁵ Slimes 1.2 x10⁻⁶ 1.2 x10⁻⁶ 0.25 1.0 x10⁻⁵ Dike 1/Dike 2/Raise (saprolite) 1.0 x10⁻⁴ 5.2 x10⁻⁵ 0.20 1.0 x10⁻⁵ Base rock 1.2 x10⁻⁷ 1.2 x10⁻⁷ 0.01 1.0 x10⁻⁵
Precipitation/ Recharge (mm/mo)
(constrained to highest active
cells only)
Starting Values (% Mean Monthly RF) TSF Sand … 20% Compacted Sand… 10% Dike/Basement… 1%
Pond Recharge Coupled with the consolidation water produced through the slimes, maintained (removed) through assignment of the pond elevation as an equivalent constant head.
Drain Permeability
Material Kxyz cm/s S El. 852.5 m of left abutment (5 m x 2.5 m) 2.3 x10⁻² 1.0 x10⁻⁵ Principal/Auxiliary (in Starter Dam) 1.3 x10⁻¹ 1.0 x10⁻⁵ El. 826 m blanket drain 1.0 x10⁻¹ 1.0 x10⁻⁵ Dam 1 Remnant Vertical Drain 5.0 x10⁻³ 1.0 x10⁻⁵
Consolidation Water
The effective stress of each cell is calculated at each time step. Based on the given gradient of void ratio vs. log of the effective stress, the expelled water through void ratio reduction is determined within that cell. At the same time the void ratio is updated until it reaches the minimum value: then the consolidation process terminates. The expelled water is applied as a water source for each cell as recharge into the model at depth.
Notes: The El. 826 m blanket drain Kananets® are represented by seepage face nodes to remove the water along the Dike 1 crest at El. 826 m. Blanket drains are represented as 2D slice face discrete elements; lineal drains as 1D discrete elements.
G3.4.3.2 Transient Hydrograph Data
The assessment of calibration performance using transient hydrographs is constrained to those piezometers with a screen elevation above the El. 826 m blanket drain. This is because the TSF to El. 830 m was modeled under steady state conditions, and therefore none of the original drain infrastructure, which was decommissioned, is included. Because these drain features are not modeled, it is not possible to calibrate against piezometric records that have experienced the influence of these features in their record.
Those piezometers used in the transient calibration process are:
RIGHT ABUTMENT
Line AA 5x piezometers: 16PI003, 16PI004, 16PI004, 16LI010, 16PI020
Line BB 2x piezometers: 16LI002, 16PI006
Germano Mean RF (mm)Jan 235Feb 142Mar 273Apr 80May 41Jun 17Jul 13Aug 6Sep 36Oct 130Nov 352Dec 401

Fundão Tailings Dam Review Panel
Report on the Immediate Causes of the Failure of the Fundão DamAppendix G - Seepage Modeling
August 25, 2016 Page G-45
LEFT ABUTMENT
Line 01 4x piezometers: 16LI015, 16PI013, 16PI015, 16PI016
Line 02 3x piezometers: 16PI007, 16PI010, 16PI012
Line 03 4x piezometers: 16LI016, 16PI009, 16PI011, 16PI014
Model predicted transient conditions compared with measured data for each of these five lines is presented on Figure G 3-12, Figure G 3-13, Figure G 3-14, Figure G 3-15 and Figure G 3-16. For each section, the solid line represents the model-produced data, and the point data represents field measured records. Time on the x-axis is model run time.
Figure G 3-12 Calibrated transient model hydrographs, measured versus modeled, line AA
Figure G 3-13 Calibrated transient model hydrographs, measured versus modeled, line BB

Fundão Tailings Dam Review Panel
Report on the Immediate Causes of the Failure of the Fundão DamAppendix G - Seepage Modeling
August 25, 2016 Page G-46
Figure G 3-14 Calibrated transient model hydrographs, measured versus modeled, line 01
Figure G 3-15 Calibrated transient model hydrographs, measured versus modeled, line 02

Fundão Tailings Dam Review Panel
Report on the Immediate Causes of the Failure of the Fundão DamAppendix G - Seepage Modeling
August 25, 2016 Page G-47
Figure G 3-16 Calibrated transient model hydrographs, measured versus modeled, line 03
G3.4.3.3 Statistical Calibration Performance
A statistical assessment of the calibration was undertaken using 400 individual piezometric records taken from the piezometric hydrographs for the 18 sites described above in the hydrograph discussion. A summary of calibration statistics for these sites is provided in Table G 3-5. Scaled RMS below 10% was achieved again and indicates an acceptable calibration.
Table G 3-5 Summary of transient model calibration
Statistical Metric Calibration Metrics: Transient Model Number of primary head calibration targets 400
Root Mean Square Error 2.57 m Scaled RMS 8.9 %
Mean Sum of Residuals 8.44 m Scaled Mean Sum of Residuals 29.2 %
Imbalance ~5 %
Model residuals for the transient calibration are provided on Figure G 3-17 and show a good correlation of measured-to-modeled heads across the range of data assessed. Model residuals ranged between -7.2 m and +3.4 m, with an average of -1.4 m. The scaled mean sum of residuals increased as the range of elevation across which the calibration data was measured was reduced. These data continue to indicate good predictive capacity of the model.

Fundão Tailings Dam Review Panel
Report on the Immediate Causes of the Failure of the Fundão DamAppendix G - Seepage Modeling
August 25, 2016 Page G-48
Figure G 3-17 Calibrated transient model, measured versus modeled heads
G3.4.3.4 Drain Flow Performance
Transient drain flow for the El. 826 m blanket drain and the Principal Foundation Drain are provided on Figure G 3-18. Modeled flows show cycling effects which are a response to the “block” approach the model applies to TSF raising, resulting in peaks of flow as significant construction occurs near the drain followed by periods of abated flow. The general trend, however, of the El. 826 m blanket drain flow shows good correlation with the measured flows, including the flattening off of flows noted after model day 1400. Modeled flow from the Principal Foundation Drain is consistently low, largely a response to the quasi steady state conditions across the original Starter Dam controlled by the El. 826 m blanket drain.

Fundão Tailings Dam Review Panel
Report on the Immediate Causes of the Failure of the Fundão DamAppendix G - Seepage Modeling
August 25, 2016 Page G-49
Figure G 3-18 Calibrated transient model drain flows, measured vs. modeled
G3.4.3.5 Transient Water Balance
The transient water balance was extracted for the end of the model run to provide a snapshot for summary reporting, and to compare transient output with the steady state model results (recognizing there is more detail in the transient simulation because of the inclusion of consolidation water). These results are presented in the following:
WATER IN
Consolidation Water (slimes/pond) + 88.3 L/s
Consolidation Water (spigot water) + 88.3 L/s
Recharge (rainfall) + 5.1 L/s
Total In + 181.7 L/s
WATER OUT
El. 826 m blanket drain flow - 75.3 L/s
Principal Foundation Drain flow - 4.0 L/s
Reject consolidation water - 84.4 L/s
Emergent seepage - 2.6 L/s
Total Out - 166.3 L/s

Fundão Tailings Dam Review Panel
Report on the Immediate Causes of the Failure of the Fundão DamAppendix G - Seepage Modeling
August 25, 2016 Page G-50
IMBALANCE
Water In – Water Out = change in storage + 15.4 L/s
There are several observations important in interpreting these results:
Consolidation water “in” is reported as a total amount, but represents water released from both slimes and sand. For reporting purposes this has simply been split 50/50. In the water “out” budget, the excess consolidation water, which flows to the pond, is reported as a standalone water budget item. These estimates of water “in” and “out” should be considered together as a mass balance amount.
Earlier estimates of spigot water were ~90 L/s, which is consistent with transient model produced water applying the 50/50 rule at 88.3 L/s.
Rainfall recharge in the transient simulation is much lower than the steady state simulation. This is because the steady state simulation included the additional water (as an increase in recharge rate) to compensate for spigot water. The transient simulation instead applied consolidation water production to achieve an estimate of spigot water.
The total “in” and “out” budget for the transient simulation is higher than that of the steady state simulation. This is not an error between the models, but rather a reflection of the changed recharge conditions developed between the two, and the manner in which the water budget is reported (which double accounts for water in the transient simulation).
The predicted drain flow reported from the El. 826 m blanket drain is 75.3 L/s, compared with measured at 70 L/s, and the remnants of the Principal Foundation Drain are predicted to produce 4.0 L/s compared with measured 2.7 L/s. Both of these are noted improvements on the steady state simulation which slightly over-predicted each of these flows.
This transient water budget does not “balance” because of the transient stresses being applied. The imbalance of +15.4 L/s is consistent with expectations that the system is gaining water in the overall schedule because of the increase in sand and slimes deposition, although this imbalance amount would be expected to vary depending on the time of data extraction from the model. Most importantly, this imbalance is not predicting a reduction in storage, which would be conceptually incorrect.
G3.4.3.6 Conceptual Representation in the Numerical Environment
Review of end of model phreatic conditions and unsaturated isopach of the tailings representative of the November, 2015 conditions are provided on Figure G 3-19 and Figure G 3-20 and are used as a final check of the model’s ability to represent the conceptual understanding of the TSF.

Fundão Tailings Dam Review Panel
Report on the Immediate Causes of the Failure of the Fundão DamAppendix G - Seepage Modeling
August 25, 2016 Page G-51
Figure G 3-19 Transient model phreatic conditions, November, 2015 The process of transient calibration has shown good predictive quality of the model in presenting phreatic conditions. Key elements of the model results apparent on Figure G 3-19 include:
At the toe of the dam, contours wrap around the remnants of the Principal Foundation Drain and the Auxiliary Drain. This distortion of the phreatic conditions was apparent in the piezometric records from before the construction of the El. 826 m blanket drain.
The phreatic surface “flattens” between the El. 825 m and El. 830 m contours, a direct response to the effect of the El. 826 m blanket.
Conditions on the left abutment setback are more complicated, with effects from the left abutment drain (connected to the El. 860 m blanket drain) evident, and generally lower hydraulic gradients in the area between the downstream extent of the El. 860 m blanket drain and Grota da Vale (pond constant head ~El. 860 m).

Fundão Tailings Dam Review Panel
Report on the Immediate Causes of the Failure of the Fundão DamAppendix G - Seepage Modeling
August 25, 2016 Page G-52
Figure G 3-20 Transient model unsaturated isopach map, November, 2015
The unsaturated isopach (Figure G 3-20) provides an indication of areas of limited unsaturated thickness, or areas where emergent seepage is predicted to occur. Of note from these results, there are four zones of <5 m unsaturated thickness:
Seepage is predicted by the model at the toe of the dam near the exit point of the Principal Foundation Drain.
Shallow unsaturated conditions are predicted on the right abutment (Figure G 3-11). This area also had seepage in October of 2015, as reported in Samarco routine reporting.
On the left abutment abutting foundation material in the area of the left abutment rock fill trench (Appendix B).
Within the area of the setback and over the El. 860 m blanket drain near the toe of the left abutment reinforcement berm.

Fundão Tailings Dam Review Panel
Report on the Immediate Causes of the Failure of the Fundão DamAppendix G - Seepage Modeling
August 25, 2016 Page G-53
G3.4.3.7 Transient Calibration Summary
A brief summary of the transient calibration is provided:
Transient predicted heads for piezometers above El. 830 m are replicated in trend and head to the measured hydrograph data. Statistical assessment of these records support the visual calibration performance observed in the hydrographs.
The model predicts transient drain flow from the two main drains of the El. 826 m blanket drain and the Principal Foundation Drain with good correlation to actual records, although showing cyclicity in the predicted record.
The water balance presents plausible water in and water out components, with a net positive balance apparent at the end of the simulation consistent with expectations from construction activity across the facility.
Phreatic conditions are consistent with measured data, and the model predicts areas of potential or actual emergent seepage which can be correlated to a number of observed incidents throughout 2015.
Acceptable statistical calibration performance and sound translation of the conceptual setting into the numerical environment are both considered achieved in this model.
G3.5 Transient Model Results
Model results are not able to be practically shown for the entire model run. Results presented in earlier discussions are generally extracted from the end of the model and representative of November, 2015 conditions. Similar results can be assessed for selected dates, for:
transient head and pressure data for any node;
sectioned phreatic conditions and contoured pressure data, for selected dates and stages of TSF construction;
contoured phreatic conditions for the TSF; and
drain flow and estimates of emergent seepage from the dam face.
Water balance, piezometry and hydrographs, drain flow records, and phreatic conditions have each been presented throughout Section G3.4.3. The following sections provide a range of visual results for the left and right abutment, and where practical, for the entire TSF. Figure G 3-21 provides a reference for sections presented in the following report sections. As well as sections cut through the piezometer lines, one longitudinal section has been developed that strikes across the dam.

Fundão Tailings Dam Review Panel
Report on the Immediate Causes of the Failure of the Fundão DamAppendix G - Seepage Modeling
August 25, 2016 Page G-54
Figure G 3-21 Section location reference map

Fundão Tailings Dam Review Panel
Report on the Immediate Causes of the Failure of the Fundão DamAppendix G - Seepage Modeling
August 25, 2016 Page G-55
G3.5.1 Left Abutment Discussion
Figure G 3-22 shows model predicted conditions for time 1800 days (November, 2015) through left abutment Sections 01, 02 and 03. Slimes, drains and compacted sands are color differentiated in the sections:
The phreatic surface lies very close to the dam face from behind the dam crest to mid-way along the El. 860 m blanket drain. This high level of saturation appears to be sustained across the area where there are consistent slimes above El. 840 m.
Downstream of the El. 860 m blanket drain, phreatic gradients reduce, a function of both diminishing drain effects, the constant head of Grota da Vale being similar in elevation and close to the El. 860 m blanket drain, and the reduced recharge away from spigotting activity and active ponds.
The slimes still impose influence on the phreatic condition, holding the phreatic surface above their lateral location in section. Sands below these slimes are indicating downward vertical gradients, which are interpreted to occur as a result of the locally flattened gradients, reduced recharge, completed consolidation processes and increased distance from spigotting locations. The effects of the El. 826 blanket drain may also be influencing these conditions.
Section 02 is located parallel to Section 01. Similar conditions to those of Section 01 are apparent, although the pressure anomaly beneath the dam crest has significantly diminished. Slimes profiles are very similar to Section 01, and although the drain extends in length, most of the sand beneath is not in saturated contact with the drain. The effects of the El. 826 m blanket drain may be becoming more prominent and are starting to steepen the gradient between the two drainage blankets.
Section 03 has a similar profile, although it is noted that the model predicts phreatic conditions beneath the El. 860 m blanket drain to further lower, likely in response to steepening flow gradients towards the El. 826 m blanket drain which is now physically closer.
Figure G 3-23 provides a plan layout of head conditions for El. 850 m at time 1800 days, which slice horizontally through the approximate upper contact with the main body of slimes (shown as blue). This section also lies between the drainage blanket elevations of El. 826 m and El. 860 m.
Of note is the differing hydraulic gradients apparent between the left abutment and the right abutment. On the left abutment the phreatic surface grades about 10 m over 250 m between Grota da Vale and the eastern area of the El. 826 m blanket drain. On the right abutment, gradients are much steeper, around 30 m over 125 m of distance, toward the western area of the drain. The gentle arc of the 850 m contour has a moderate skew toward the left abutment, which serves to reduce these gradients, and by consequence they are likely to result in slower groundwater velocities.

Fundão Tailings Dam Review Panel
Report on the Immediate Causes of the Failure of the Fundão DamAppendix G - Seepage Modeling
August 25, 2016 Page G-56
Figure G 3-22 Left abutment water table and head contours Sections 01, 02 and 03, t=1800 days

Fundão Tailings Dam Review Panel
Report on the Immediate Causes of the Failure of the Fundão DamAppendix G - Seepage Modeling
August 25, 2016 Page G-57
Figure G 3-23 Facility head conditions for model layer El. 850 m
The Longitudinal Section starts on the left abutment, crosses the El. 860 m blanket drain, and rotates around the setback to then cross over the El. 826 m blanket drain and meet the right abutment (Figure G 3-24). Three features of the phreatic surface are prominent in this section:
On the left abutment, the hydraulic gradient is relatively flat, and heads are raised to be in contact with the drain, perched atop the upper sequence of slimes;
On the right abutment, without this slimes perching effect, the phreatic surface is drawn toward the drain with steeper gradients from the right abutment and behind the drain.
Between these two zones, the phreatic surface grades from ~El. 852 m to ~El. 838 m (~14 m decline) over 80 m of section. This is not a gentle grade but a sharp change in conditions from those where the slimes exist.
This indicates that the El. 826 m blanket drain does have influence on phreatic conditions toward the left abutment, but only after the extent of the slimes is passed. Further east, the slimes dominate the phreatic surface, with heightened and “plateaued” phreatic conditions and more sluggish lateral gradients.

Fundão Tailings Dam Review Panel
Report on the Immediate Causes of the Failure of the Fundão DamAppendix G - Seepage Modeling
August 25, 2016 Page G-58
Figure G 3-24 Facility head conditions, Longitudinal Section, looking upstream
G3.5.2 Right Abutment Discussion
Figure G 3-25 shows model predicted conditions for time 1800 days (November, 2015) through right abutment sections AA, BB and DD. Slimes, drains and compacted sands are color differentiated in the sections.
Section AA is located adjacent to but does not intersect the El. 826 m blanket drain. There are slimes at depth deposited in the valley low point. Phreatic conditions close to the abutment are heightened and appear compressed between the basement high and the face of the dam. Model predictions indicate low amounts of seepage at the dam face at about El. 860 m, which coincides with this basement high.
Section BB crosses the start of the El. 826 m blanket drain and extends through the Starter Dam. Slimes are located behind the dam in the basement depression, with an upper elevation of about El. 825 m, close to that of the blanket drain. Phreatic conditions reduce across the drain, with minor perching effects from the slimes possibly occurring above the slimes (the gradient appears to steepen mildly once it crosses the slimes). Over the blanket the effect of the drain is prominent, and effective in controlling phreatic conditions below the dam face.
Section DD shows a similar response to that of Section BB, with the drain becoming the more prominent feature affecting phreatic conditions. Slimes effects, although far more moderate than those of the left abutment, are weakly apparent, extinguishing behind and across the area where their presence ends.

Fundão Tailings Dam Review Panel
Report on the Immediate Causes of the Failure of the Fundão DamAppendix G - Seepage Modeling
August 25, 2016 Page G-59
Figure G 3-25 Right abutment water table and head contours sections AA, BB and DD, t=1800 days

Fundão Tailings Dam Review Panel
Report on the Immediate Causes of the Failure of the Fundão DamAppendix G - Seepage Modeling
August 25, 2016 Page G-60
The influence of the El. 826 m blanket drain on the right abutment has already been discussed in Section G3.5.1.
G3.5.3 Flow Paths and Particle Seeds
Particle seeds and flow paths are a useful visual tool to assess groundwater movement trends.
Figure G 3-26 provides forward and back tracking of particle seeds placed on the El. 860 m blanket. Forward tracking (left image) shows the migration of groundwater as the phreatic surface falls below the downstream section of the drain, and conditions come under increasing influence from the El. 826 m blanket drain, where the seeds ultimately report to. Back-tracking of seeds (left image) shows relatively lineal flow gradients from the dam crest toward the drain, although the flow wraps around the lower area of the setback near Grota da Vale where gradients are relatively flat.
Figure G 3-26 Flow paths from particle seeds on the El. 860 m blanket drain, forward tracking (l) and back tracking (r)
Figure G 3-27 further explores the detail of groundwater movement with more focus on the period leading up to the failure event in November, 2015. This image is time constrained and shows particle paths from seeds placed on tailings sand 3 months before the failure event. Observations include:
On the left abutment, groundwater flow is clearly toward the El. 860 m blanket drain, with longest pathways apparent from downstream of the dam crest. This is consistent with intersection of flow with the upper tiers of this drain, falling under steep gradient within high permeability material. The longer pathways occur along most of the drain, shorting in the area of the setback and where phreatic conditions begin to fall under the influence of flow toward the El. 826 m blanket drain.

Fundão Tailings Dam Review Panel
Report on the Immediate Causes of the Failure of the Fundão DamAppendix G - Seepage Modeling
August 25, 2016 Page G-61
On the right abutment, flow vectors are most apparent adjacent to the construction activity for the drain construction and behind the El. 826 m blanket drain. This is consistent with the condition that the seeds placed behind the active construction activity are furthest from the drain and are experiencing flatter hydraulic gradients, resulting in shorter travel distances. Seeds placed closer to the dam crest and the drain fall under the steeper gradients directly toward the blanket.
Figure G 3-27 Particle tacking, 90-day travel (day 1710 to 1800), seed placement upper tailings sand

Fundão Tailings Dam Review Panel
Report on the Immediate Causes of the Failure of the Fundão DamAppendix G - Seepage Modeling
August 25, 2016 Page G-62
G3.6 Ph2 Model – Scenario Run: No Slimes “Tongues”, Left Abutment
A variation of the transient model was constructed and run to predict phreatic conditions at time 1800 days (November, 2015), representing a scenario of no slimes “tongues” on the left abutment. The model was modified such that slimes within 200 m lateral distance from the dam were changed to tailings sand material properties. This conforms to the original design intent that a minimum beach distance of 200 m is maintained (Section G2.2.4).
No other elements of the model were changed. The model was run under transient conditions to the same schedule as the calibrated model, with end of model water balance and head and pressure conditions reviewed. A comparison of the calibrated and scenario model using predicted phreatic conditions is provided on Figure G 3-28 along the longitudinal section.
Figure G 3-28 Longitudinal Section with water table from calibrated model (upper), Scenario 1 (lower), t=1800 Days
The differences are subtle but the left abutment phreatic condition is predicted to be lower in the scenario simulation (no slimes) than conditions predicted in the Ph1 calibrated model. The phreatic surface in the scenario simulation does not meet the El. 860 m blanket drain along this section, and the hydraulic gradient toward the El. 826 m blanket drain is a less abrupt feature. In the calibrated model, however, the phreatic surface is predicted to intersect the El. 860 m blanket drain in this transect.
Conditions over the El. 826 m blanket drain remain largely unchanged in both simulations.

Fundão Tailings Dam Review Panel
Report on the Immediate Causes of the Failure of the Fundão DamAppendix G - Seepage Modeling
August 25, 2016 Page G-63
G4 SUMMARY OF FINDINGS
Ph0 Design Concept Predictive Modeling:
The concept design under normal conditions, and with up to 2x orders of magnitude reduction in drain permeability, maintains a drained sand stockpile as per design intent. The drain designs were therefore capable of conveying and discharging TSF seepage.
The Principal Foundation Drain is the most critical element of the concept design. Once this degrades in performance, the abutment drains (under similar degrading conditions) do not have the ability to transmit water at the rate required, resulting in increased saturation and phreatic conditions, which encroach on the Dike 1 downstream face.
The geometry of the facility is important. The further upstream from the crest of Dike 1, the wider the physical dimensions of the facility, and hence the greater the contribution of lateral through flow toward Fundão Dam.
Analytical assessment of the Principal Foundation Drain estimates maximum drain capacity of 259 L/s in an unpressurized system, and 2,300 L/s for a pressurized system with a hydraulic gradient of 1:10. At these rates, flow is likely to be turbulent, or at least non-lineal. Lower normal operating rates are expected to produce lineal to non-lineal flow.
The three main construction materials of slimes, sand and drains span several orders of magnitude permeability. As such, the contrast in their hydraulic properties dominates the seepage performance of the facility more so than subtle variation of their individual values. Because of this, understanding and representing key boundary condition stresses of pond location and recharge become more critical.
Ph1 TSF As-Built Modeling:
Acceptable steady state and transient model calibration has been achieved, with good representation of piezometric conditions and drain performance, and reproduction of the conceptual understanding of as-built conditions in the numerical environment.
The El. 826 m blanket drain is the most dominant feature of the structure, conveying the majority of water, and exerting strong phreatic influence to the right abutment, with weakening influence from increasing distance and elevation from the drain. At the area of the setback, the El. 826 m blanket drain is predicted to draw flow from the area of the left abutment; however, this is limited due to the distance of travel, the presence of slimes perching phreatic conditions in the area of the left abutment and the setback, and the lowered hydraulic gradients down gradient of the El. 860 m blanket drain and the Grota da Vale.
The slimes on the left abutment appear to be perching phreatic conditions and plateauing heads in the lower area of the El. 860 m blanket drain. Scenario 1 was conducted to test this theory and confirmed phreatic conditions on the left abutment to be predicted as lower if the slimes “tongues” were not present beneath the dam.

Fundão Tailings Dam Review Panel
Report on the Immediate Causes of the Failure of the Fundão DamAppendix G - Seepage Modeling
August 25, 2016 Page G-64
The phreatic surface on the left abutment intersects the El. 860 m blanket drain but appears to only skew the phreatic conditions and direction of flow, and does not serve to remove a large amount of water. The conditions in the lower section of the drain experience lower hydraulic gradients, and this area, particularly where the phreatic surface lies beneath the drain, probably represents the area where gradients start to come under the influence of the El. 826 m blanket drain.
The right abutment appears well drained with steep gradients reporting to the El. 826 m blanket drain.