appendix k .. capture zone tests and analysis · 2018-06-20 · capture zone tests and analysis 1...
TRANSCRIPT
Appendix K .. "Capture Zone Tests and Analysis
DRAFT REPORT
Middletown Airfield SiteMiddletown, Pennsylvania
Capture Zone Testsand Analysis
1 July 1996
ERM Program Management Company855 Springdale Drive
Exton, Pennsylvania 19341
ERM,
SeetiorcAppendix K-TOC „ =" ;;;^ -^ „; J ;!_ ";;.;: ;_.",---- " - " Page: iofiiiDate: ;. July 1,1996 "''" ' T ...... .,.._ ._.. _...._.„,. _. ... RevisionNo.: 0
TABLE OF CONTENTS ~ ^ -
BXECLTZ7VE SUMMARY -
K J - INTRODUCTION AND PROJECT OBJECTIVES 1
KJ..1 INTRODUCTION 1
K.1.2 _ PROJECT OBJECTIVES 1
KJ£ SCOPEOFWORK 2
K.2 SITE BACKGROUND 4
K.2.1 JUA WATER SYSTEM OPERATIONS 4
K.3 CAPTURE ZONE TESTS 6
K.3.1 GENERAL TEST PROCEDURES 6
K.3.2 AMBIENT MONITORING - 7K.3.2.1 ~ '-Eastern Area 8K.3.2.2 .-.. Central Area " " ~ " " " 9K.3.2.3 ~ Western Area 9K.3.2.4- .-. North Base Landfill Area . 9
K.3.3 AQUIFERTEST - 10K.3.3.1 . Easterri~Area : -, .""-""." . . " -"" 10K.3.3.2 :- Central Area - _ ." " 10K.3.3.3 '""-' Western Area , 11.K.3.3 A ~ North Base Landfill Area 12
KA PUMPING TEST-ANALYSIS 13
KA.1 GENERAL OBSERVATIONS 13.
K.4,2 DATAANALYSIS " ' 14K.4.2.1 ... Results for MID-Q4 -.:~ ::~." ...... _:::..... . _ . . . . . - 16K.4.2.2 - Results for HIA-2. . ..,. ...._.,_... --.:-,-,-_., ,-. = - .._.... 16K.4.2.3 -Results for HIA-13 . 17KA.2A '-ResultsforHIA-9 - .. .-_ . _. ..,.. ":., ./.:.l, : 18
Section:Appendix K-TOC . - - = - .Date: July 1,1996 -—— -- Revision No.: 0
K.4.23 Comparison of Results with 1961 USGS Report 19K.4.2.6 Summary 21
CAPTURE ZONE ANALYSIS 22
K3.1 CONCEPTUAL MODEL - 22
K.5.2 MODEL SELECTION " 23
MODEL SETUP AND INPUT PARAMETERS 24K-5.3.1 Model Input Parameters 24
K.5.4 MODEL CALIBRATION 25
K.5£ SENSITIVITY ANALYSIS 26
K.5.6 MODEL SIMULATION AND DISCUSSION 27K.5,6.1 Eastern Area 28K.5.6.2 Central Area 28K.5.6.3 Western Area 29K.5.6,4 North Base Landfill 29
K.6 CONCLUSIONS AND RECOMMENDATIONS 30K.6.1 - Capture Zone Test 30K..6.2 Capture Zone Analysis . _ 30
K.7 REFERENCES 32
LIST OF FIGURESFOLLOWING PAGE
K-l Site Location Map 1K-2 Capture Zone Test Location Areas 1K-3 Approximate HIA Production
Well Locations 4K-4 Ambient Water Level Monitoring
Eastern Area 8K-5 Ambient Water Level Monitoring
Central Area 9
Secfion:AppendixK-TOC - '.''"-.' ; ! _ _ _ _ _ . , ... •_:.:,._;__ : , '• •', . Page: iiiofiiiDate: July 1,1996 '_'_ \. ""'= " . '" ' "~'_~ . RevisionNo.: 0
K-6 Ambient Water Level MonitoringWestern Area 9
K~7 . Ambient Water Level MonitoringNorth Base Landfill Area 9
K-8 Capture Zone Test at Eastern Area 10K-9 ~Capture Zone Test at Central Area 11K-10 Capture Zone Test at Western Area 11K-ll Capture Zone Test at NBL Area 12K-12 Sentinel Wells Near MID-04 15K-13 Capture Zone Wells Near BOA-2 15K-14 :_Capture Zone Wells NearHIA~13 15K-15 Capture Zone Wells Near HIA-9 . _ - 15K-16 ^ Simulated Water Table from the Calibrated Model 26K-17 __ Scenario 1 (6 inches/yr recharge) 27K-18 Scenafio~l(12 inches/yr recharge) 27K-19 Scenario 1 (18 inches/yr recharge) 27K~2Q Scenario 2 Capture Zones of Production Wells 27K-21 —- Scenario 3 Capture Zones of Production Wells 27K-22 Scenario 4 Capture Zones of Production Wells -
Average Annual Pumping Conditions 28
LIST OF TABLES . _ _ FOLLOWING PAGE
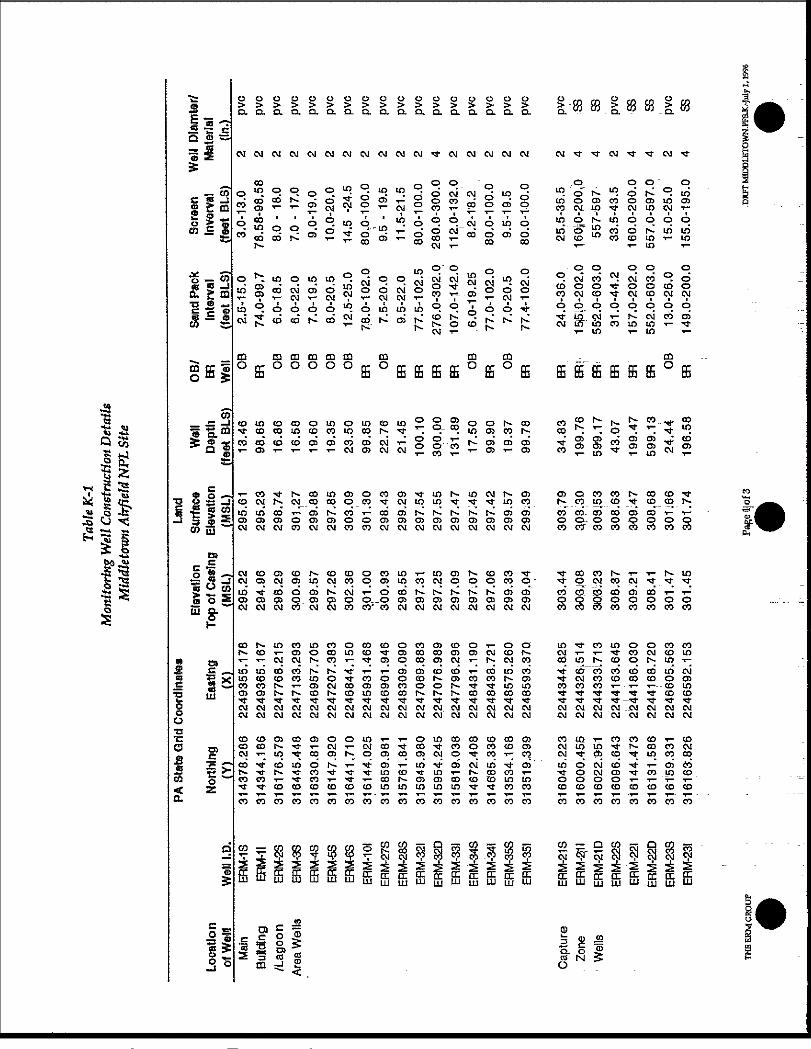
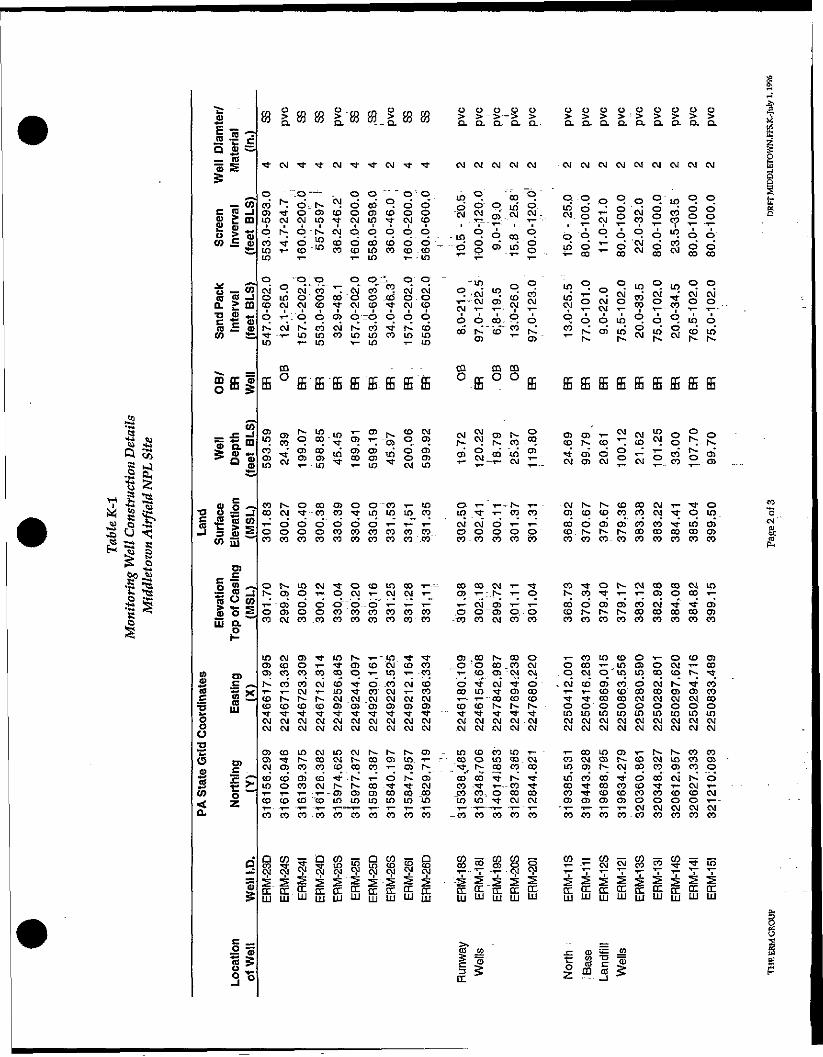
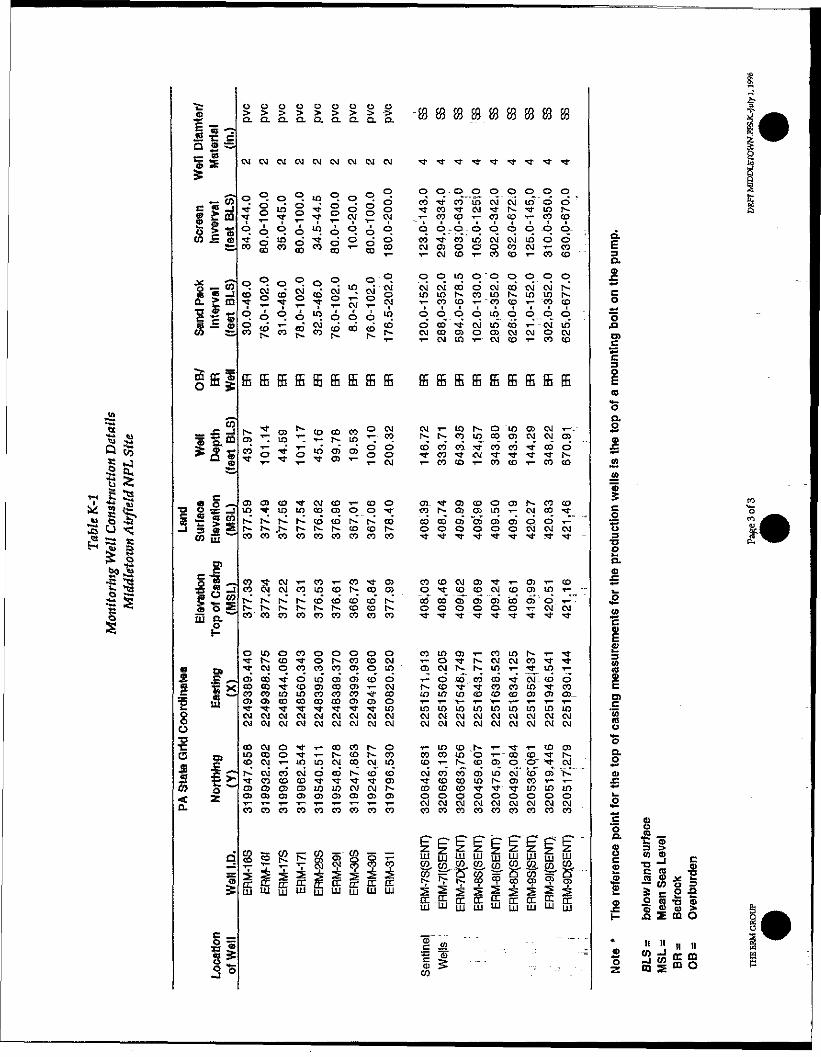
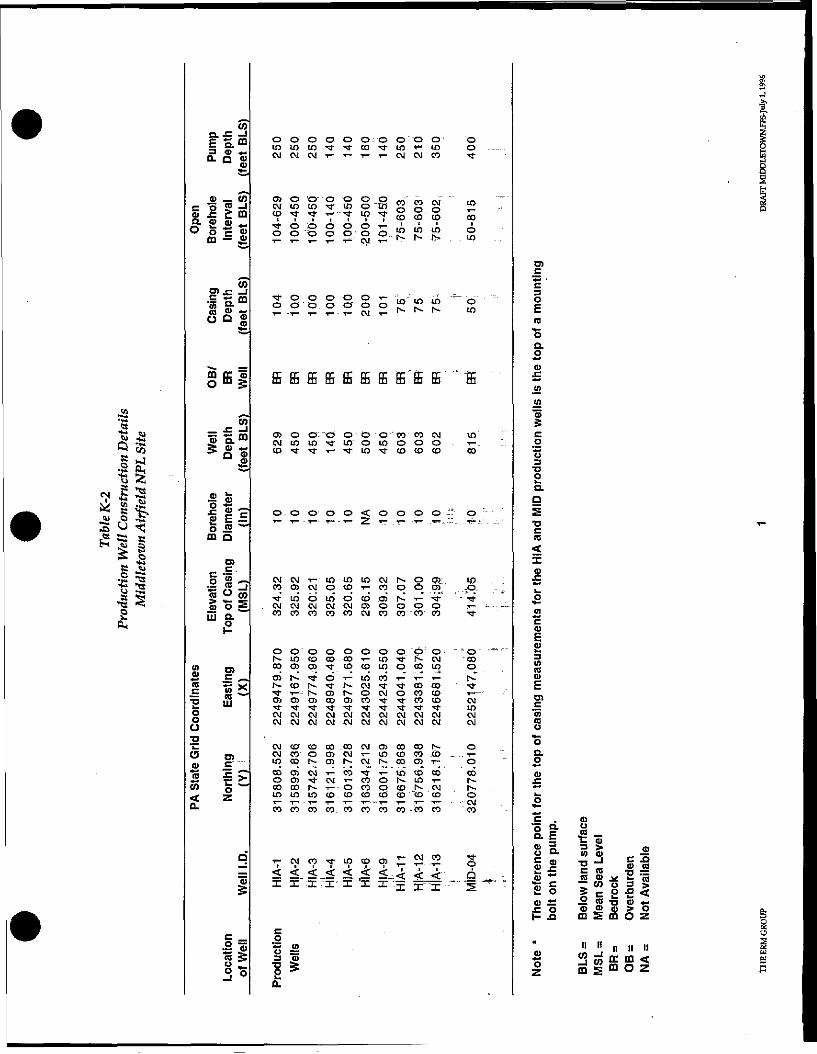
K-l ..-"__ Monitoring Well Construction Details 3K-2 Production Well Construction Details 3K-3 Operation of HIA Production Wells During
Ambient Monitoring 8K-4 - Observed Capture Zone Test Drawdown 15K-5 HIA Production Well Data 25K-6 Model Input Parameters 25K-7 . ...Calibrated Model Results 26K-8 Model Scenarios for Capture Zone Analysis 27
ATTACHMENTS : _
X.1 - - Arithmetic Pumping Test Data PlotsK.2 - Semilog Data Plots
Section: :"". K-ES~ .• •—-—'-•'-"-^—- " • • - - - - - - - - - pag&; i of 32Date: July 1,1996 _..__..„..... „ _ _ . _ . . . . . .__.._ , "! ._.._...___.. RevisionNo.: 0
EXECUTIVE SUMMARY : _
Aquifer tests wereconducted on.HIA production wells HIA-2, HIA-9, andHIA.-13.and Middletown Borough Authority well MOD-04 to evaluate theaquifer characteristics in the vicinity of these wells. Each aquifer testconsisted of a 72-hour (nominal) pumping or recovery test. Constant-ratepumping tests were conducted on production wells HIA-2 and HIA-9located in the Eastern and Western areas of the Site, respectively. Recoverytests were conducted on production wells HIA-13 located in the Centralarea of the site and MID-04 in the North Base Landfill Area.
Prior to conducting the aquifer tests, ambient monitoring of water levelsand barometric pressure was performed, on two background wells in eachof the four areas, to .evaluate fluctuations in the water level under normalconditions. The ambient fluctuations were on the order of 0.5 feet. Noneof the wells exhibited a response to a rainfall event that occurred duringthe ambient monitoring-period, suggesting that a rainfall event would notsignificantly impact the pumping tests. Several wells did respond topumping of the production wells, but the change in water level wassufficiently larger than the ambient fluctuation (0.5 feet) that differentiatingbetween the two was. not an issue in the data analysis.
The aquifer test results, demonstrated that the transmissivity of the bedrockaquifer increased moving from the North Base Landfill toward theIndustrial Area and from east to west within the Industrial Area. TheWestern portion of the Industrial Area exhibited transmissivity valuesapproximately 25 times greater than the North Base Landfill Area. This islikely the result of increased fracturing in the bedrock in the Western Area;It was expected that anisotropic conditions would be observed (i.e., greaterdrawdown would he observed in the direction of bedrock strike versus thedirection of dip), however, this was not observed in the test results. Theresponse to pumping in wells along strike was; similar to the responseobserved in wells downdip of the pumping well. This may be the result ofthe spacing and location of observation wells such that they did notintersect the fractures being affected by the pumping.
The results of the capture zone tests were used in the development of aregional ground water flow model to evaluate capture zones for eachproductiorLwell. The analytical element ground water modelTWODANTM was used to'delineate the. capture zones for each well. Themodel calibration process was accomplished by adjusting the infiltrationrate until the simulated water table elevations matched the measured
THE ERM GROUP MJDDLETOWN-FFS.0200S.O&-jLily lr
Section; K-ES . -. ... .; Page: 2 of 32Date: July 1,1996 .. . . . " " . _ . "..'~ I" KeyisionNp.: 0
elevations. An average annual infiltration rate of 12 inches/year was usedas representative of field conditions in the model calibration and __:simulation of model scenarios. Once the model was calibrated, it was usedto simulate four different pumping scenarios, ScenariosT.,2, and 3 werebased on typical HIA well configurations and average daily pumping ratesfor the active HIA production wells and average annual pumping rates forthe Middletown Borough Authority wells. Scenario 4 simulated theaverage annual pumping rates for all HIA wells and the five MiddletownBorough Authority wells. The capture zones for each of the four scenarioswere calculated for a 16 year time period.
In all four Scenarios, the HIA production wells receive water from theNorth and Northeast Therefore, contaminant sources located to the Northmay impact the HIA production wells. Well MID-04 draws water from thenorthwest and the radius of influence extends far enough to the West toinfluence leachate generated from the North Base'Landfill. Both Scenarios1 and 2 have HIA-13 as the lead well which is the most.commonconfiguration. Scenario 3 has HIA-12 as the lead well. In each of thesethree scenarios, the radius of influence extends south to the SusquehannaRiver in the Western and Central Areas and to just north of the Runway inthe Eastern Area. The extent of the capture zone depicted in thesescenarios are based on average daily pumping rates held constant for 16years and do not reflect the actual "on-demand" operation of the HIAsystem. The capture zone simulated in Scenario 4 is believed to be morerepresentative of site conditions because it was based on average annualpump rates. The area of influence simulated in Scenario 4 does not extendsouth of the Runway in the Western and Central Areas or south of Building100 and the road off of Airport Drive that serves as the northern boundaryof the PAANG compound in the Eastern Area. Therefore, contaminantsdetected south of the HIA-2 area will likely migrate to the SusquehannaRiver.
THEESMGHQUP MIDDLETOWN-FFS.020053B Iuly 1,1996
Section: Appendix K.1 ' Page: 1 of 32Date: July 1,1996 !, , , „ "_:-..':.. : " RevisionNo.: 0
K.1 INTRODUCIlOtfAND PROJECT OBJECTIVES
K.1.1 -INTRODUCTION ': : ___....".."
The Capture Zone Aquifer Tests and Analysis were a part of theSupplemental Studies Investigation (SSI) conducted at the MiddletownAirfield NPL Site, Pennsylvania. _These studies were required by theDecember 1990 Record o£ Decision as clarified by April 1992 Explanationof Significant Differences (ESD). This work was conducted underContract Number DACW 45-93-D-0017, with the USAGE Omaha District,Delivery Order Numbers 005,006,0~0~7, and 008.
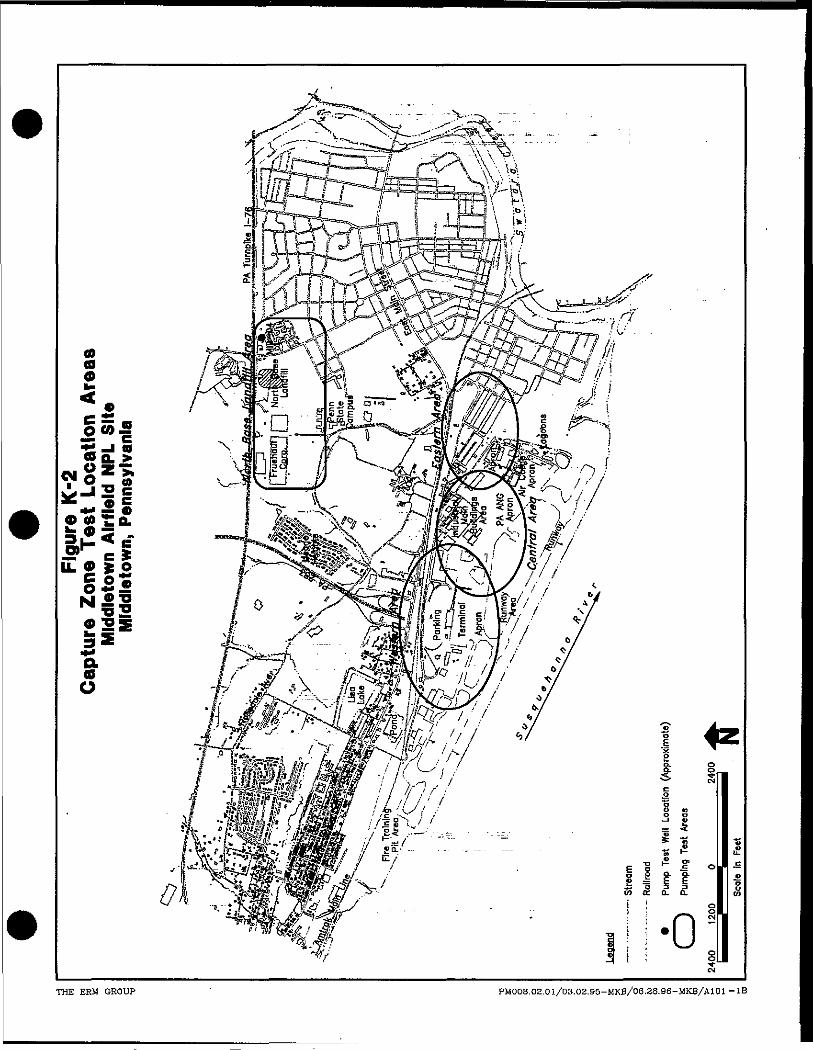
The Middletown Airfield NPL Site (Site)/formerly the Olmsted Air ForceBase, is located in Dauphin County, Pennsylvania, approximately 8 milessoutheast of Harrlsburg (Figure K-l). the former Air Force field andmany of the Air Force buildings are now owned by the PennsylvaniaDepartment of Transportation and operated Sy the HarrisburgInternational Airport (HIA), several small private manufacturingcompanies, and the Air National Guard. Ten production wells (HIA-1,2,3,4,5,6,9,11,12, and 13) are operated for water supply at the Site. Oneadditional well, HIA-14, is used exclusively for HVAC purposes. Thesewells are groupedas[followed (see Figure K-2):• Eastern HIA wells (HIA 1 through 5)7 ~
• Central HIA wells (HIA-13);
• Western HIA wells (HIA- 6,-9,11 and 12)
An additional public water supply well (MID-04) is operated in thevicinity of the North Base Landfill by Middletown Borough Authority(also shown on Figure K-2). A work plan was prepared by ERM andreviewed and approved by EP A and US ACE.
K.2.2 _ -PROJECT OBJECTIVES
Potential migration of contamination from the former North Base Landfilland from the Industrial Area is a concern for the Middletown BoroughAuthority production well MID-04, arid for the HIA production wells,respectively. The intent of the ESD was to protect the water supply wellMID-04 by installing sentinel wells to warn the Borough shouldcontaminants move toward MID-04 from the North Base Landfill. Awellhead protection study for the Middletown wells was performed by
THE ERM GROUP MTODLETOWN-FES.tEQO&OS-July 1,1996
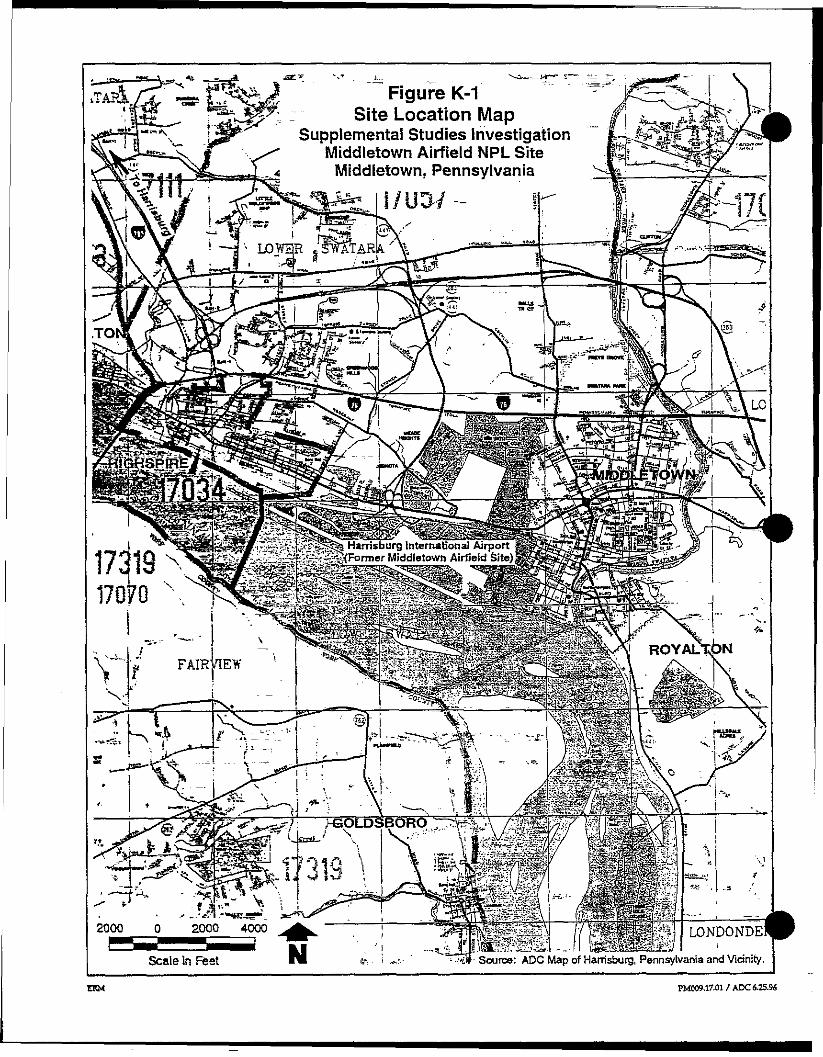
Figure K-1Site Location Map
Supplemental Studies InvestigationMiddletown Airfield NPL SiteMiddletown, Pennsylvania
IQ3Bjs fe Harrisburg International Airportff i3(F°rmer Middletown Airfield Site)t liillli - 3.- -«,
!8§®&*i17313 N17070
ROYALTON* FAIRVIEW
. — Sa',-« % ! |
LONDONDE
Scale In Feet HI ^ t *• "'T:' Source: ADC Map of Harrisburg, Pennsylvania and Vicinity.
ERM PM009.17.01 / ADC 6.25.9S
COCO<D
«.•+•" J <0CO Q. >
2 c
_ C
§JiKl ® "°
aaO
-P •= g1 o £I I - -g £ E E5> K O. Q.
•0g
THE ERM GROUP " PMOOB.02.01/03.02,95-MKB/06,3S.96-MKB/A101 -IB"
Section: Appendix K.I Page: 2 of 32Date: 111171,1996 '-' ' _ r .-. - Envision No.: _ 0
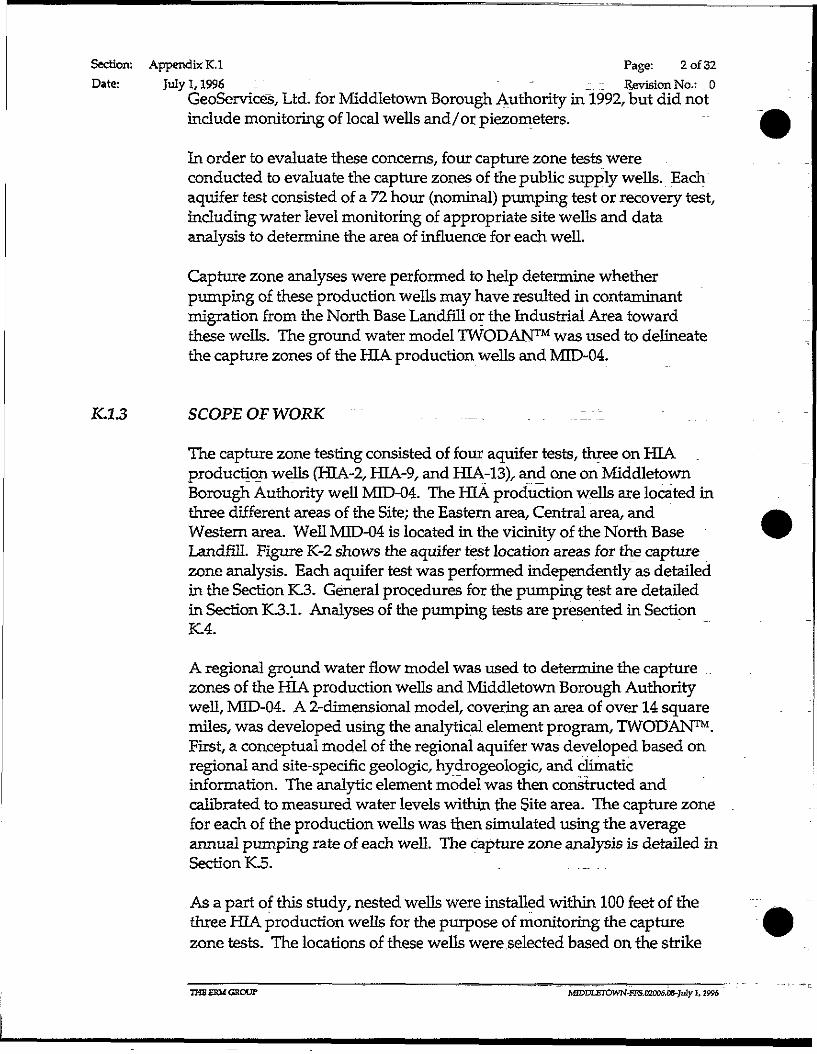
GeoServices, Ltd. for Middletown Borough Authority in 1992, but did notinclude monitoring of local wells and / or piezometers.
In order to evaluate these concerns, four capture zone tests wereconducted to evaluate the capture zones of the public supply wells. Eachaquifer test consisted of a 72 hour (nominal) pumping test or recovery test,including water level monitoring of appropriate site wells and dataanalysis to determine the area of influence for each well.
Capture zone analyses were performed to help determine whetherpumping of these production wells may have resulted in contaminantmigration from the North Base Landfill or the Industrial Area towardthese wells. The ground water model TWODAN™ was used to delineatethe capture zones of the HIA production wells and MID-04.
KJL3 SCOPE OF WORK .._. _i_ :
The capture zone testing consisted of four aquifer tests, three on HIAproduction wells (HIA-2, HIA-9, and HIA-13), and one on MiddletownBorough Authority well MID-04. The HIA production wells are located inthree different areas of the Site; the Eastern area, Central area, andWestern area. Well MID-04 is located in the vicinity of the North BaseLandfill. Figure K-2 shows the aquifer test location areas for the capturezone analysis. Each aquifer test was performed independently as detailedin the Section K3. General procedures for the pumping test are detailedin Section K3.1. Analyses of the pumping tests are presented in SectionK.4.
A regional ground water flow model was used to determine the capture .zones of the HIA production wells and Middletown Borough Authoritywell, MID-04. A 2-dimensional model, covering an area of over 14 squaremiles, was developed using the analytical element program, TWODAN™.First, a conceptual model of the regional aquifer was developed based onregional and site-specific geologic, hydrogeologic, and climaticinformation. The analytic element model was then constructed andcalibrated to measured water levels within the Site area. The capture zonefor each of the production wells was then simulated using the averageannual pumping rate of each well. The capture zone analysis is detailed inSectionK.5. _ ...
As a part of this study, nested wells were installed within 100 feet of thethree HIA production wells for the purpose of monitoring the capturezone tests. The locations of these wells were selected based on the strike
THE ERM GROUP MIDDLErOWN-FPS.02006 »-July 1,1996
Section: Appendix K.I ' V - Page: 3 of 32Date: . July 1,1996~~~ -——---— -------- --- - •_-";" " , - - - . . . RevisionNo_. 0
and dip of the bedrock-in an attempt to observe anisotropy within theaquifer during the tests. The final well locations were determined by thelocation of underground utilities and the available space to drill with theleast impact to vehicular traffic. These capture zone well nests weredesignated ERM-21, EKM-22, ERM-23, ERM-24, ERM-25, and ERM-26.Each well nest consists of three wells-referenced as shallow (S), .intermediate (I), and deep (D). The shallow wells were completed in theoverburden with a screened interval of 10 to 20 feet below ground surface(bgs). The intermediate wells were completed in bedrock with a screenedinterval of 160 to '2DO feet bgs, and the deep wells were typically screenedfrom 555 to 595- feet bgs. Tables K-l and K-2 .summarize the constructioninformation for "the site monitoring wells and the production wells,respectively.
The sentinel wells installed in the vicinity of MID-04 served as monitoringwells for this aquifer test, the sentinel well nests (ERM-7, ERM-8, andERM-9) each consisted of shallow (150 ft bgs), intermediate (350 ft bgs)and deep (670 ft bgs) wells. The'screened interval for the shallow wellswas 20-feet. The intermediate and deep wells have 40 ft screenedintervals. All the sentinel wells were constructed of 4-inch diameter .stainless steel. _ _ ._ ._,.... . . .._ .-.-.,. .,
THEERMGROUP . . ..._ .. . .. . - _-. -^— —-- — - MIDDtETOWN-EFS,02006.QS-July 1,1996
w•*»5 «*j •££O*»«01
ISo ?* *X£*itist2 -* at£ I* 2&•&
w
J? *e1^s §1 I
Hi *?•* p*
S c toI f» ~CQ = <&
•S - a?« « -JQ. £ mT3 * —•-
i .(S O)
3 ®CD [U
C3J
c£o|os_g ui &•o
^ (
*G |Bs
o
O cr>
S iCO o< za.
i*
O O O O O O O O O O O O O O O O O P m m «> > > > > > > > > > > > > > > > > >- f f l f f l >n.a.CLtxcuQ.Q.a.CLao.Q.Q.Q.Q.Q.a. & yy tfj. a
CO —. _ O O _. _, O OOOo «1 9 9 o 9 5 x "5 m. d oTw x w x m. "d" i^. " d i^ °. to
o,, r-sO U 3 X X . r t O O0*^10 o to to 9 -: o O -: -CM « S A! "> «.i
9 o 6 o 6 -10. -6 in to in 9 9 I o o 9 9, 9 9 9 9 9 95 * « « « « r^d^fs^^j^^h: SS-S5ISS25^ " ^ c y T - 1 ^ "^ -r-io T-IO f-
CD CO - CDO r r O Q - DC " tt" tt DC CC a ' ° CCrn tn 03 CD CD tD ffl ED CD
o o o o o o o o
10 •* a> cs o> r* c o e t- i- r t- i- o CD m <s.- ss c o c - T-o CD en o a> CD o o__o c s o r o o r o a i a i d j p o o o o o o o
t-c o r - t o c o i o c o o c o t o o e o o > ( D O i - o oT - T - c y c y t - ^ e o T - ^ o j c s o o o s c y T - r ^ w c o cb in i^ ff> o i*- LO T-t o t r J c o c o r ^ t ^ < > * ' i — - i - o i c s c o i D T - c o i n c o • ^ i a m c o a i o d t n c jt n ( O t o c o t o o - < r « o o t D r ^ a i o 5 e o r ^ o t t - c a « t o e o c 0 o ( »m e > r - T - o > o J c o a ) o > c 3 o o r » - ' ^ - ^ j - m u 5 - co eo eo *- - T- i--- CD inc j o > t ^ . r - - c D r - . t D i o t D c o i ^ p ^ r ^ . c o c o c o c o ^•^^•^•^•^•©to•<rrr^rxr-q-^-'^'^-<*'«r^-Tj-'^--^-Tj"Tj-'£f •* - - r-1 - •* - •*c y o i c v 3 c j c o o j c y o j c y c j c j o j o j c 4 c a c 4 c j C M c J W c j . i M o J c y c jC M O I C M C V I C U C M C M O l O l c a C M O l ' O l O J O i O J C M C V l C J O J C J C V l C M O J C M
CO CO ~" * * CO " "C" " ~ CO t OS Ol CO (D S3 IO tO C) C* C5 C> ~ ~ " T~" ~ij- ^ CO CO CO CO CO CO LA IO tfj if} LO " " ^ CO CO CO CO (O CO CO CO CO CO
c o c o c o o o c o c o c o c o c o c o c o c o o o c o c o c o o o c o c o c o c o c o c o c o c o
^ j S2S^STc5cM^^3(?c5)c?^<vl w ^ C M N ^ o J ^ i ^
s_g 0
£ 5 I 1 § o> «I 2 §> € cL g 5
o >W £
ra to JS. > m13 5J *-C •£ fl)m i cotfi &
fflo71
,« KHJ Mu >mO-«ens ^ &13 £
Sal5 > G £ n tol13^«11^ 5&5 i*ec•Is S? *«cI
Q d) d— 75
U) £,
UI PL.
-S £c 35 CJ
BQ.
_= gg *
o o o p o 0 0 0 0 , 0 0 0 0 0O. O. fv O. o Q. f _ Q CX. Q. Q- O. O.
CM CM cj CM cd C M C M C M C M C M C M O J C M C M
° -° ="~ - ° O " " " O ' O ,« P "« ~P• s_ • CM • • o • * *" • ra •co H o.-r- ^ p to 9 o P -Q o o uj oO J - ^ - O O i ( D O O > ( D O O -H CM fJ oj CMin«c\]in^-cMtfj'*c>|tP , -=7--®:" , \
-ti 0-
o°m,n0 i n d ^ d ' ^ d ^ d dP ro_;°. P . £ c o ' ' - C O < N C O C g c O C O
O1 "O O Oil P O"CO -"lO .-, O lri O P ,n P ._ O P
C M ^ C M C O ^ C N C O ^ O J C M O lftj If) 9 _; " ^O-J "?..:"! -J - Jp w op co P pco p.o ',?,, _: co Xi in — rtT^cox-T;^;^p T-:P o o> p-o o OP A A A O A o A A . A O A P
CM h- CO W 1 . CO •* 1 . CO. o q i n X o X i o q
m - - - CQ CP mto Cu CD Lu CD to CD CD CD ID CO
i n * i - e n _ _ i i r i v n — —u i c o 9 t x i ^ 0 i T ^ c n 9 9 j^ °« r*. eo -^ coN.<oTTco(:vioI a I;-:? 11 5 I- ?|4»al a s a I s 5.sco r^ o co o> o o -co T- in o T . _ . _ _ _ , . _co cy J~ -- co co d" 10 in LO co 10 * T- co co 02 co co co co CM *?!• p to _ oT - d d o d d o T - T - * i - c M c J p - i - T - co'poioicoco'fl-iooj ^iO O O O C O C O C O C O C O C O PO P O O to. h- I ^ I ^ O O 0 3 C O C O O > ScC O C O C O C O C O C O C O C O C O _.CO CO-COCO.COCO C O C O C O - C O C O C O C O C O C O «
^ .s to r~t — • — - - - — — -- —Hrt *SJ 2 __ S T— -oj o p o O--O T— i— T— i— cv] o> • —.-_._, — .,,„„.. —.2"^ S r t S o o j p ' o c o c o c o c o c o c o .o o o> o.. o c o t ^ r ^ h - c p c o c o c o c n•*r \jt i f -n f im vf v'J ^ J VJ +••+ . —• »*P* W ^ . L w* -+*f I "" • l »« «*rf Mfc* w w/
CO CM CO .CO CO CO CO CO CO CO -:C9 C O C M C O C O C O C O C O C O C O C O C O C O O D
to cj en •* in h- i--in • •• j- c n c o h - c o p - i - c o t o t o o i - p t o c na»«3O..T-'*o)(OC\Jcoeo _o 'PCO^COOJ P c o T - i o o s P c y T - c oo>co co co copi-io i- - co i - c o c n c v i oj OCM o"in 10 co co r^- M-i co co' c\i to -«t P .to oJ CD o* f CM" •* P -_ oj co" o> cri CD cy i ^ cdT - i - C M i - l O ' ^ - C O C M T - C O C O l O t c n c O T - r - C O C D : C O C O C D O ) C Ol O r * . r ^ f ^ C M C M C V I C M C M C M ^-T-'COtOCO ^ ^ f C O C O a l C V I C J C M C Ot O C D C O . C O C D O J C D O J C n C J J C O C D r ^ N - h - O P O O O O P O O-^•^--^-^^-•^•TJ-^-^^- Tr-cj-^'^--^ i n i n i n t o t n i n t o m t nO J C M C J C M C J C V I C J C M C J C V I C J C M C M CM - CM C M C J C M C M C J C M C M C J C JC M C M C M C y C M C J C M O J C y C M C M C M O J C M C J O J O J C M C M O J O J C M C M O J
r o t o L o c v i i n c j h - f ^ t ^ c n I O C O C O I O T - - i - c o L o a i ^ - r ^ r ^ c o c oO 3 - ^ - h - C O C M r - . C O C n i O . i - r O J O t O C O C M C O C M O I ^ C O C M l O C O C f tc \ i e » c o , e o £ O . e o e o ' » - e » h - ^r^cococo i o c » N - o j c D c o o > c o pcDcdaJco'^t^T-'dr^aJ eoco^i^^ lo'co'co^pcdcM^pm o c o c M i ^ N - e o - ^ - T f W co -^* r--co --a- c o T r c o c o ' t D - ^ - T - c M i -- i - T - T - T - - a i o > c n c o c Q _ c o jn -co. o CD co c o ^ r c o c o c o c o < o c o c Mf a c D < O " c o m i o i o i o i o ' t o I O I O - ^ - O J C M r o o j o i r o p o o o - i - -
CM OJ CM CM CMeo co co co co co co co co -co co co « co co co co co co co co co co
.1 1 i li i i 1 1 i i-l iiLU LU uj E uj tn uj uj ui ifi LU ft u m
CD
a
to
^s e«»
CO
"s •=• *-.® •£•• cO $ £C*_ (3li
c 1 _iS C CQ0 a*IIIfn jr i&
—•
^ ^^•g — </)£ S 5JIn e «•*1^1
ID JE 1oto£
^ Q. ®
* ci *
c"P O 35 -JC £ « CDJj 3 Ja 3E
m EJ *""01
E -§O S ^>=^ en *1i o ri<g w (fll! B SI e. "
tt fftM s _<B ^ s?
M ^""E woo•a•z:d qjS cg •-*2 T* CO 1 ~
a
*c1£
c „*s 5 "°"
oo.
CM
q
iq•*'CO
qCOTt
9dCO
£
T--CJCO
OJu>t-»r-co
COCOr-r«-CO
o-9-•*fO>COCOo-CMCM
COinCOf-.rOSenCO
§
ccLU
PQ.
CM
Odoqo"CO
qCMO
Oto"N.
£
-o
en~r-.r-sCO
••3-CMr-.IN.CO
IOt>CMCOCOCOCJ•CMCM
CJCOCM_CMCOOJQ>
CO
CO
UJ
QQ.
CJ
qto
qIOCO
otopCO
£
enm^
COIDr*..r-CO
CMCMr-fv.CO
oCOo.-tnCO•cCMCM
OO
COCDa>CD
CO
^iLU
PO.
CM
9doo•
00
o
o
£
-T—
•IO^^CO
•F-COh»T*-CO
CO••sTCOotou>CO-CM03
3"
tnCMCDD5OJ
CO
tz.
i111
pa.
CM.
•*'•*u>• >CO
q
1ingj
E
to
^
CM00toN.CO
COIOCO|>.CO
ooCOtoenCOCOl -CMCJ
T-
»d~intnCO
ciELLJ
P Po. a.
CM CM
9 0
Mq 9CO "*"
oCM *°.P i-•r- CM
9 9CD CO
EOTLU
CO COi*~ toCJ Cften T-
CD *-O3 Oto h- COCO CO
i- COto f-to coN- COCO CO
O Oh- COeo entn enCO OJCO COto oT ^~CM CMCM CM
CO COr toCM COCO t*- - i -IO CMCJ tnCO CO
f Ifi ccUJ LU
pQ.
CM
qdoqdCO
oCMOT-
P
CO
£
oo"o
COor--tDCO
*frCOtoCOCO
pCOoto•sfOJ1 -CMCM
r*-«to*CMa>CO
8£EUJ
p"O.
CJ
oooCMqdCO
pCMoCMinto^
£
CMCOdoCM
O•"3-CO».CO
OJent*.CO
oCMto 'oCMCOOtoCMCM
OCOLOto"OJf«w
CD
CO
?
EUJ
-£8
^oCO*
caCOCM
oCMinppCMT-
£
CM
to
CTLcoCOo
COoCOpr
COT-OJT~f+.toT—inCMCM
IT-COCOCM•a-CDoCMCO
pLU
55"2LU
"S
oCO
®
xt
oCOCO
9-t .O)CM
oCMinCOqmCOCM
£
£CO"COeo
f~rtoo-tf
CDXTCOO"*
topCMOtom•i—inCMCM
inCO
co"toCOoCMCO
ps?•s.cc
tn~w
5
ffl _83
TT <
p oeo"mto -rq_ tico' in0 PtO T-
IO P "CO O
CO T- "
P 0-* CMen om
£ £
co inCO. f• t- CMto -i-
OJ COoj enOJ O)O 0r t-
CM OJto tooj enO -O•V TT
OJ T-TJ- r .N r»-CO . CO
to toT- T—m inCM CMCM CM
CD h-in oN- toCO OJco inco •*o oC\l CMCO CO
I?UJ UJtn co"R Si se ccLU LU
® 83
*• -»
9 9CM C\i
CO tO1 19 9CM CMO COco to
0 PCM COin N.CO CDto Oin TOen CMCM tO
£ £
O IOco enco co"CO CD
o enin T-en eno o•* -d-
•* i-(M COtn coo.. o• r -*
co toCM CMIO T-
CO «d"CO COto co"1— T— •in inCM CMCM CM
1— >T-- COCJ Oin CM*'i enO 0CM CMCO CO
||^ 52 m ffi
£8 S3
^ .
9. 910 d•* mT- CO1 10 Oto PCM r-T- CO
P 0CJ CMm inT- CO
CD Pi- -CMCM OT- CO
£ £
CJ CMCM CM•-T 03tj -3-i- CO
h- COCM CO0 0Cvl CM** *
OJ T-o toen oTT CM
"3"
K T-eo "*•* mCM- toto •*oj en•»— 1—in toCM CMCM CM
T- CDCD rcr TT16 en"CO *-tn in0 OCM CMCO CO
§pLU §& §1
s srr QtUJ UJ
8
"*
O -dr--CDO- .p 'COto
pf-r--CDoinCJCO
£
endr-to
CO•*,_CM -
CDT~ ---
,_ .
CM"*
^i -•»-OCOtn._T—mCJCM
OJ
OJ _"T ,T—
IOOCMCO
f 'UJ
o"OJ•ItLU
--—
a.E3O.0)
oc
o.o
3•oSo.03
IItogD)C
Q.
0)JC
^ ffi! liI \\ iQ) re <§ .M >-
O Q
5SIS £O ***fe *.ij O,-4-t »5U <ia fu
*!* "C *R*X CF1 .2;
(U O .J3S Q! **•* M
S £3
C ^1o n»O -Ss ..s£
«a -C — 'C ^i £Q3 <U *-Q. Q <P
0) — tO= 05=!cu J= £ EDo 1 1 |
""• •
CO•= "K CO
O Q g&
^ ^CD CC tort Q
5>_ .C'-ld> Q. 01s o> **
D fflti}H—
•s «If c5 1 =m Q
D)
o *w —.— CO _j
> H mE o.£
M O)^ *™ **CO *= «-'c "C"6 iiiooO•a™C5 ram ™tn S "~j" *• "co i; "~*" o< za.
q75
C-s|nj s°o
oinCM
OJCMtoo
o
£
O)CMCO
o
CJeo. CM
CO
oh-COtn"N.~CJTj-
CJCM
CMCMmCOoCOtoeo
•7S1
E,0P3•oSa.
O Pin inCM CM
P O.in too oo o
p PP O
£ £
0 Pin m-3- •=*•
o o
CM -r-OJ CJIO OCM CJCO CO
O 0m coen enfv. >to N.cj en•j- i -CM CMCM CM
ca toCO OCO f -C) CMCJ •«*co h-m inCO CO
CM CO<_ X X
(a
1
0 0r ^""0 0• - tna P0 0
0 00 P
£ £
-p o-3" uri- -*
0 0
m ino tom oCM CMCO CO
0 0CO CO- COd T^-* r-cn r*-CO CJtj- •< -CM CJCM CM
CO .COOJ CMOJ 1 -T- COCM T--^ OCO- CO
CO. CO
••3- in
.X' X
oCO
"opinCDoCM
ooCM
£
oom
<
in•»-toCJCM
OtoinCMoCO• J-CMCM
CM1—CMj-COCOtoCO
to
5:
- O• -
"oIf)1
p-
o
£
oUJ**
o
CMCO.tnoCO
ototnCO>CMj-CMCM
eninT
Ooto-co
tn<_X
oinCM
COoCDm
in"
ffi
"COoCO
o
[s.
poCO
o_o_J-p'SfCMCM
COCDCOinS .
CO<D
CO
T-
-<
X
-or*CM
COO.COin
in
£
COoto
o
oooCO
oCOT~COCOCO*3"CMCM
COCOentoUJ
CO
^<-X"
0 0m o .CO 1*3'
CM toO T-to coto or> . . m
in ~"~ ph- in
£ '-ffi "
CM tnP -I-. :.to co
0 -:- o
o inen " -O_0 - - r- :-- ~..CO '•3-
o . _-. • o " '™ 'CM 'COin oT—— fN.
CO -<3-(O T_ ——
tO CM-a- tnOJ CMCM CM
^ 3
CO _ -i-T- O
CO COT— K^
CM rto oT- CMCO CO
CO 1 --T- O
< Cl — -"X - 5 . :.
D)_E
C '3OECD•5Q.O0)£
O)
1EO
O3TJOa.9•aE
XCD£otnnoE0)3V>re0)EenE'«toO•5D.O0)*rfL.,0"E . u"o tt £
S a i l 2i « -a -1 § %£ £ = S •§ =eo * « o> S. to"5 S 7 OT H S 5£ o g g o n <o — — ™ cu E o CD a> «> > oHA m E m o z
« « " " "* • «i flr" ffi r^ m E m ° z
|§?So
1i
T—
feQO
1ra
Section: Appendix K.2 . Page: 4 of 32Date; July 1,1996 ' ~ . .- - _I : Revision No.: 0
K.2 SITE BACKGROUND
K.2.1 HIA WATER SYSTEM OPERATIONS
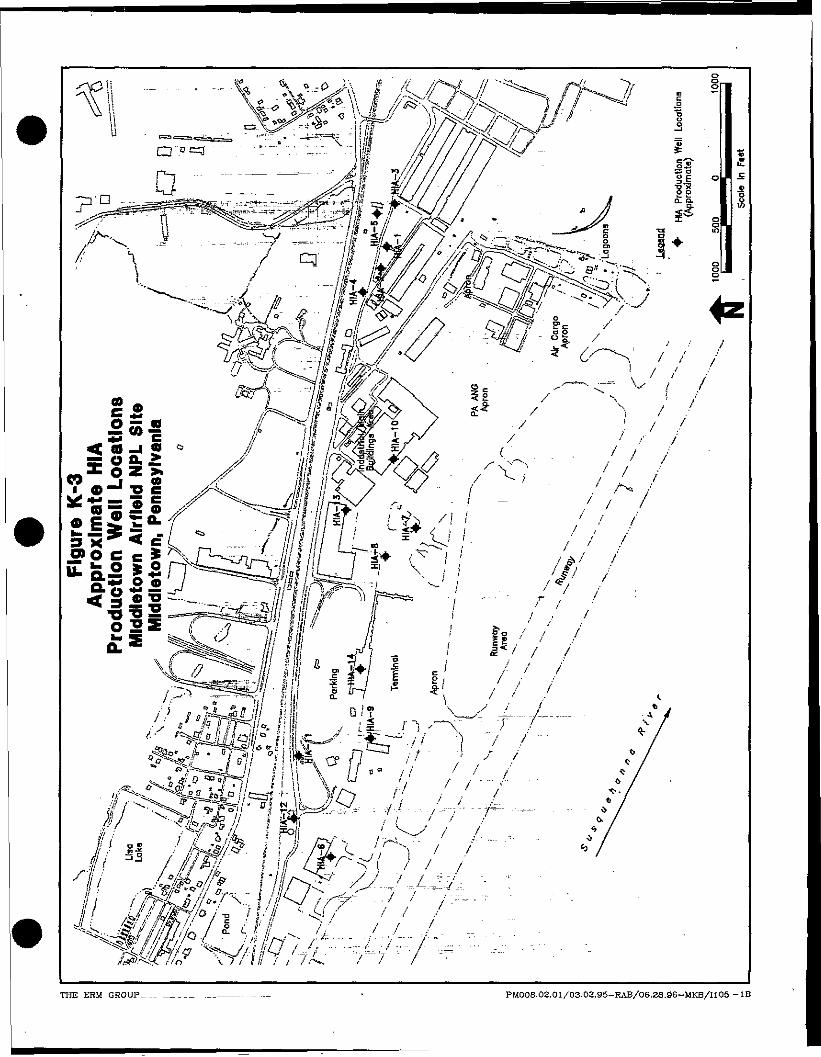
The HIA Water Department presently has 10 active production wells tosupply water to the airport and adjacent industries and businesses. Theactive wells include HEA-1,2,3,4,5,6,9,11,12, and 13. An additionalwell, HIA-14, is used exclusively for" heating and cooling purposes and isnot connected into the water supply system. Figure K-3 shows the relativelocations of the HIA production wells. Most of the HIA wells are cased todepths between 75 to 200 feet and are open hole from that depth to thetotal well depths between 450 to 800 feet.
The water system operates on an "as needed" basis. Typically no well ispumped continuously unless there is a greater than normal demand onthe system. Water from the HIA production wells is blended together andtreated by the HIA Water Department prior to distributioriin the potablewater system. Treatment includes water softening, air stripping andchlorination. The water treatment plant has two .air strippers whichoperate in parallel with capacity of 2,100 gpm. The system has theflexibility to operate air strippers in series if concentration of contaminantsexceeds normal levels. The average daily demand on the water supplysystem is 1.1 million gallons per day (MGD). The normal flow rate of thesystem ranges from 1,100 to 1,200 gpm. The system's fire requirementsare 2,100 gpm." ~
The normal pumping configuration consists of four well, two wells __serving as lead wells with two additional wells serving as first and secondlag wells. The two lead wells operate together, the lag wells turn on whendemand exceeds the amount supplied by the lead wells.. Well HIA-13 isusually the lead pumping well, paired with one of the lower yieldingwells (HIA-1,2,3,4,5, or 9) as the second lead well. Wells HtA-6,11, or -12 typically serve as lag wells. Combined flow from the two lead wells istypically 650-- 700 gpm. There is a fairly consistent draw on the system 6days a week because of industrial needs of Chloe Eichelberger textilemanufacturer. Pumping rates generally decrease on Sundays when themanufacturing production is not operating. _
TKEEKMGRCCP ' MIDDLETOVW-FFS.02006.0&-ruly 1,1996
/FsW KV '/ o 'ITWX!ls Ji ^ // .-/>
im /"--/I C
iir n \i&~*s.w'-lm „
M»"^ L' ///#0,'ii-/-Tc ' ^ il /..//'ov XT/ I// / / /A
W /Wt/ £-•CW /ri&r*&. //n
THE ERM GROUP_.__ _.__ .___-_...._...— -- • PM008.02.0I/03.02.95-RAB/06.28.96-MKB/II05-IB
Section: Appendix K2 _ Page: 5 of 32Date: July 1,1996 Revision No,: 0
Several of the HIA production wells have historically shown elevatedlevels of volatile organic contamination. HIA-13 has historically had thehighest contaminant concentration. Wells HIA-6 and HIA-12 havehistorically been free of contaminants of concern. Both wells HIA-6 andHIA-12 are located in the Western area near the HIA Water TreatmentPlant.
Wells HIA-7,8,10,15,16,17, and 18 are not in service. HLA-7 is locatedinside an active hangar underneath the concrete. HIA-8 is located on anactive airport ramp and is inaccessible. HIA-10 has been capped. WellsHIA-15 and HIA-16, which are located in the northern portion of theproperty just outside the Fruehauf Company gate, were drilled but neverput into service. Wells HLA-17 and HIA-18 are cased holes.
THE ESM GROUP MtDDCETOWN-FFacCO OB-July 1, l«t>

Section: AppendixK.3 _ . -. .. .. - .—-.._.. . _.. .- Page: 6 of 32
Date- July 1,1995 "=" "" ./ .:'- _- . - . • ' , . = - ' " -- " -""".M" RevisionNo.: 0
K.3 ~CAPTURE ZONE TESTS
Four aquifer tests were conducted, one in each of the Eastern, Central, andWestern areas of the Site, and in the vicinity of the North Base Landfill.Constant-rate pumping tests: were conducted on production wells HIA-2(Eastern), and HIA-9 (Western), and recovery tests were conducted onproduction wells fflA-13 (Central) and MID-04.
These aquifer tests were performed to provide data on shallow,intermediate, and deep aquifer characteristics Although uniqueconditions existed at each area, general aquifer test procedures wereapplied to all aquifer tests performed. A description of the generalprocedures for each aquifer Jest is presented below.
K.3,1 -GENERAL TEST PROCEDURES
Each aquifer test was divided into three phases: a pre-test stabilizationphase, the test phase and a recovery/restart phase. The tests wereperformed either as constant ratepumping tests in wells that are normallyoff, or as recovery tests in wells that are normally pumping. For theconstant-rate pumping tests the phases consisted of the following:
• Pre-test stabilization phase where all the production wells in thevicinity of the test were taken off-line and shut down for at least 24hours. This allowed the aquifer to achieve stable ground waterconditions prior to the execution of the capture zone test. Electronicdata recorders were installed in monitoring wells at the beginning ofthe pre-test phase to monitor the water levels throughout the aquifertest; - -
• Pumping phase where the selected production well was pumpedcontinuously at a constant rate. Since the HIA Water Departmentcould not handle the volume of water that was to be pumped duringthe tests, the water was discharged to the storm drain system whichemptied into the Susquehanna River. The water from MID-04 waspumped into the Borough of Middletown's water system. Thepumping phase of the testing lasted approximately 72 hours. Otherproduction wells in the area remained off-line, if possible, through theduration of the test.
THE ERM GROUP MTODLETOWN-FFS.02006.08-July I,1996
Section: Appendix K3 Page: 7 of 32Date: - July 1,1996 " ~ Revision No.: 0
In addition to the electronically monitored wells, hand measurementswere collected from select wells every 0.5 hour "for the first 2 hoursafter the pump was turned on, every hour for the next 8 hours, andthen every 8 hours for the remainder of the pumping phase. Handmeasurements were collected periodically from the electronicallymonitored wells in order to validate the electronic data. Submergencedepth readings of the other HIA production wells in the area of thepumped well were recorded from the bubbler panel in ihe~controlroom at the HIA Water Department Treatment Plant.
* Recovery phase where the production well was shut down forapproximately 72-hours to allow water levels to recover to pre-testconditions. The electronic data loggers remained in the wells tomonitor the water level recovery, but no hand depth to watermeasurements were collected during this portion o£_the test. Theprimary purpose of the data collected during this phase was tobackup the data collected during the pumping phase of the test in theevent that the pumping phase data was lost or appeared unreliable.
The recovery-type aquifer tests conducted on wells HIA-13 and MID-04were conducted in an almost identical manner as the constant-rate testsexcept that the pumping and recovery phases were reversed. The pre-teststabilization phase consisted of pumping the test well at a constant ratewhile monitoring the water levels in the surrounding wells. The testphase consisted of turning the well off and measuring the recovery rate inthe surrounding wells at the same frequency described above for at least72 hours. The third phase consisted of restarting the test well andmaintaining a constant pumping rate for approximately 24 hours. Waterlevels in the capture zone well nests were electronically recorded duringthe restart phase. .
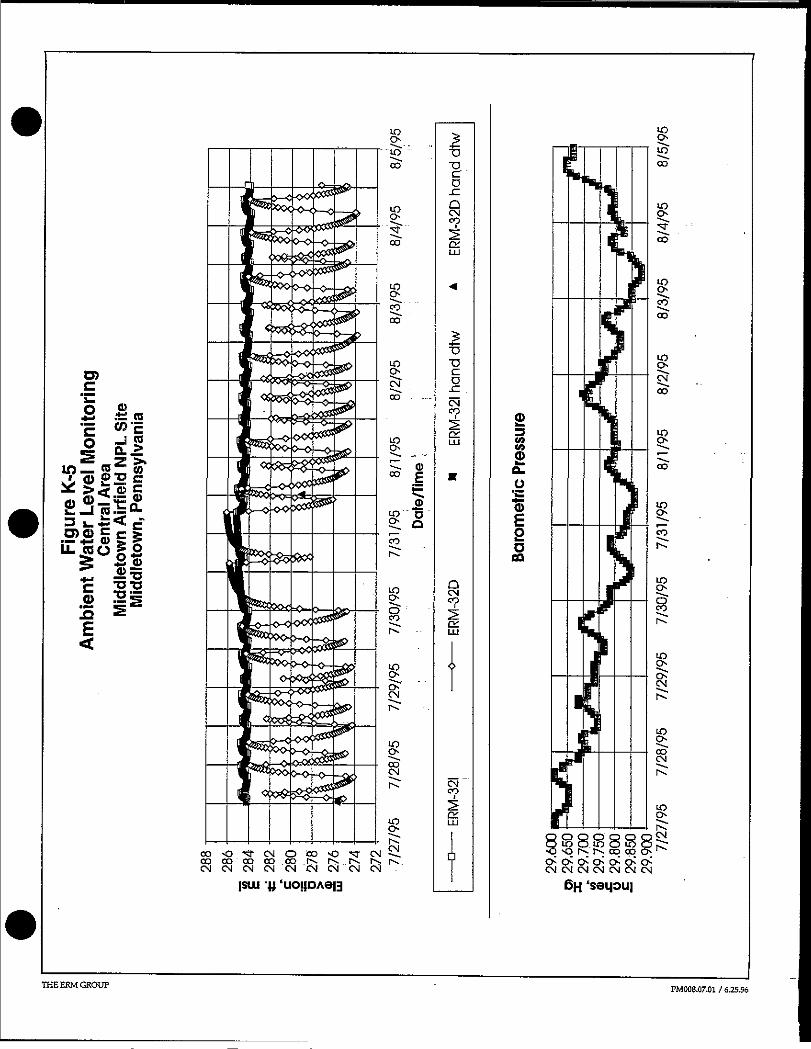
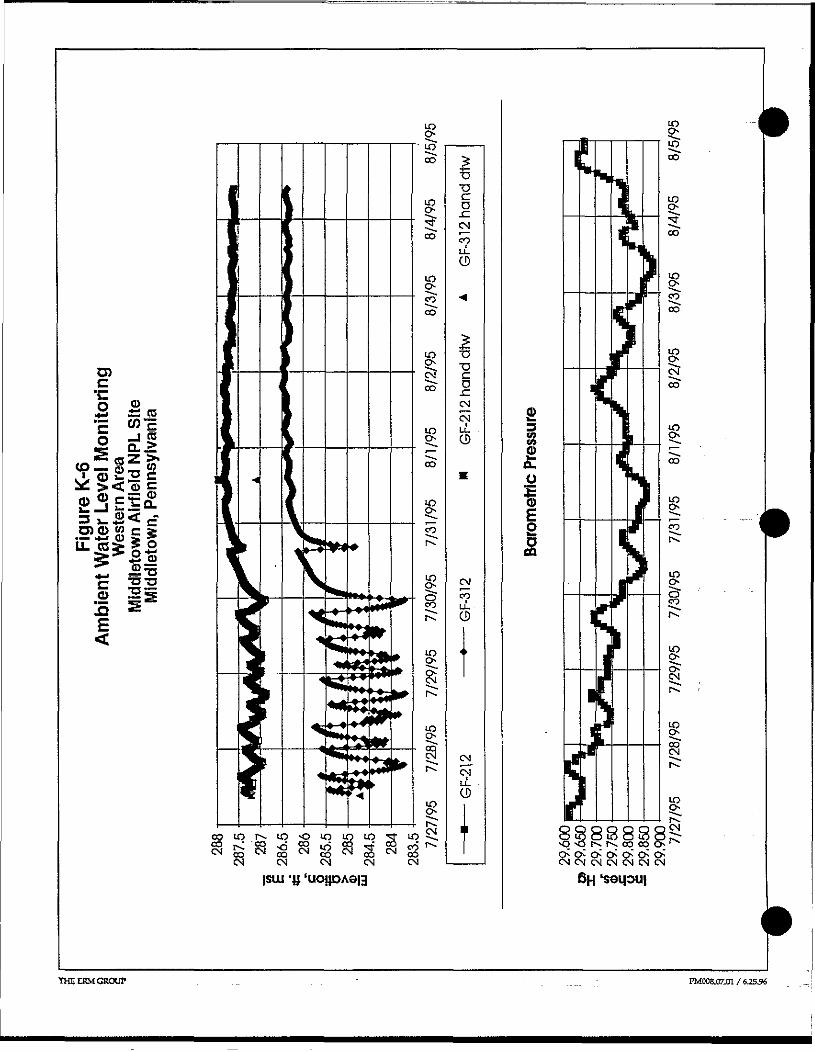
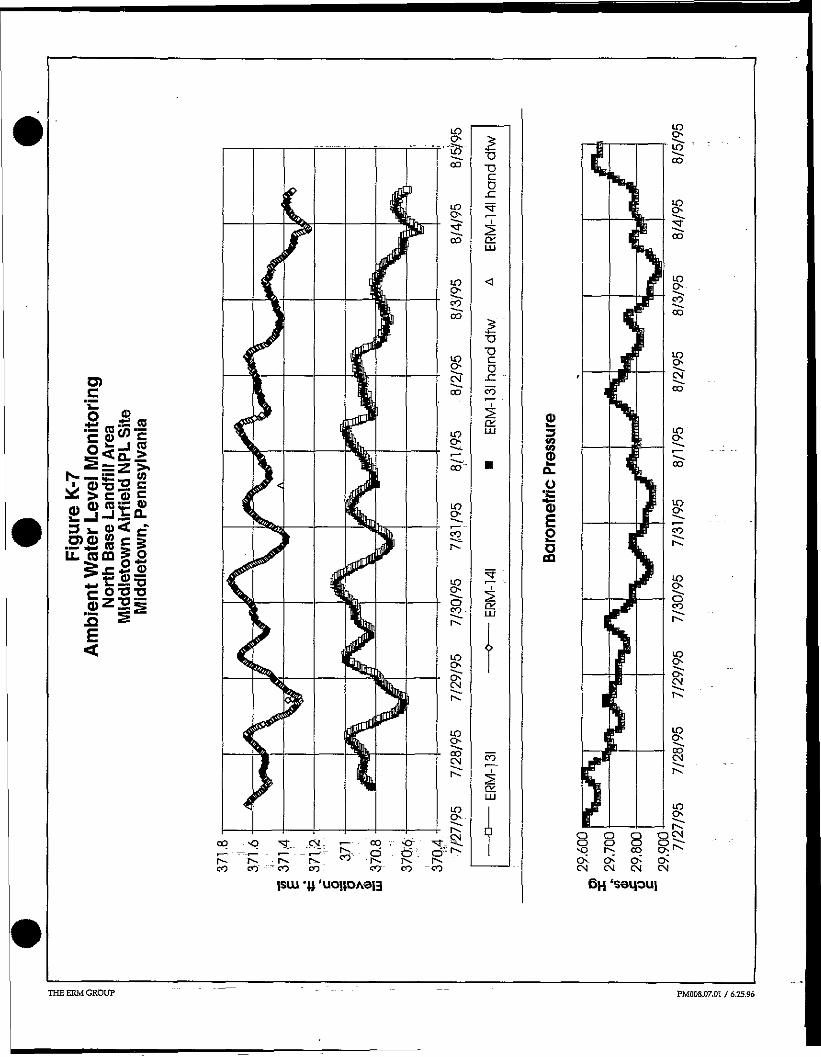
K.3.2 AMBIENT MONITORING
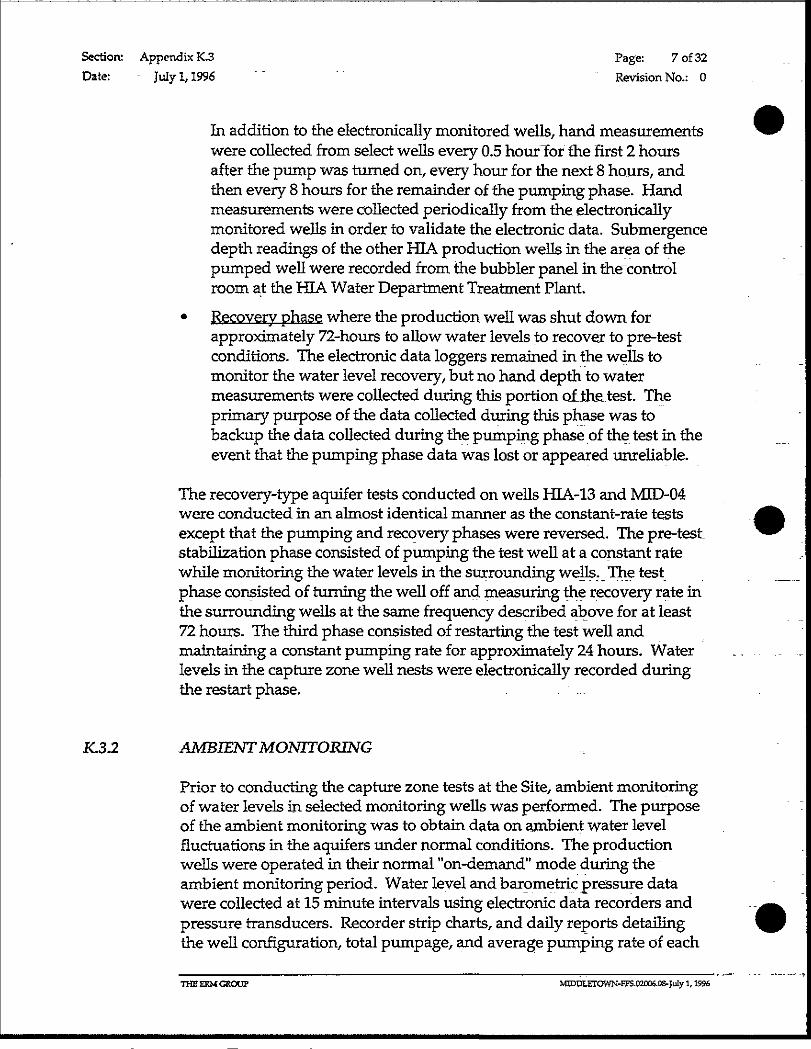
Prior to conducting the capture zone tests at the Site, ambient monitoringof water levels in selected monitoring wells was performed. The purposeof the ambient monitoring was to obtain data on ambient water levelfluctuations in the aquifers under normal conditions. The productionwells were operated in their normal "on-demand" mode during theambient monitoring period. Water level and barometric pressure datawere collected at 15 minute intervals using electronic data recorders andpressure transducers. Recorder strip charts, and daily reports detailingthe well configuration, total pumpage, and average pumping rate of each
THE EEM CROUP Mn3DLETOWN-FFS.tH006.OS-July 1,1996
Section: Appendix K-3_ - _ '/ ".. . ' • ' . ' . - ..__:. - - --- - Page: 8 of32Date: July 1,199-6. .= _____ .__,....... ..,:, _ L. 7 "" 1 -, -.: ^ -: ———— Revision No.: 0
of the HIA production wells during the ambient monitoring period were _obtained from the HIA Water Department.
The ambient monitoring of water levels at the Middletown Airfield Sitewere conducted from 27 July 1995 to 4 August 1995. Two wells in each ofthe four test areas were monitored as per the Work Plan. These wellsinclude: = --------- •••-. —^± ---.-.:.-_..--_- -_-.-_=-.:
Eastern Area . GF-210, GF-310
Central Area ERM-32I, ERM-32DWestern Area GF-212, GF-312
North Base Landfill Area ERM-13I, ERM-14I
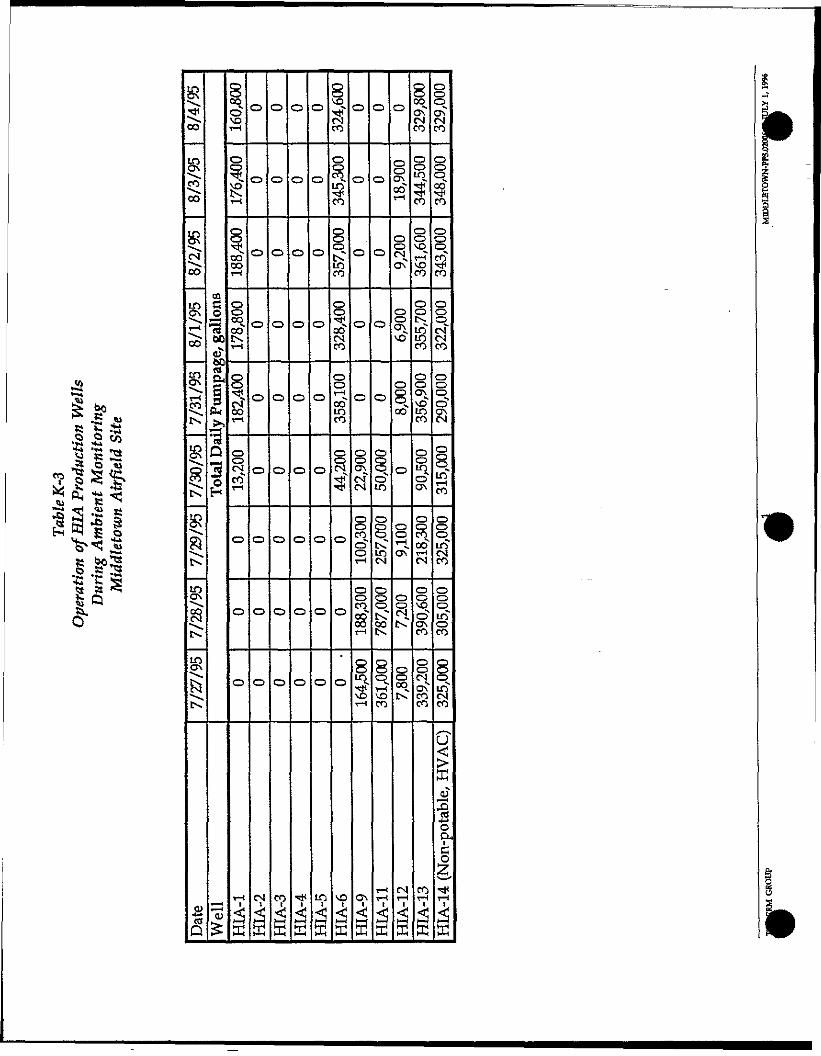
Table K-3 presents the total daily pumpage of the HIA production wellsfor the ambient monitoring period. Precipitation records and barometricpressure data for this time period were obtained from the weather stationat the HIA. A"cumulative rainfall of 0.8 inches for the 6 hourmeasurement interval from 1245 to 1845 hours was recorded on 28 July1995.- - - - - - - - ----- - - ' - - - - - : - :
The ambient water level monitoring data was exarnined to determinewhether the magnitude of ambient water level fluctuations could interferewith the analysis of data collected during the Capture Zone Tests. Theambient fluctuations in water levels, neglecting pumping impacts, was onthe order of 0.5 feet. Separating responses to pumping of similarmagnitude to the ambient fluctuation may be difficult None of the wellsexhibited a response to a precipitation event that occurred on 28 July 1996.This suggested that a rainfall event would not significantly impact thepumping tests. Finally, the wells included in the ambient monitoringprogram were considered background wells for each aquifer test.Although several of the background wells showed responses to pumping,the large responses suggested that ambient changes in water levels weremuch smaller than the response to pumping in many wells. Thereforecorrection for background fluctuations was not an issue in the dataanalysis. ___ - ....
K.3.2.1 Eastern Area
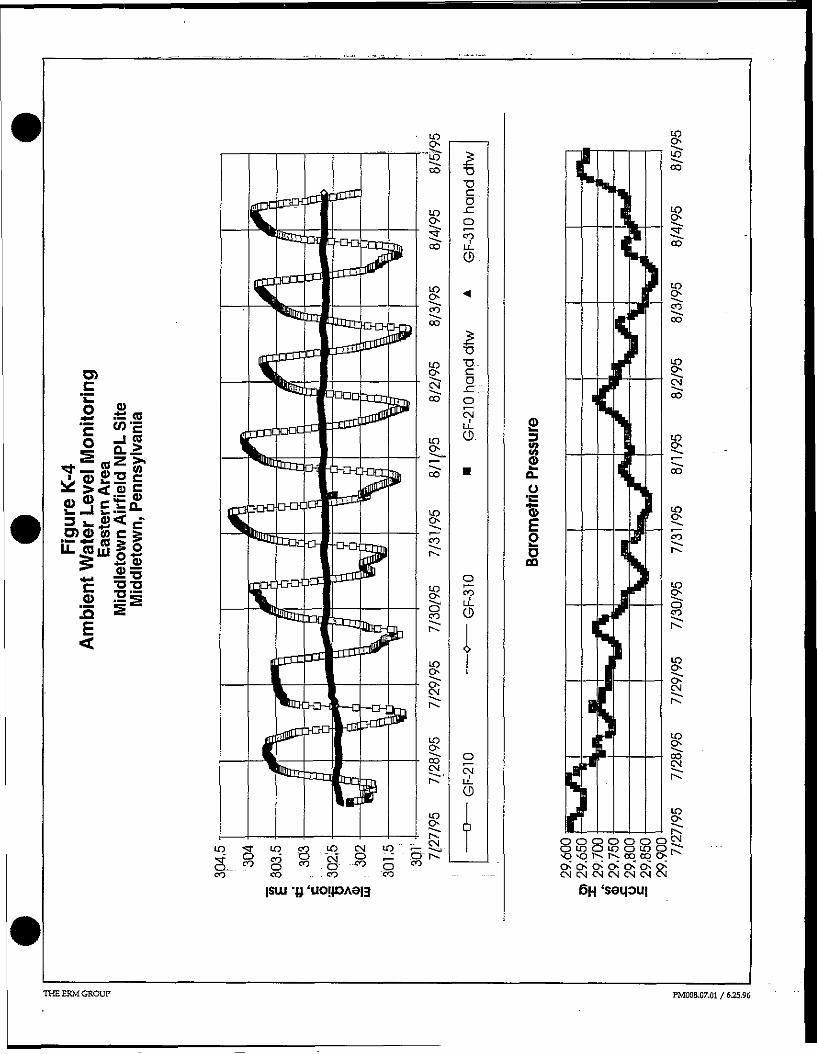
Wells GF-210" and GF-310 were monitored in the Eastern Area. Figure K-4is a graph of the ambient water level data and barometric pressure datafor these wells. . _ _ . . _ .
THE ERM GROUP MmDLETOWN-FFS.02006.08-July 1,1996
;n
5*CO
COCO
!8CMCO
inON.r-t
CO
ON
t-KCOIN
tC
IN
mON
1$-v.IN
ON*"hs...
c"s.IN
inON
c$••^
QJ
coD
OJCo
60CJ"GO
CU
iB«4
HQ•a->oH
i— iOJ
£
govoT-H
1sTT-.
g
COCO
gCOINr-f
g
CMCO
CDCMCO
O
O
o
t-l^X
o
o
o
o
o
o
o
o
o
CMI
H
o
o
o
o
o
o
o
o
o
s3£
o
o
o
o
o
o
o
o
o
Tt*1
2SffiHH
o
o
o
o
o
o
o
o
o
in<s
os(NCO
osiJc*
oooINmCO
oCOCMCO
oosmCO
o
^o
o
o
VO<HH
o
o
o
CD
o
oCDON
sfooCOoo
orf\
COCOt-l
oo"*O^
ON
H-
o
o
o
o
o
iCOm
o
INmCM
of f
lCO^ooTH"\oCO
r-ft-.I
HH
o
ooONcdrM
ooON
oCDvo
oCD
CO
o
ooON
oot«s
oCDCOIN
TH
<s
^ONCMCO
sj
CO
oosCO
o-D
ininCO
ooON
inCO
oooON
oCD
COT—— 1
CM
oCDvoCD"ONCO
oCD
ON10
C ji
fr]TH1
E
:D
ONCMCO
ooCDijCO
oCD
CO
oooCM*CMCO
oCDooONCM
oCDCD_
CO
oCDoinCO
oCD
inoCO
oCDCD
CMCO
cr
OJ-H
"oD.
cg.T-!
<ffl
o>
±£ •- .2rt -I «S Q->
.QE
0><Ptf> c — ftDiTmb :——i ————— —— • r Q6CO
TJ
c"o.C"oCM
G
CO
O
§0000003^to O to o to cpr^"<5 h-. r - cq cq O;'
o o> b 0*0 o o*CM CM CM CM CM OJ CM
THE ERM GROUP PM008.D7X)! / S.25.96
Section: Appendix K3 Page: . 9 of 32Date; July 1,1996 ' " - - - - - - - • • . --. Revision No.: D_
• Well GF-210 varied approximately 33 feet per day in response topumping. During the pumping test_of HIA-2, production wells HIA-1,3,4, and 5 were shut down.
• Well GF-310 varied by approximately 0.3 feet in response tobarometric pressure fluctuations over the week long monitoringperiod. This magnitude of change did not impact the reduction orevaluation of the data.
K.33..2 Central Area
Wells ERM-32I and ERM-32D were monitored in the Central Area. FigureK-5 depicts the responses of these wells._.• The observed water levels in wells ERM-32I and ERM 32D varied by
less than 1 foot per day and 10 feet per day, respectively, in responseto HIA-13 pumping. During the recovery test of HIA-13, this effectwill be eliminated as production well HLA-13 will be shut off.
K.3.2.3 Western Area
Wells GF-212 and GF-312 were monitored in the Western Area, Figure K-6 depicts the responses of these wells. ;.• Well GF-212 varied approximately 0.5 feet per dajf in response to
pumping. Well GF-312 varied by approximately 1 to 2 feet per .day.
K3.2A North Base Landfill Area
Wells ERM-13I and ERM-14I were monitored in the North Base LandfillArea. Figure K-7 depicts the responses of these wells.• Water levels in wells ERM-13I and ERM-14I varied by approximately
0.2 and 0.4 feet in response to barometric pressure fluctuations over__the week long monitoring period. This magnitude of .change shouldnot impact the reduction or evaluation of the data. The Middletownproduction well MID-04, in the vicinity of these wells., pumpscontinuously and does not cycle on and off as do the. HIA productionwells located in the Industrial Area of the Site. " ~..
THE EKM CROUP MIDDLETOWN-FFS.020(H.OB-Iu]y 1,1996
o>cf tt-rf «•*4-1 « CD
o J 5^ o,^
£< r-"
CO O ^ CM O 'CO sOC O C O C O C O C O t N I NC M C N 1 O J C M C M C M C M C M C M
isui -4; 'uoipAe|3
(D
oto
.o"SgoCO
co
co
§000000up O to o to o*O r* r*. cq cp c>o o o* o> o c> o«CM CM CM CM CM CM CM
THEERMGROUP - PMOD8.07.01 /6 556
£$CO
tooOOCO
c?O) WH—I—1H——I——I—i—I—[ c3.£P
o 2>< o
E
SLC5CO
tJ
CO
IOO
CO
£ffi c =5 mi v SH.r
C ±iS 1%. " ^ c>| ig -»——: 3a»-s?
§IrtoCNCOCM
tOOr-CM
CQ rsl ^Q sncP.u-iCQ^*co,,-;rx^^ C Q ^ c O ^ c B ^ o t ^ c S
CM CS CM CM CM
{Sill '|| 'UO|}DAS|3
c o L o r ^ i o o t o t o L O ^ L O
D.CCMCOLt_G
cD£
^ <DCM -LL.G
CMCO
CMCM
IO
O
2
CO
co
O O O OO tO O toI*-; IN CO CO
C> C>CM CN
8
C> O- O*CM CM CM CM CM CN CM
<i
•PMM&fl7jn16.2556
c. . D
O)C ». Bh! co co
< ,--.2>.2 S i *u- com i o
CO
a a>uj 3
O
"SgoCO
r
Q QO pco c>c> o*
CM
THE ERM GROUP . . . - - - ..... ._ PM008JD7.01 / 6.25.96
Section: AppendixK.3 , . .._. . _ . . _ . . Page: 10of32Date; July 1,1996 " Revision No.: 0
K.3.3 AQUIFER TEST ___... ;;_ : _
K3 .3.2 Eastern Area
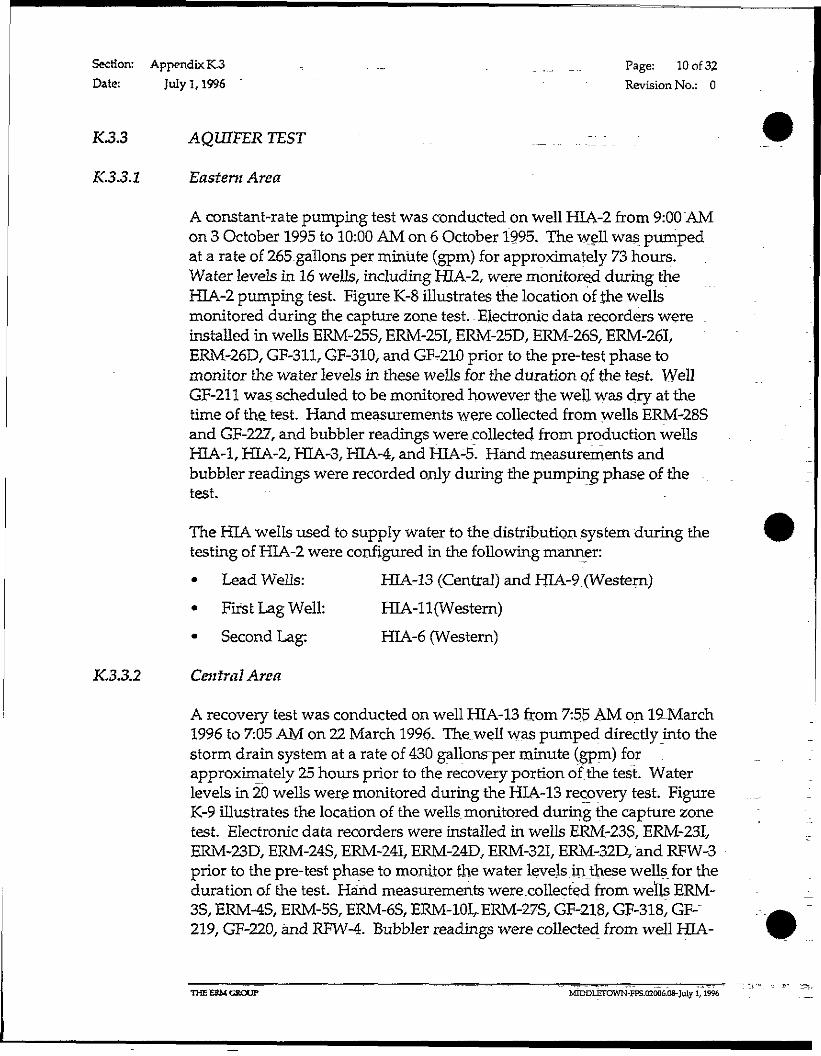
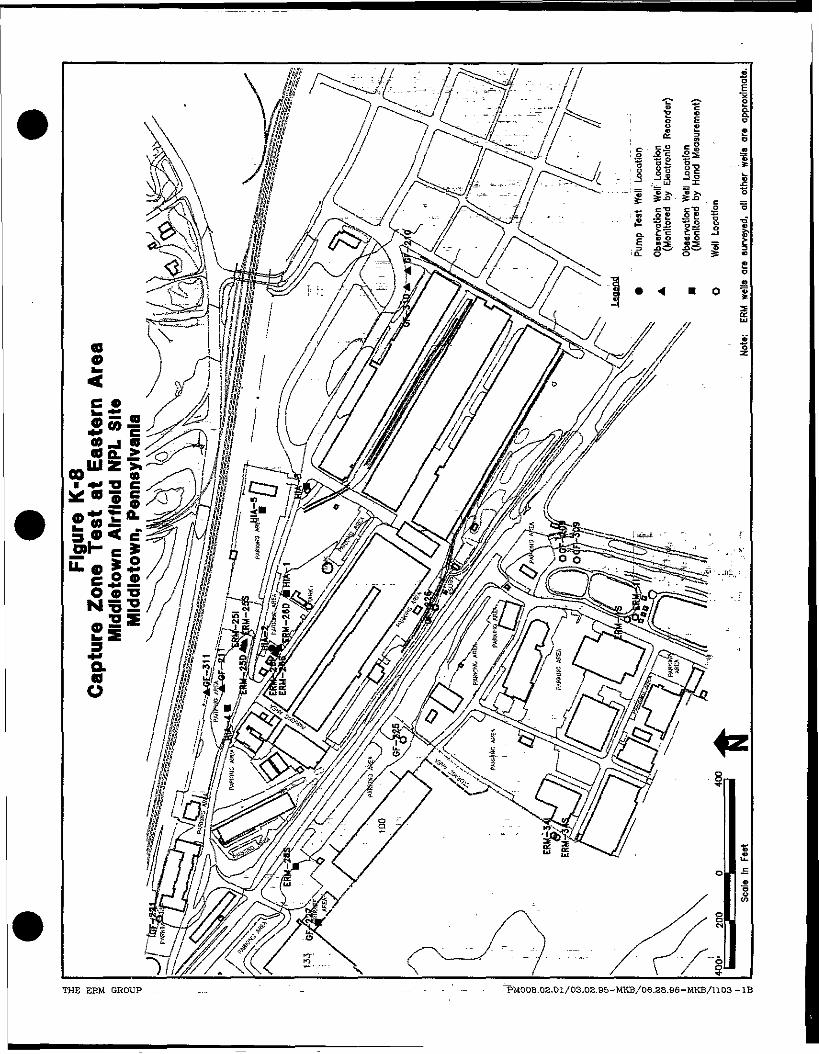
A constant-rate pumping test was conducted on well HIA-2 from 9:00 "AMon 3 October 1995 to 10:00 AM on 6 October 1995. The well was pumpedat a rate of 265.gallons per minute (gpm) for approximately 73 hours.Water levels in 16 wells, including HIA-2, were monitore_d during theHIA-2 pumping test. Figure K-8 illustrates the location of the wellsmonitored during the capture zone test. Electronic data recorders wereinstalled in wells ERM-25S, ERM-25I, ERM-25D, ERM-26S, ERM-26I,ERM-26D, GF-311, GF-310, and GF-210 prior to the pre-test phase tomonitor the water levels in these wells for the duration of the test. WellGF-211 was scheduled to be monitored however the well was dry at thetime of the test. Hand measurements were collected from wells ERM-28Sand GF-227, and bubbler readings were collected from production wellsHIA-1, HIA-2, HIA-3, HLA-4, and HIA-5. Hand measurements andbubbler readings were recorded only during the pumping phase of the ..test "
The HIA wells used to supply water to the distribution system during thetesting of HIA-2 were configured in the following manner:
• Lead Wells: HIA-13 (Central) and HIA-9 (Western)
• First Lag Well: HIA-11 (Western)• Second Lag: HIA-6 (Western)
K.3.3.2 Central Area
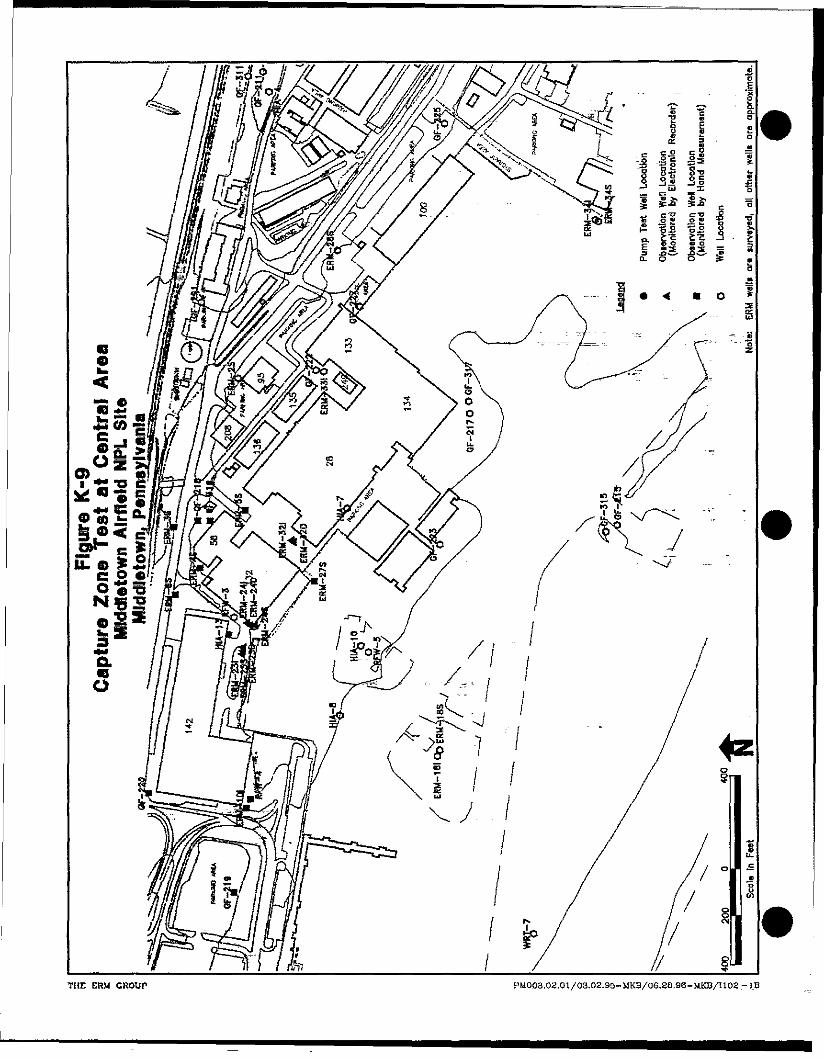
A recovery test was conducted on well HIA-13 from 7:5$ AM on 19-March1996 to 7:05 AM on 22 March 1996. The well was pumped directly into thestorm drain system at a rate of 430 gallons~per minute (gpm) forapproximately 25 hours prior to the recovery portion of the test. Waterlevels in 20 wells were monitored during the HIA-13 recovery test. FigureK-9 illustrates the location of the wells, monitored during the capture zonetest. Electronic data recorders were installed in wells ERM-23S, ERM-23I,ERM-23D, ERM-24S, ERM-24I, ERM-24D, ERM-32I, ERM-32D, and RFW-3prior to the pre-test phase to monitor the water levels in these wells for theduration of the test. Hand measurements were .collected from wells ERM-3S, ERM-4S, ERM-5S, ERM-6S, ERM-lOjVERM-275, GF-218, GF-318, GF-219, GF-220, and RFW-4. Bubbler readings were collected from well HLA-
THE ESM CROUP MrDDLETOWN-FFS.02006.08-July 1,1996
THE ERM GROUP _ .... " - '. - . . . _ . . . ! ._. TM008.02.01/03.02.95-MKB/06.38.96-MKB/I103-IB
THE EHM CROUP PM008.02.Ql/03.0Z.95-MKS/06.2e,S6-MKB/U02.-IB
Section; AppendixK-3 "_.:/__" . .... Page: 11 of32Date: July 1,1996" i\_'._ .'- - ------ - - ----- Revision No-- 0
13 at least once per day. Hand measurements and bubbler readings wererecorded only during the pumping phase of the test.
The HIA wells usecf to supply water to the distribution system during thetesting of HIA-13 were configured in the following manner:• Lead Well: HIA-12 (Western)• FirstXag Well: . _HIA-11 (Western)• Second Lag: HIA-1 (Eastern)
K.3.3.3 -Western Area
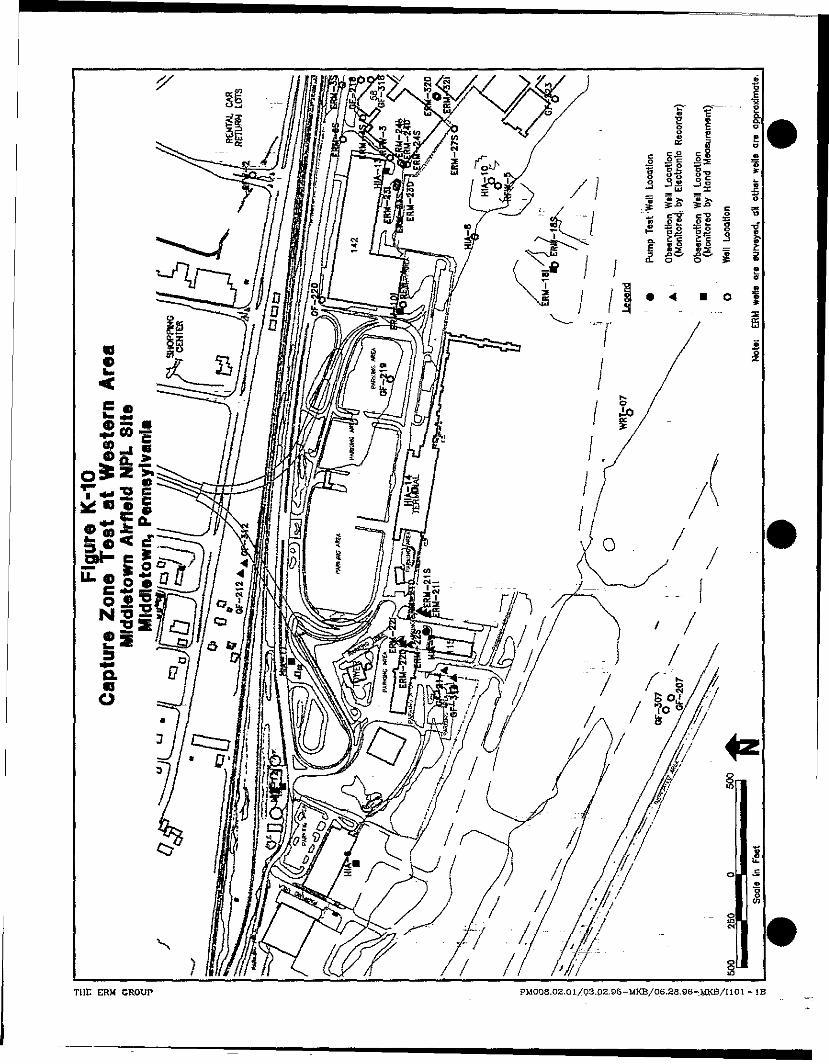
A constant-rate pumping test was conducted on well HEA-9 from 10:00AM on 26 September 1995-to 11:00 AM on 29 September 1995. The wellwas pumped at a rate of 205 gallons per minute (gpm) for approximately73 hours. Water levels in 16 wells, including HIA-9, were monitoredduring the HIA-9 pumping test. Figure K-10 illustrates the location of thewells monitored during the capture zone test. Electronic data recorderswere installed in wells ERM-21S, ERM-21I, ERM-21D, ERM-22S, ERM-22I,EJRM-22D, GF-314, GF-312, and GF-212 prior to the pre-test phase tomonitor the water levels in these wells for the duration of the test. WellGF-214 was scheduled to be monitored however this well was dry at thetime of the test. An electronic data logger was added to well ERM-10Iprior to the pumping phase to monitor the water levels in this well duringthe pumping of well HEA-?_and the recovery phase of the test. Due to adata logger malfunction in well ERM-22S, water levels in this well weremeasured by hand. Bubbler readings were collected from wells HIA-6,HIA-9, ffiA-11, HIA-12, and HIA-13. Hand measurements and bubblerreadings were'recorded only during the pumping phase of the test.
The HIA wells used to supply water to the distribution system during thetesting of HIA-9 were configured in the following manner:• Lead Wells: HIA-13 (Central) and HIA-1 (Eastern)
• First Lag Well: HIA-12 (Western)• Second Lag Well: HIA-6 (Western)
For the "first 100 minutes the lead wells were HIA-12 and HIA-6, withHIA-1 and HIA-2 serving as the first and second lag wells. As a result ofIjTA-9-pumping continuously, the water level in HIA-6 dropped causingthe low-level alarm to go off. At that time, HIA-6 was turned off and HIA-
THE ERM GROUP . MDDLETOWN-FFS.02006.08-JuIy 1,1996
s
THt ERM CROUP PM008,02.01/Q3J12,95-MKB/06.28.96-MKe/n01 - !B
Section: Appendix K3 . - . - , - _ Page: 12 of 32Date: July 1,19961 ..=.":!.."".. """.,.- ". .,,. .....__...,.- — . -- - - - RevisionNo.: 0
13 was put on-line., A second change to the well configuration wasrequired as a result of HIA-9 pumping continuously, which activated thetreatment system pausing the blower and chlorinate to run even thoughno water was entering the treatment system. In order to resolve thisproblem, the well configuration was changed again on 27 September 1995at 0752 hours (1342 minutes into pumping portion of the test) to HIA-1and HLA-13 as lead wells and HIA-12 as 1st lag and HIA-6 as 2nd lag.
K.3.3 A North Base Landfill Area
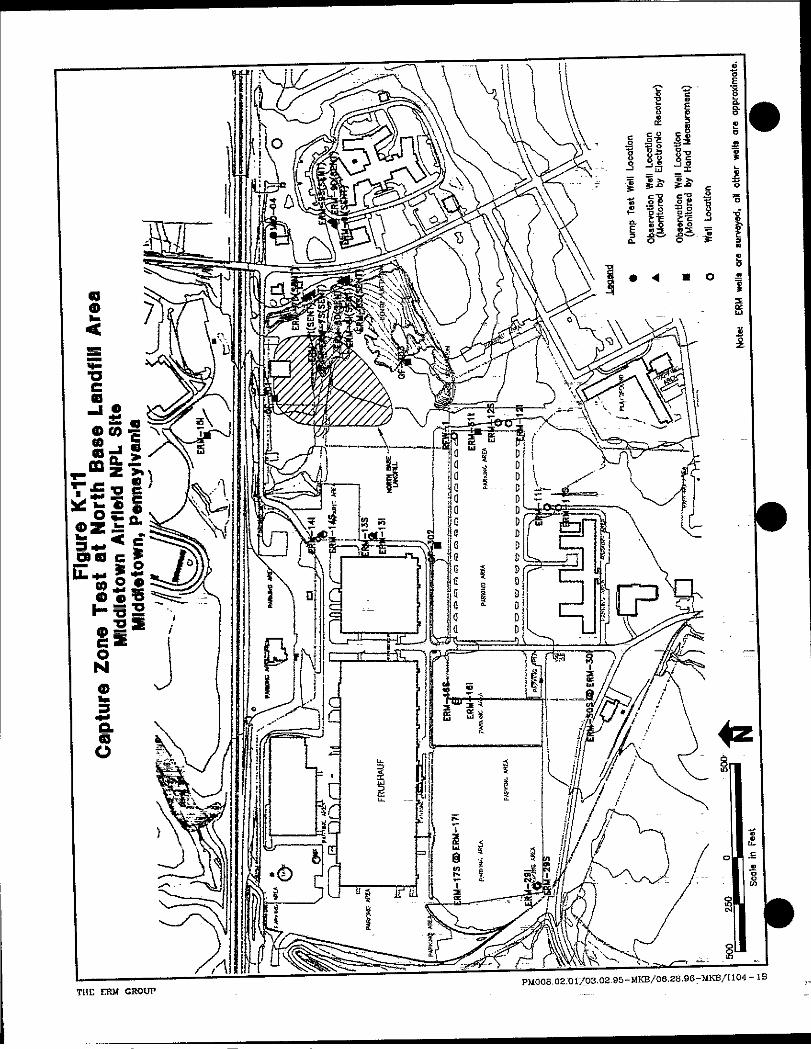
A recovery test was conducted on well MID-04 from 9:00 AM on 10October 1995 to 10:00 AM on 13 October 1995. The well was constantlypumped at a rate of 80 gallons per minute (gpm) by the MiddletownBorough Authority. Water levels in_18 wells were monitored during theMID-04 recovery test. Figure K-ll Illustrates the location of the wellsmonitored during the capture zone test. Electronic data recorders wereinstalled in wells ERM-7S, ERM-7I, ERM-7D, ERM-8S, ERM-8I, ERM-8D,ERM-9S, ERM-9I, ERM-9D, ERM-13S, ERM-13I, ERM-14S, ERM-14I priorto the pre-test phase to monitor the water levels in these wells for theduration of the test. Handrhea"siirements were collected from wells ERM-15I/ERM-31I, GF-301, GF-302, and GF-303. Bubbler readings from the -HIA wells were not recorded since well MID-04 was far enough away notto be impacted by: the pumping of these wells. The bubbler on MID-04•was not operating properly at the time of the recovery test. Handmeasurements were recorded only during the recovery phase of the test.
It was anticipated that the normal operation of the HIA production wellswould not impact the testing of MID-04. Therefore no alteration to theHIA well pumping schedule was required during the testing of MID-04.
THEEEMGBOUP MJDDLBTOWN-FF&02006.(W-Iu]y 1,1993
THE ERM CROUP PM008,02.Qr/p3.02.95-MKB/06.28.96-MK8/I104 - IB
Section: AppendixK.4 . . _ . _ . . . -- Page: 13of32Date: July 1,1996 ! ' Revision No.: 0
K.4 PUMPING TEST ANALYSIS
The data for each test was plotted and analyzed to determine rn-situaquifer parameters. For each well monitored during the capture zonetests, the following data plots were prepared and are attached inAttachments K.1 and K.2. " _" "
• Arithmetic graphs of time versus ground water elevation, and• Semi-logarithmic graphs of time versus drawdown.
IC&l General Observations
Based on a review of the data, the following observations were made:• Partial penetration effects were observed in the drawdown response
at the well nests installed near the pumping wells. For example, atthe EKM-9 sentinel well nest, the shallow, intermediate, and deepwells recovered approximately 0.7,5.5, and 63 feet respectively inresponse to the recovery of production well MID-04. Attempts toidentify vertical versus horizontal hydraulic conductivity however,were complicated by the nature of the bedrock aquifer. In general,the production wells have_open hole intervals from 51 to 815 feet butonly draw water from limited portions of the borehole,
• Anisotropy was expected to manifest itself as. an elliptical cone ofdepression. Thiswas_not observed. The response to pumping inwells along trike was similar to the response observed in wells upand down dip from the pumping well. Thus, anisotropic conditionswere not observed in the test results. This may be the result of thespacing and depth of the observation wells such that they do notintersect the fractures being affected by pumping or near verticalfractures in the pumping well which were not intersected in theobservation well.
• Dual porosity effects (similar to water table delayed yield response)were observed in some data. However, the data analysis did notpursue determination of a fracture storage coefficient versus a matrixstorage coefficient. Aquifer transmissivity, not storage coefficient,was required to perform the steady-state modeling. Only the latertime matrix storage coefficients are presented in the data analysisresults. . . . - . ' - •
THE ERM GROUP MmDLETOWN-FFS.02006.08-July 1,1996
Section: Appendix K.4 Page: 14 of 32Date: July 1,1996 - Revision No.: 0
• Leveling off of the drawdown curve was observed in several wellsnear the end of the test. This may be due to corrirnumcation with theriver (a recharge boundary), or the cessation of pumping in a wellsomewhere in the vicinity. This condition did not generally interferewith the data evaluation. Analysis of distance to a recharge boundarywas not performed as the effects were not conclusively related to arecharge boundary nor were there sufficient observations to identifythe location of such a boundary.
KA3. Data Analysis
Based on the general observations, the Cooper-Jacob method was selectedas the best method for initial data analysis. This method is preferable toother analysis methods as it evaluates the aquifer transmissivity based ona rate of drawdown (slope of a line) versus the absolute drawdown.
The transmissivity was calculated from the pumping rate and the slope ofthe semi-logarithmic graph of time versus drawdown using the followingrelationship:
T = 264Q/As where -T = transmissivity, gpd/ftQ = pumping rate, gpmAs = change in drawdown for one
log cycle of time.
The Cooper-Jacob method is also useful for anisotropic aquifers. Theslope of the straight-line portion of the graph should be the same in alldirections and a transmissivity determined from that slope wouldrepresent the effective transmissivity:
Teff = (Tmajor * Tminor) •*•'
Determination of an anisotropy ratio could, if present, be determined fromthe elliptical shape of the cone of depression. Again, the cones ofdepression appear to be circular rather than elliptical suggesting isotropicconditions. No directional flow preferences were observed from thecapture zone test data. As mentioned previously, this may be the result ofthe well spacing or the near vertical fractures within the bedrock aquifer.
The Cooper-Jacob method allows transmissivity to be calculated withoutcorrections for partial penetration effects or anisotropy. Arithmetic dataplots for individual wells are presented in Attachment K.l. Semi-log data
THE EEM GROUP Mn>DLETOWN-FfS.02006lt»-July 1,1996
Section: Appendix K.4 - _ Page: 15 of 32Date: July"!, 1996 "_ ' ' . ~ . .. Revision No.: 0
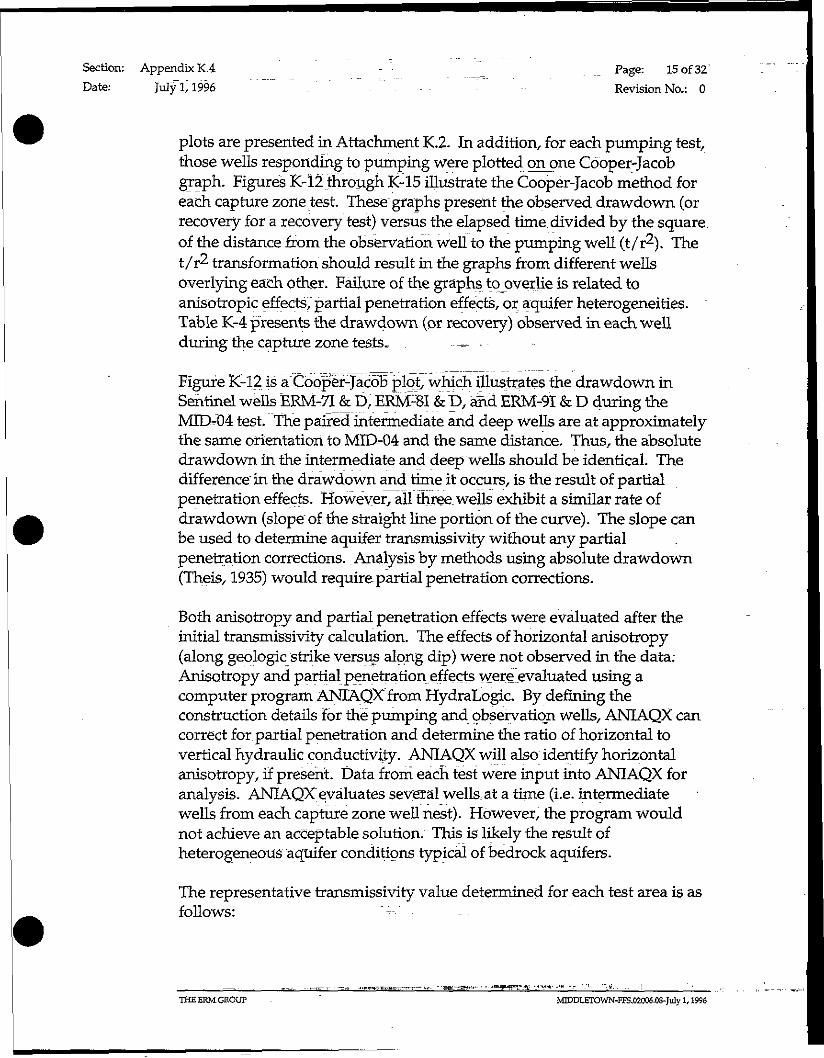
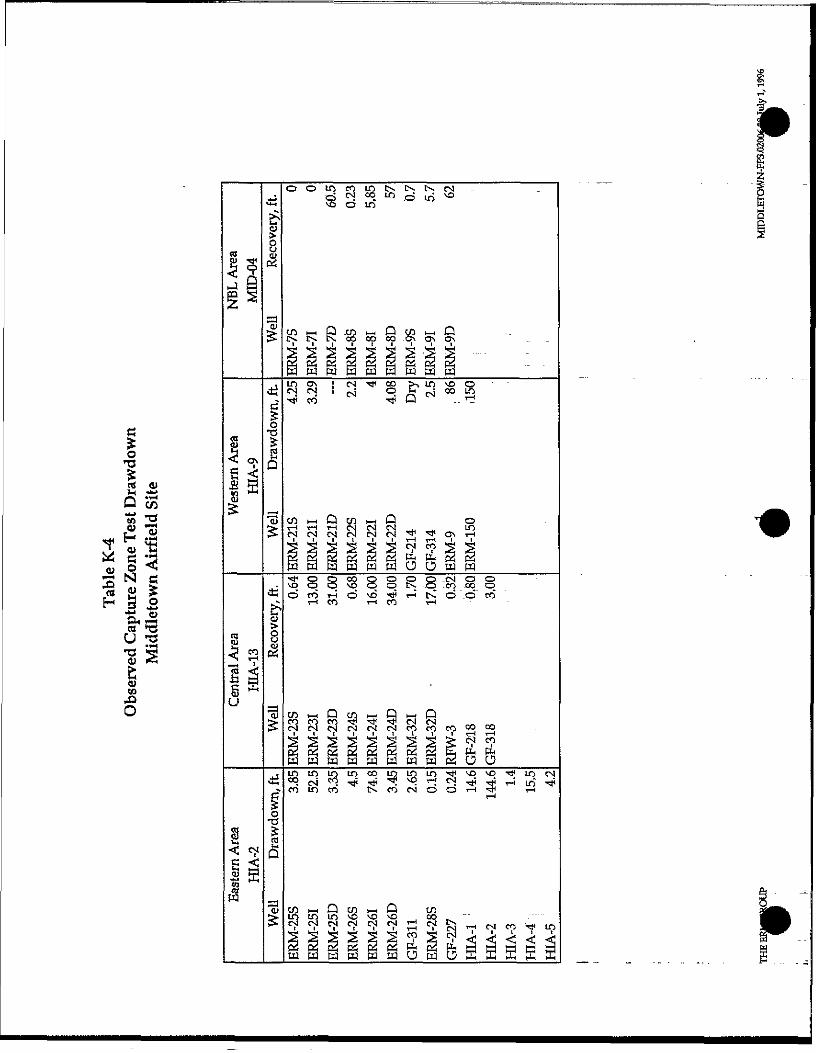
plots are presented in Attachment K.2. In addition, for each pumping test,those wells responding to pumping were plotted or one Cooper-Jacobgraph. Figures K-12 through K-15 illustrate the Cooper-Jacob method foreach capture zone test. These graphs present the observed drawdown (orrecovery for a recovery test) versus the elapsed time divided by the squareof the distance from the observation well to the pumping well (t/r). Thet/r transformation should result in the graphs from different wellsoverlying each other. Failure of the graphs to overlie is related toanisotropic effects, partial penetration effects, or aquifer heterogeneities. -Table K-4 presents the drawdown (or recovery) observed in each wellduring the capture zone tests, - - -
Figure KT-12 is a Cooper acob plot, which illustrates the drawdown inSentinel wells ERM-7I_&X>, ERIV BI & B, arid ERM-9I & D during theMID-D4 test. The paired intermediate and deep wells are at approximatelythe same orientation to MID-04 and the same distance. Thus, the absolutedrawdown in the intermediate and deep wells should be identical. Thedifference in the drawdown and time it occurs, is the result of partialpenetration effects. However, all three wells exhibit a similar rate ofdrawdown (slope of the straight line portion of the curve). The slope canbe used to determine aquifer transmissivity without any partialpenetration corrections. Analysis by methods using absolute drawdown(Theis, 1935) would require partial penetration corrections.
Both anisotropy and partial penetration effects were evaluated after theinitial transmissivity calculation. The effects of horizontal anisotropy(along geologic strike versus along dip) were not observed in the data.Anisotropy and partial penetration effects were .evaluated using acomputer program ANIAQXfrom HydraLogic. By defining theconstruction details for the pumping and observation wells, ANIAQX cancorrect for partial penetration and determine the ratio of horizontal tovertical hydraulic conductivity. ANIAQX will also identify horizontalanisotropy, if present. Data from each test were input into ANIAQX foranalysis. ANIAQX evaluates several wells.at a time (i.e. intermediatewells from each capture zone well nest). However, the program wouldnot achieve an acceptable solution. This is likely the result ofheterogeneous "aquifer conditions typical of bedrock aquifers.
The representative transmissivity value determined for each test area is asfollows:
THEERMGEOUP " MIDDLETOWN-EFS.02006.OS-July 1,1996
o o« -*-,t± OJ
V «H =s> -?• > d) c^^ Q~= O<D CO OS^L
CO
THE ERM GROUP - . . . . . PM008,D7,Ol / 6 5,96
o
04
Si .4-.-S 03c
Q.<DO
UMOpMDJQ
THE ERM GROUP PMOD8J7.01 / 6 556

CO
t fill0)
a05O
S M i I i I i i I i I 1 1 I I i I 1 ''gill I I I I1M 1 TIL I I I tin IT•f- _____________-J3IL— -LIJ-_ ki——I- &
o
ip Q -LO O - - tO O--OCN CN rru . . _ • — . -
THE CRMGROW -- - . PM008.0r,01 / 6JZ5.96
P
o>
5 ® S^ —
Q.COO
o o" " -r^ "' "-:' " " O
UMOpMDJQ
THEERMGROUP ' " '' ~ ' " "' "• "" PM008.D7.01 / 62536
«£oT3
1 «H *i0 co* 2
j51« S 3Q) 0 <
3^5ffit J° >H S 1
*•!§(B *o(J TJ-c 3CJ *Sfctu(O41o
ffl
gS
i*3«— 'tu J3"*T | f j
5
•< S"S 5~ C3H *"U
1< <$
w
J_J«4-t
ou
(U
«-.co^HD
1
U-i
Cl
8S
=3^
,5o
ftQ
=3o>
o o in to LO tx Cx ix CMo r-i «4 "^ o in vO O LO
U l H - P - C / l l - H D t n i — .OCx IX. CX OO OO CO C\ ON Cv ...' lJ-1 h-Ll ' ' L*J ' 1_'| IL'|
iiliillliLT) ON ! 0*3 * CO \ LO D 32 ^ ' C M ^Q1^00^
cn KH D en HH Q oT - H r H i — i C M C M C S _ . J _ 1 J LOC N C M C M f N C M C N t ' J . ' ^ O t - l
S c a r a H S w C J O w t x i" CJ C CO D D CJ f x _O-I Ci COVD 5 5 vo cj cj t* -- 5 -CO -Co cjO C O T H O V O 1 * ! — "IN.O.OCO
i— t CO T— < CO rH
cD.-.Dcn.-HD.-jPC O C O C O ' ^ p * 5 } ' ^ H c M c S «H^-,CM CM CM CM CM CM CO CO CO *" CO1 1 1 I 1 1 1 1 I 1— I 1— I*5]>5*>2.§^Ssc^cf'1S w w p 3 w p 3 p H p t i p H O C JS i n L Q i n c o L n L O L o * t f | v o v o ' ^ H ' n c MC O m c O t N C O C M O O i - H ^ r T-I
U) I-H Q en HH Q unlf> LO LO vo \O ^D CO -^ - -CM CM rJ (M CM M *— l CM lN> _ . — _.. . _V V v V t r i T - i V c M ' 7 H c M f O ' t f i n
w w t o c S S w O t P o K s H S H S P H
Section: Appendix K.4 - - Page:" 16 of 32Date: -July'1,199cT .":.. .""~"T "V" ".. "~ ". . . ... Revision No-* 0
Eastern Area HIA-2. -- 230Cental Area " ~ ffiA-13 """ 1,100 ft2/dayWestern Area HIA-9 "" 3,200 ft2/day
, NBLArea MID-04 ..., 13Qft2/day
These transmissivity values were used in the capture zone analysis,presented in Section K.5.
K.4.2.1 - Results for MID-04 , -!±"
Figure" K-I2 presents the observed drawdown in the Sentinel wells nearMID-04.~N6 significant drawdown was'observed in other wells duringthe test. The deep wells ERM-7D, EiRM-SD, and ERM-9D each exhibit adrawdown of approximately 6Q-feet and the curves are falling on top ofeach other toward the later part of the test (after approximately 1 day). •Theiovef lying curves indicates that, on the scale that the test wasperformed, there are no observable horizontal anisotropic effects nearjVHD-04J-Also observable on the figure is the significant differencebetween the drawdown in the deep and the intermediate wells. This istypical of partial penetration effects where the pumping well is open at anelevation similar to the deep observation well. MID-04 is open from 51 to815 feet below_grade, however the screened.interval of both theintermediate and deep sentinel wells fall within this range. Based on wellconstruction, similar drawdowns in the intermediate and deep sentinelwells would be expected. Inputting the well construction information intothe ANIAQX software, the program could nqfconverge to a solution forthese pumping test data.
It appears that MID-04 is drawing water from a higher permeability zoneat the elevation of the deep sentinel wells. This is a heterogeneous aquifercondition which is not compatible with pumping test analysis models. Anaquifer transmissivity was determined for the MED-04 area using theCooper-Jacob graphs for the deep sentinel wells. An average value of 130ft /day was determined. The Cooper Jacob curves, Figure K-12, aregradually flattening out, suggesting effects of higher transmissivity areasof the aquifer or recharge boundaries influencing the drawdown.
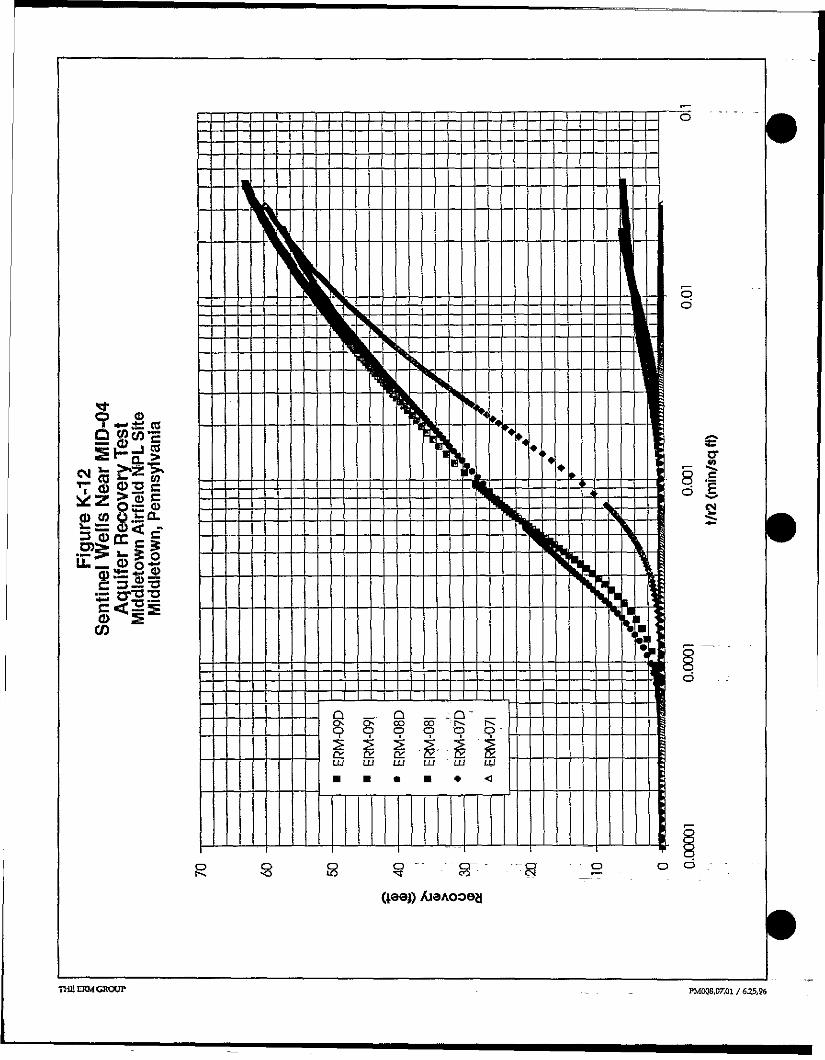
K.4.2.2 Results for HIA-2 ,- _ :
Figure K-13 pjresenlsjhe observed drawdown in wells ERM-25I, ERM-25D/ERM-26I, and ERM-26D near production well HIA-2. As discussedpreviously, the graph presents drawdown versus t/r and the data plotsshould overly each other in a homogeneous,"isotropic aquifer with a fullypenetrating purnping well.
THEERMGSOUP MIDDLETOWN-EFS.02006.08-July 1,1996
Section: Appendix K.4 Page: 17 of 32Date; July 1,1996 ~ . ". . ~ . - - ——— Revision No.: 0
From Figure K-14 and Table K-4, it can be seen that the,intermediate levelwells respond much more to pumping than the deep or shallow wells.This response demonstrated that the majority of the water for HIA-2-isbeing provided by an interval of the bedrock at or near the elevation of theintermediate wells. Evaluating the curves for ERM-25D and ERM-26D,there are two straight line portions of the curves. The later time" data wereconsidered representative of the aquifer. The possibility of the latter timedata representing an impermeable hydraulic boundary was considered,however, the change in slope of the curves from the midsection of thecurve (slope -8 feet/log cycle) to the end of the curve (~41 feet/log cycle)is too great to represent a hydraulic boundary. A single impermeable wallboundary would cause a change in slope by a factor of 2 (i.e., the 8 -feet/log cycle would become 16 feet/log cycle). A change this largewould also require a completely impermeable boundary, there is noevidence that such a boundary is present. To achieve the change in slope ..__from 8 feet/log cycle to 41 feet/log cycle would require very lowpermeability boundaries almost surrounding HIA-2. Thus, the later timedata were considered representative of the.aquifer in the vicinity of HIA-2.Using the slope of 41 feet per log cycle, the aquifer transmissivity in thearea of HIA-2 is estimated to be 230 ftVday (1,700. gpd/ft).
The curves for ERM-25D and ERM-26D exhibit similar slopes, however, ifthe curve for ERM-25I was extended it could be seen that an equivalentdrawdown in ERM-26I would occur slightly earlier than in ERM-25L Thissuggests a very slight anisotropy with the aquifer transmissivity in thedirection of ERM-26I, along strike, approximately 20% greater than thetransmissivity in the direction of dip.
K.4.23 Results for HIA-13
Figure K-14 presents the observed drawdown in wells ERM-23I, ERM-23D, EKM-24I, ERM-24D, ERM-32I, and ERM-32D near production well ,_.HIA-13. The greatest drawdown was observed in the deep wells closest toHIA-13, ERM-24D and ERM-23D. Contrary to the expected response ofgreater drawdown in the direction of bedrock strike compared to thedirection normal to strike; ERM-24D, located normal to strike, drewdownmore than ERM-23D which is located along strike. Thesignincance of thisobservation is two-fold. First, there is no evidence of the expectedanisotropic conditions. Second, as observed in the other tests, theresponse to pumping is influenced by heterogeneous conditions.
Using the graphs shown on Figure K-15, an aquifer transmissivity valuewas calculated for the area of HIA-13. jHie straight lineportion of the
THE EHM GROUP MIDDLETOWN-FFS. 02006 J»-July 1,1996
Section: Appendix K, 4 - - - " • Page":" IS of 32Date: .. July 1,1996. .... - .'...., '. • • , 1- - - - - - .------•- -- - -• - • - RevisionNo.: 0.
curves analyzed on Figure K-15.was the mid portion, the steepest line.This selection was made by eliminating the alternative straight lineportipn_pf the curve, the late time data. Matching the late time data yieldsa very large transmissivity, approximately 8,000 ft2/day (60,000 gpd/ft).HoweserTTf this value was representative of the aquifer; the specificcapacity of the HIA-13, calculated from the following relationship, wouldbe approximately 3D. gpm /ft.
Q/s = T72000. " '"'•""" :V;::: (Driscoll, 1986)
where ._ :Q/s specific capacity (gpm/ft)T = transmissivity (gpd/ft)
Based on this relationship, the drawdown in well HIA-13 would beapproximately 14 feet at the pumping test rate of 430 gpm. Thisdrawdown is less than observed in ERM-24D which is locatedapproximately 100 feet from HIA-13. Thus, the transmissivity calculatedfrom the later time data is not a reasonable value. The flattening of thedrawdown curve in the late time data is likely related to the influence ofthe Susquehanna River acting as an aquifer recharge boundary.
The middle sections of the Cooper-Jacob curves were analyzed for aquifertransmissivity. Trie average of the transmissivity values using ERM-23D,ERM 24I,.ERM-24D, ERM-32I, and Effi-32DTERM-23I was not includeddue to limited data in the straight-line mid-section of the graph) was 1,100 .ft2/day (8,100 gpd/ft). ~ _ '.'__.
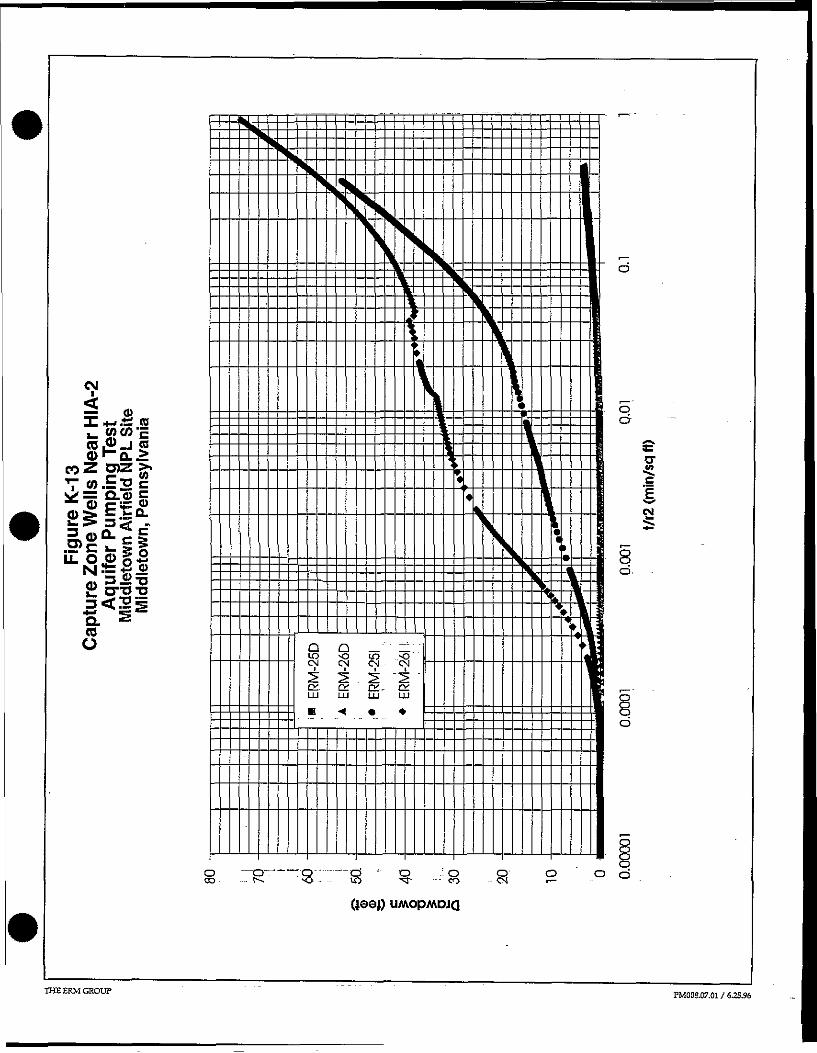
K.4.2.4 Results for HIA-9FigureJGlS presents the observed ..drawdown in wells ERM-21I, ERM- -21D, ERM-22I and ERM-22D near production well HIA-09. The later timedata appears to be influenced by cyclic pumping in the area, the pumpingsource was not identified but could possibly be the HVAC well HLA-14.The observation wells near HIA-09 exhibited significantly less drawdownthan was observed in the other pumping tests. This demonstrates asignificantly_greater aquifer transmissivity in this area. The curves forERM-22I and ERM-22D exhibit similar slopes and the drawdown in ERM-221 lags the drawdown in ERMr22Dz consistent with partial penetrationeffects. An aquifer transmissivity of 3,200 ff /day was determined forERM-22I and ERM-22D. In contrast, the drawdown observed in ERM-21Iand ERM-21D are significantly different. ERM-21D has no measurableresponse to pumping HIA-09, although another well appears to beinfluencing its water levels. ERM-21I exhibits a "nice" pump test curve.
THE ERM GROUP - ' MZDDLETOWN-FFS.02006.06-J«]y 1,199S

Section: Appendix K.4 Page: 19 of 32Date; July 1,1996 Revision No.: 0
However, the late time slope is significantly less than observed at ERM-22Iand ERM-22D. As discussed previously, the Cooper-Jacob drawdownplots for a pumping test in an anisotropic aquifer should provide the sameslope, i.e. transmissivity in all directions. Thus, the difference in slopebetween ERM-21I and ERM-22I does not indicate anisotropy. Also, ERM-211, located along bedrock strike, has less drawdown than ERM-22I,located down dip. It was anticipated prior to the test that the aquiferwould be more conductive along strike. If this were true, EpM-211 shouldhave drawn down more than ERM-22L The difference in responsebetween the wells in the ERM-21 and ERM-22 well nests is the result ofheterogeneities in the aquifer and not due to anisotropic conditions.
K.4.2.5 Comparison of Results with 1961 USGS ReportIn 1961, the USGS published a report, Ground-Water Resources ofQlmsted Air Force Base. Middletown. Pennsylvania. This reportsummarized the results of pumping tests performed in 195.9 on wells Da-78 in the NBL Area (referred to as the Warehouse Area in the USGS ,Report), Da-81 (HIA-2) in the Eastern Area, Da-92 (HIA-13) in the CentralArea, and Da-90 (HIA-11) in the Western Area.
Well Da-78 in the NBL Area (Fruehauf and Gulf Oil Corporation) waspumped at 25 gpm for approximately 30 hours. The USGS evaluation ofthis pumping test yielded a transmissivity of 170 ft2/day (1,250. gpd/ft).This value compares well with the 130 ft2/, day transmissivity value for theMID-04 pumping test.
The USGS divided the Main Base into the same areas designated for theSSI, the Eastern, Central, and Western Areas.
In the Eastern Area, well Da-81 (HIA-2) was pumped at 200 gpm for 859minutes. Wells HIA-1, HIA-3,. and HIAr4were used as observation wells.The following" table summarizes the USGS results in the Eastern Area:
distance from
WellHIA-1 Pa-80)HIA-2 Pa-81)HIA-3 Pa-82)HIA-4 (Da-83)
HIA-2(ft)3250.5325630
— drawdownffO
- - .5._6 .90
_ 0.6_ 6.5 7
T(ft /dav")3,9Qp :
25,000 _
T(gpd/fO29,000 ..
THEEKMGRODT' " ""MJ5DLETOWfJ-FFS.02006.b8-July 1/1996
Section: Appendix K»4 - Page: 20 of 32Date: July 1,1996 " . . . . . . . -"- ••- — ~ - -- RevisionNo,: 0
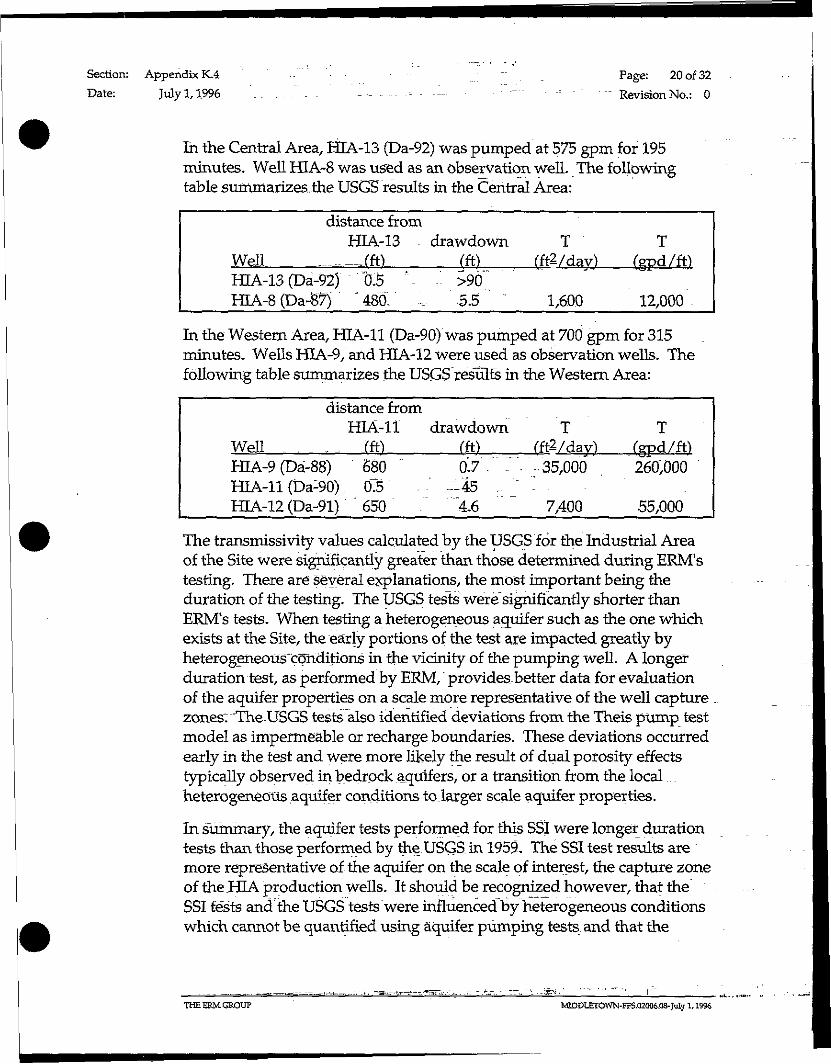
In the Central Area, HIA-13 (Da-92) was pumped at 575 gpm for 195minutes. Well HLA-8 was used as an observation well. The followingtable summarizes.the USGS results in the Central Area:
Well
distance fromHIA-13
-_-— fft)HIA-13 (Da-92) 0.5 '-HIA-8 (Da-87) ' 485. "-
drawdown(ft).
- >90•5.5 ~
T(fWdav)
1,600
T(gpd/ft)
12,000 -
In the Western Area, HIA-11 (Da-90) was pumped at 700 gpm for 315minutes. Wells HIA-9, and HIA-12 were used as observation wells. Thefollowing table summarizes the USGS res'ults in the Western Area:
distance fromHIA-11
Well . . . (ft)HIA-9 (Da-88) 680HIA-11 (Da-90). 03 .HIA-12 (Da-91) "650 .
drawdown(ft)07 -
-' -45 - "4.6
T(ft2/dav)-35,000
7,400
T(gpd/ft)260,000
55,000
The transmissivity values calculated by the USGS for the Industrial Areaof the Site were significantly greater than those determined during ERM'stesting. There are several explanations, the most important being theduration of the testing. The USGS tests were significantly shorter thanERM's tests. When testing a heterogeneous aquifer such as the one whichexists at the Site, the early portions of the test are impacted greatly byheterogeneous'ccjnditions in the vicinity of the pumping well. A longerduration test, as performed by ERM, provides,better data for evaluationof the aquifer properties on a scale more representative of the well capturezones; "The USGS tests also identified deviations from the Theis pump testmodel as impermeable or recharge boundaries. These deviations occurredearly in the test and were more likely the result of dual porosity effectstypically observed in bedrock aquifers, or a transition from the localheterogeneous aquifer conditions to.larger scale aquifer properties.
In s"urnrnary, the aquifer tests performed for this SSI were longer durationtests than those performed by the. USGS in 1959. The SSI test results aremore representative of the aquifer on the scale of interest, the capture zoneof the HIA production wells. It should be recognized however, that theSSI tests and the USGS tests were influenced by heterogeneous conditionswhich cannot be quantified using aquifer pumping tests and that the
THE EEMGROUF MEDDLETOWN-FFS.02006.0a-JuIy 1,1996
Section; Appendix K.4 Page: 21 of 32Date: July 1,199.6 , . Revision No.: 0
aquifer properties generated by testing in this aquifer will be roughestimates of the aquifer properties.
K.4.2.6 SummaryThe results of the pumping tests provided good estimates of the aquifertransmissivity in the Industrial Area and the North Base Landfill Area.Due to heterogeneous conditions, aquifer storage coefficients andhorizontal to vertical anisotropy could not be determined. The lack ofstorage coefficients will not interfere with quantitative analysis of theaquifer since the capture zone evaluations to be performed are based onsteady-state models and do not require storage coefficient as a modelinput parameter. The lack of a horizontal to vertical anisotropymeasurement will complicate future 3-dimensional modeling as this ratiois important to evaluating the 3-dimensional influence of the pumpingwells. , . - ." .
The pumping test results demonstrate that the transmissivity of thebedrock aquifer is increasing moving from "the North Base Landfill Areatoward the Industrial Area and from east to west. The Western Areaexhibited an aquifer transmissivity approximately 25 times greater thanthe North Base Landfill Area. This is likely the result of increasedfracturing in the bedrock in the Western Area. "
During the planning of the pumping test, it was anticipated thatanisotropic conditions would be observed, i.e. that a greater drawdownwould be observed in the direction, of bedrock strike (approximately N 43E) verses the direction of dip. Observation wells were installed alongstrike and along dip to monitor this effect.; However anisotropic .conditions were not indicated by the aquifer testing. The lack of evidenceis attributed to heterogeneous conditions within the bedrock aquiferwhich may have masked anisotropic effects if they exist.
On a regional scale, anisotropic conditions may effect ground water flow,however, the pumping tests performed could not identify these effects.The HIA-2 test results suggested that jsome anisotropy may exist in the -Ea'stem Area with an anisotropy ratio of approximately 1,2:1." However,test data _from the Central Area (HIA-13) indicated that the transmissivityin the direction normal to strike was greater than albngstrike (ERM-24Ddrewdown more than ERM-23D), exactly the opposite of what wasexpected.
THEERMCSQUP ^ - -^ .,. -• - - •, gfgJQy pjjg .O2<5&;b8-"july 1,1996
Section: AppendixKS "- .. - *- = - -=•- -j =-_ - ; ;; ._. __ . . ; Page: 22of32Date:. . --July 1,1996" . ._ . . ,— . --- . . . - . - - RevisionNo,: 0
K.5 CAPTURE ZONE-ANALYSIS
This section presents the capture zoiie analysis. The objective of thisanalysis was to determine the .capture zones of HIA production wells,HIA-1 through HEA-14 and the jMiddletown Borough Wells, MID-01through MID-05,.for different pumping scenarios. Determination of the .capture zones is useful for evaluating the potential impact of sitecontamination on these wells.
Since the quantity of ground water withdrawal in this area is a significantportion of the total available water resources within the watershed andgiven that.there are multiple pumping wells, the conventional analyticalmethod could not adequately determine the capture zones of theseproduction wells. A more advanced regional ground water modelingmethod was used to determine these capture zones. The TWODAN™model employed in this analysis is similar to WhAEM™ which wasdeveloped by the USEPA for.well head protection.
K.5.1 - CONCEPTUAL MODEL -
The first step in developing the ground water flow model was to constructa conceptual model. Regional and site-specific geologic, hydrogeologic,and climatic information were analyzed, generalized, and simplified tocreate the conceptual model.
The conceptual model for the regional aquifer that surrounds the,Middletown Airfield was based on the following:
1. The modeling region encompasses the site area and the surroundingwatersheds. It covers an area of approximately 20,000 feet by 20,000 .feet. Within this region, the largest water table.yariation isapproximately 150 feet (280 to~43.0 feet AMSL), The ratio between thelargest water table variation to the area extent is less than 1 percent.The regional ground water flow is approximately two-dimensionaland can be simulated by a two-dimensional ground water flow modelfor the purpose of capture zone determination.
2. Based on published geologic data, the regional aquifer (GettysburgFormation) within the modeled area was developed under a similar
THE ERM GROUP - MTODLETOWN-FFS.02006.08-jLiiy 1,1996
Section: Appendix KJ Page: 23 of 32Date: July 1,199.6 ~. _'. "" - - Revision No.: 0
geological setting and experienced similar weathering and erosionconditions. As a result, the aquifer has generally similar hydrauliccharacteristics on the regional scale, and it is reasonable to assume arelatively uniform aquifer transmissivity for the entire region, exceptfor the Industrial Area of the Site and the Susquehanna. River, wherealluvial sediment and secondary bedrock porosity produce a higheraquifer transmissivity. Transmissivity values in the Industrial Area ofthe Site generally increase from east to west. The model simulatesthis variation in transmissivity as derived from the capture zone tests(discussed in Section K.4).
3. The predominant source of ground water is infiltration fromprecipitation. Ground water generally flows toward surface waterbodies, such as streams, ponds, and rivers, which have measurablesurface water elevations. These surface water levels and infiltrationrates control the elevation of the ground water table. On the regionalscale, it is reasonable to assume that the infiltration rate is relativelyuniform over the entire area. . _ -
4. The capture zone tests conducted at the Site found that the aquifertransmissivity is relatively consistent in different orientations, thusthe model assumes isotropic conditions.
The conceptual regional ground water flow model for the MiddletownAirfield Site was constructed as a two-dimensional isotropic aquifer that isrecharged by uniform areal infiltration and that discharges to and isconstrained by surface water features with constant surface water levels.The flood, plain along the Susquehanna River has a higher aquifertransmissivity than the upland area of the regional model. The model wasbased on average annual conditions, and all input parameters and outputresults represent annual average values.
K.5.2 MODEL SELECTION
The ground water model TWODAN™, developed by Dr. C. Fitts, wasselected for this modeling effort. TWODAN is an analytic element modelthat is based on the theory of the "Analytic Element Method" described byStrack (1589). The analytic element model was originally developed byDr. O. Str.ack for_regional ground water flow modeling. There are severalmodels commercially available that are. based on the analytic dementmethod. These include QuickFlow™ by Geraghty andJMiller; Inc.WhAEM™ by the USEPA and Strack, TWODAN by Fitts, GFlow™ by Dr.
THE ERM GROUP.
Section: Appendix K.5 ,° ' . " " " „ ' " Page: 24 of 32Date: July 1,1996- ^-^ - —= ~-:- —= - - 7- --- -_ --_ --- - —~ RevisionNo.: 0
H. -Haitjema/and SLAEM™ and MLAEM™ by Strack. Analytic elementmodels have been applied by the industry and regulatory agencies toenvironmental sites since the mid 1980s, and have gained popularity andrecognition due to the speed of model development and revisions.
The analytic element model is able to provide accurate and continuoussolutions over an infinite flow domain in two dimensions. The modelincorporates site specific information obtained from the pumping tests,such as inhomogeniety in hydraulic conductivity and aquifer thickness. Itis also capable of simulating ground water recovery systems such as wells,trenches, and slurry walls.
K3.3 MODEL SETW> AND INPUT PARAMETERS
The TWODAN model of the Site included the following analytic elements.The surface water, streams were simulated by constant-head linesinks inthe model. The production wells were simulated by discharge-specifiedwells. The higher transmissivity areas _wer£ simulated as heterogeneityfeatures. The regional infiltration was simulated by the circular rechargefeature. .... .: - - -- - - - - - - —•-
The surfacewater discharge control points for the regional model wereobtained from USGS quadrangle maps. The drainage basins surroundingthe site area were included in the development of the regional model. Theactual model covers an approximate area of 20,000-feet by 20,000 feet.
K.5.3.1 Model Input Parameters
Transmissivity values were obtained from pumping test results. Theproduction wells HIA-2 and MID-04 yielded aquifer transmissivities of130 to 230 square feet per day, that reflect the Gettysburg Formation,whereas HIA-9 and HLA-13 yielded aquifer transmissivities of 3,200 to1/OOQ square it et per day, that reflect the Susquehanna River channel. Theregional aquifer transmissivity in the model was assigned to 230 squarefeet per day. A heterogeneity element with a transmissivity value of 3,200square feet per day was placed along the Susquehanna River channel toaccount for the higher transmissivity of river channel sediments.
The reasonable rarigerof the annual average area! infiltration wasestimated based on a water budget that accounted for precipitation,surface runoff, evapotranspiration, and infiltration. The average annual
THE ERM GROUP . " MIDDLETOWN-ITSJ2006-OS-Ju]y 1,1996
Section: Appendix K3 ~ Page: 25 of 32Date; July 1,1996 - - "~ _ ;• -_ RevisionNo.: 0-
precipitation for the Harrisburg area is approximately 44 inches per year __(Chow, 1964). Normal annual runoff for the region is approximately 20inches per year (Linsley, 1979). An estimate of annual averageevapotranspiration was determined from climatological data to beapproximately 12 inches per year (Linsley, 1979). Based on a regionalwater balance, the annual average infiltration rate is approximately 12inches per year. The reasonable range of the annual infiltration rate .wasdetermined as 6 to 18 inches per year, roughly 50% off the estimatedaverage value.
During model simulation of the well capture zones, the pumping rates of"HIA production wells and Middletown Borough wells were based on theannual average pumping rates. Table K-5 presents the annual averagepumping rates of the HIA production wells for 1990 through 1995. Since "the pumping configuration of the HIA production wells varies, theaverage over the 5 year period was used as a representative annualaverage. The Middletown production wells MID-01, MID-Q2, MID-Q3,MID-04, and MID-05 operate at relatively consistent rates. Therefore thepumping rates of the Middletown Borough wells were based on theannual average rate in 1990 (GeoServices Ltd., 1992). The model inputparameters and the average pumping rates for all the production wells arepresented in Table K-6. _. . ..'"-. '-.... :.!._. _ :
K.5.4 MODEL CALIBRATION .........
The regional ground water flow model simulates ground water flow fromthe point of infiltration to the point of discharge to surrounding surfacewater bodies. The natural water table profile is approximately a paraboliccurve with the apex at the center of the watershed. Once the aquifertransmissivity and surrounding surface water levels are determined, thewater table profile rises or falls as the assigned regional infiltration rate isincreased or decreased. The model calibration process was accomplishedby adjusting the infiltration rate until the simulated water table elevationsmatch the known (measured) elevations/ The calibration criteria wereestablished as:1. the relative average difference of modeled and measured water tables
should be less than 10%; and —
2, the calibrated infiltration rate should be within the estimatedreasonable range. ~ ———— _;.-
THE EBM CROUP MromETOWN-FFS.Q2006.08-July 1,1996

Table K-5HIA Production Well Data
Middletown Airfield NPL Site
WellHIA-1 -HIA-2 -HIA-3 "ffiA-4HIA-5HIA-6HIA-9HIA-11HIA-12HIA-13HIA-14
Average Gallons per Day1990*21,405.540,346.812,157556:2
15,816.7116,405.526,457.577,515.1139,279.5323,202.5230,843.8
199163,75979,2055,926504
28,94292,4792U5396,984131,293335,877282,781
19-9241,94272,38011,889
5634,120108,228
12164,967145,758247,792218,661
19933635167,25583575
23,578100,18728,741171,521108,575258,500182,551
199464,25672,474
0731
13,2895146410,833124,252129,420313,991201,074
1995 -49,65867,598
7380731
115,44124,565114,795168,390197,645236,0.88
5-year a g46,22966,5435,147334
19,41397,31718,627125,006137,119279,501225,333
Note: 1990 data for partial year. WTP on-line May 1990.
WellHIA-1HIA-2 -- -HIA-3HIA-4HIA-5HIA-6HIA-9HIA-11HIA-12 „HLA-13 ....HIA-14
Average Gallons per Minute1990* :.":-
14.928.08.40.411.080.818.453-896.7224.4160.3
199144.355.04.10.420.164.214.767.491.2233.2196.4
199229.150.3830.023.775.20.0
114.6101.2172.1151.8
199325.246.70.60.116.469.620.0119.175.4179.5126.8
199444.650.30.00.59.235.57.586389.9218.0139.6
199534546.90.1
. 0.10.580.217.179.7116.9137.3164.0
5-year avg32.146.23.60.213.567.612.986.895.219-4.1156.5
Note: 1990 data for partial year. WTP. on-line May 1990.
THEERMGROUP " " - - - - - - - ^ MTDDLETOWN-FFS-02006.0S-July 1,1996
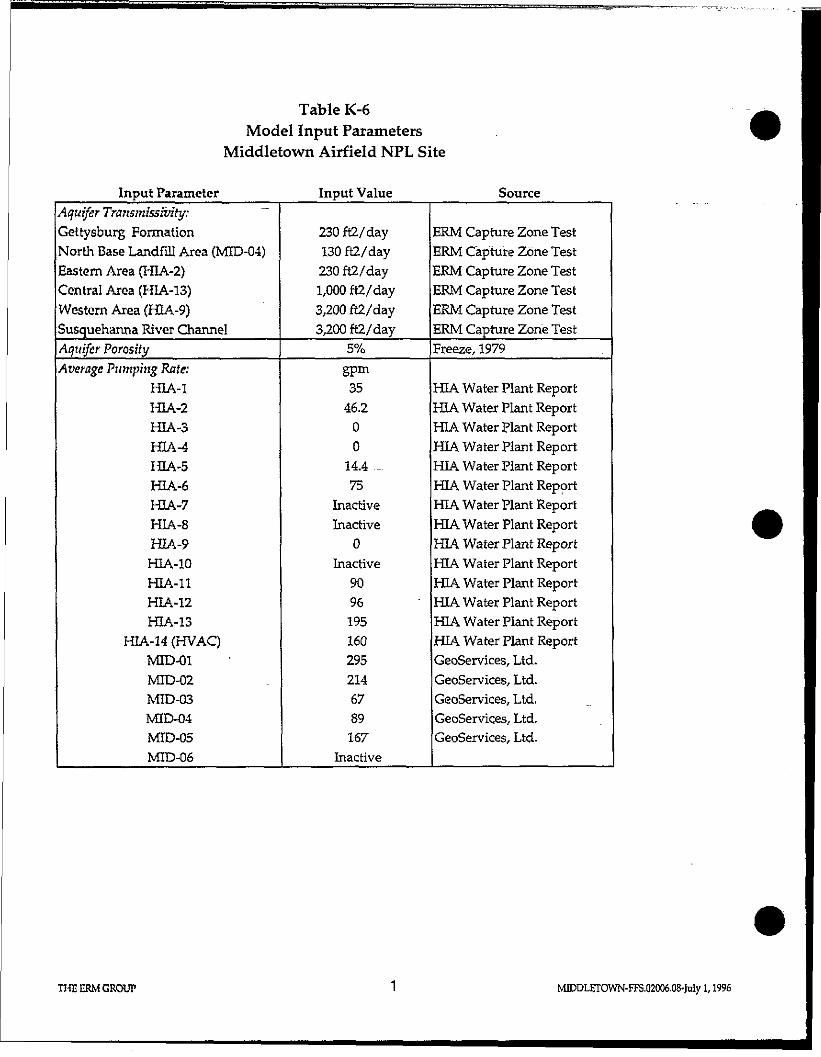
Table K-6Model Input Parameters
Middletown Airfield NPL Site
Input Parameter Input Value SourceAquifer Transmissivity:Gettysburg FormationNorth Base Landfill Area (MID-04)Eastern Area (HIA-2)Central Area (HIA-13)Western Area (HIA-9)Susquehanna River ChannelAquifer PorosityAverage Pumping Rate:
HIA-1HIA-2HIA-3HIA-4HIA-5HIA-6HIA-7HIA-8HIA-9H1A-10HIA-11HIA-12HIA-13
HIA-14 (HVAC)MID-01MID-02MID-03MID-04MID-05MID-06
230 ft2/day130 ft2/day230 ft2/day1,000 ft2/day3,200 ft2/day3,200 ft2/day
5%gpm3546.20014.4 ...75
InactiveInactive0
Inactive90961951602952146789167
Inactive
ERM Capture Zone TestERM Capture Zone TestERM Capture Zone TestERM Capture Zone TestERM Capture Zone TestERM Capture Zone TestFreeze, 1979
HIA Water Plant ReportHIA Water Plant ReportHIA Water Plant ReportHIA Water Plant ReportHIA Water Plant ReportHIA Water Plant ReportHIA Water Plant ReportHIA Water Plant ReportHIA Water Plant ReportHIA Water Plant ReportHIA Water Plant ReportHIA Water Plant ReportHIA Water Plant ReportHIA Water Plant ReportGeoServices, Ltd.GeoServices, Ltd.GeoServices, Ltd.GeoServices, Ltd.GeoServices, Ltd.
THE ERM GROU? 1 NUDDLETOWN-FFS.02006.08-July 1,1996
Section: AppendixK.5 .", ~ ' ",-~".,—,., ..;_.-. .._. -—.,.. ..,:__.._„,._/ _"_ Page: 26of32Date: .... July 1,1996 ""V : _ : _ _ :1 ^\ .'; .". . ;" .: : RevisionNo.: 0
The model was calibrated to simulate the water level conditions observedin the SSL Water level measurements collected on 8 May 1995 were usedto represent calibrated conditions. The configuration of the HIAproduction wells on 8 May 1995 was simulated in addition to thepumping ofaH _5 MdcyetowrvBorough wells. The average daily pumpingrate for this date were used in the model simulation. The active HIAproduction wells included HIA-1 (107 gpm), HIA-6 (282 gpm), HIA-12 (41gpm) HIA-13 (243 gpm), and HIA-14 (185 gpm). Model calibration wasperformed by adjusting the hydraulic parameters of the aquifer, such ashydraulic conductivity and the recharge rate, in order to achieve a relativefit to observed conditions.
FigureKrl'6 presents"simulated ground water contours for theMiddletown Airfield .Site based on the calibrated ground water flowmodel. The figure illustrates the change in hydraulic gradient between theregional Gettysburg Formation and the Susquehanna River channel. Thisgradient change is a direct result of the difference in aquifertransmissivites between these two formations.
Pumping from the production wells causes a departure from 2-dimensional flow conditions in the vicinity of the pumping wells, sincepumping induces downward vertical flow near the well. Thus, the modelcould not accurately simulate water levels from some shallow observationwells located in the vicinity of pumping wells. For this reason, dataobtained from several shallow monitoring wells was not used for modelcalibration. Table K-7 compares the modeled vs. the measured watertables. The average "difference between the modeled and the measuredwater table is 3.1 feet.
The relative average difference between the modeled and the measuredwater table is about 3%. The calibrated average regional infiltration rate is12 inches per year which is within the previously estimated reasonablerange of 6 to 18 inches per year. The constructed model surpassed therequirement of the predetermined calibration criteria and is suitable for ..further simulation and prediction.
K.5.5
The sensitivity of the TWODAN model to changesln aquifer parameterswere evaluated by reviewing changes in the absolute elevation of theground water table. IhejDarameters critical to the regional model
THE ERM GROUP"""" " " ~ MIDDLETOWN-FFS.02006 8- July 1, 1*6
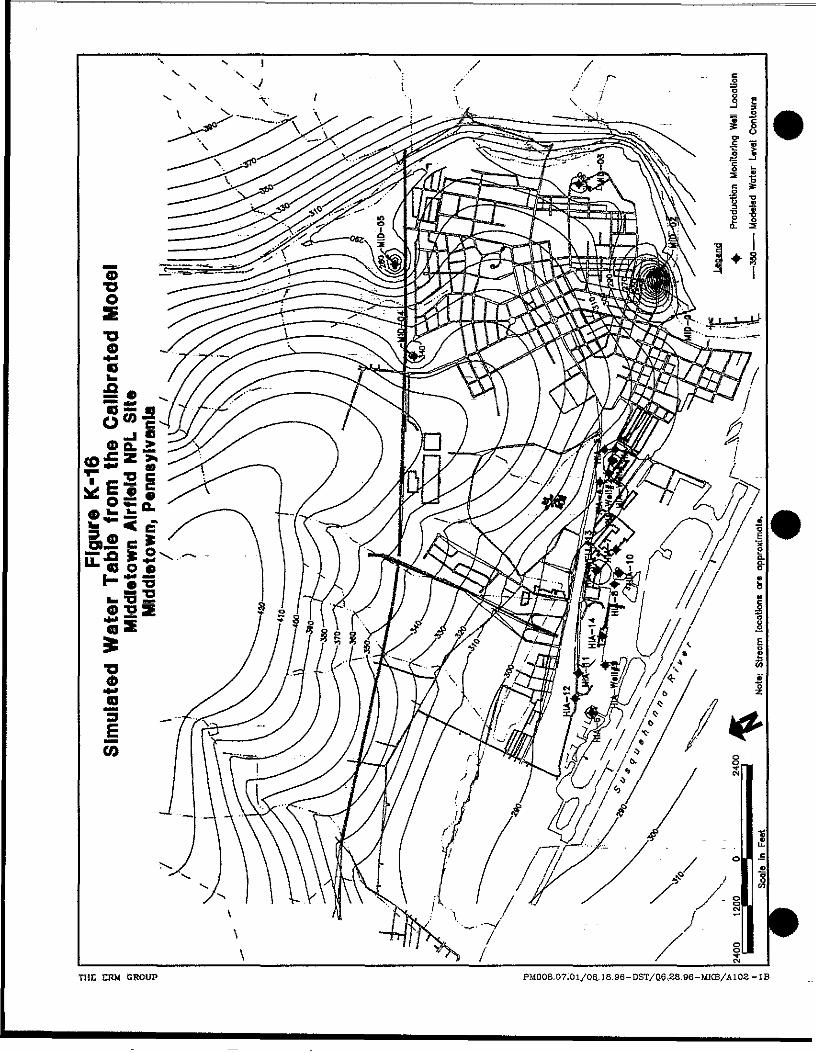
=•85
•THE CTO4 GROUP PM008.07.Ol/06.16.96-DST/06.28.96-MKB/A102-IB
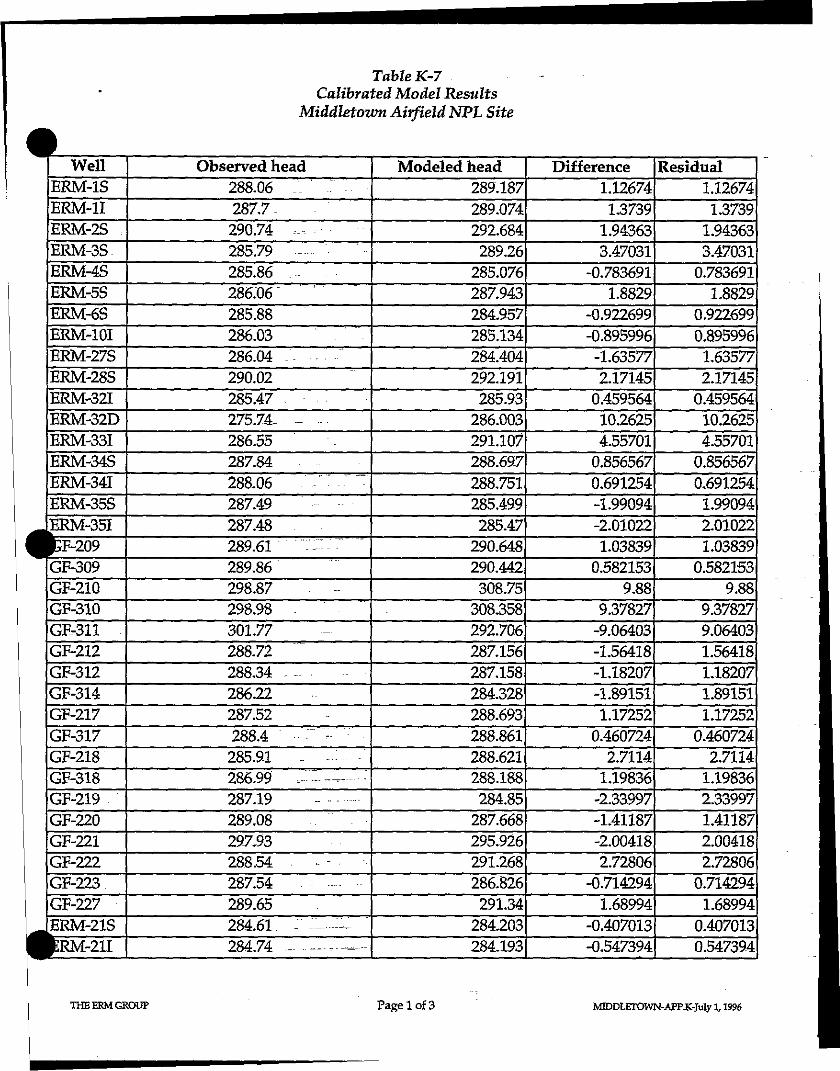
Table K-7Calibrated Model Results
Middletown Airfield NPL Site
1 WellERM-1SERM-1IERM-2SERM-3SERM-4SERM-5SERM-6SERM-10IERM-27SERM-28SERM-32IERM-32DERM-33IERM-34SERM-34IERM-35SERM-35IPF-209GF-309GF-210GF-310GF.311GF-212GF-312GF-314GF-217GF-317GF-218GF-318GF-219GF-220GF-221GF-222GF-223GF-227ERM-21SPERM-211
Observed head288.06 - — -287.7-290.74 - -• - "285.79 --..285.86286,06285.88"286.03286.04 -- -290.02285.47 .275.74 - -.286.55287.84288.06 " . - " .287.49287.48289.61 •"::::'289.86298.87298.98301.77288.72288.34 - -286.22287.52288,4 -~ *-285.91 - -.:-286.99 ™-^---287.19289.08297,9328.8.54 .287.54 - .---289.65284.61 - -- .-.-—284.74 ... ..- -- ——
Modeled head289.187289.074292.684289.26285.076287,943284,957285.134284.404292.191285.93286.003291.107288.697288.751285.499285.47290.648290.442308.75308.358292.706287.156287.158284.328288.693288.861288.621288.188284.85287.668295,926291.268286.826291.34284.203284493
Difference1.126741.37391.943633.47031
-0.7836911.8829
-0.922699-0.895996-1.635772.171450.45956410.26254.557010.8565670.691254-1.99094-2.010221.038390.582153
9.889.37827-9.06403-1.56418-1.18207-1.891511.172520.4607242.71141.19836-2.33997-1.41187-2.004182.72806
-0.7142941.68994
-0.407013-0.547394
Residual1.126741.37391.943633.470310.7836911.8829
0,9226990,8959961.635772.171450.45956410.26254.557010.8565670.6912541.990942.010221.038390.582153
9.889.378279.064031.564181.182071.891511.172520.4607242.71141.198362.339971.411872.004182.728060.7142941.689940.4070130.547394
«!
THE ERM GROUP Page 1 of 3 MTODLETOWN-AFP.K-July 1,1996
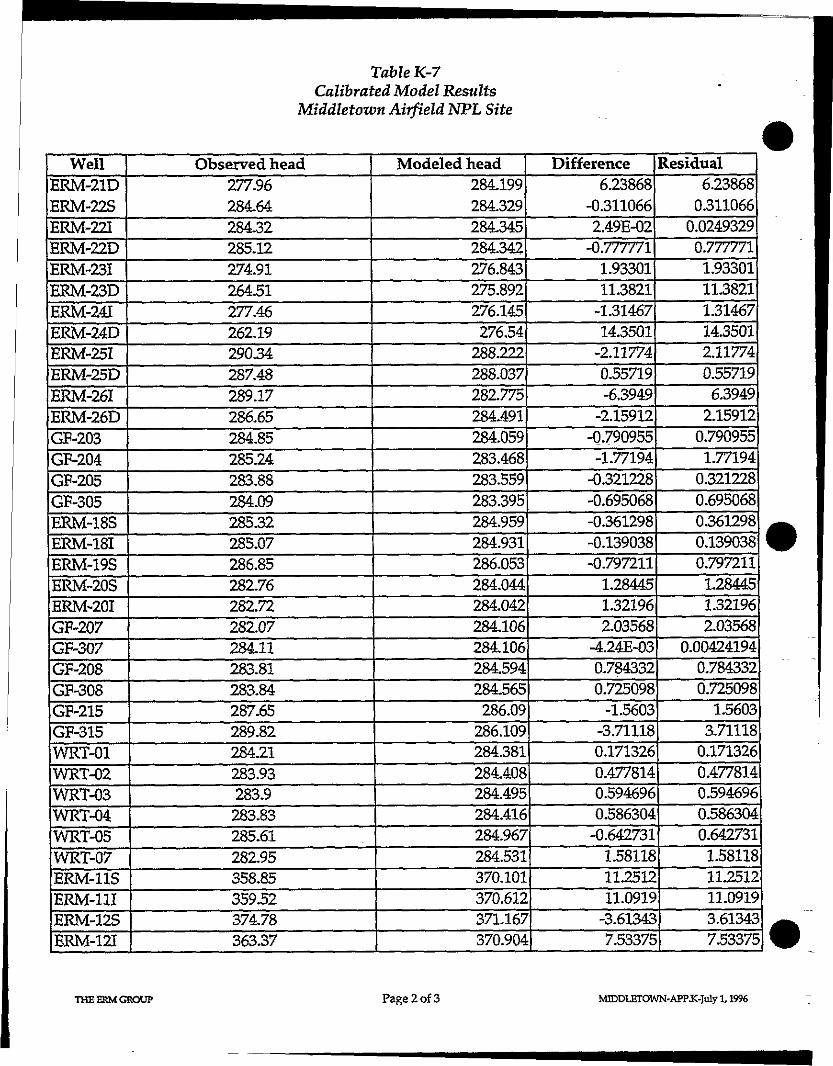
Table K-7Calibrated Model Results
Middletown Airfield NPL Site
WellERM-21DERM-22SERM-22IERM-22DERM-23IEKM-23DERM-24IERM-24DERM-25IERM-25DERM-26IERM-26DGF-203GF-204GF-205GF-305ERM-18SERM-18IERM-19SERM-20SERM-20IGF-207GF-307GF-208GF-3Q8GF-215GF-315WRT-01WKT-02WRT-03WRT-Q4WRT-05WRT-07ERM-11SERM-11IERM-12SERM-12I
Observed head277.96284.6428432285.12274.91264.51277.46262,1929034287.48289.17286.65284.85285.24283.88284.0928532285.07286.85282.76282.72282.07284.11283.81283.84287.65289.82284 1283.93283.9283.83285.61282.95358.8535952374.78363.37
Modeled head284199284329284.345284.342276.843275.892276.145276.54288.222288.03728X775284,491284.059283.468283.559283.395284.959284.931286,053284.044284.042284.106284.106284.594284565286.09286.109284.381284.408284.495284.416284.967284.531370.101370.612371.167370.904
Difference6.23868
-0.3110662.49E-02-0.7777711.9330111.3821-1.31467143501-2.117740.55719-63949-2.15912-0.790955-1.77194-0321228-0.695068-0361298-0.139038-0.7972111.284451.321962.03568
-424E-030.7843320.725098-1.5603-3.711180.1713260.4778140.5946960.586304-0.6427311.5811811.251211.0919-3.613437.53375
Residual6.2386803110660.02493290.7777711.933011138211.3146714.35012.117740.557196.39492.159120.790955L771940.3212280.69506803612980.1390380.797211L284451321962.03568
0.004241940.7843320.7250981.56033,711180.1713260.4778140.5946960.5863040.6427311.5811811.251211.09193.61343753375
THE ERM GROUP Page 2 of 3 NCDDLETOWN-AFPX-July 1,1996
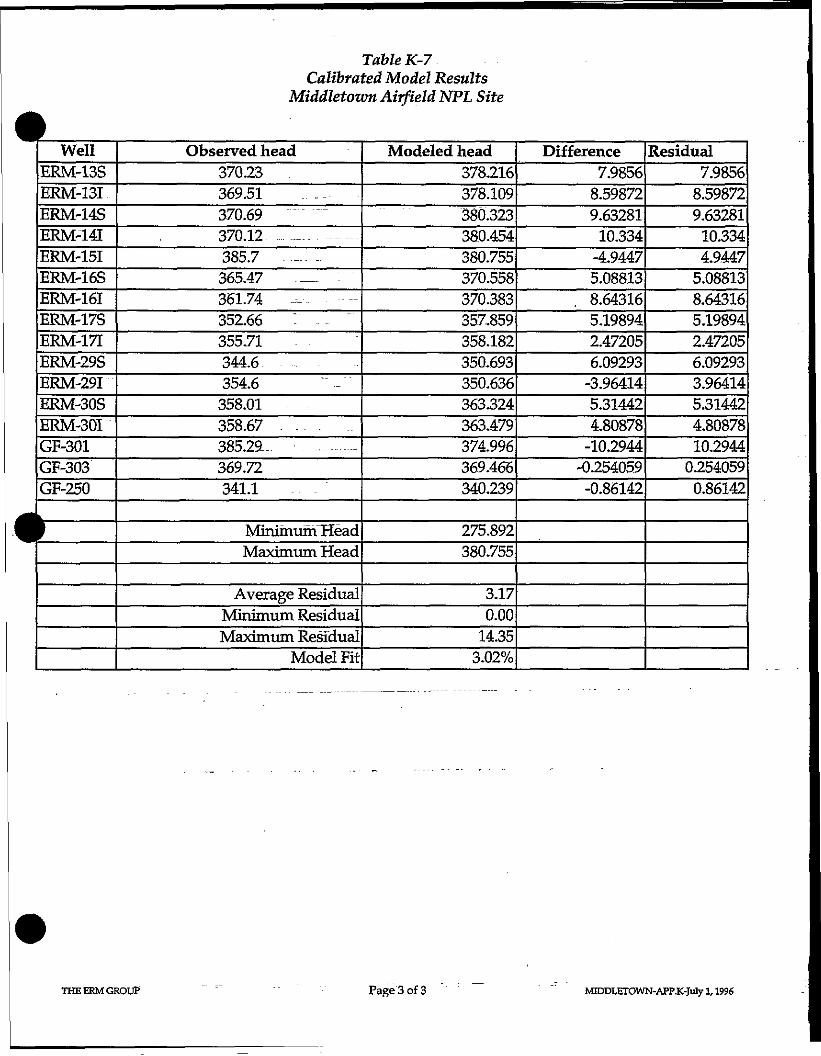
Table K-7Calibrated Model Results
Middletown Airfield NPL Site
WellERM-13SERM-13IERM-14SERM-14IERM-15IERM-16SERM-16TERM-17SERM-17IERM-29SERM-29IERM-30SERM-30IGF-301GF-303GF-250> —
Observed head370.23 .369.51370.69 ~ ~370 12385.7 - - - - - -365.47 ._ :361,74 - ---352.66 :355,71344.6 . ... .3546358.01358.67 . ... . ....385 29369.72341.1 - -
MinimumHeadMaximum Head
Average ResidualMinimum ResidualMaximum Residual
Model Fit
Modeled head378,216378.109380.323qcn 454380.755370.558370383357,859358.182350.693350,636363324363.479374 996369.466340.239
275.892380.755
3.170.0014353.02%
Difference7.98568.598729.63281m 334-4.94475.08813
. 8.643165.198942.472056.09293-3.96414531442480878-1 0 2944-0.254059-0.86142
Residual7.98568.598729.63281in 334.494475.088138.643165.198942.472056.092933.964145314424808781099440.2540590.86142
THEERMGROUP " = Page'3 of 3 " MIDDLETOWN-APPJK-July 1,1996
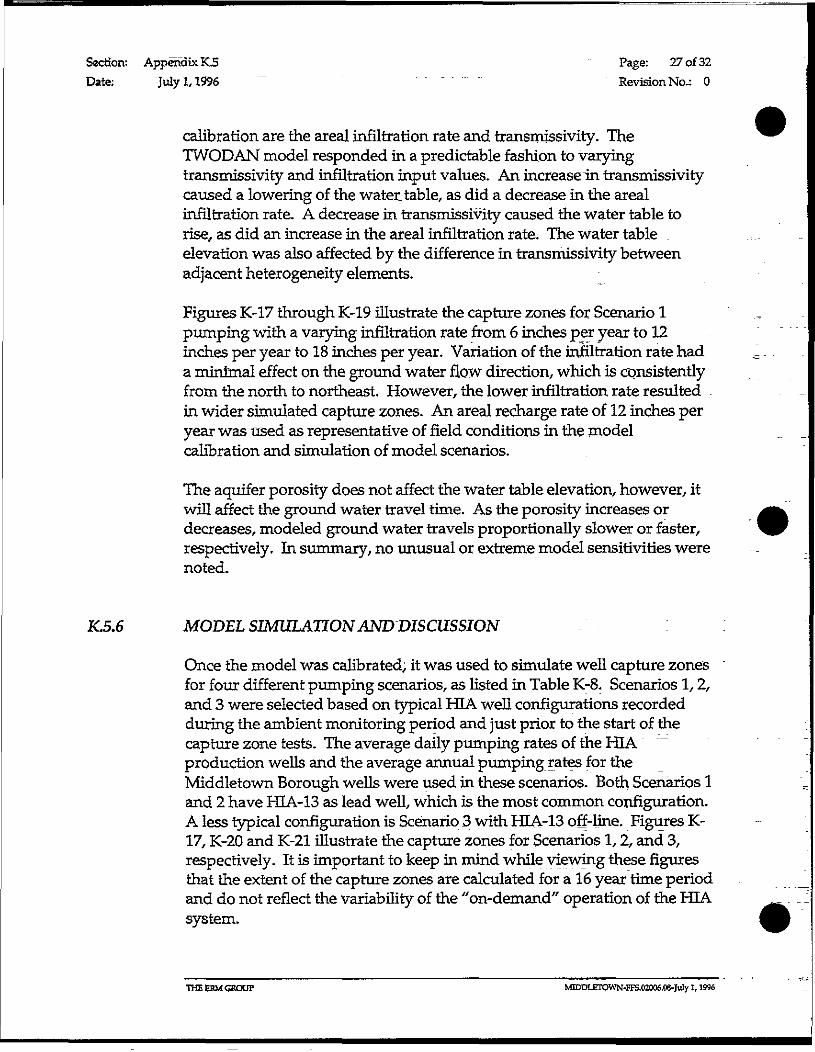
Section: Appendix K5 Page: 27 of 32Date; July 1,1996 ~ . . - . . . . - Revision No.; 0
calibration are the area! infiltration rate and transmissivity. TheTWODAN model responded in a predictable fashion to varyingtransmissivity and infiltration input values. An increasein transmissivitycaused a lowering of the water, table, as did a decrease in the arealinfiltration rate, A decrease in transmissivity caused the water table torise, as did an increase in the areal infiltration rate. The water table .elevation was also affected by the difference in transmissivity betweenadjacent heterogeneity elements.
Figures K-17 through K-19 illustrate the capture zones for Scenario 1pumping with a varying infiltration rate from 6 inches per year to 12inches per year to 18 inches per year. Variation of the inBlrration rate hada rninirnal effect on the ground water flow direction, which is consistentlyfrom the north to northeast. However, the lower infiltralion rate resultedin wider simulated capture zones. An areal recharge rate of 12 inches peryear was used as representative of field conditions in the modelcalibration and simulation of model scenarios.
The aquifer porosity does not affect the water table elevation, however, itwill affect the ground water travel time. As the porosity increases ordecreases, modeled ground water travels proportionally slower or faster,respectively. In summary, no unusual or extreme model sensitivities werenoted.
K5.6 MODEL SIMULATION AND DISCUSSION
Once the model was calibrated, it was used to simulate well capture zonesfor four different pumping scenarios, as listed in Table K-8. Scenarios 1,2,and 3 were selected based on typical HIA well configurations recordedduring the ambient monitoring period and just prior to the start of thecapture zone tests. The average daily pumping rates of the HIA ~~production wells and the average annual pumping rates for theMiddletown Borough wells were used in these scenarios. Both Scenarios 1and 2 have HIA-13 as lead well, which is the most common configuration.A less typical configuration is Scenario 3 with HIA-13 off-line. Figures K-17, K-20 and K-21 illustrate the capture zones for Scenarios 1,2, and 3,respectively. It is important to keep in mind while viewing these figuresthat the extent of the capture zones are calculated for a 16 year time periodand do not reflect the variability of the "on-demand" operation of the HIAsystem.
THE ERM GROUP MtDDLETOWN-FFS.02006fl8-Iuly 1,1996
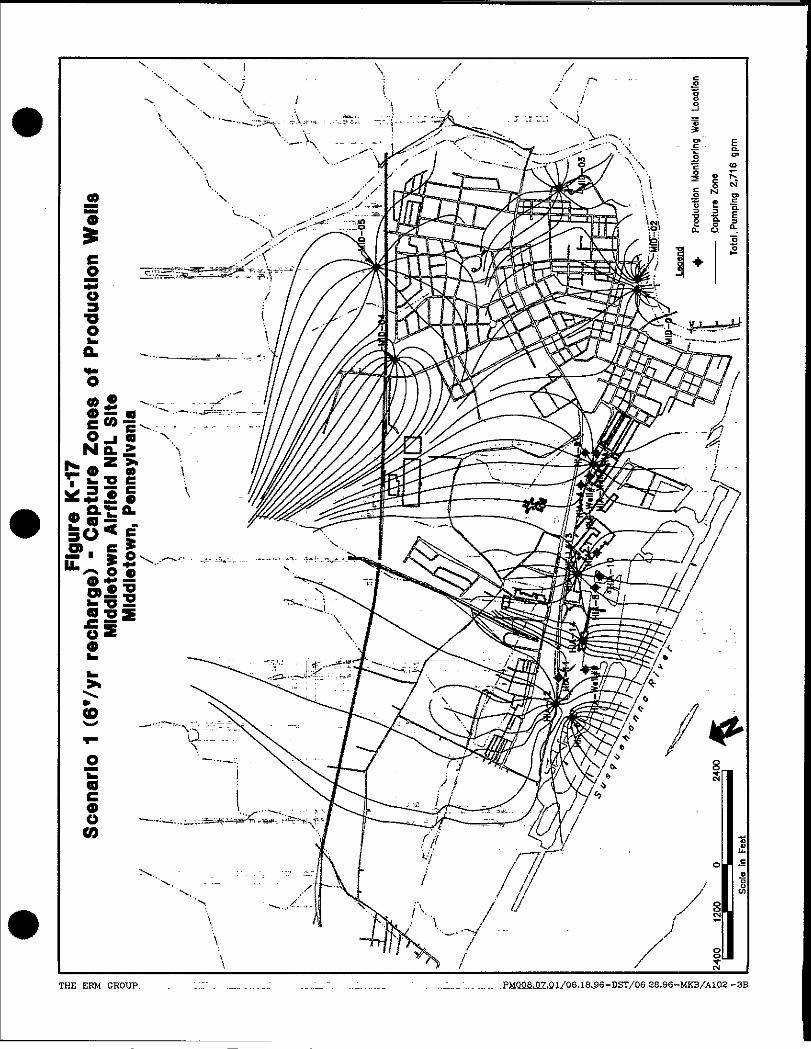
THE EKM GROUP. . '.'..'.' . .__.. .......'. __.._". ..1......._ . .. _._ ... ._.__ .PMQQ_8107,Q1/06.18,_96-DST/06.28.96-MKB/A102 -3B
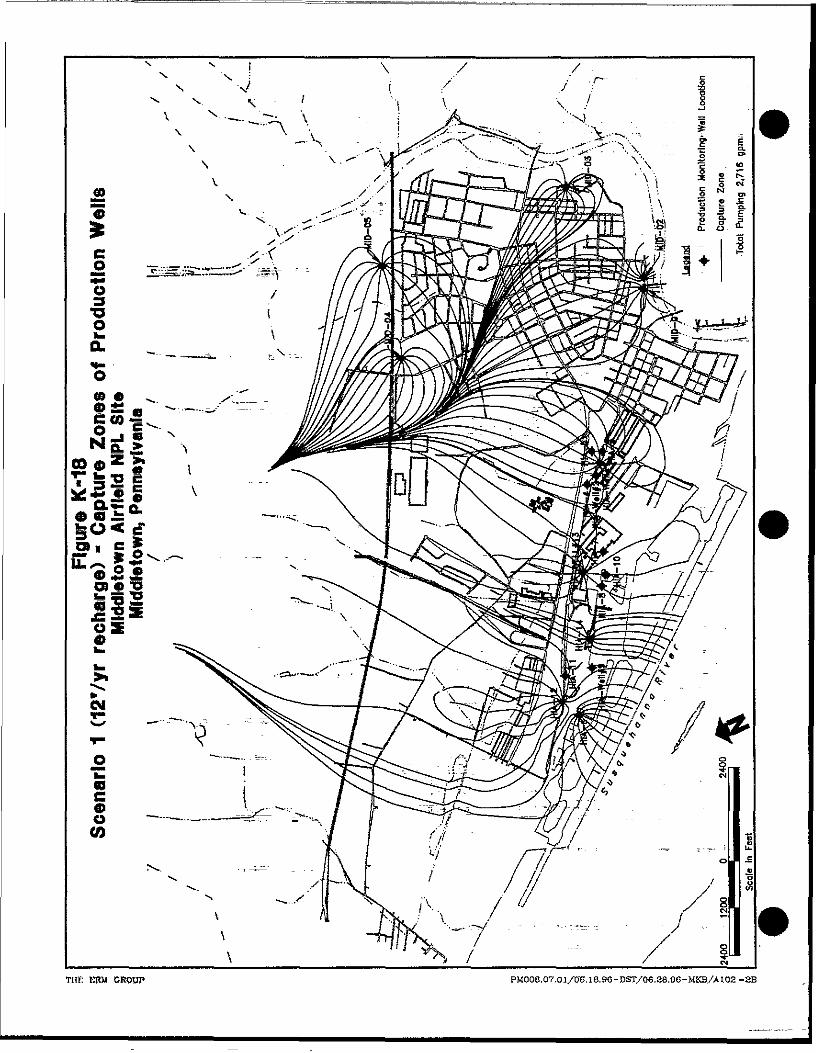
€0
THE ERM CROUP PM008.07.01/OB.18.96-DST/06.38,96-MKB/At02-2B
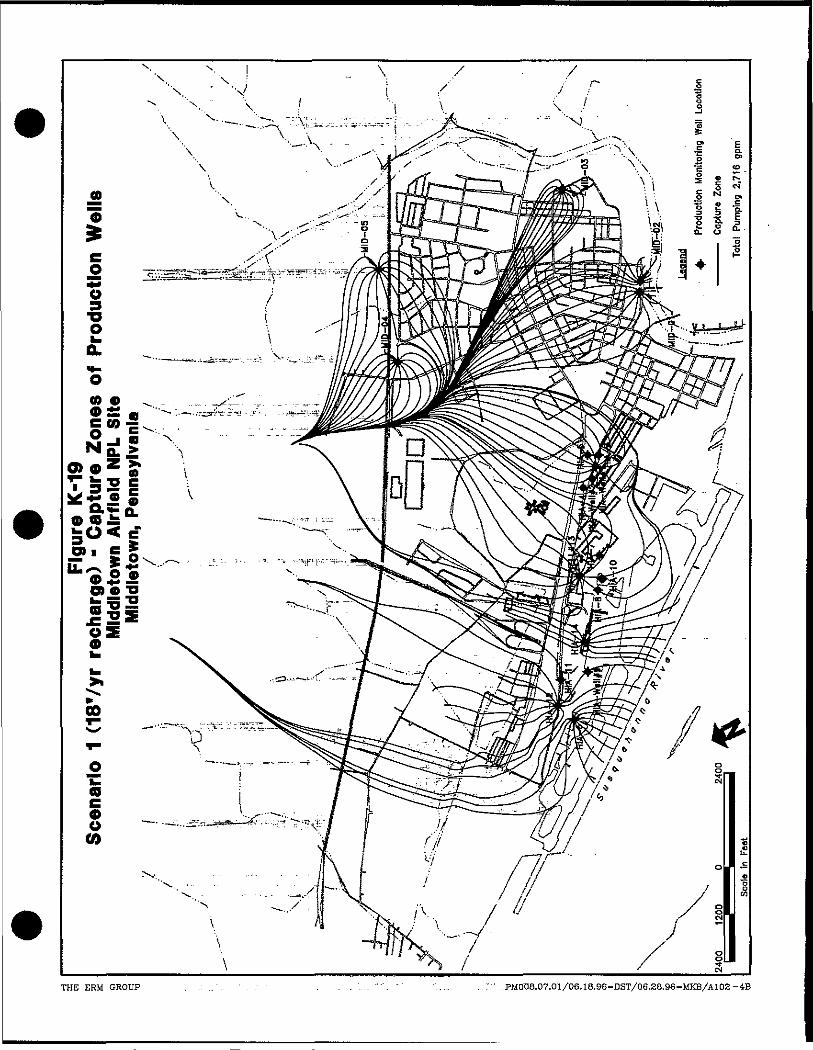
(0
THE ERM GROUP . .1 ..".. : . . . . . .... "". ' ..._ ..;" .PMQQB.Q7.Q1/Q6.18.9S-DS7/Q6.Z&.Q6-UKB/AIQZ -4B
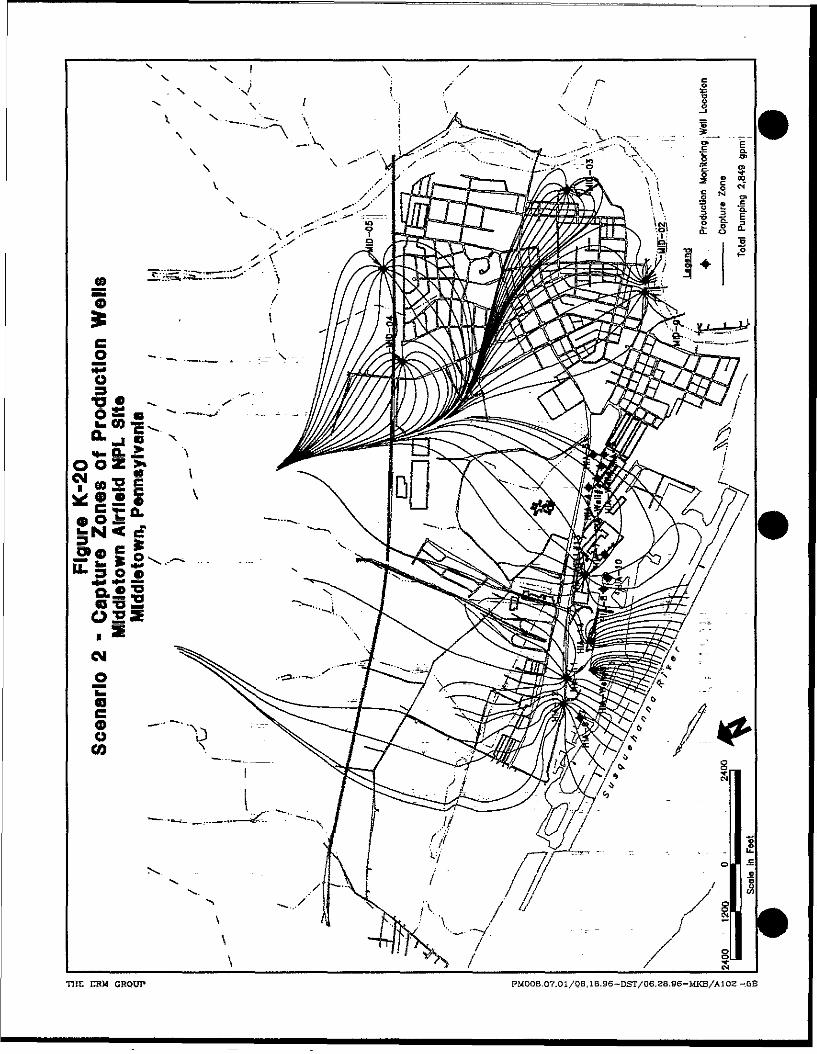
THE ERM GROUP PMOOfl.Q7.0I/06,lB,96-DST/06,ZB.96-MKB/A102-SB
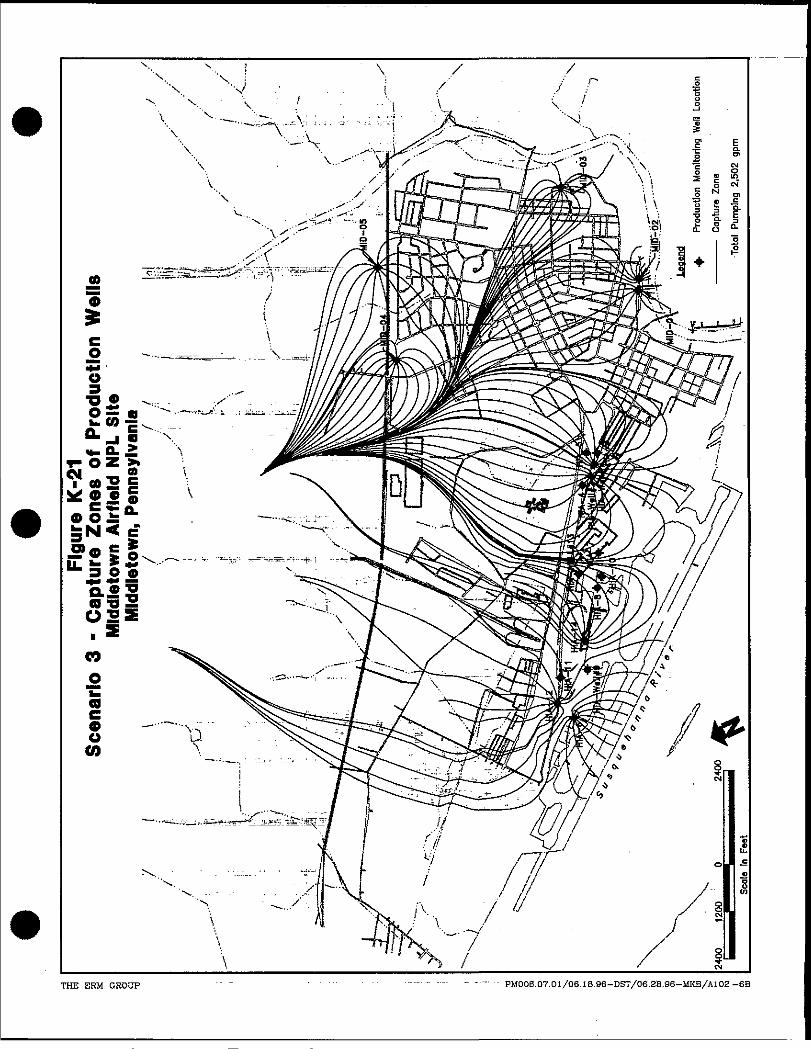
THE ERM GROUP " " . . . . . ..___... ..... _. ,..-..- pM0OB.07.01/06.18.96-DST/06.2B.96-MKB/A102-6B

CDIV*
£1H O)< SOJ CA
o cuJ*i3i— «<l)
M S^„. S *H^ u 3*9 S sH -^ >
® £o 3•c tJ1 gS ?3T-HOJ
dS
£Tex
v&
CO
o111-M
« G?*ts K?e sCO
rJ
CO
•fTH
p> 'c"S) S3
g cx
dj
S& "%, ROH
fi
|
3 §3^ "«Q
S^ "s^&H ixJfcO
"
soa '-81&
03
&
3
& gcu EL
I
C J H tr\J5 ri -Sn IP C SD g
ji t>H Ho in " t i-T> txvS 0 rH fe g£ VOrH CS CM ° °° TH
|l | • |•^ *s « * -S & *§0 O 0
CO ON COt-H CN ^ ^
^ tfs >J *tt
^ t? 8 s.-_i i i ^y^ TH 'H «
O\ O LQ C3
o in t1 t*s o\ \O ON TH vo OO NOTH (N CM TH
cj in ^ c** ON tsrH CJ CM TH
^ f 112 3 jsS S vo &;
"* "° "°
T - I C M C O ^ m v O O N T — I r H r H1 1^ 1 I 1 \ \ \ 1 I
o in * ts o tsvo ON TH VO OO vOTH CM CM TH
^* T— ( CM co ^ inTH O O C5 ) O1 1 § i i-i
Section: AppendixK.5 J._ ... . "-,-_.-- " _ - _ . - " " __.^_^T~- . - Page: 28of32Date: ]ulyl,l996 "" "_"_ "~ ~ ; __ _.."" _"" . RevisionNo.: 0
Scenario. simulates the annual average pumping rates for all the activeHIA production wells and all five of the Middletown Borough wells. HIAwells (HIA-2,3, and 9) with annual average pumping rates of less than 15,gpm were not included in Scenario 4,
Figures-22 illustrates the capture zones of production wells pumping attheir average annual rates (Scenario 4). These_capture zones werecalculated for a 16 year time period, which: was arbitrarily chosen.Becausefdf the extended time period, Scenario 4 which simulates average =annual pumping rates is more representative of actual site conditions. Agreater apparent capture may be observed from water level data if a pumpis operating at a rate greater than its average annual rate as seen inscenarios 1,2 and 3. The actual contaminant migration rates are probably
. slower than the ground water travel time due to retardation. In general, -HIA productionjvells capture thejnajority of the ground water that comesfrom north of the Industrial Area. The area of influence does not extendsoiith of the Runway in the Western Area and Central Area and south ofBuilding 100 (Federal Express) and the road off of Airport Drive whichforms the northern boundary of the PAANG compound in the EasternArea.
Based on the isotropic ground water flow model, the majority of the HIAproduction wells receive water from the north to northeast, thus anysource located north of the HIA production wells may have a potentialimpact on them. The Middletown Borough wells receive water from thenorth and west, thus any source located between north and west of theMIETwells has the potential to impact them.
K.5.6.1 Eastern Area-
The Eastern Area contains production wells HLA.-1, -2, -3, -4 and -5. Underaverage annual pumping conditions (Scenario 4), the wells created capturezones approximately 2,000 feet wide and extending 2,000 feet north tonortheast as illustrated in Figure K-22. The capture zone does not extendsouth of Building 100 (Federal Express) and the road off of Airport Drive•which forms the northern boundary of the PAANG compound in theEastern Area. Under the higher average daily pumping conditions ofScenario 3,~trie capture zone created by the Eastern Area production wellswas 4,000 feet wide and extended 3,000 north to northeast and just southof the PAANG compound as illustrated in Figure K-21.
THEERMGROUP " " " """ """ " -- - MtDDLETOWN-EFS.02006.OS-July 1,1996
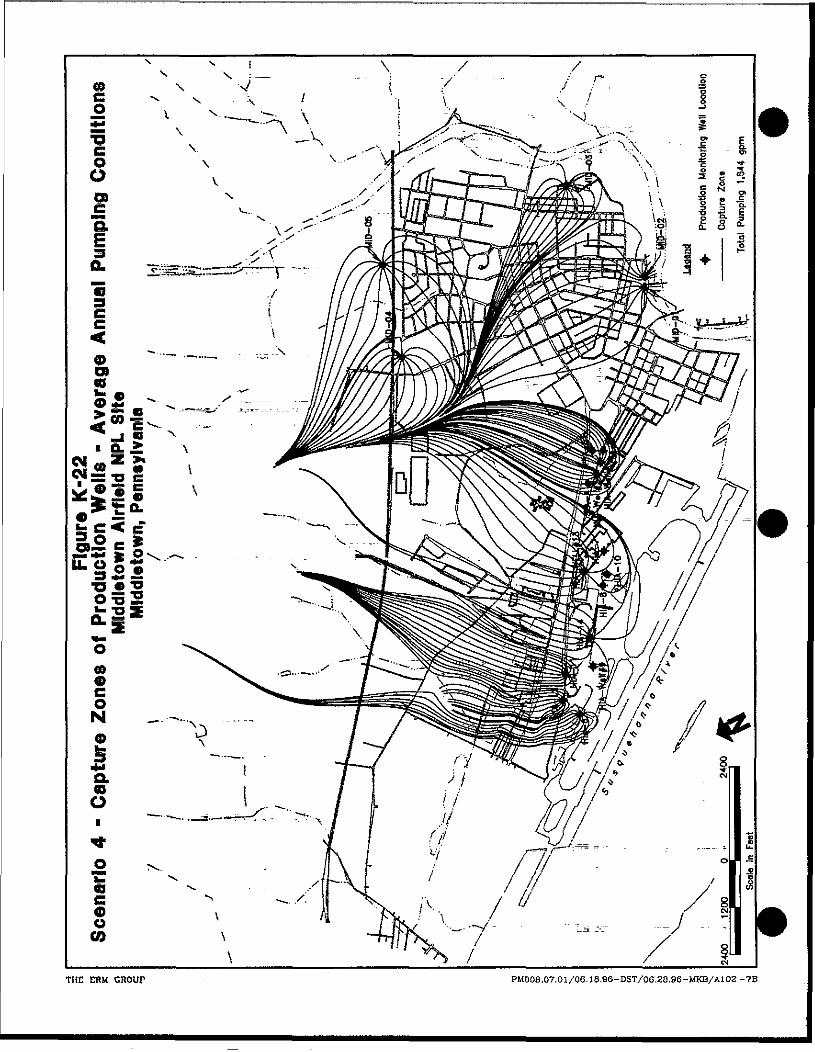
THE ERM CROUP PMOG8,07.01/Q6.18,S6-DST/06;2S.96-MKB/AI03-7B
Section:" AppendixK.5 " "" '"'""..':_"."_. """."' " '..'.'.'." '..... ~ '..."' Page: 29of32Date: July 1,1996 '" ." ;""-" --_. — - - - _ - . , RevisionNo.: 0
K.5.6.2 Central Area
The Central Area contains production wells HIA-7, -8, -10, and -13. Underaverage annual pumping conditions (Scenario 4), the wells created capturezones approximately 2,000 feet wide and extending 6,000 feet to thenortheast and 1,200 feet to the south of HIA-13 as illustrated in Figure K-22, Two surface water tributaries intercept a portion of ground waterwiihin these well capture zones, as can be readily seen from the flattenedboundaries of the well capture zones. ,-_,. -
K.5.6.3 Western Area
The Western Area contains production wells ELTA-6, -9, -11, -12 and -14.Under average annual pumping conditions (Scenario 4), the wells createdcapture zones approximately 3,000 feet wide and extending 7,000 feet tothe north as illustrated in Figure K-22.~ The capture zone does not extendsouth of the runway. A surface water tributary captured a portion ofground water within these capture zones. A portion of water came fromtwo surface water ponds north to northwest of this area.
JC5.6.4 North Base Landfill
The North Base Landfill contains production well MID-04. Under averageannual pumping conditions (Scenario 4), this well creates a capture zoneapproximately 3,000 feet wide and extending 2,000 feet northwest asillustrated in Figure K-22. ~ "
THE ERM GRODP Mn3DLETOWN-BFS.02006.08-JijIy 1,1996
Section: Appendix K.6 Page: 30 of 32Date: July 1,1996 "— RevisionNo.: 0
K.6 CONCLUSIONS AND RECOMMENDATIONS
K.6.2 Capture Zone TestThe results of the pumping tests provided good estimates of the aquifertransmissivity in the Industrial Area and the North Base Landfill Area.On a regional scale, anisotropic conditions may effect ground water flow,however, the pumping tests performed could not identify these effects.The HIA-2 test results suggested that some anisotropy may exist in theEastern Area with an anisotropy ratio of approximately 1.2:1. Althoughthe test data from the Central Area (HIA-13) indicated that thetransmissivity in the direction normal to strike was greater than alongstrike (i,e., ERM-24D drewdown more than ERM-23D), exactly oppositewhat was expected.
Due to heterogeneous conditions, aquifer storage coefficients andhorizontal to vertical anisotropy could not be determined. The lack of ahorizontal to vertical anisotropy measurement will complicate future 3-dimensional modeling as this ratio is important to evaluating the 3-dimensional influence of the pumping wells.
The pumping test results demonstrate that the transmissivity of thebedrock aquifer is increasing moving from the North Base Landfill Areatoward the Industrial Area and from east to west. The Western Areaexhibited an aquifer transmissivity approximately 25 times greater thanthe North Base Landfill Area. This is likely due to increased fracturing inthe bedrock in the Western Area.
K.63. Capture Zone Analysis
The regional ground water model constructed for the Middletown Airfieldachieved good calibration to the field measured data, pumping testresults, and the estimated areal infiltration rate.
The model simulated capture zone of the production wells under averageannual pumping conditions are illustrated in Figure K-22. These capturezones cover a significant portion of the Site area. The time frame of thecapture zone simulation is 16 years. Ground water contamination locatedto the north within these capture zones would have a potential to migrateinto these production wells within the simulated time frame.
THE ERM GROUP MH3Dl£TCWN-!TS.02006.0&-July 1,1996
Section: AppendixK.6 - ...." _" ',"_/.. T " ..!,.. -_ Page: 31 of 32Date: July 1,1996 _ i; - "" " Revision No.: 0
The model has concluded that the contaminants detected south of theEDLA-2 area can not be contained by the production wells in this area.Unless additional remedial measures are taken, contaminants willcontinue migrating toward Susquehanna River.
The model alsoiconcluded that migration of contaminants leached fromthe North Base Landfill, located to the west of MID-04, would beinfluenced by the pumping of MID-04.
THEERM GROUP " "~ MIDDLEr6wN-FK.02006.08- July 1,1996

Section: Appendix K.7 . Page: 32 of 32Date: July 1,1996 . ; Revision No.: 0
K.7 REFERENCES
Chow/ V.T. 1964, "Handbook of Applied Hydrology", published byMcGraw-HHI, Inc.
Driscoll, F. G. 1986. "Ground Water and Wells", published by JohnsonDivision, St. Paul, Minnesota.
Fitts, C. R. 1994, "TWODAN", user's manual, Version 2.0.
Freeze, R~A. and J.A. Cherry 1979, "Groundwater", published by Prentice-Hall, Inc.
Gannett Flernming, Environmental Engineers, Inc. Final RemedialInvestigation Report, Middletown Airfiejd Site, Middletown,Pennsylvania, July 1990.
HydraLogic, 1989. "ANIAQX Version 2.5 Operations Guide", Missoula,MT.
Linsley, RJC. and J.B. Franzini 1979, "Water Resources Engineering", thirdedition, published by McGraw-Hill, Inc.:
Meisler, Harold and Longwill, Stanley M. Geologic Survey Water-SupplyPaper 1539-H, 1961. Ground-Water Resources of Olmsted Air Force Base,Middletown, Pennsylvania.
Strack, O.D. 1989, "Ground Water Mechanics", published by Prentice-Hall,Inc.
Supplemental Studies Investigation, Work Plan for Capture Zone Testsand Analysis, Middletown Airfield NPL Site, Middletown, Pennsylvania,prepared by Environmental Resources Management, Inc., 14 July 1995, _prepared for Air Force Regional Compliance Office. '
TH& EBM GROUP ~ ~ MIDDtETOWN-FP3.Ci200t08-JuIy 1,1996
Attachment KlArithmetic Data PlotsGround Water Elevation vs. Time
Hydrographs-Pumping Test HIA-2
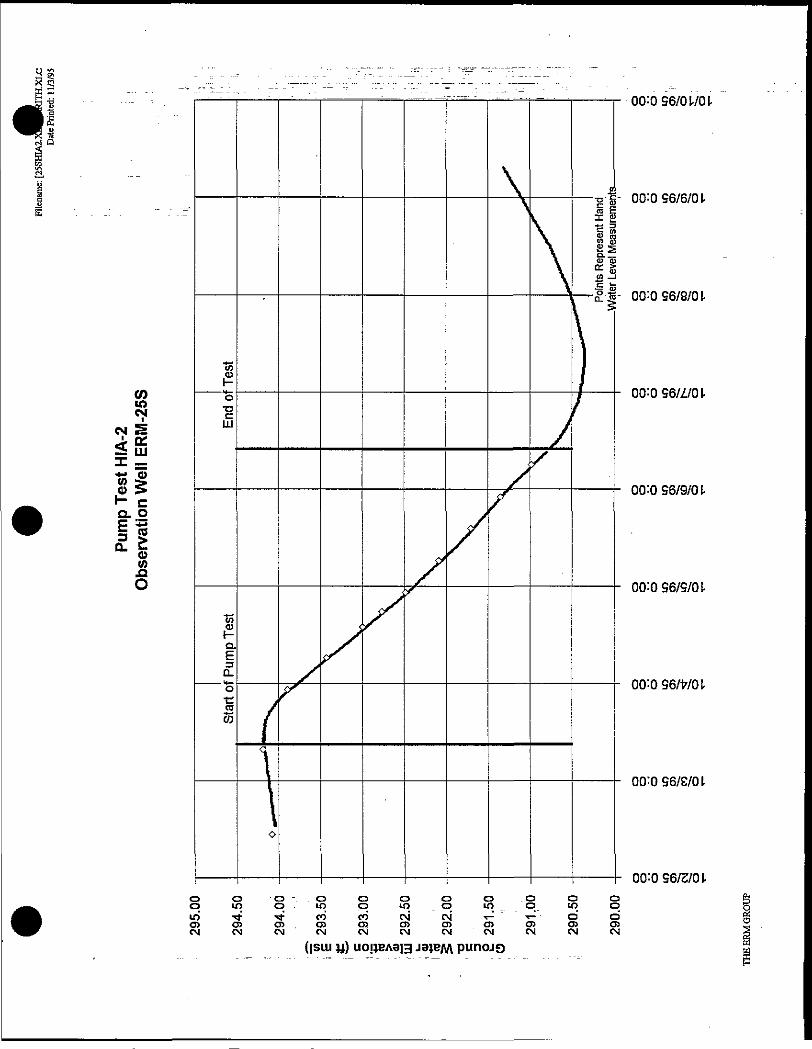
OlTO 96/0 l/Q I
00:0 96/6/01
£-|- 00:0 96/8/01-
CO ——£———————————————————————————————i——- 00:OS6/Z/(H10Cjl
CM S
<SX —'- 0)
00:096/9/01-t- ca oC £31 5°- I
(0AO ———————————————————-gA—————————————————— 00:096/S/(H
00:096/WOI-
00:0 96/2/0 1-o o o - ~ o o o o o o o oo v o o i i o i i o
(isiu u) uo!JBA9i3 jajeM punojQ
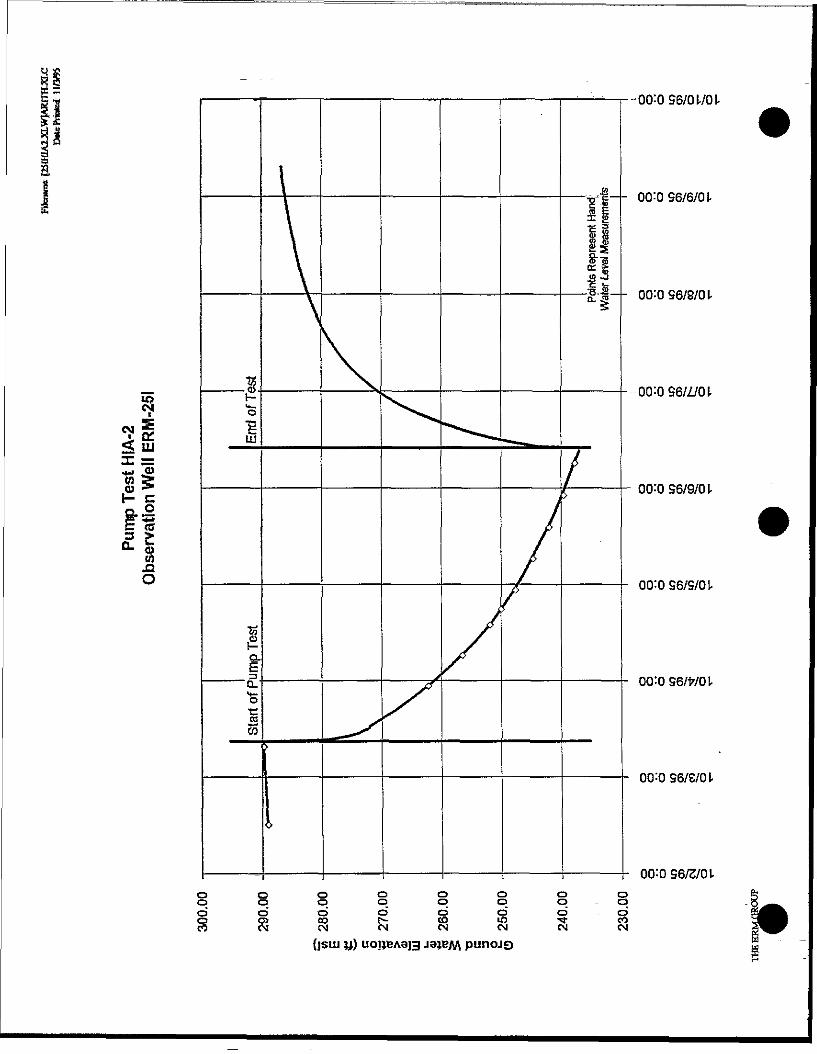
00:QS6/MHr— "
CM
X =.[_. Q)to o r- Ca5Sic
LO.QO
• 00:0 S6/01701.
— 00:0 96/6/01
— 00:0 96/8/0!-
oo'-ose/s/oi.
00:096/£/OI-
00:0 96/3/01O Q O O O O O Qo o o_ o o_ o o - po" o o o o o" o" o
(isui y) uo|jeA9i3
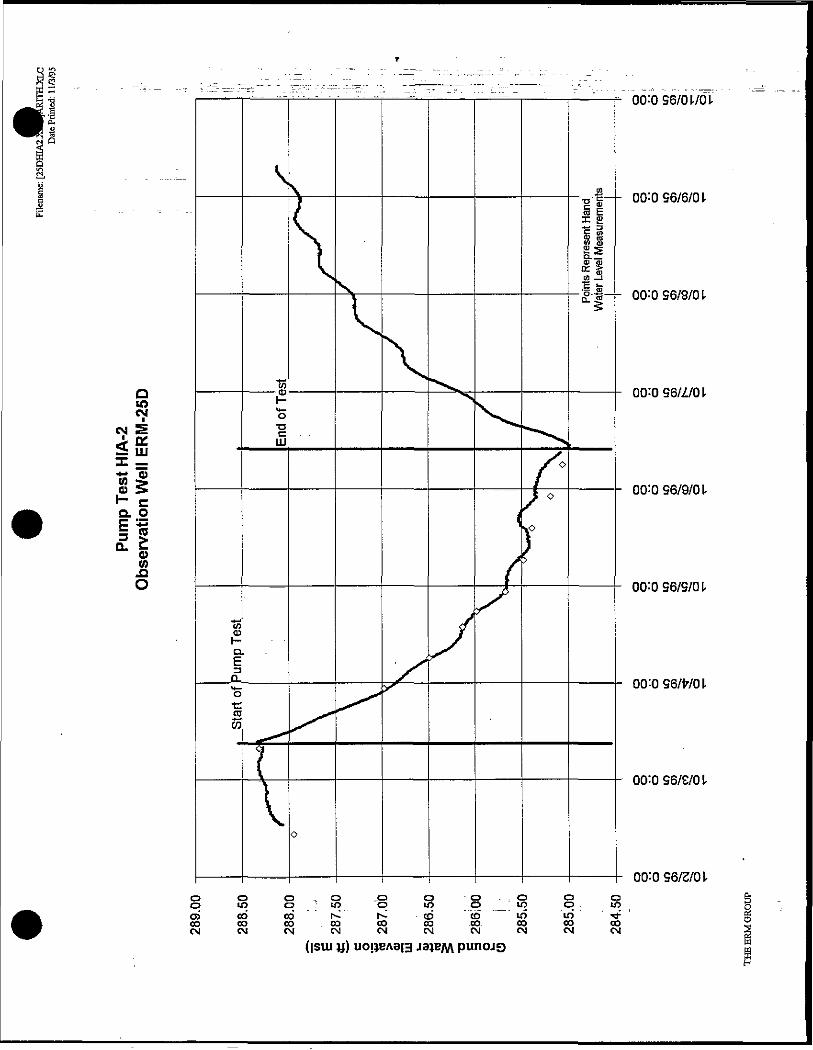
Q10CM
CM
00:0 96/01/01
-- 00:0 96/6/01-
— 00:0 96/8/01
**g g —————————————— _._ _|_ ——— _ 00:056/9/01I™ EQ. OF I s°- I
U)^O ———— — ———————————————————— £ ————————— - 00:0 96/9/01-
00:0 96/3/0 1-o o - - o .. o jo o o . , o o oo to p ; to p 10 o _ iq pino> op eo P r to to in 10' ^c o c o o o c o o o c o - o o - c o o o o oC M C M C M C v l C M C V l C N C « J C v I C v J
(isui J31BM
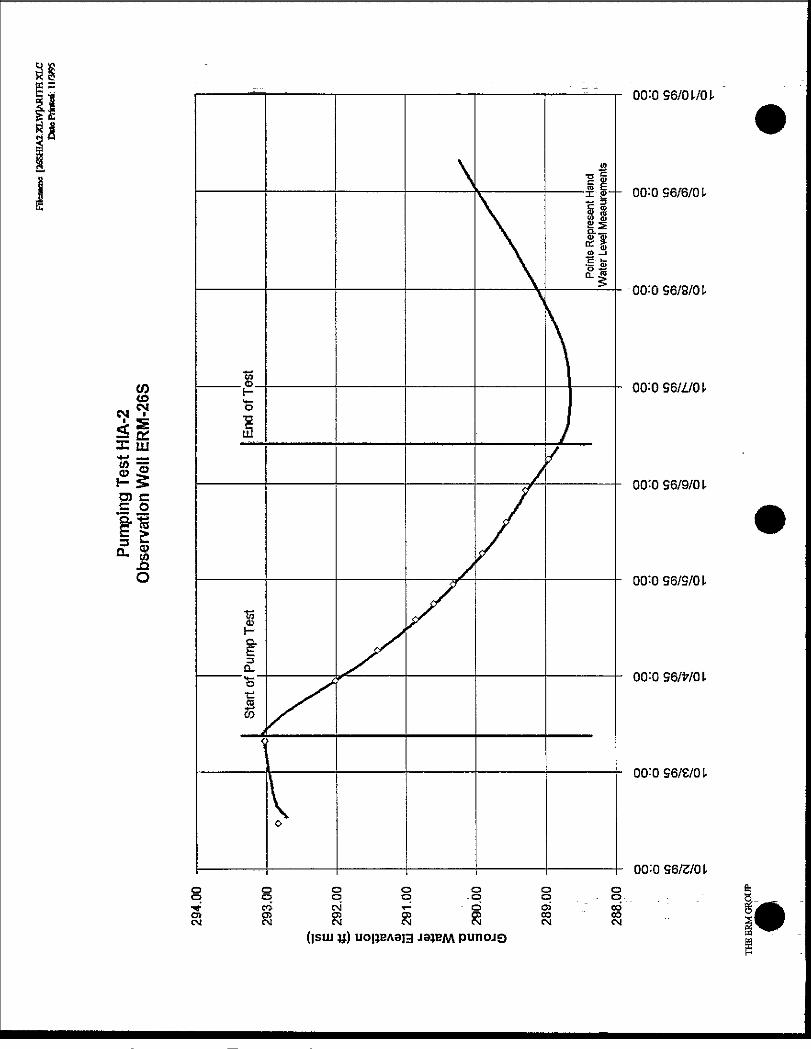
COCD
,ytf) •=: F
. (D.
•gLU
CLE
\
00:0 96/9/01qi c:c or* 03Is"• to
4OO^O 96/9/01.
1— 00 0 96/6/01
00:0 96/01701.
00:0 96/8/01.
00 096/e/Ol.
00=096/3/01o o o o o o oo p p p rp p - p-^ co rvi W --- o oi coCf> O5 O O3 OS CO GOCvl CM Cvj CJ fv| Cvj CM
(|sui u) uo|jBAa|3 jajEM punojQ
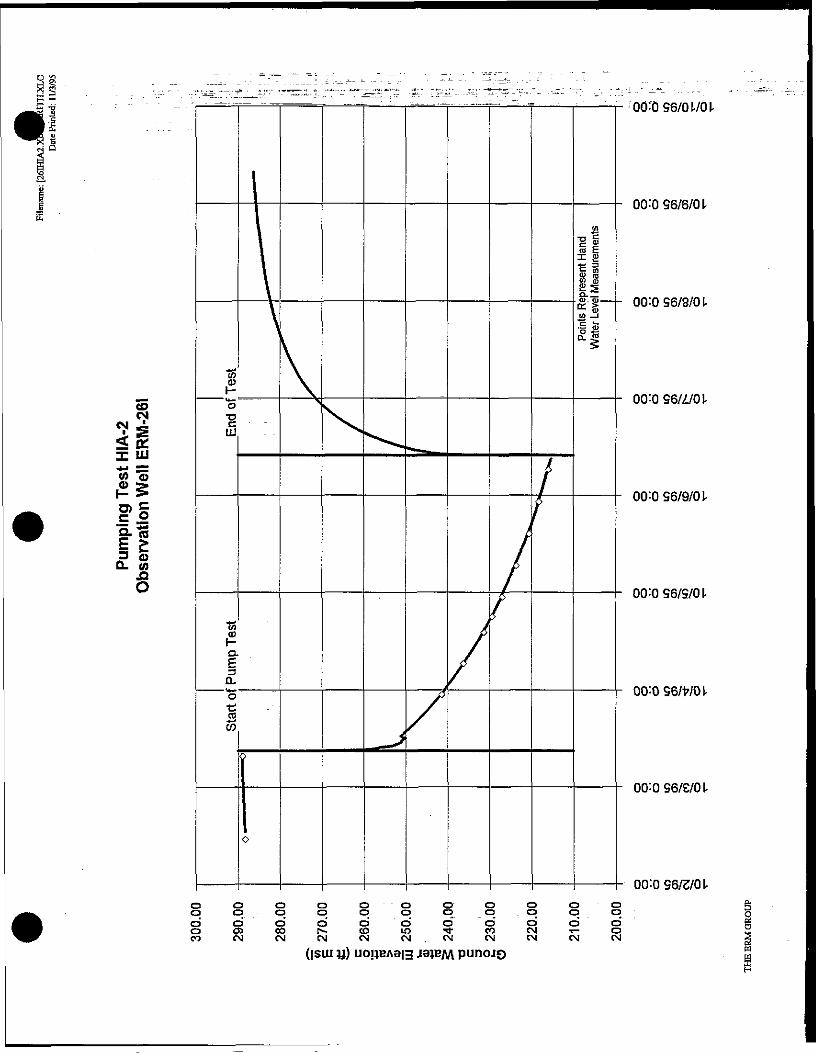
-WO 96/01701-
00:0 96/6/01-
00:0 96/8/01-
CM
00:096/i/01-^ V
CM
X LLJ+* «« O
f|3 Q}Q. wO
00:096/£/OI-
00:0 96/3/01o o o o o o o o o o o gp p p o p o p o p p p go o o" o o " o d" ~ o o o o" ' gC O r M C M C M C M C M . C M C M C M C M C M S
(ism u) uouEAS|3 J9JEAA punojo I
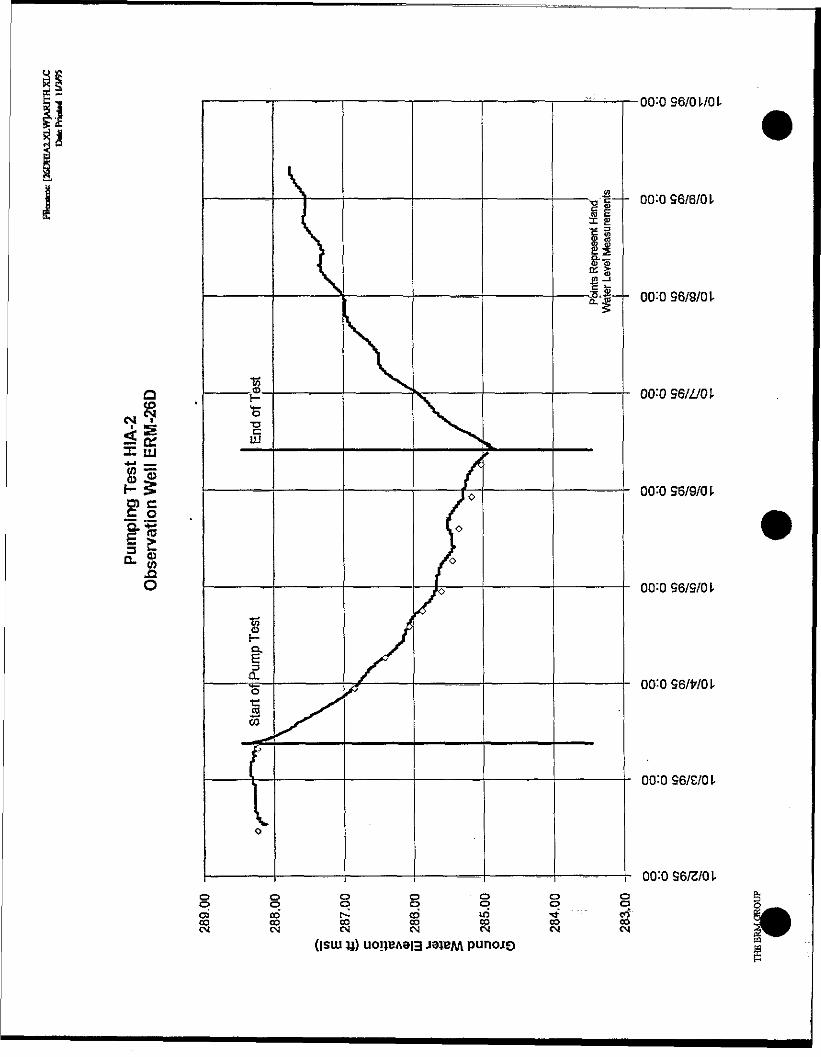
<o oT3LU
S:0 96/9/0 1
0) Cc a
<U y v
00:0 96/9/01
§ £x s
o.._£1iw••S-h 00:0 96/8/0 V
•oo:ose/owoi.
00:0 96/6/01
00:OS6/Z/OI.
00:098/WOL
00:OS6/3/Ol-o o o o o o op o p p p o ooJ co" r cd 10 f " ofCO CO CO CO CO GO COCM CM CM Cvl CM CM Cv|
(|sui )
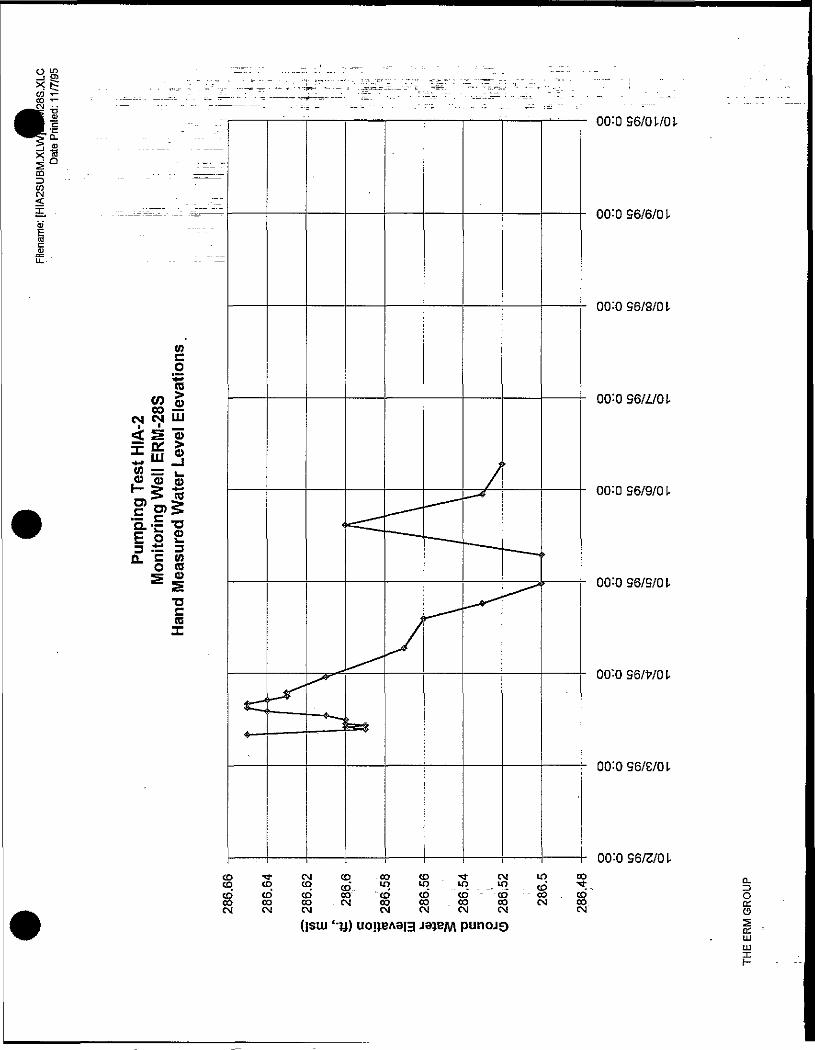
CO
c.2*<ra
oo —CM CM LLJ
,I- <Dg 15
.E o £3 ±: 3Q. C (Ao n
•ac(QX
00:096/Ol-/OI.
00:096/6/01-
00:0 96/8/0 L
00:0 96/Z/OL
00:0 96/9/01-
OO^O 96/9/0 L
00'096/WOI.
00:096/e/0(.
00:096/S/Ol-
c D c o c o t Q i r » ' X 3 m m t c j ' ' < 3 ; ^co to cc> co -"eo' to" CD" ~-~ co co cd oOO CO C O - C M CO CO. CO CO CM CO CEC M C M C M C M C M C M C M C M o
(isiu I-u) uoj;EAa|3 J8JEM punojo |LLJlitn:H
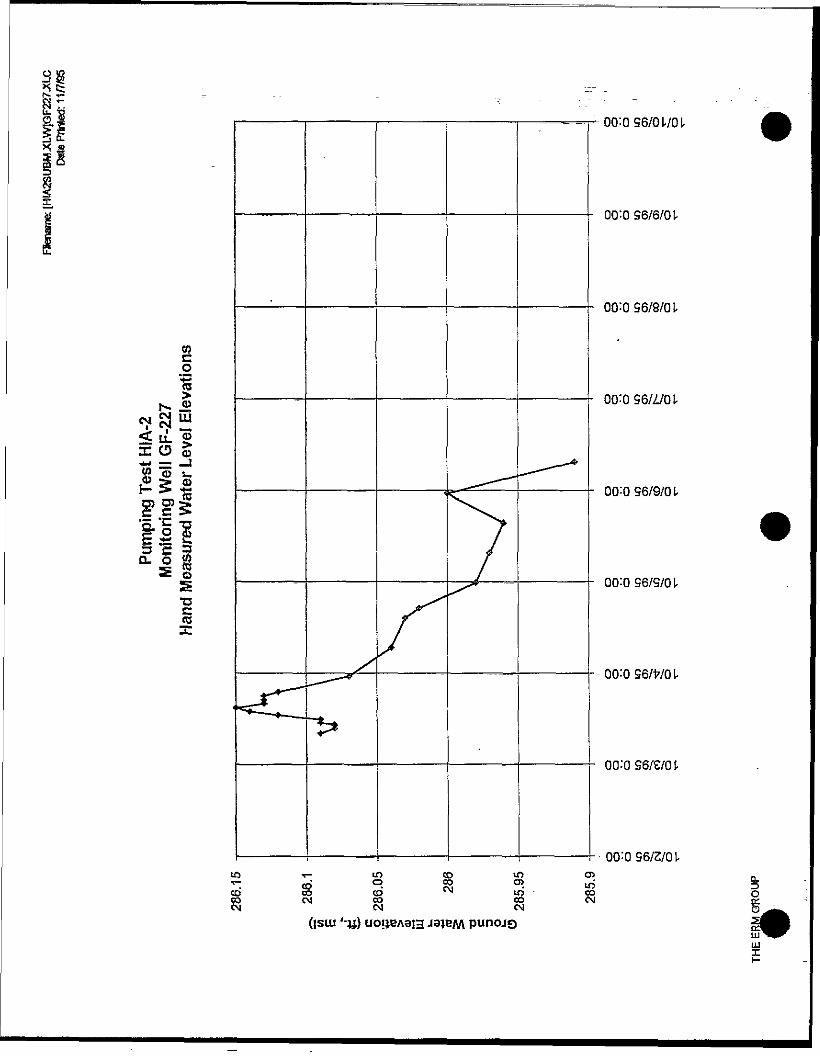
60c
I- 5 •§P) OJ ;»
111S3 C J3CL O V?
TSCccX
CM ~
CD S= —lO L
J*"* ' ' 00:095/9/01-
: OQB/O L/o L
00:0 S6/6/OL
00:0 96/8/01-
00:0 96/1/01-
QO:Q 96/9/01-
00:0 56/WOt
00:096/£/01-
00:0 96/2/01-
CO CO CD '' U) CO OCO CM CO CO CM QCCM CM CM
(ISLU '-14) uoijEAaiH J31GM punojQLUUJI
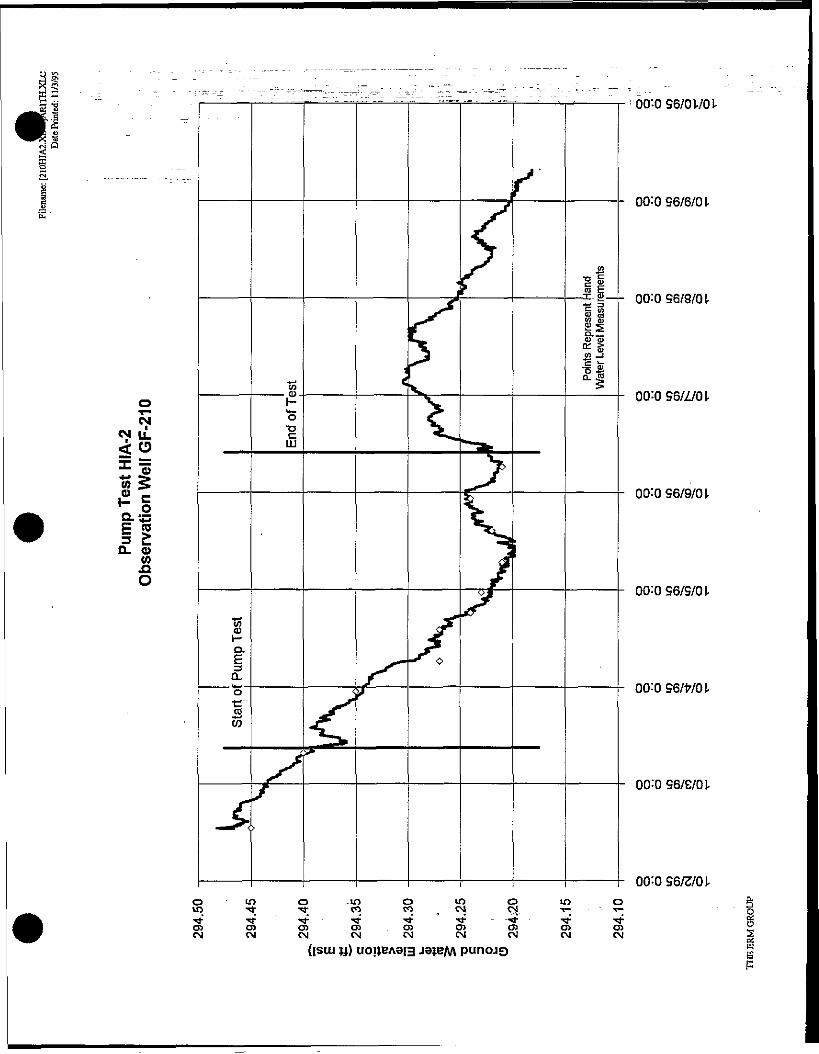
00:OS6/OI7QJ.
00:0 96/6/0 L
oCM
CM U_<0
»i(0^O
00:096/W01-
00:096/£/01-
00:0 96/3/01-o m o m o m o m o gin •<*• Tf CO CO . .CM CM. T - / T - O/ i^ • / . ," i' J „ / '_ _^^ . ,' ^ c^Cn O> O) CB . O) O> O3 CJ) CJ) ;::C M C M C M C M C M C M C M C M C M 5
(ism u) uoijEA3|3
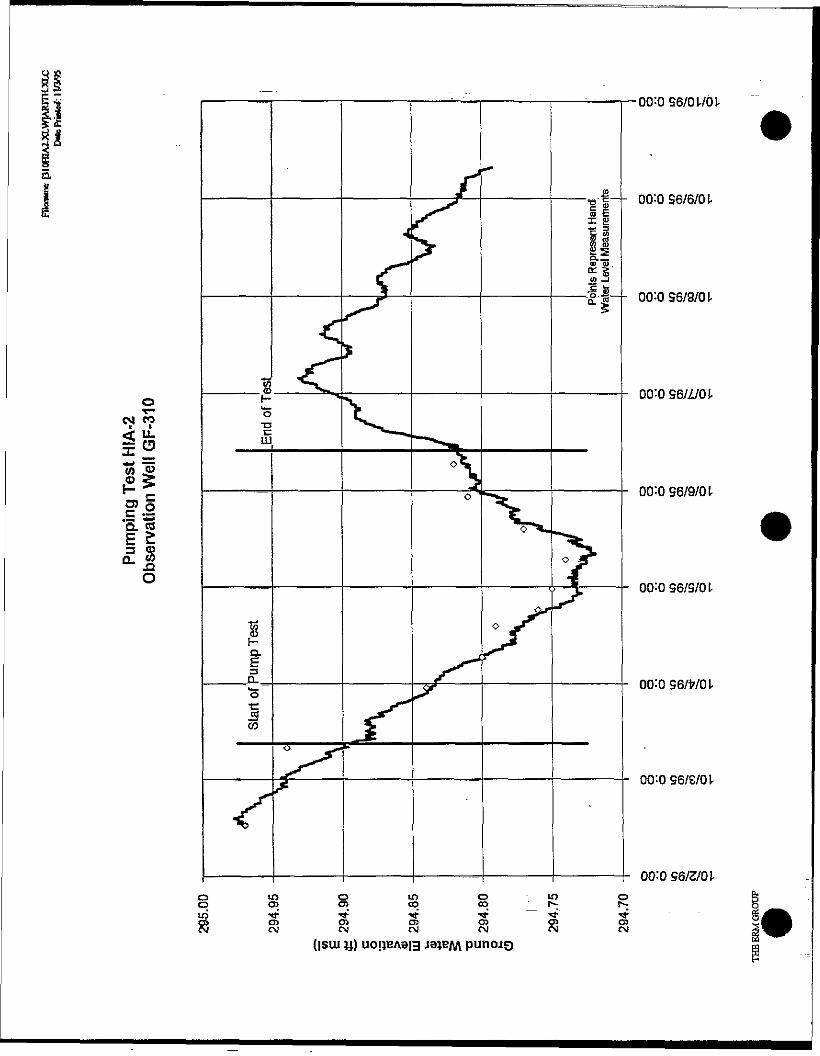
00:096/01701-
oCM CO
Q. CBE £s a?*• 3O 00:0 96/9/01-
O0:096/W0l-
- OQ'-096/£/OV
00 096/3/01o m o 10 o m oo o 01 cq co r*-; r*;U? i* •* Tf ** - 1*CJ> O5 Oi O3 Oi QJ O3CM CM CM CM CM CM CM
(isiu
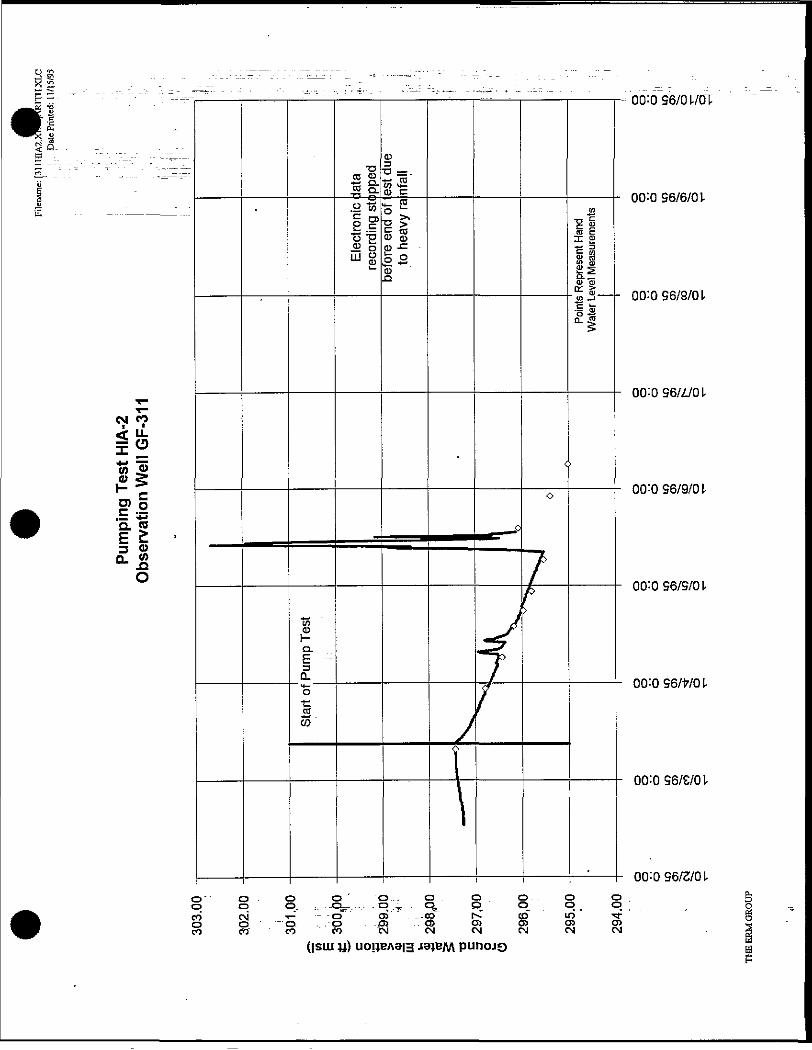
CM O
O) o.E SQ. re
CO Q_
.2 w
o
<p~ — - 00:0 96/6/01-r-O
O
"
00:0 96/0 1701
00:0 96/8/01-
00:0 96/9/0 L
00:0 96/5/0 L
00:096/WOI-
00:096/3/01-o~ o o o' o. o o O- o o, £3O O - O,-- ,: . -Q_ . - -,- . p ^ O^ p p p _ p Oco CM •<- - -d"" oJ ' . --co* rC CD" LO TT ' gO O ~O . .'O - -OS .. <t> Ol O> OJ O> wCO « - • « " « "CM CM CM CM CM CM i
(fsui u) uo|jEAO|3 jaiEAA punojo
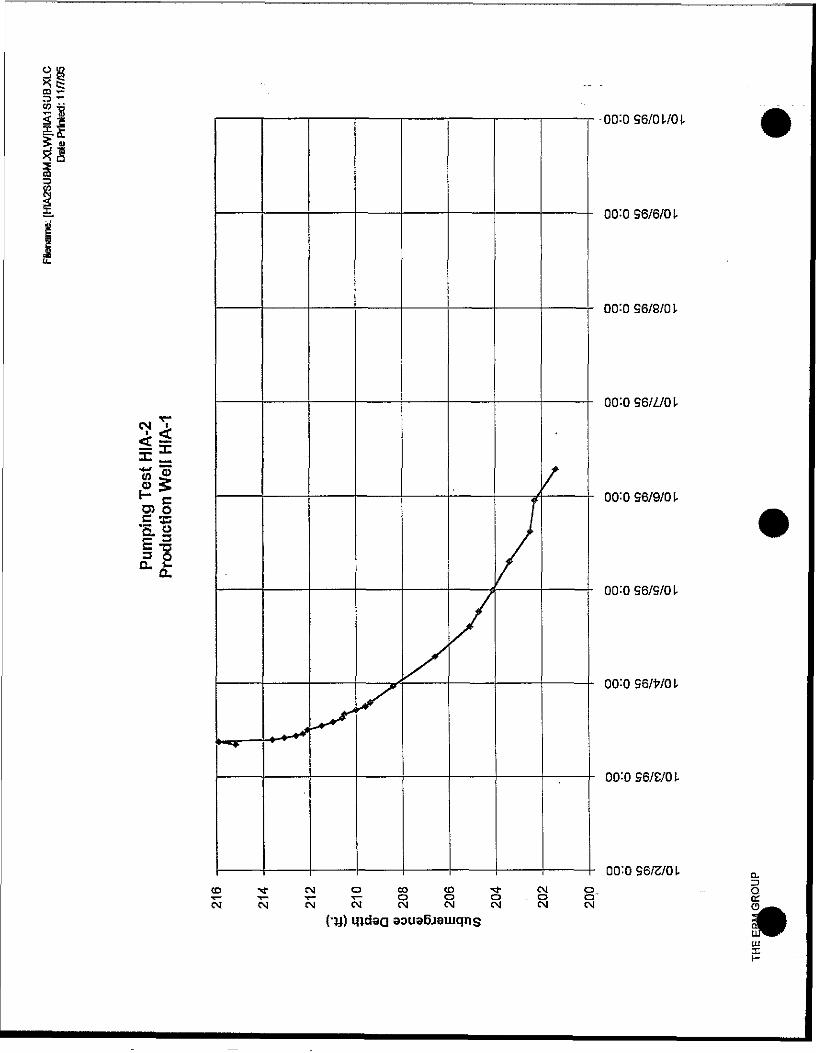
£ >g> o'E "£•§
00:0 96/0 L/0L
00:096/6/01-
00:0 96/8/01-
OO: 056/9/0 L
00:0 96/9/01-
00:OS6/WOL
00:096/£/01-
00:o 96/3/0 L
T - t - v - T - o o o - o o " a :C M C M C M C M C M C M C M C M C M C D
L BP
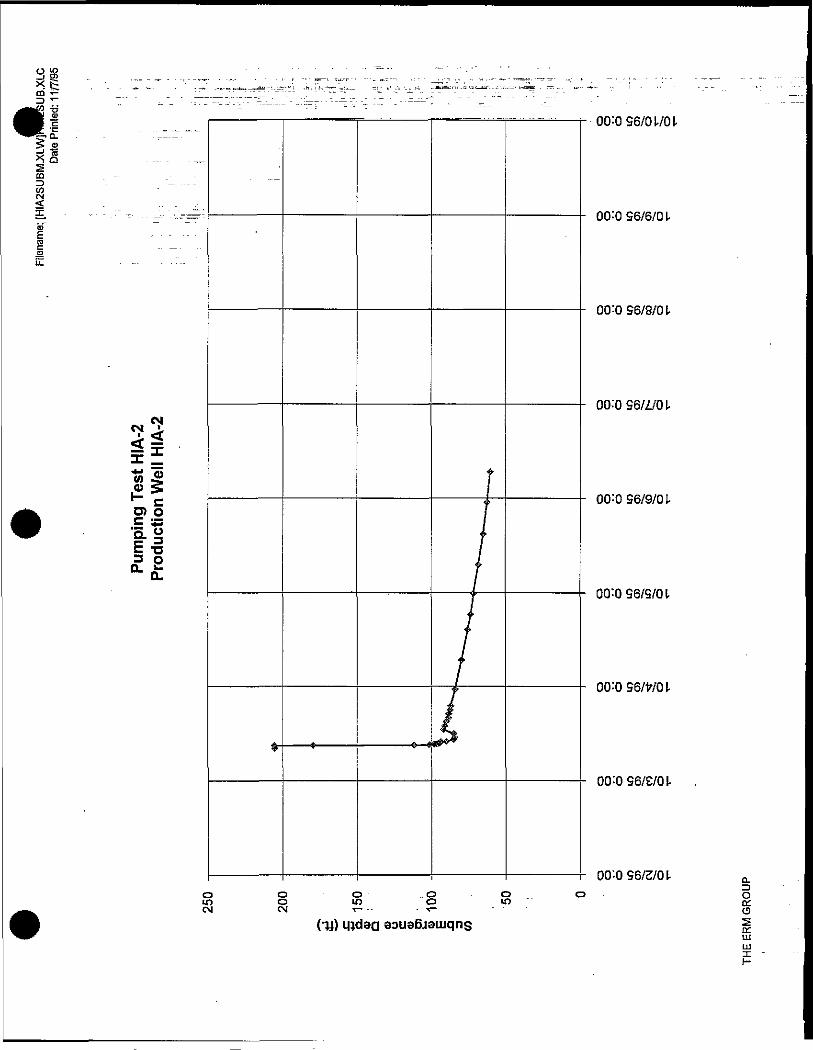
ilII»- cD) OC :p£3
00:0 96/01-/OL
00:0 56/6/0 L
00:056/8/Ol-
00:OS6/Z/OL
00:0 56/9/0 L
00:0 56/5/0 L
00:OS6/WOL
00:OS6/£/OL
00:0 56/3/01-o o o o o o om o m o in ceCM CM T---- — T- C5
LULU
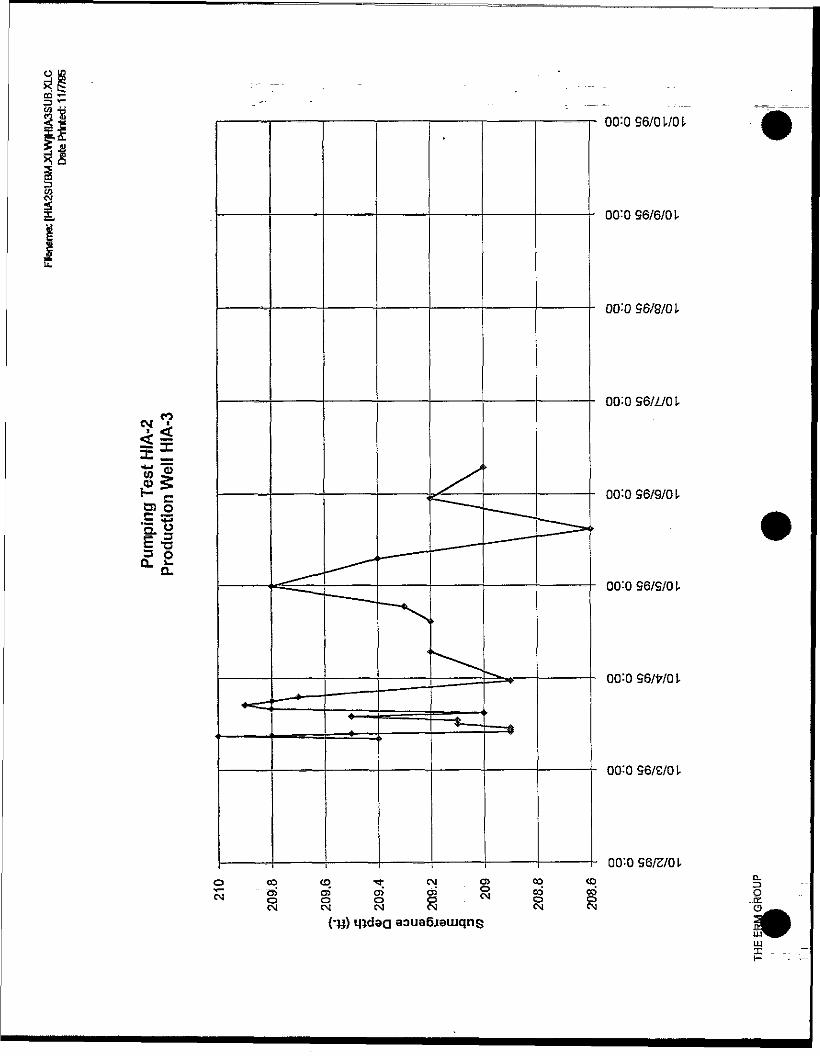
^ J.iltO £H c 1—————I—————1—————I————^^———i—————I—————h 00:0 96/9/01-g) oC 2
E00:0 96/9/01-
00=0 96/0 L/OL
00:0 56/6/01
00:0 56/8/01.
00:OS6/£/01-
OO'-O 56/3/01-CO CD •<- CM . O> CO <O, £jCJ) Ci O> Q5 S OO ^ OO O O C5 ^N O C) ..ccCM CM CM CM CM CM CD
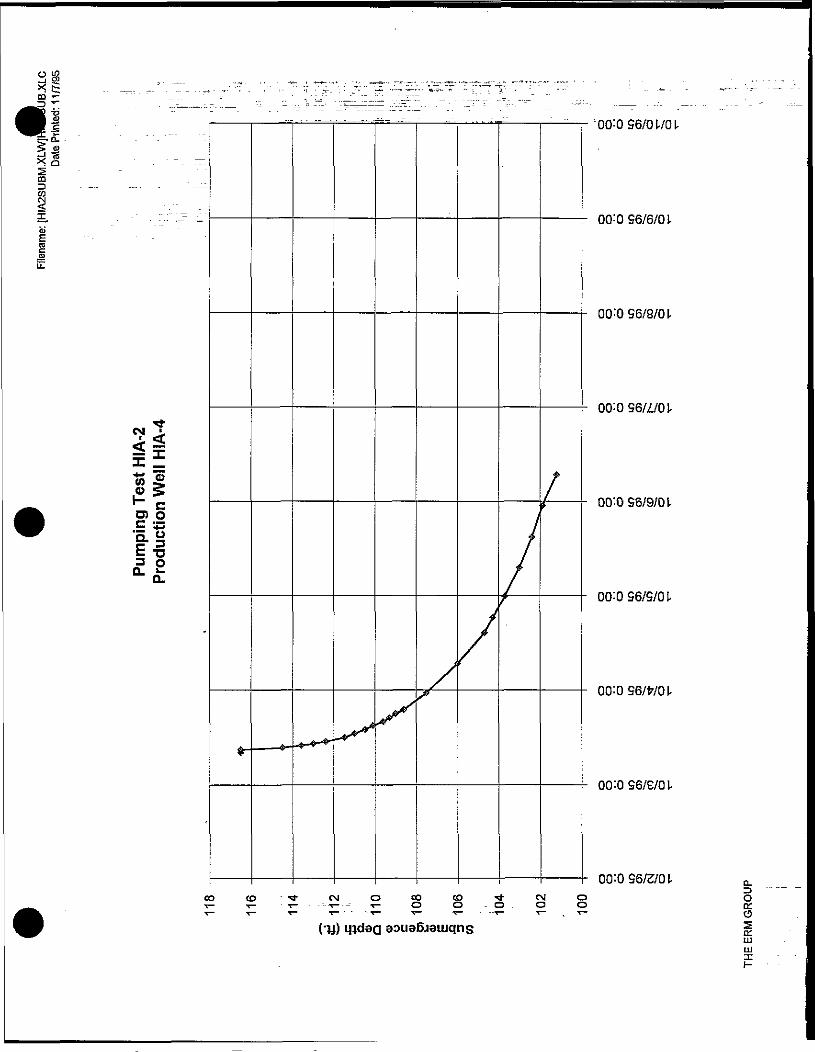
"S ..- - ....... - - -=-_ -- _-_—-_^._ ;00:0 56/0UOl.
ii
00:056/6/01-
00:0 56/8/0 L
00:OS6/i/01-
00 0 56/9/01.
00:0 96/9/01
00:096/WOI-
00:096/E/01-
00:0 56/3/01
trLULUXI-

° s&si
IO
a. g£•§
•00"-OS6/Ol-/01,
00:056/6/01-
00 056/8/01.
00:QS6/i/Ol-
00:056/9/01-
00:0 56/5/0 L
OQ:OS6/W01-
00:OS6/£/OI-
OQ'-O 56/3/0 L cut q e c > t n r - - i n . c o t n i o » n ^ - - ^cs CD en os o>
souaSjeujqnsLUUJXH-
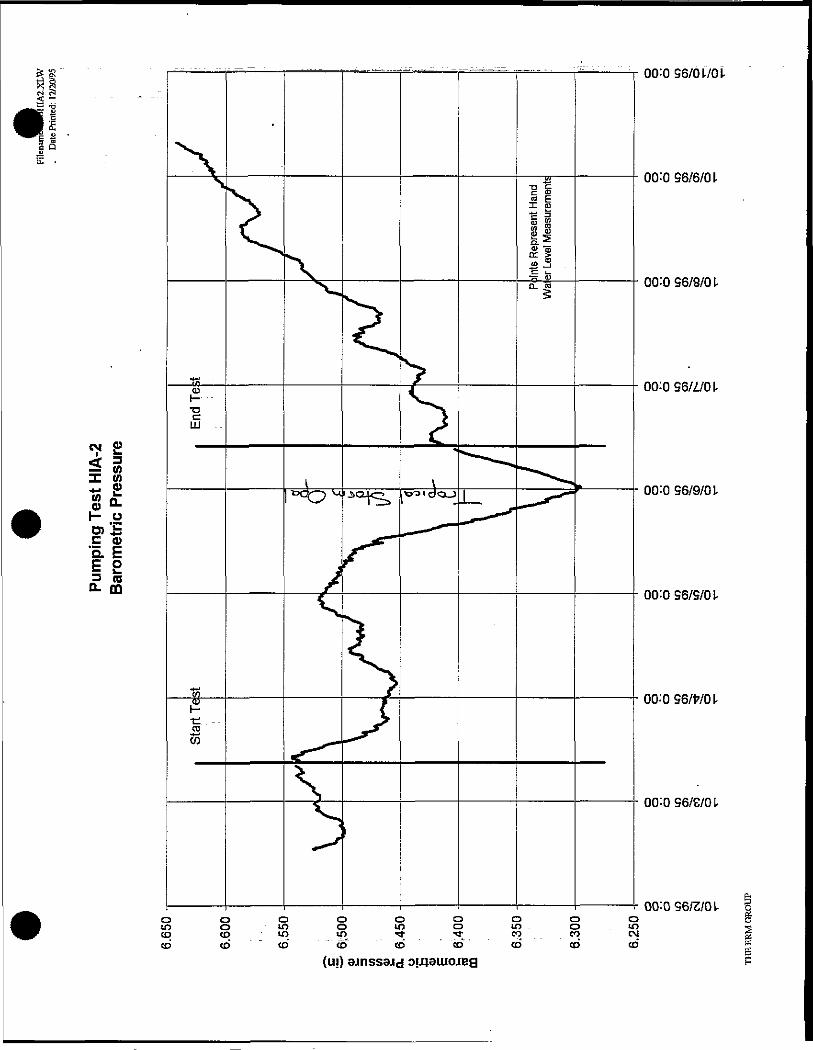
CM £<r 3I %0) >*•I- oo SC 0a E
D. QQ
LLJ
CD-4->CO
& s
00:0 96/01701-
00:0 56/6/0 L
00:0 56/8/0 L
00:056/i/OI-
00:0 56/9/01-
00:0 96/9/01-
OO.'056/WOL
00:OS6/£/OI-
00:0 56/3/0 1-o o o o o o o o oIf) O • tO O lO O tO O lOcq C P ^ I O . _ 1 P '**. °>! °°. ^Scd to to" to to" " CD" cd co to
(ui)
Hydrographs-Pumping Test HIA-9
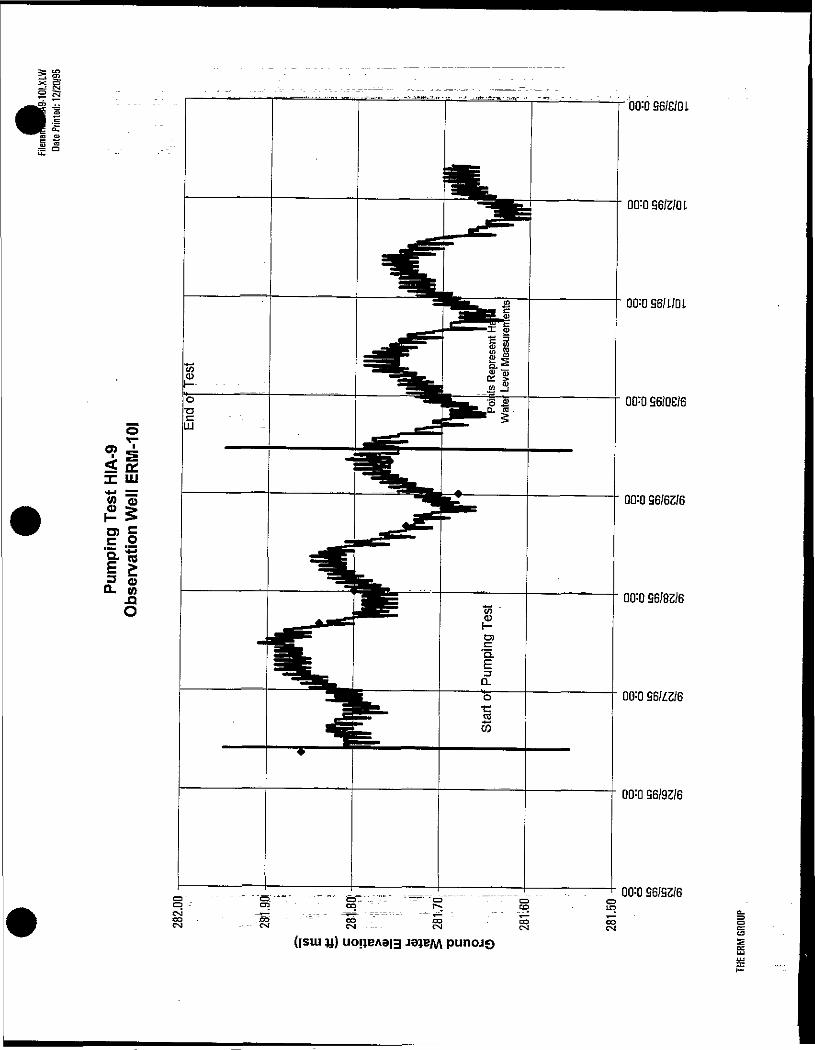
^ - g . . - . . - . - ———————i————————TOO:OS6/£/OL
' 00=036/2/01
X UJ
1= o
00=0 96/92/6
00=0 S6/S2/6
(|siu y)

OITOS6/E/01
00-OS6/ZJOI
00=0361 LID L
00:D S6/OG/6
S <^CMt
IL.
^ 0, ———————••————————•————-^^i——————————————'00=096/62/6
gjQ. f3S C=J Q _
00=0 96/82/6
00=0 96/ 2/6
00=0 96/92/6
00=0 96/92/6
(]SLU tf)

-TQO:096/E/Ql
00=096/2/01
00=096/1/01
00=0 96/OS/6
00=096/62/6
cp co< u-£0** —
°!siii30°- ———————————————————————————————— r ————————— '00=096/82/6
00=0 96/Z2/6
00=0 96/92/6
=D 96/Q2/6
(]sui u) uoijEAei3 J9JBM
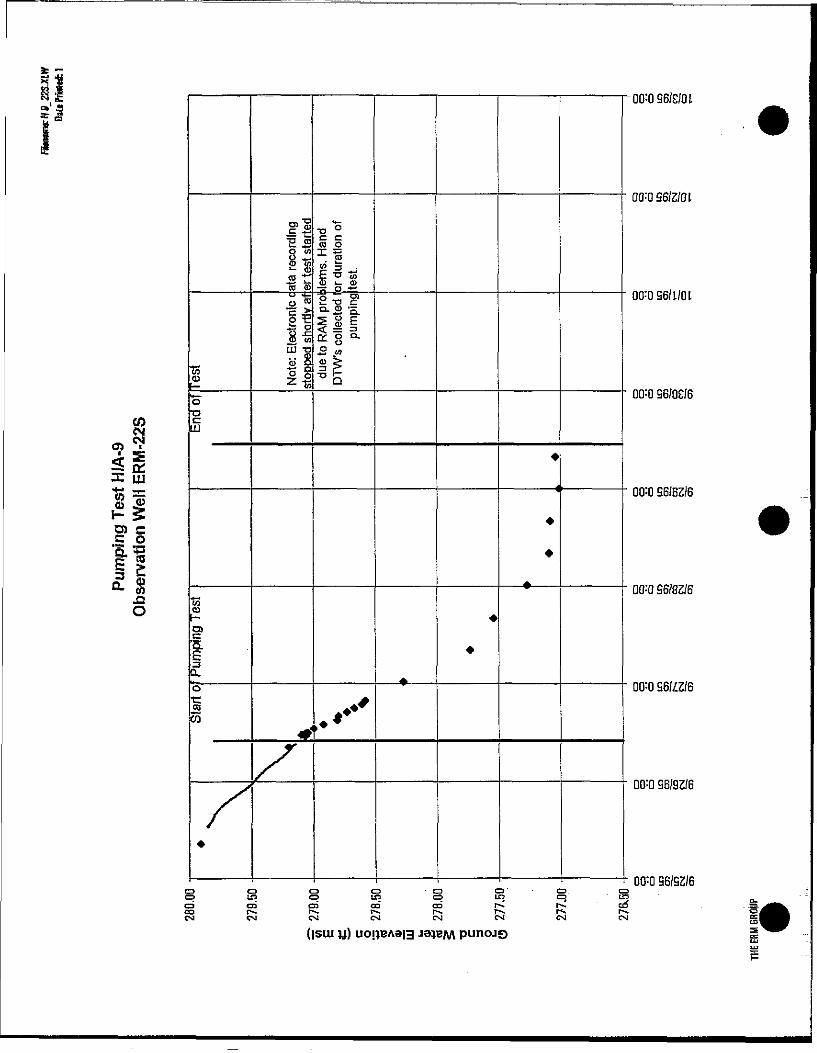
aCD
00=0 96/OS/6on
<f>CM ILU
O "w
•cegCO
15o fflitUJ T3
<D~ 0)
CO O-1E=
* So ,„
IS3: ui00=0 96/62/6
ll11
D0:0 96/83/6
00=096/E/Ol
00=096/2/01
00=096/1/01
00=0 S6/Z2/6
00=0 96/92/6
00=0 96/92/6O O O QO. C3f ^ l£3 <~ IjO " tigG3 CO ^ r*** P* en
CM CM C-J tM Csl CM
(]siu u) uoiiEA3|3 J31EM punojo
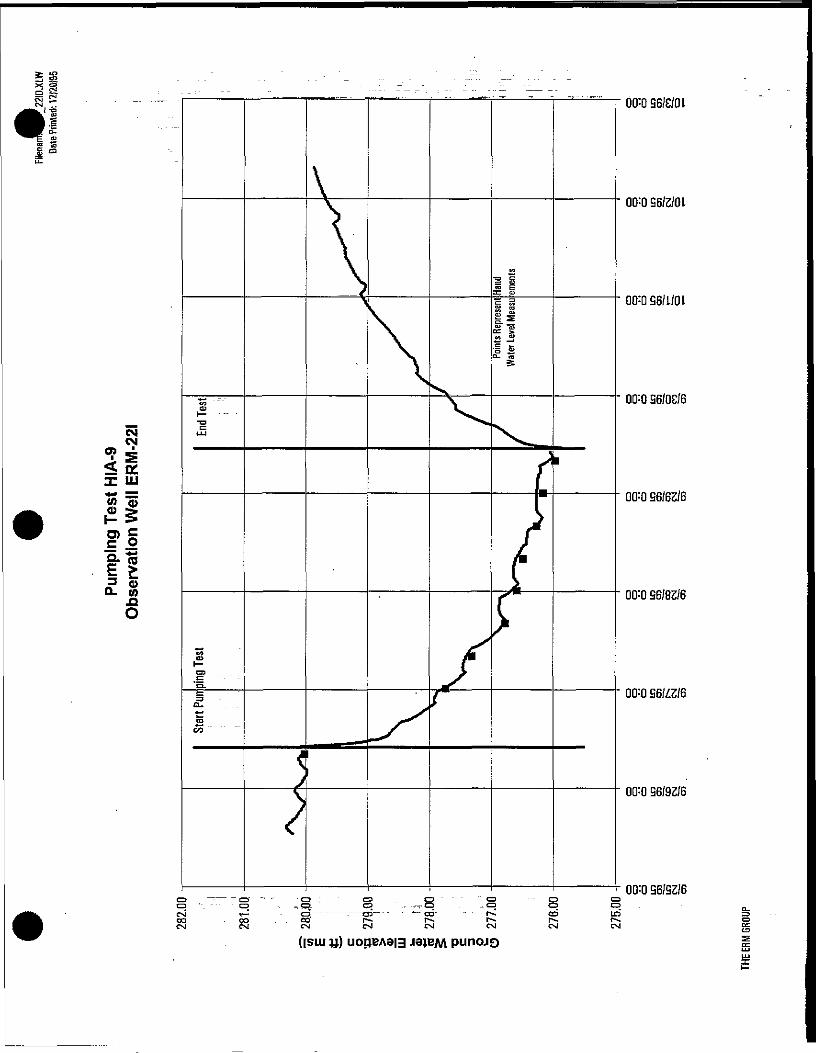
x: ga ~ ._._. -...- .... .... ._-,——n———___— 0'TS.s
CMCM
00=096/2/01
QLT096/L/OL
00=0 96/QC/6
S (tI 1U ,
00=0 96/62/6
O) =E O
ti00=0 96/82/6
00=0 96/Z2/6
00=0 96/92/6
00=0 96/92/6
(isiu u) uoi}EA9|g jajE/w punojQ
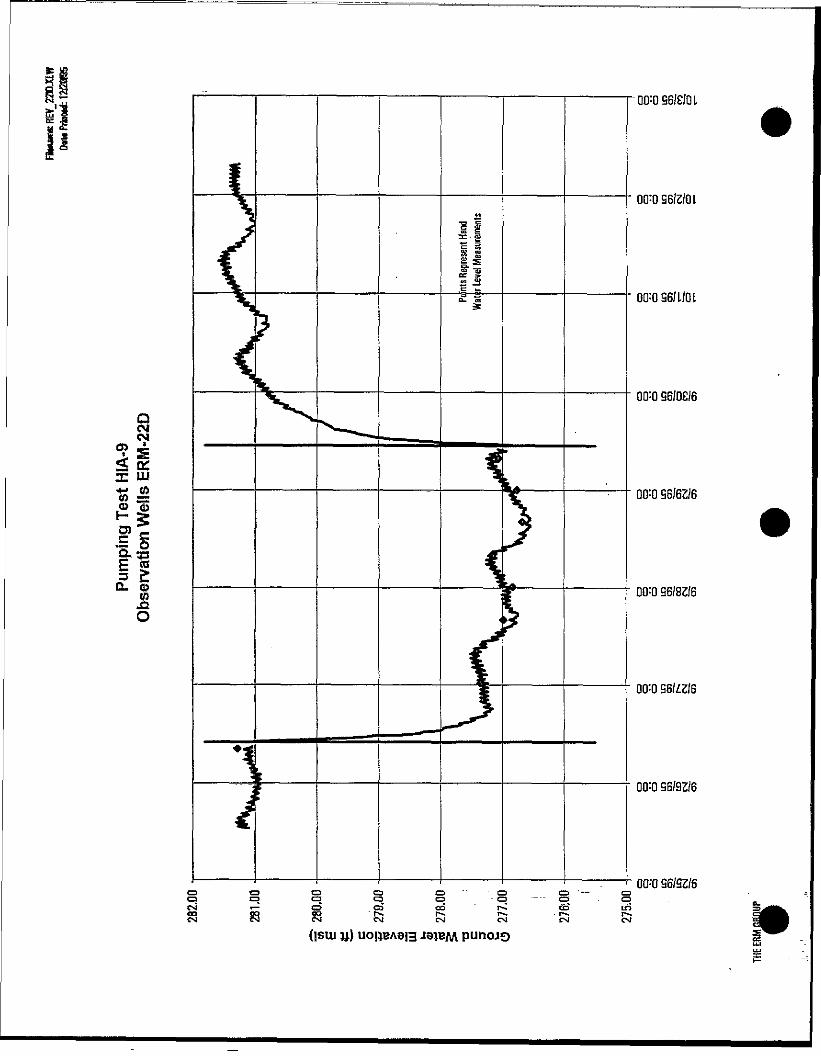
QCMCM
00=096/£/QL
00=096/2/01
00=0 96/I/O L
00=0 96/OE/6
00 096/62/6
I!Q. —————————————————————————————— —————————— -00=096/8216
00=0 96/Z2/6
00=0 S6/92/6
00=0 S6/92/6
(ism
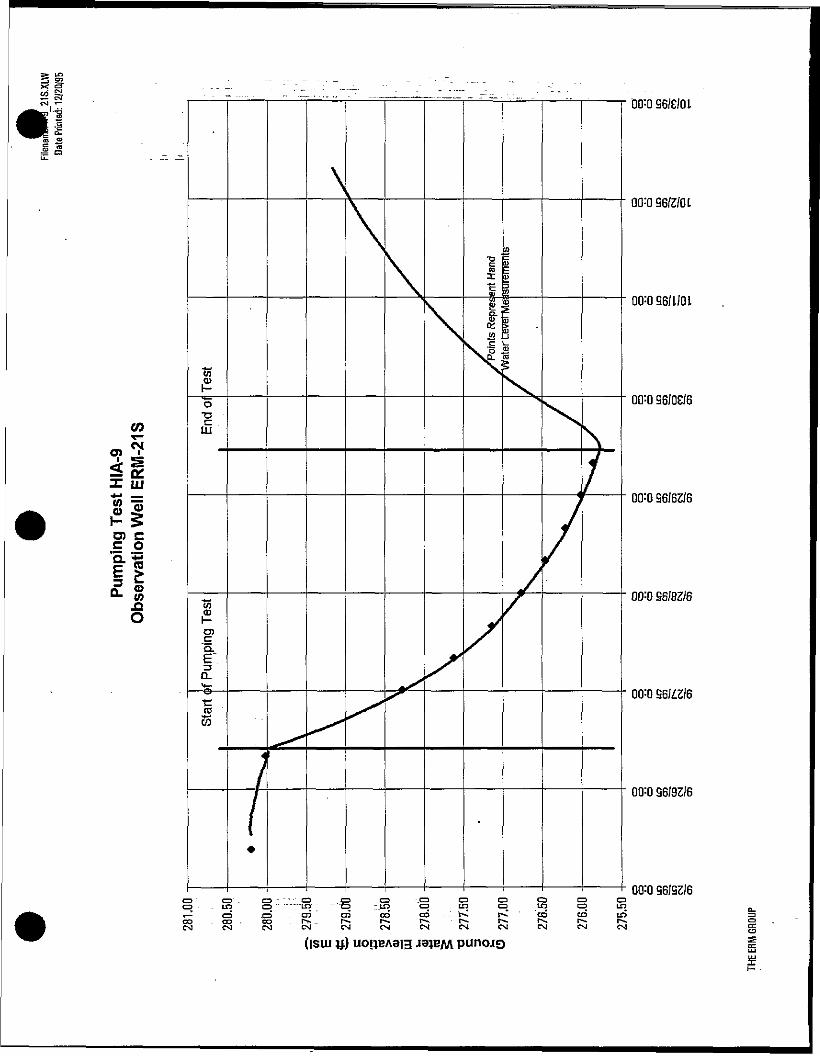
00=0 96/OS/6"5 ^ X.
CO
3|. LLJw _ f 00=036/62/6m V
DO:096/S/Ol
00=0 96/2/0 L
00=096/1/01
O) Cc o'5. '•€I SQ. g __——————————————————————————————^—————————-00=056/82/6
.QO
00=0 S6/i2/6
00=0 96/92/6
00=0 96/92/6
(isui y) UOI1BA3I3
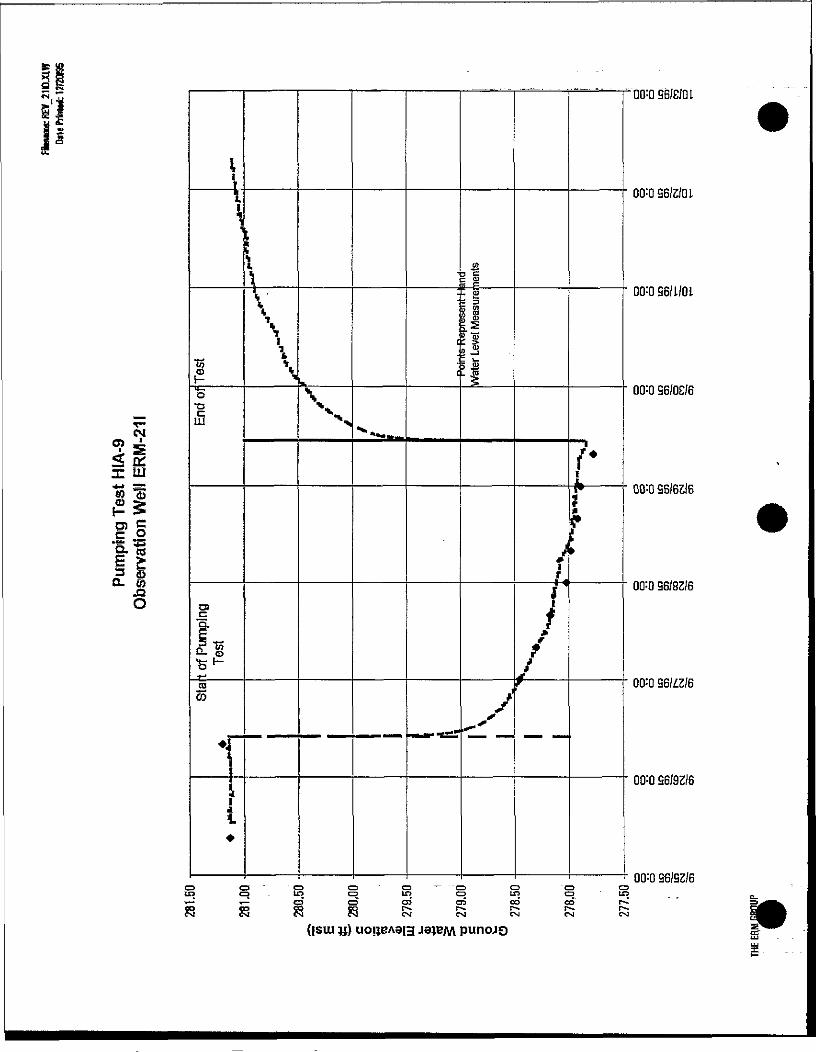
T-CMcp
< ££x ill80>
iiQ- 0
O
I
—— Vt
toO
o•Q
LU
Oi"a.E
tS
•j
ii
iI
•47
\I\
\
X**"«——
49S c•
I
i
- 15 tn8 J§• —* ?2 —i
•
y
// ./*/
™"?f«
.
"00=096/£/Ql
00=096/2/01
00=096/1/01
00=0 96/OS/6
00=0 96/62/6
00=0 96/82/6
00=0 96/12/6
00=0 96/92/6
00=0 96/92/6o co era co co r~- ^ t ^C CM (>J CM 0] OJ § F
f I gill Tl\ «ij^it»»A?4i—t imrt> * v\imr\if\ S ^ ^
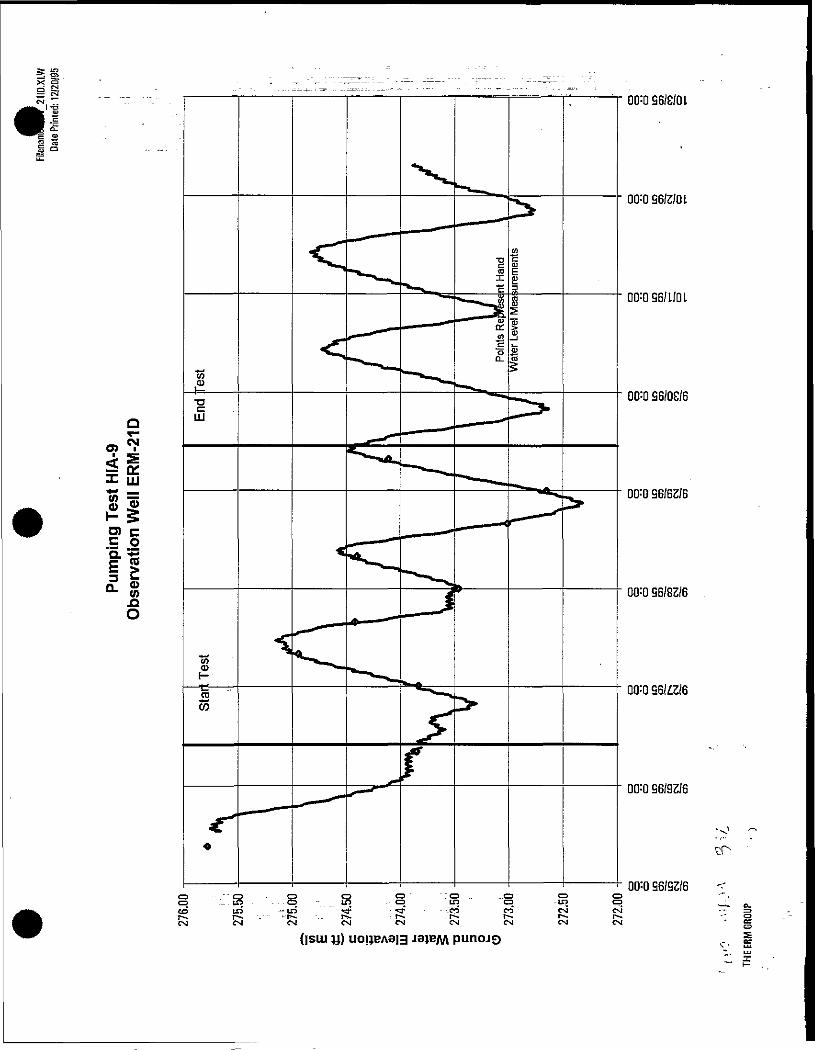
>< B • . - -V :~.—— • C\J _ _ . __ . ____ . „ _,_ . . _. . .. . . . .. _ _ _ . _ _ . - , _ , r -.,.
00=D96/£/OL
00=0 96/2/01
00=096/1/01
00=0 96/OS/6
o,
^ 00=0 96/62/6.= 1fi°- "E §3
00=096/82/6.QO
00=0 96/Z2/6
00=0 96/92/6
00=0 96/92/6
punoj£>
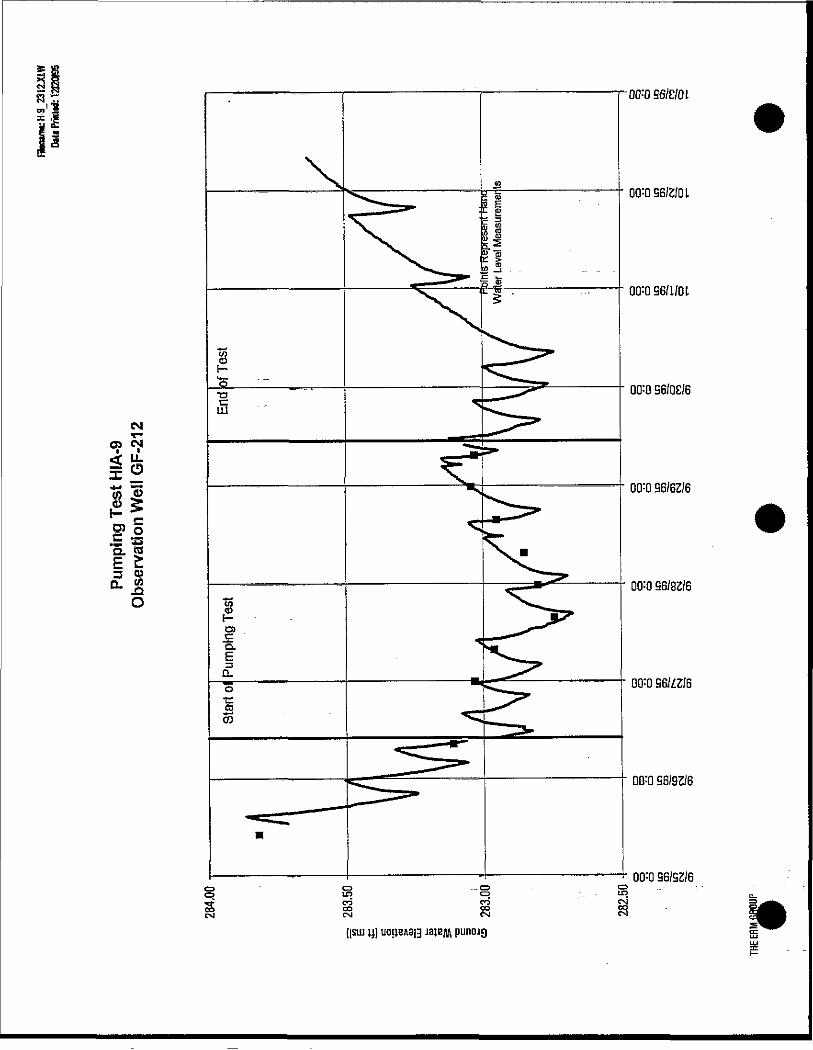
00=0 B6/E/01
00=096/2/01
00=096/1/01
00=0 S6/QE/6
CMOJ CM
00=0 96/62/6
*_ cg O
t!3 G)Q. jg ________———,———————————————___B-^^—————-00=096/82/6O
- 00=0 S6/Z2/6
00=0 96/92/6
00=0 96/92/6
([stu u) uo!iEAa|3 jaiEM punojg
Q_
.•
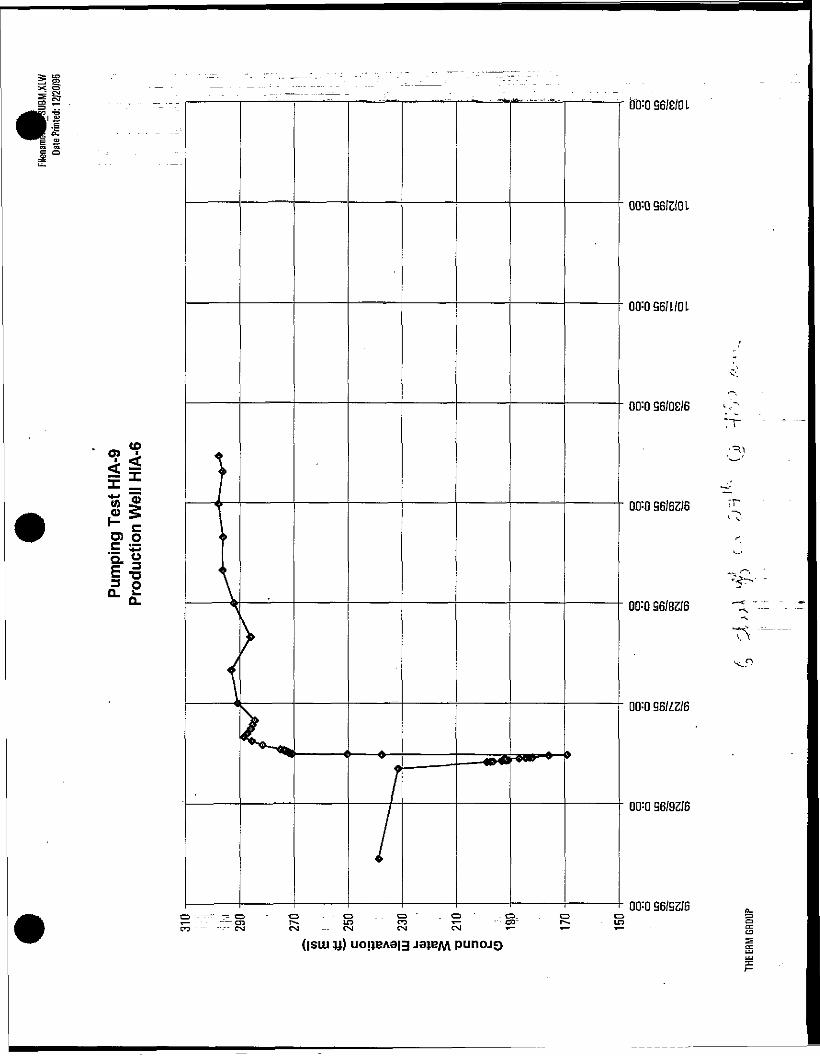
bb=o96/e/OL
X *
D) O
00=0 96/2/0 L
00=096/1/01
00=0 96/92/6
00=0 96/92/61 _ *""* - - ~_ ^^i " . C—*- . f^ f"^3 co ^~ "" oi~ r^— - unJ CM OJ i*- i— t—
(|SLU «)
^
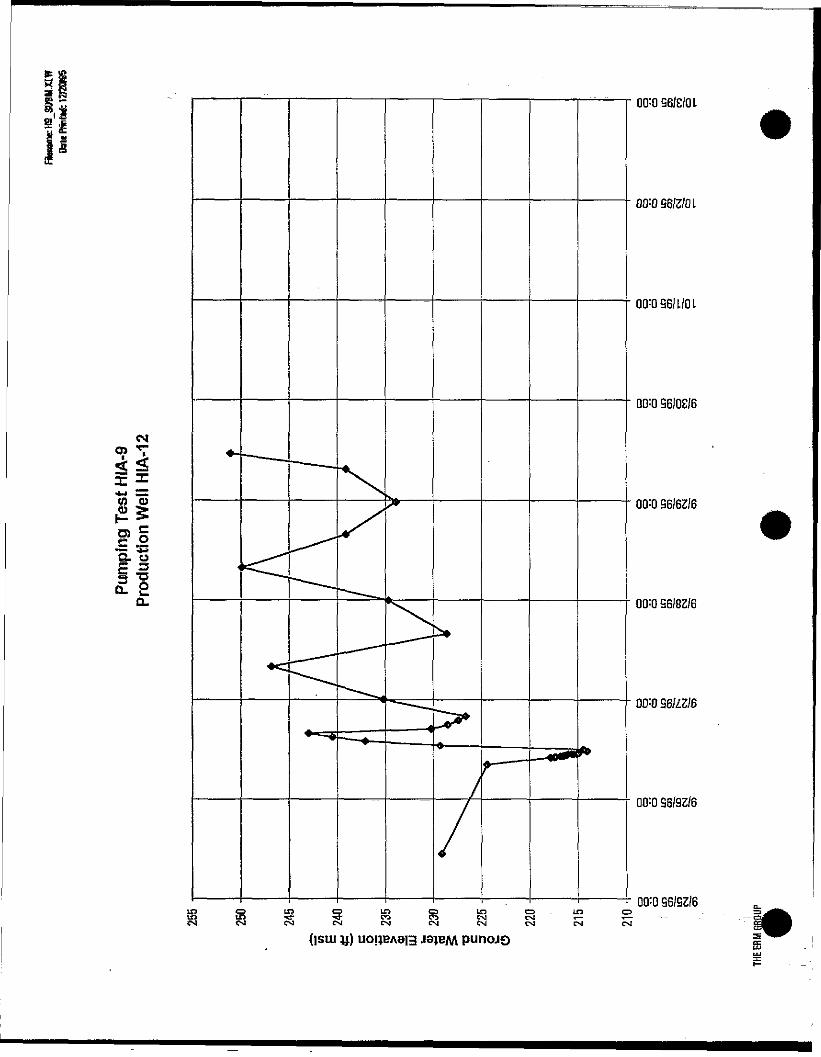
CM
00=096/£/OL
00=0 96/2/0 L
00=OS6/i/OL
00=0 96/OS/6
00=096/62/6
00=0 96/82/6
00=0 96/i2/6
00=0 S6/92/6
00=0 96/9216O - LC3 Oe«j <— i—W CM CM
(isiu y) uoiJBAao J3)BA/V punoJQ
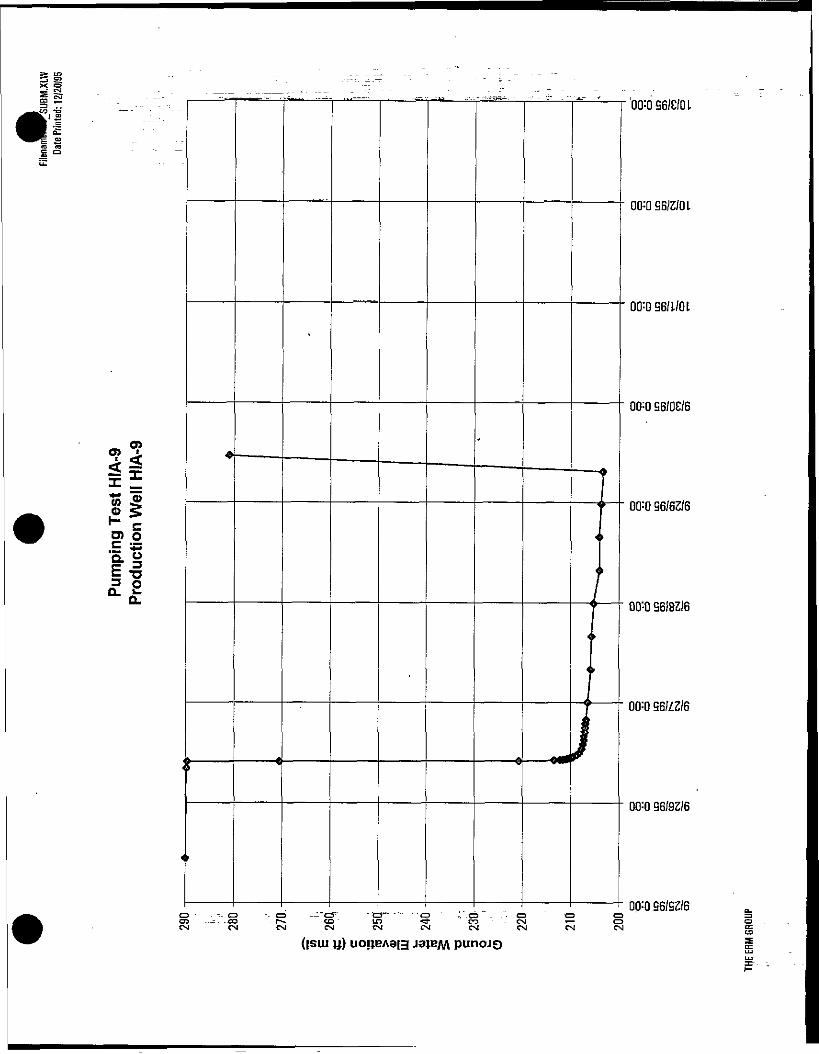
gp ^_-a
O) *i l , , , , , , , , , ,0 < r 00=096/62/6
D) O
II3 O
00=096/2/01
00=096/1/01
00=0 96/0£/6
00=0 96/82/6
00=0 96/Z2/6
00=0 96/92/6
C3<tCM
00=0 96/92/6
OSLU u) uojjEAaig J0JEM punoJQ
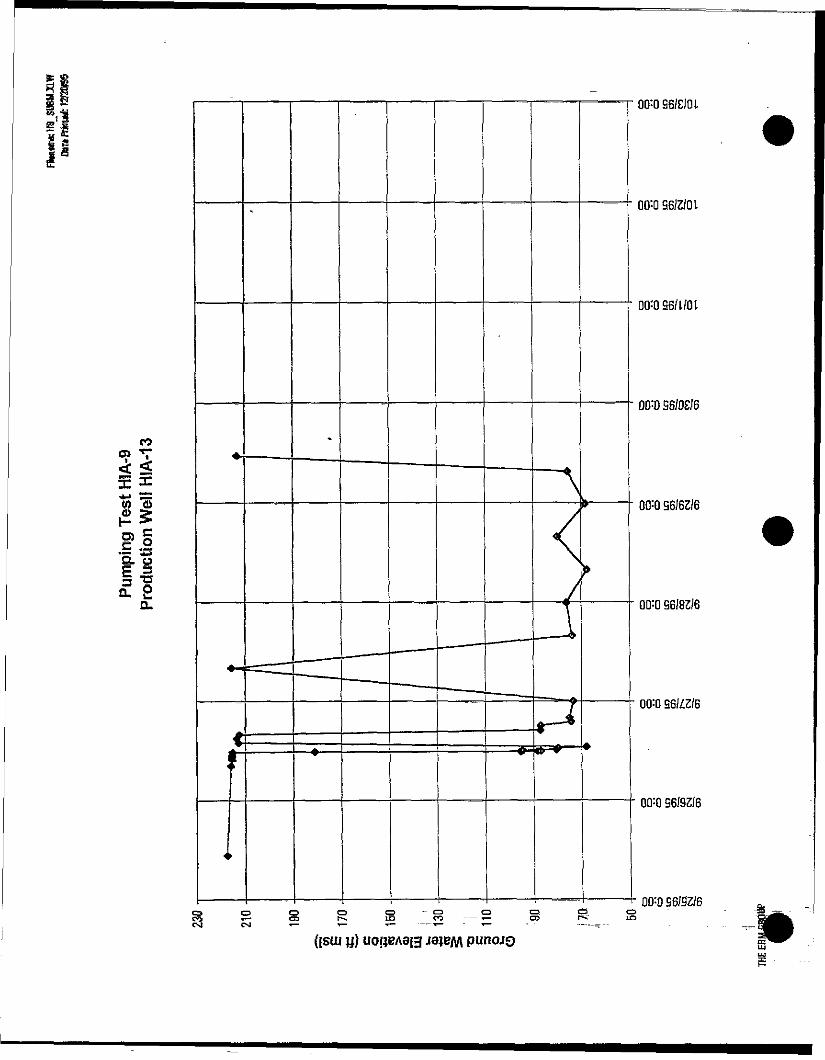
i 3
\%i S
CO
X"to
•5. ISE =§ "o£ sQ.
S °CO *—CM CM
(ism y) uojjBAeig ja;eM punojo
00=0 96/£/Ql
00=096/2/01
00=056/1/01
00=0 S6/OE/6
00=0 96/62/6
00=0 96/82/6
00=0 96/£2/6
00=0 96/92/6
00=0 96/92/6
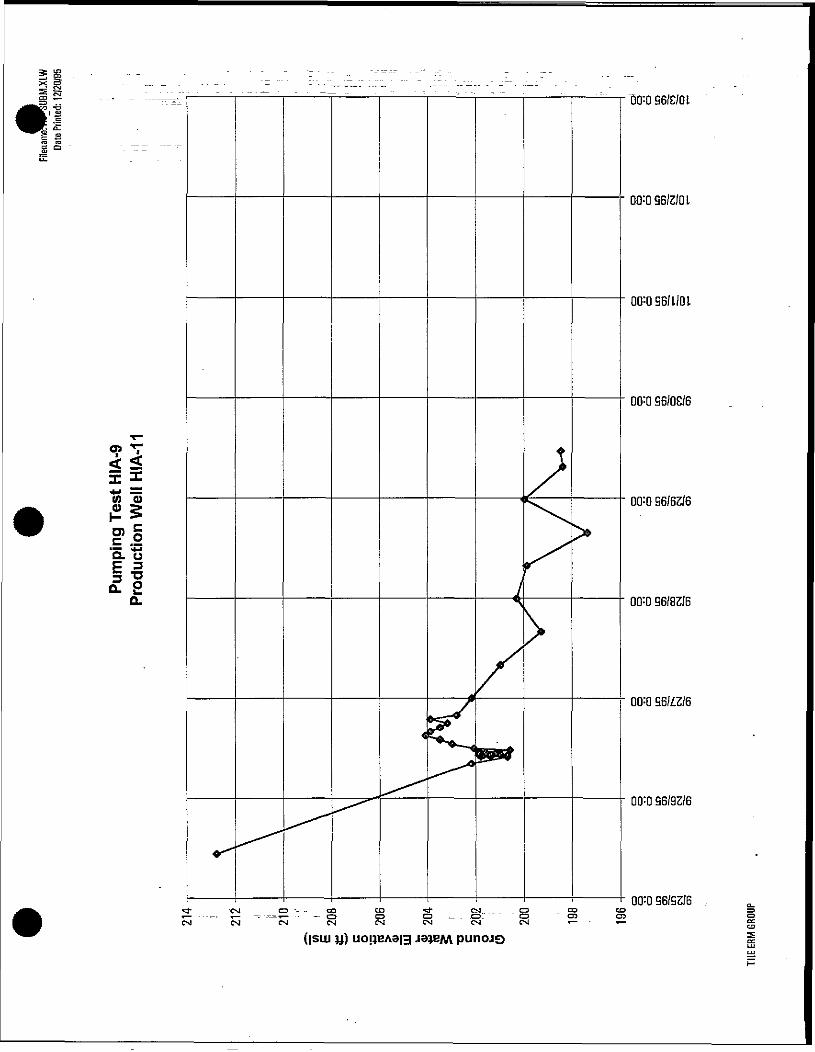
g o
~00=096/£/Ol
00=096/2/01
00=096/1/01
00=0 S6/OE/6
00=0 96/62/6
00=0 96/82/6
00=0 96/ 2/6
00=0 96/92/6
00=0 96/92/6
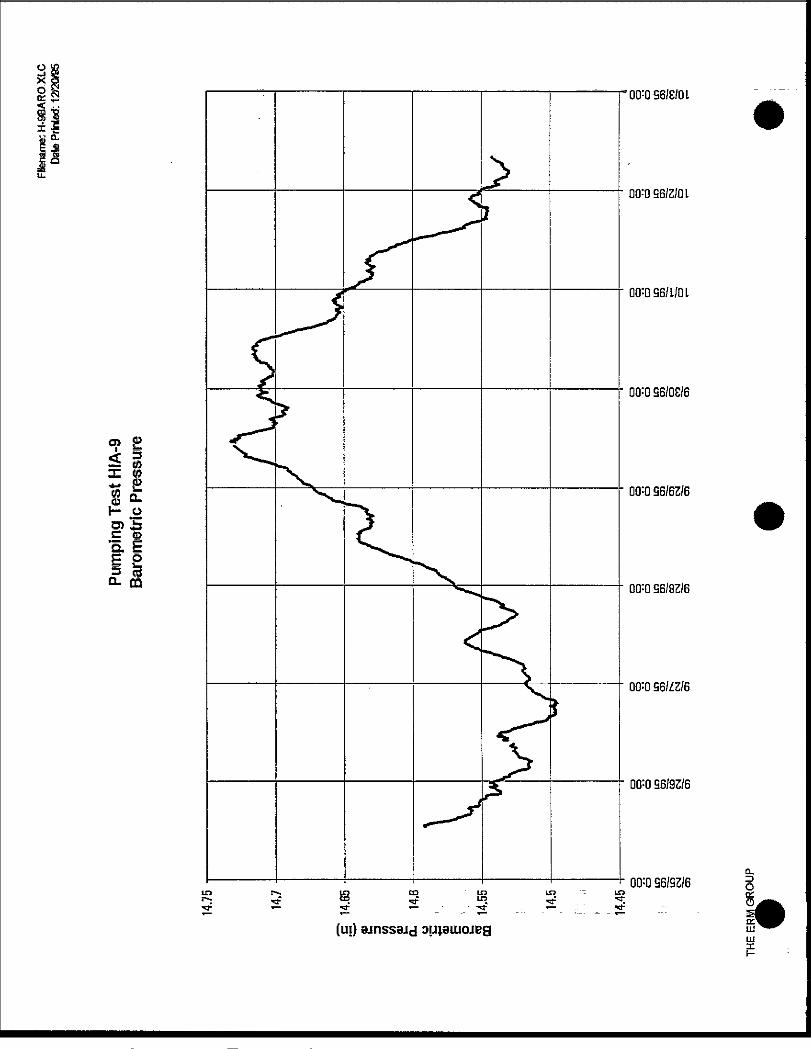
00=0 96/OS/6
CD gf —J
X* 0
t) Jr —————————^iT————————————————————————————u 00=0 96/62/6
00=OS6/e/OL
00=096/2/01
00=Q96/L/QL
O) £;C OS"E. EU _________________
'———————'——————————————'———a——'———————'———————L 00=0 96/82/6
00=0 96/Z2/6
00=0 96/92/6
00=0 96/S2/6
(ui) sjnssajd ouisiuojegLUX
Arithmetic Plots-Recovery Test HIA-13
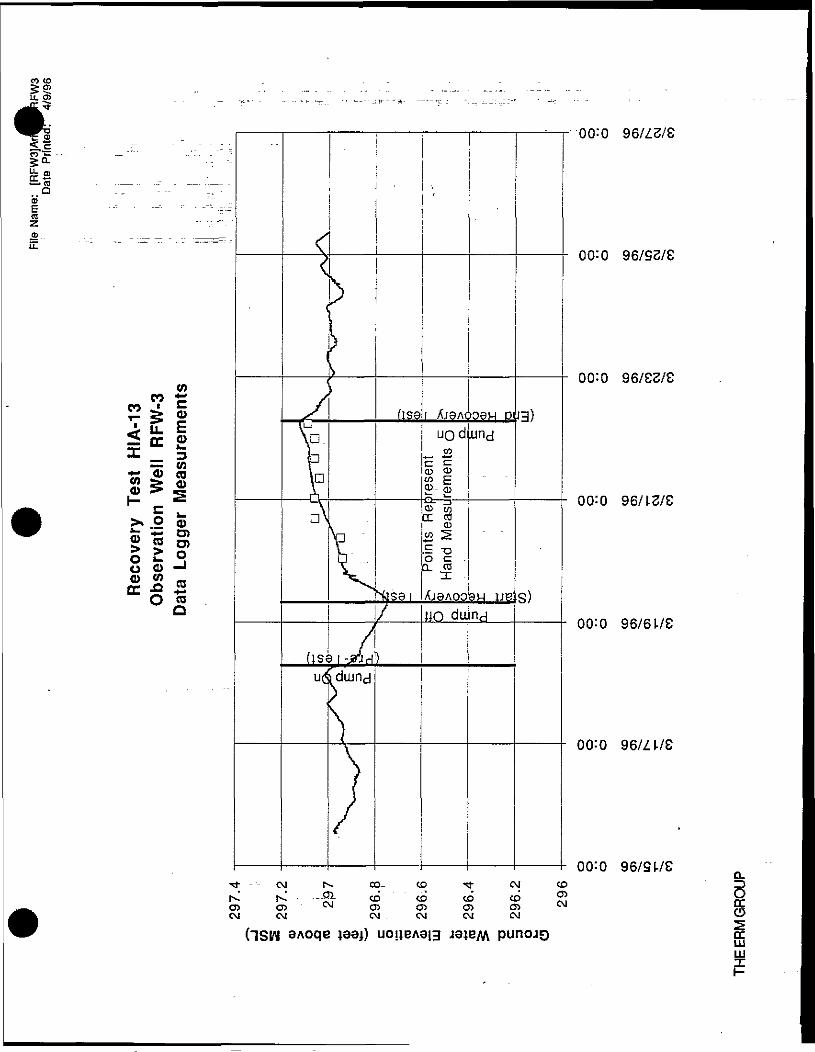
3(0
>» o a)
o o -*S 5 «tt rf *-O <oO
00:0 96/zs/e
00:0 96/53/e
00:0 96/SZ/S
00:0 96/13/S
00:0 96/6 L/S
00:0 96/ZL/e
00:0 96/5 L/CTt- - OJ l ~ CO- CD Tf CM CO(x, fv! ._-CB. (o tQ tQ ^ - • S
CM CM OJ . CM CM OJ
(ISIN 3Aoqe jaai) UOUGAOIH -iajeM punojQ ccUJUJ
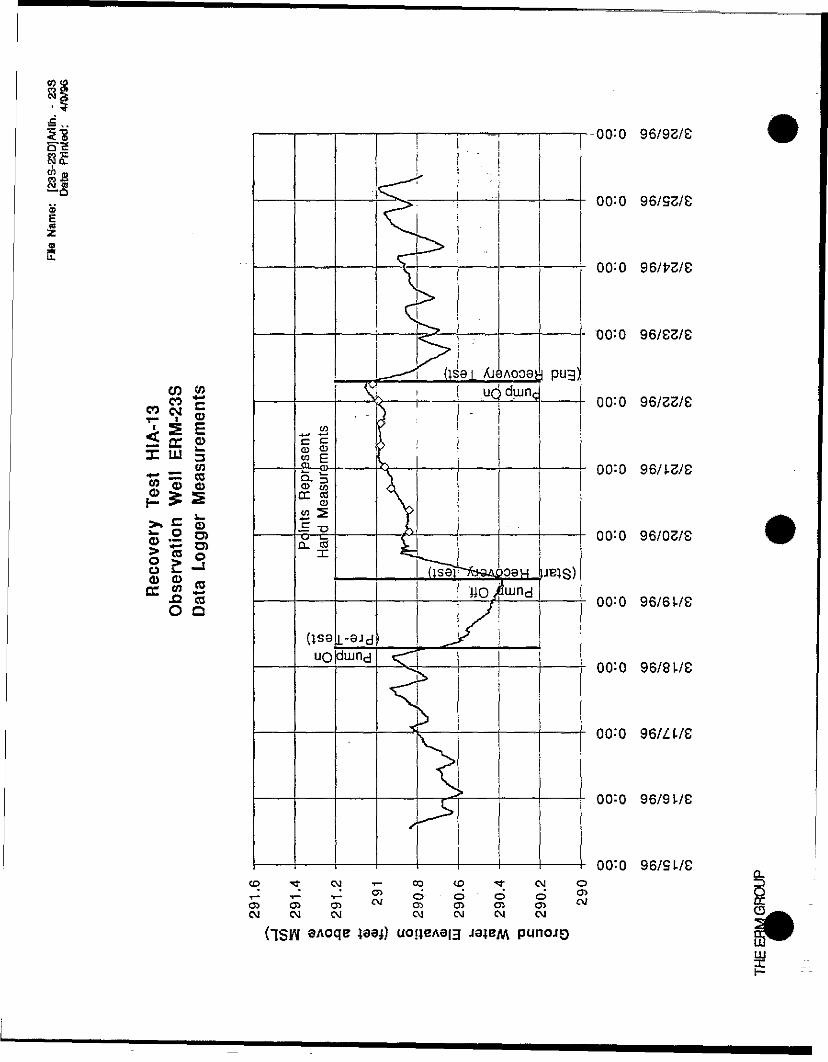
96/93/e| | . . .|
5"8n
96/53/8
o£
00:0 96/SS/S
« | |———|———|——— ——i———| "M""" 1———h OO^O 96/33/61
< oc _X IU 3— = S ———-£_a>-.—™*^—————————————————- oo:0 96/L3/Sg o oH 5 2
j- o g) ———^5_g——————(Jx————————_—————- 00:0 96/os/g
<D o roU™ ^ "^* ig co ———————————————————:——-————- 00=0 96/6L/SO O
00 0 96/8 WC
00:0
00 0 96/9 L/C
OO^O 96/9 L/C
OJ CM CM CM CM CM CM
(~1SW 9Aoqe &9fi uoi;eA3|3 JQ^BM punojo
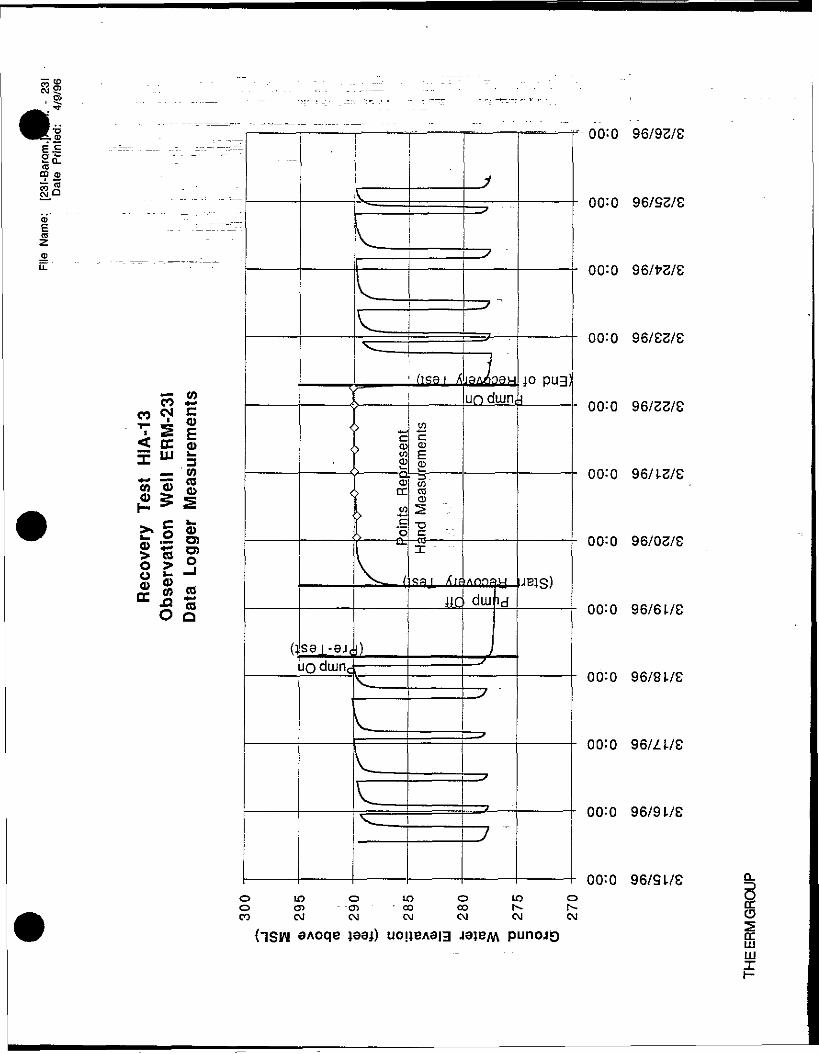
(Oo>s*•*
I ,————,————i • T —--r- — —— — OQ:Q 96/93/2e)=CO <D
ragu______ 00:0 96/ss/e
OJ ~E(8
. ___. -::. i-:-_-: — ——J:
. _ . . _ . : ._ -___
. —--^f-==
. . . . . - . : - . -
s: wr« CM C
51 15 m -— (0
« "S S
£* o g>5 1 5S 5 _oc ^ 200
cco
- —
(1
> u3 O:> o
)
iJQ QUjnc
•> cT OJ 0
V— ———
^Iv_v_
•*^
> 103
1 ^I -i
X^ /
\_
^^
v^
3 U•> • ' aJ C
tea. X
rements
COo
•o— <d —— —I - - -
U.C
7 CD aJ O
— -y
j
_j
"
jSA/nawun diuiif
diu-id
J
s
~1~*
_J
3 UD r-vl C
10 pu3)^
J js)
1 Ch-vJ O
00:0 96/173/S
00=0 96/S3/S
00:0 96/as/e
00:0 96/Ls/s
00=0 96/OS/S
00:0 96/6L/S
00:0 96/8 L/C
00:0 96/ZL/E
00:0 96/9L/E
00:0 96/Sl/C ^ccC5
J93|) uo!}BA3|3 jejBM punojQ ccUJX
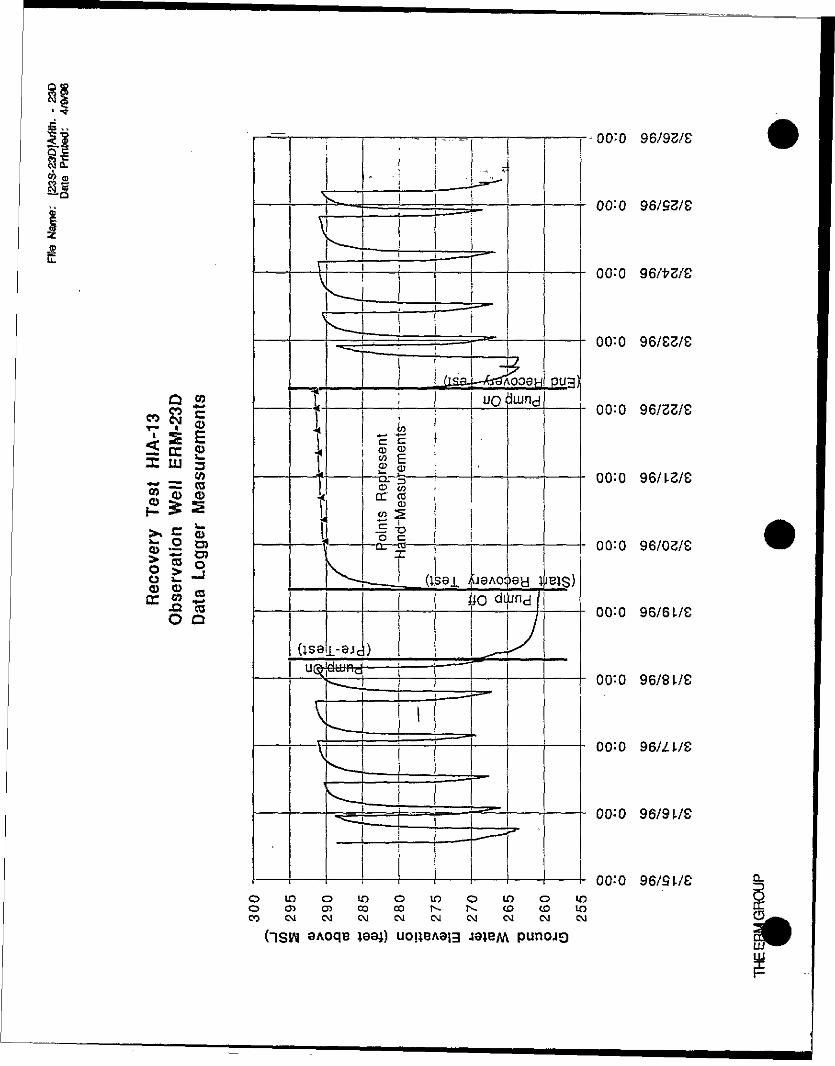
Recovery Test
HIA-13
Observation
Well ERM-23D
Data Logger Measurements
s
\-\
s
t\•
— \
UseUE$
V— \
N— ___
h
i t\-
_________i
s^— —— „
N^
i
l-ejc
— - — ,
— 1 —1 -
. — _.
Jiaadii
i!o> o1- ^CD yjCC cd
CD
"5 C-
-*• — —
}> --—
^-- _
__ — __-!=:
:
, (1
=»-
_T% 7
UO
561 ^J9AOC
J
j
1
! "
10 di
**~~
_--— -
bvooeyiuiricj
>9H }undl
7
pu ;
IBIS)
- UU-U 3O/3O/C.
- 00:0 96/93/S
- 00-0 96/ 3/£
- 00:0 96/es/s
- 00:0 96/33/S
- 00:0 96/LZ/S
- 00:0 96/os/e
- 00:0 96/6 l/C
uu-u yo/o L/CI
• 00*0 96//.L/S
- 00:0 96/9 L/e
O I O O 1 O O L O O L O O U 3C O C M C M C M C M C M C M C M C M C M
(1SW QAoqB leal) uoiiBAajg JSIEM punojo __UJ
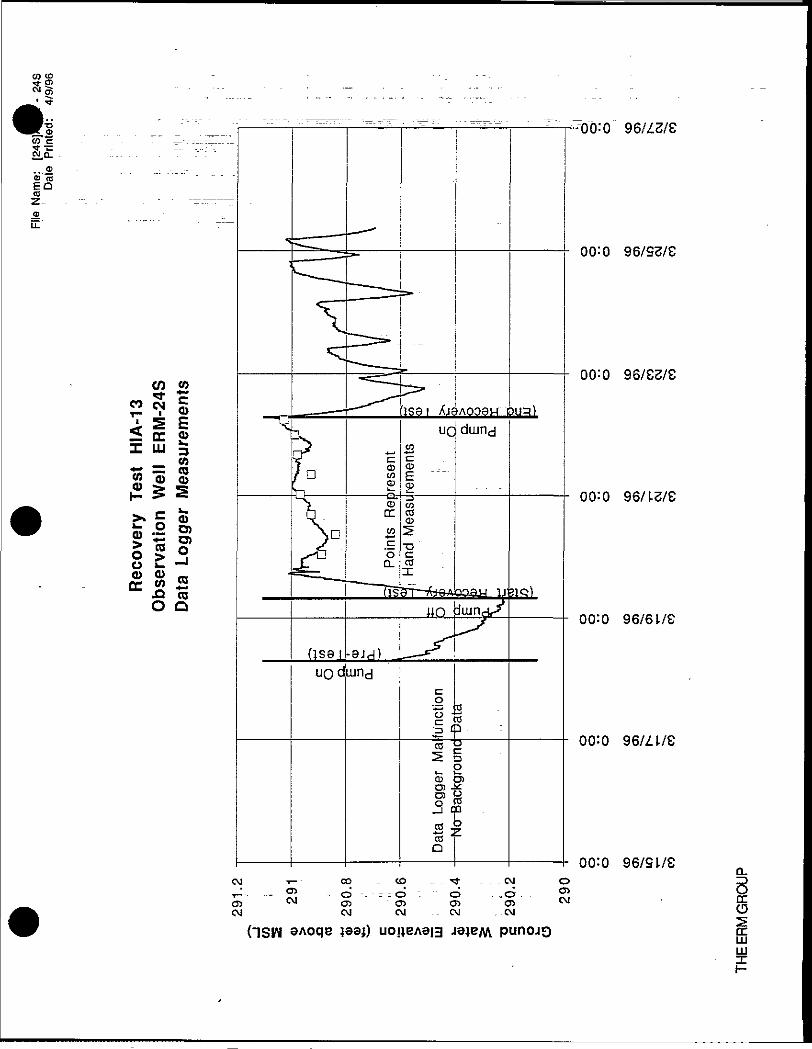
>:0 96//Z/ECO"
(0Z
_ . . 00:0 96/SS/S5?
<1IX LU 3_ «** « CO
00=0 96/9S/S
00:0 96/LS/S
Io £- -Jr? « «EC zi *-J3 COO Q
00:0 96/6 L/C
00:0 96/ZJ-/S
00:0 96/SL/SCM -i- ' C O - C O - " * -CMT^- -= 2> - CS - rzd -. - O ,003 W OS ' 0> 0> 0>OJ CM CM - CM - CM
punojoLUX
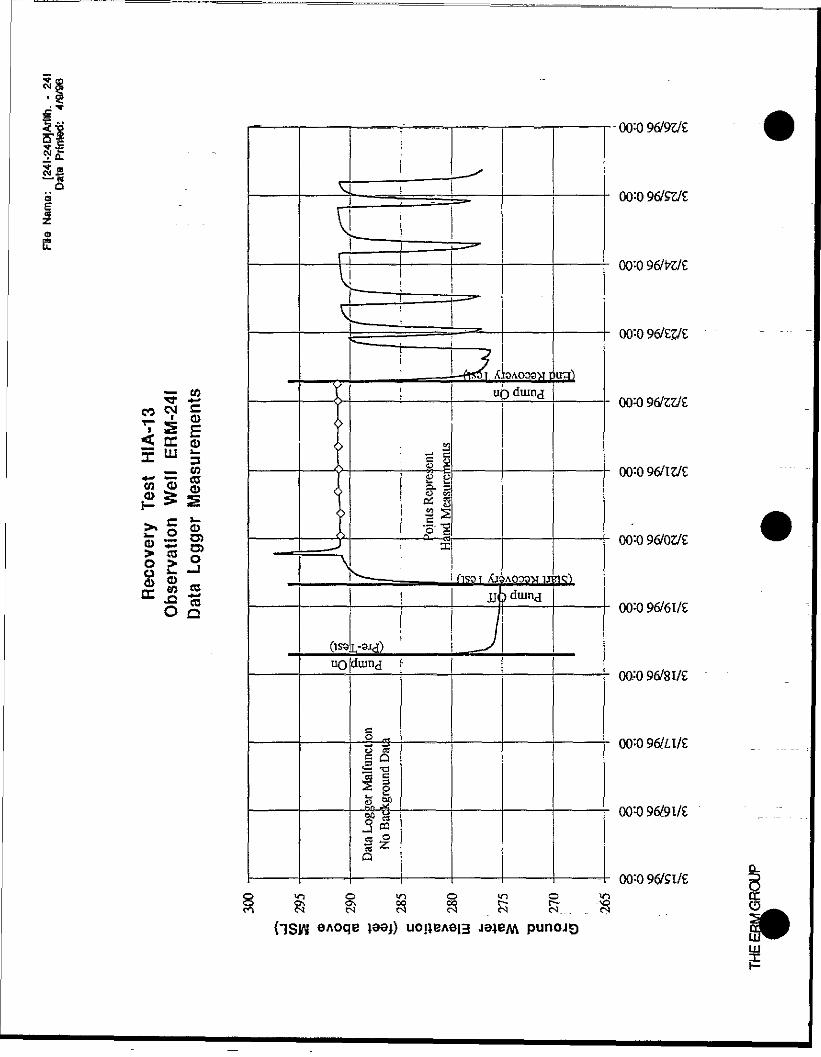
00=096/9tV£Q
00=0 96/SZ/t
0 96/W/£
..OQ=096/t%/£
^" 5 °< tC o
§
o >o *-
o;o
O Q I ———— 1 —————— : ——— I ———— ' - "If —— ""I —I 00:096/6l7£
00.:096/8I/£
00=0 961LI/S
OO'-O 96/Sl/Z gv i o m p i n O T i C C0s. CJ'v oo CG t~~ f~- - (n
(N es cs <s,,. S fc(1SIN 3AoqB )aai) uouBA3i3 ja)BM punojQ cq PLQ ^
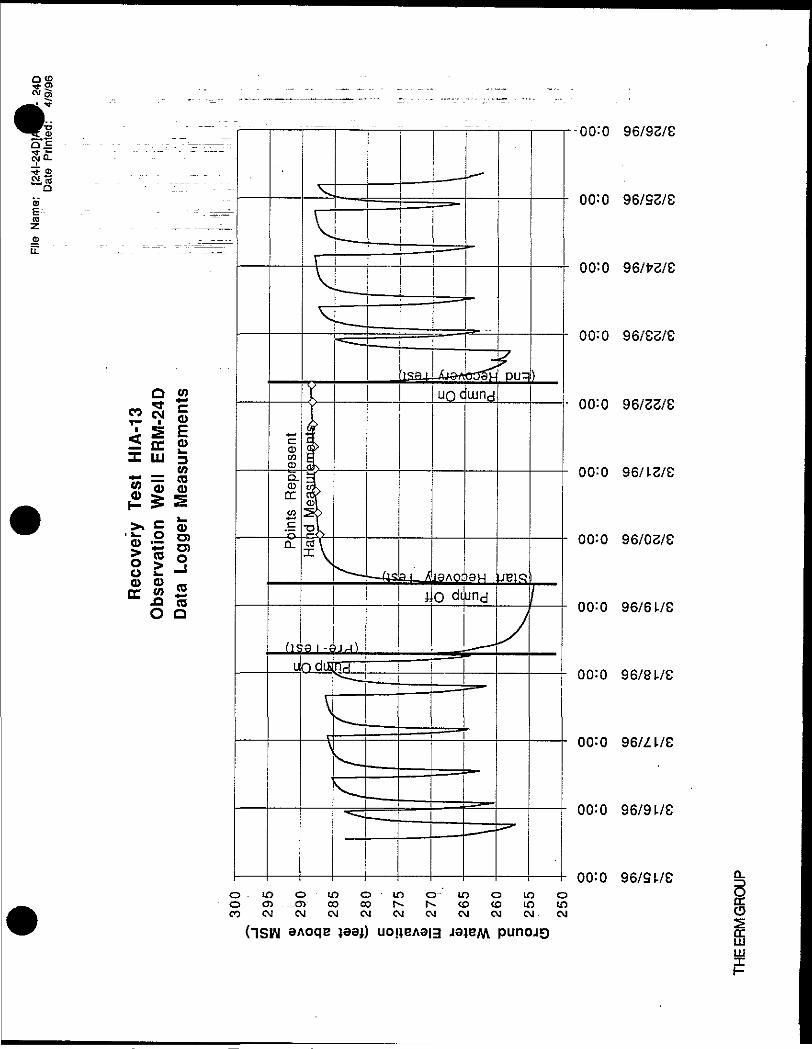
Q tD•*
S • • — r-—i——T'~"l " ," " i • T" ' i———i———r-00:0 96/9S/S
CD ————i———=_ 00:0 96/9S/S£--COZ
LL . _______r
^ "~ ' ' ! ' ! '00:0 96/frZ/C
00:0 96/es/e
00:0 96/se/s
00=0 96/L3/S
00:0 96/os/e
00=0 96/6175
00:0 9 6/8 L/C
00=0 96/ZL/e
00=0 96/9 L/C
00:0 96/9 L/CO m O L O O L O O - L O O L O OO C7) - -O> C O C O h - h - C Q C O L O L OC O O J C M C M C M C M C M C M C M C M C M
(ISW aAoqB jaai) uoueAao jaje/w punojo ccUJ
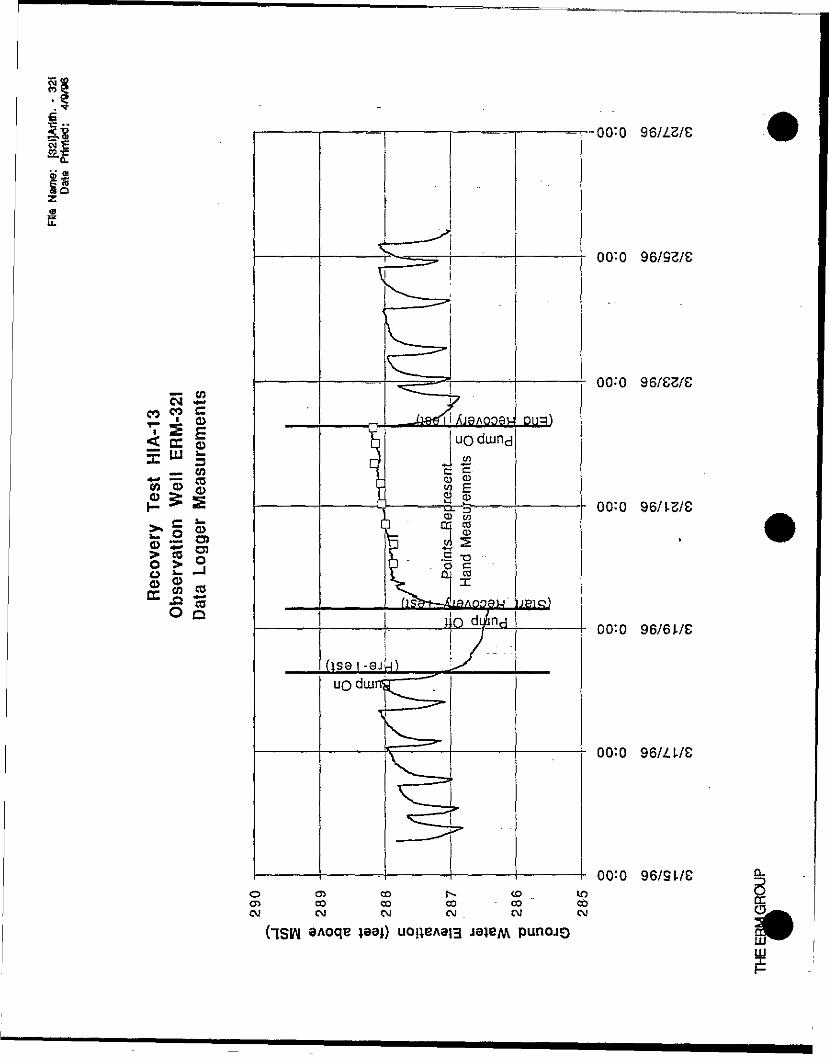
o> 2
00:0 96/zs/e
OO^O 96/9 /S
00=0 96/SS/SIN S 'CO C
^ LU ~— CO
"en "5 OTO fe S " ~ " 00:0 96/LS/S^ ^ ~ 2>* n Q>o S S> « ao > °.o *- -JS * -QT CO CO
5 «O Q
00:0 96/6 L/C
00:0 96/ L/S
- 00:0 96/9L/E %o d co i- . co to yC7> CO CO CO ~ CO CO 9sCM OJ OJ CM _ CM CM
(1SWUJ

Q £-000-
Q> niEQmZ_fflLL
LO OO 5 :CM - - - CM
aAoqe ;eaj) uoi;eA9|3
00=0
00:0 96/93/C
00:0 96/£3/E
00:0 96/6
00:0 96/zive
00:0 96/9L/C
ccUJ
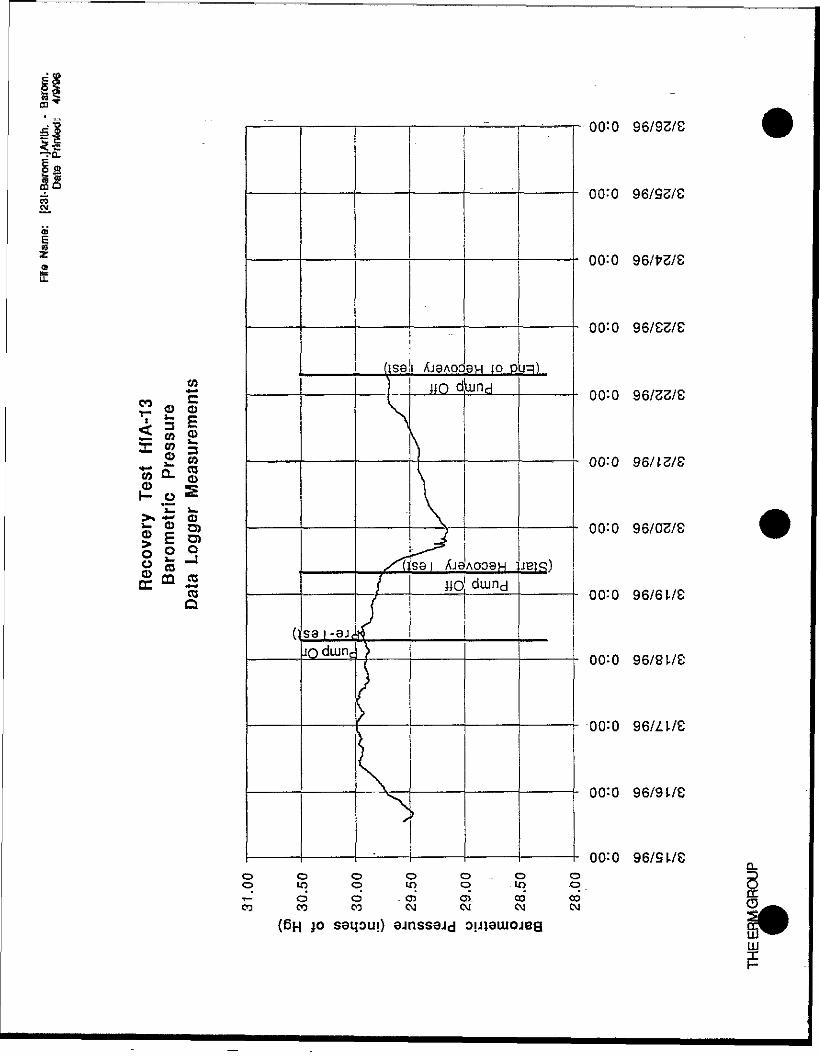
» m= *
00=0 96/93/S
00:0 96/se/e
00:0
00 0 96/ES/S
*: i———|———i——i—|—»v -p-q—I———L oo:o 96/S3/e5 £ §< 5 g
03 3£ « _____———————————j———————————————- 00:0 96/Le/S
co Q- go ^I- .o *i_ LS* g S I———I———1———I—VH———I———h 00:0 96/os/e• £1 Oo £ os «E m ^S"- ca j—————I—————|-^——i———"v| •"• " I—————L 00:0 96/61/8
Q
00:0 96/81./C
00:0
OO'O 96/9 L/C
00:0 96/9L/CO O O O O - O Oo 10 o in o . in oT — O O - O 5 C 3 ) - C O C OC O C O C O C M C M C M C M
(6H jo saijou;} ajnssajdLLJX

96/33/S
00:0 96/S3/S
00=31- 96/LS/g
CO COT 5 tOI &• 1—
X UJ I ———————————————R———————————- OO'-O 96/LS/e
£ ££ 5 «* COC O
d) *•?> 5 "°o > c« eo ICC .Q
00:0 96/03/2
00:3 L 96/6 L/C
00=0 96/6L/SCO CD •* - CM T - - C O CD
OJ O O01 01 o> 02 *•** 01 -m o)CM CM CM CM CM CM CM
SAoqe laaj) uouBAaia JOJEM punojg
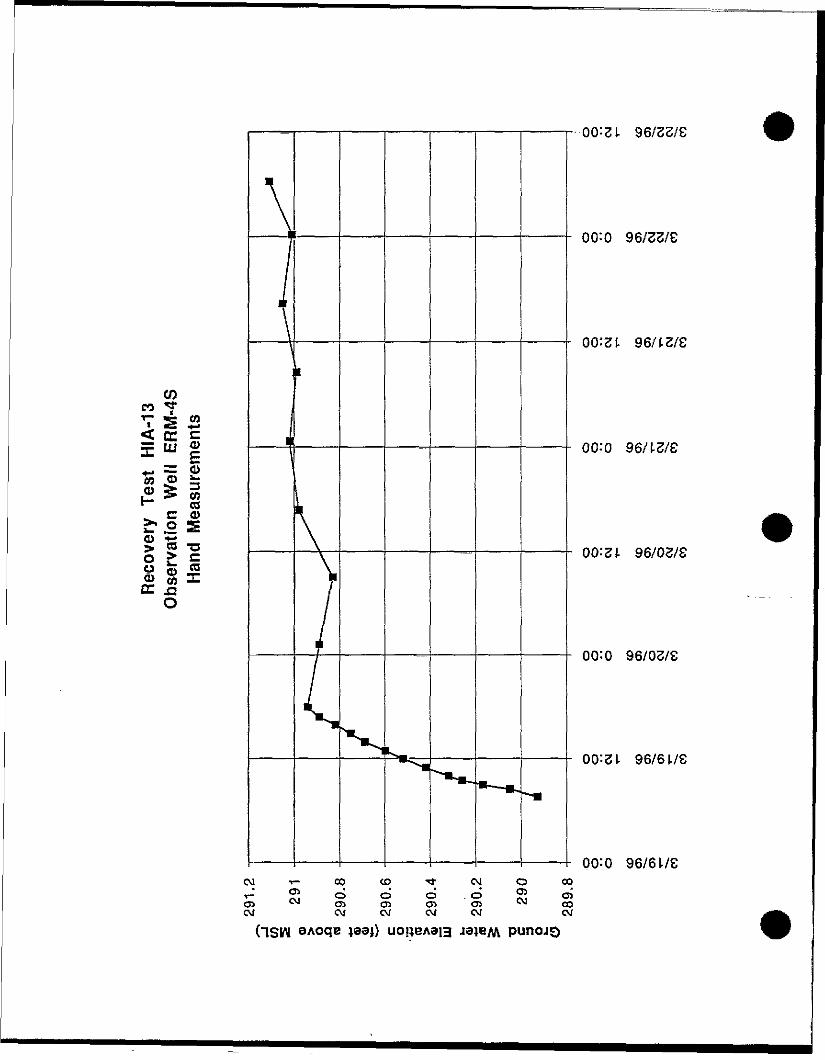
C M i - C O C D ^ t C M O O O
OO'Si. 96/33/S
00:0 96/33/e
00:31 96/L3/8
COco *fT S «« «: *-< CC =— Uj i ————————————————————————————. 00:o 96/1.3/8*- = Ow o _-£ £ i^ ca
CO)£* 5 sCD •*-•g 5 "i ———————————————————————————" 00;ZL 96/OS/8» « To> en XCC SO
00:0 96/03/S
00:31. 96/6 L/C
00:0 96/6 L/C
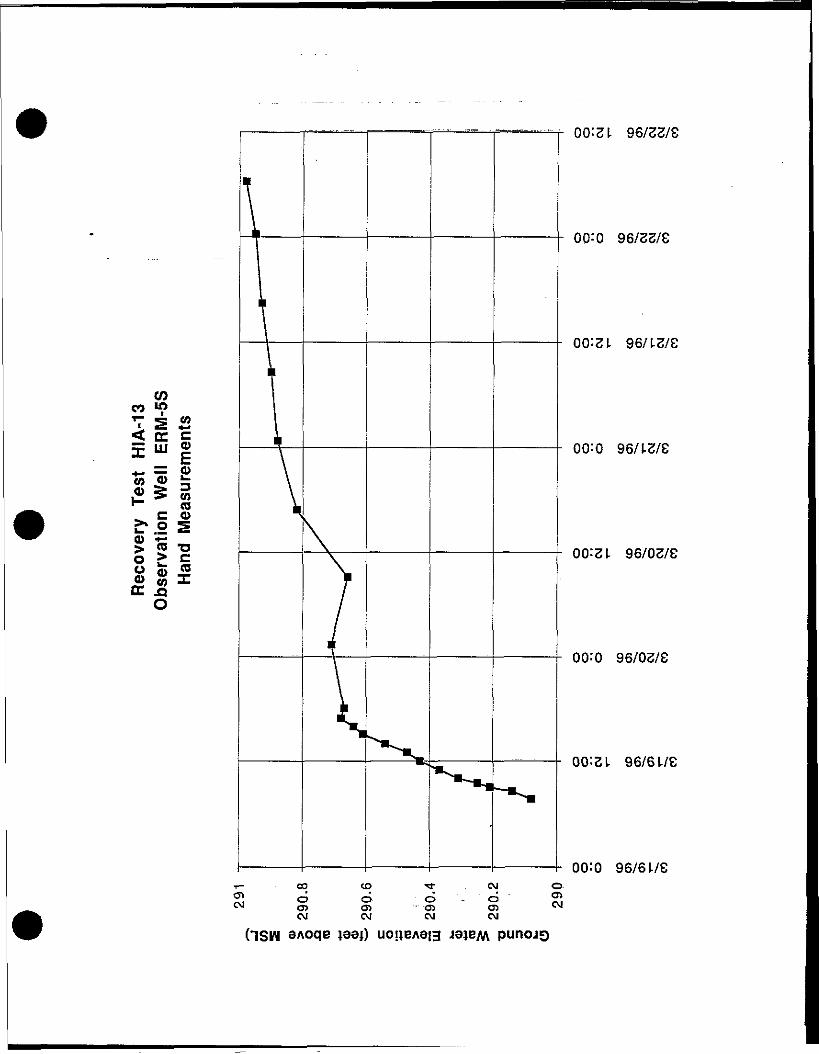
96/33/S
00 0 96/33/8
00:31. 96/L3/8
COCO WT 5 OT' «S *-•^ DC C— Uj o
^ = cu« 5 3£53• CO^ C CD£*.2 S(D <O > c ———————————————————————————- 00:31. 96/03/8S ® -?o> OT iCC AO
00:0 96/03/8
00:31. 96/6 L/8
00=0 96/6L/S
(1SW SAoqe jaei) uoijBAao
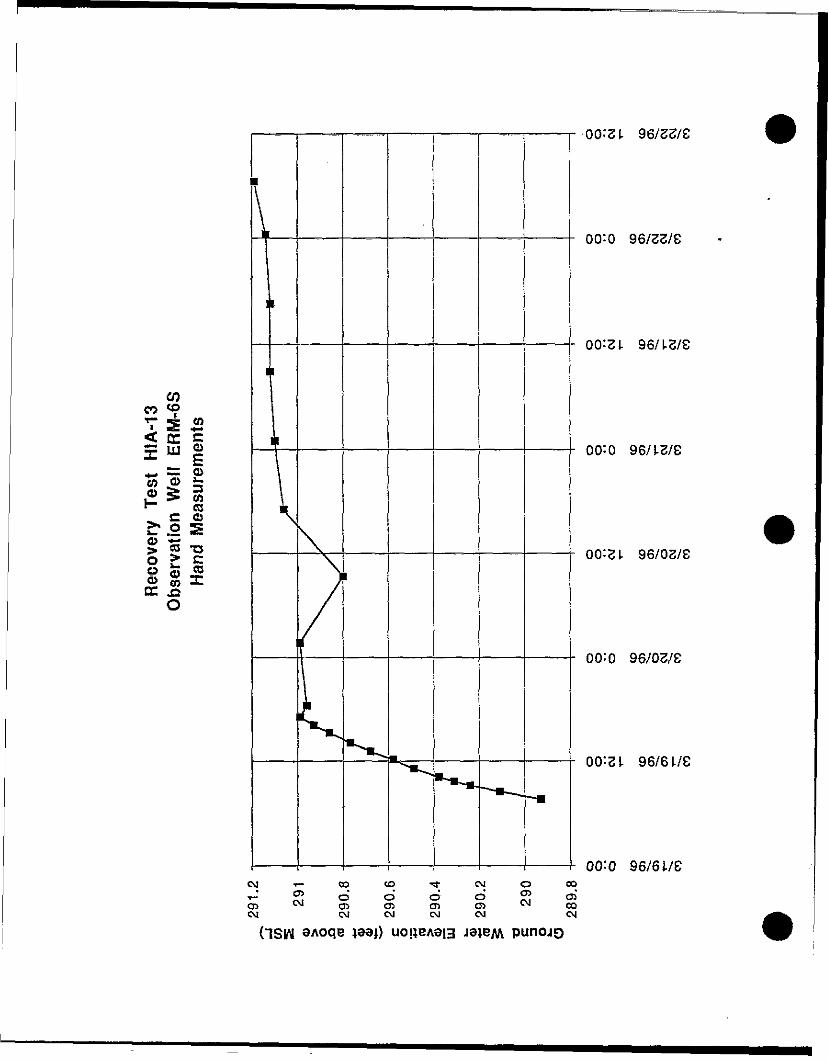
eno <?•7 «* f •«-< cr £s? ui ®X *" g^ == o>CO O 5,2 S §^ COc o
o > cs 5 450> £/) Xcc SO
00:31 96/33/8
OQ:0 96/33/8
00:31. 96/L3/C
00:0 96/L3/8
00:31. 96/03/8
00:0 96/03/8
00=31. 96/6 L/8
00=0 96/61/6
CM CM CM CM OJ CM
(1SH
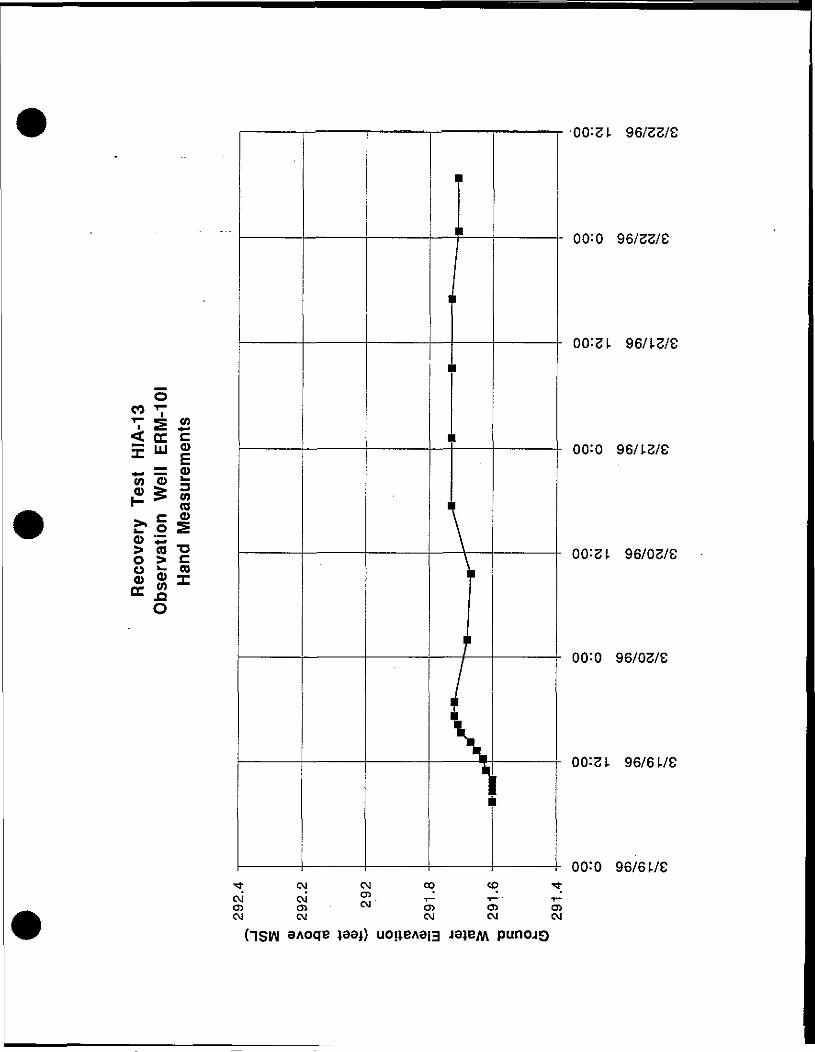
oco -7T S OT< CC |J_ «
+- =r o>CO CD
* " (fl™ fll
CD > CO "O0 > Co »- coCD «) X
O
.
I
1
1
i
i
-L1 1
1 1r1- CM OJ CO <£> TJCM' CM* ?] ^ -O3 O> ' Ol C31 CCM OJ CM OJ O
00:31. 96/33/8
00:0 96/33/8
00:31. 96/L3/8
00:0 96/L3/8
00:3 L 96/03/8
00:0 96/03/8
00:31 96/6 L/8
00:0 96/6L/C
(1SW aAoqs jaaj) uoiieAei3
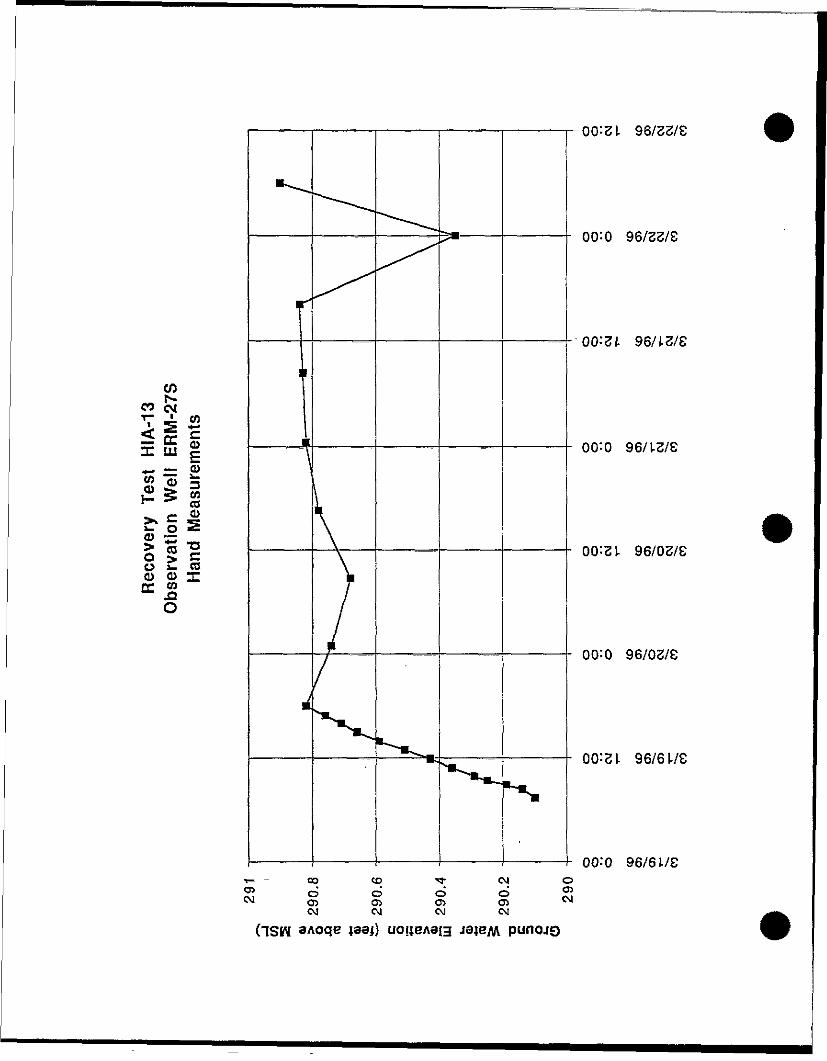
00:31. 96/33/8
- co CD "3- CMd d d den o CR 01CM CM OJ OJ
(~1SW 3AOqB 139)) UOI1EA9I3 J3JBM
00:0 96/33/S
96/L3/8
COCO CMT 4 5< S cX S I I - -Tl—————i—————I———-H—————h OO'.O 96/1-3/8, »_ CDco <n ir
ff*lO 2 "c ———————^——— —————————————- 00:31. 96/03/8O i- COCD O X
XIO
00:0 96/03/8
00:31. 96/6 WS
00:0 96/6 L/S
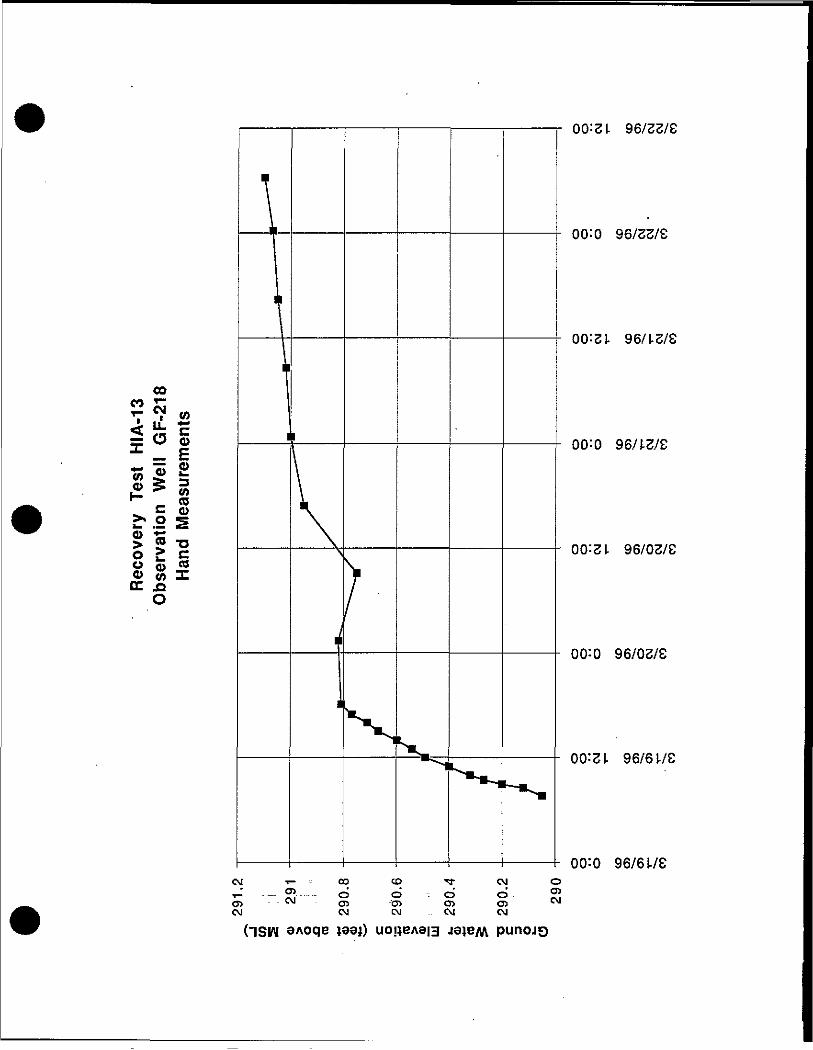
COco r:=
00:31. 96/33/8
00:0 96/33/8
00:31. 96/L3/S
X c ————"————————————————————————- 00:0 96/L3/8
« I 3
C CD£* 5 S<D "••-> > -O |————j———^—————————|————|————L. 00:21 96/03/8U m CO
D?^1O
00:0 96/03/8
00:31. 96/6 L/C
00:0 96/6178CM T- - OO CO TJ- OJ O^ .__ »...__ o o - o o 05O5 CM CD CD Ol O) ^OJ CM CM .. CM CM
(ISIN aAoqB iaej) uoi}BAd|3 JSJEM punojo
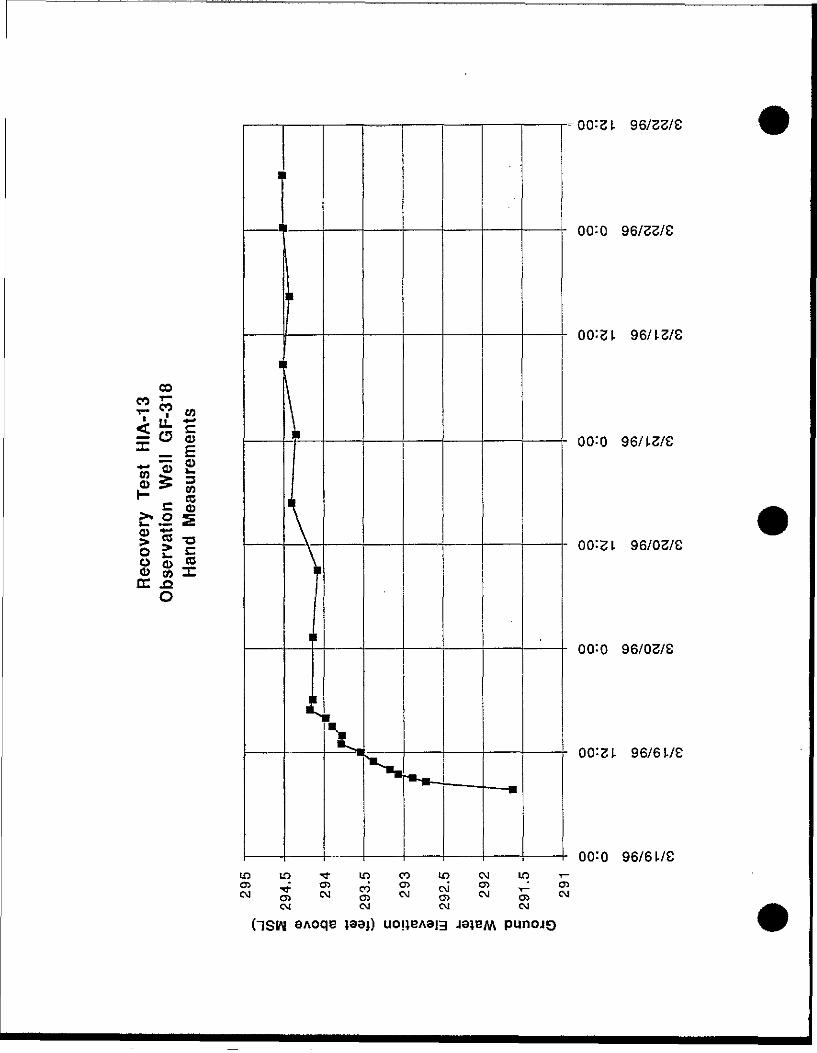
COCO *"? 7 «< "• c^ o §x _ E
" e g££ Sh~ •—• ^CD •£g > "g I———I—VH———I———I———I———I———I———h 00:3L 96/03/8
00:3 L 96/33/8
00:0 96/33/8
00:31. 96/L3/8
00:0 96/L3/8
00:0 96/03/S
00:3 L 96/6 L/8
00:0 96/6 L/C
OJ OJ CM CM
(-JSW 3AOqB }33i) UOUBA3I3 J3JEM
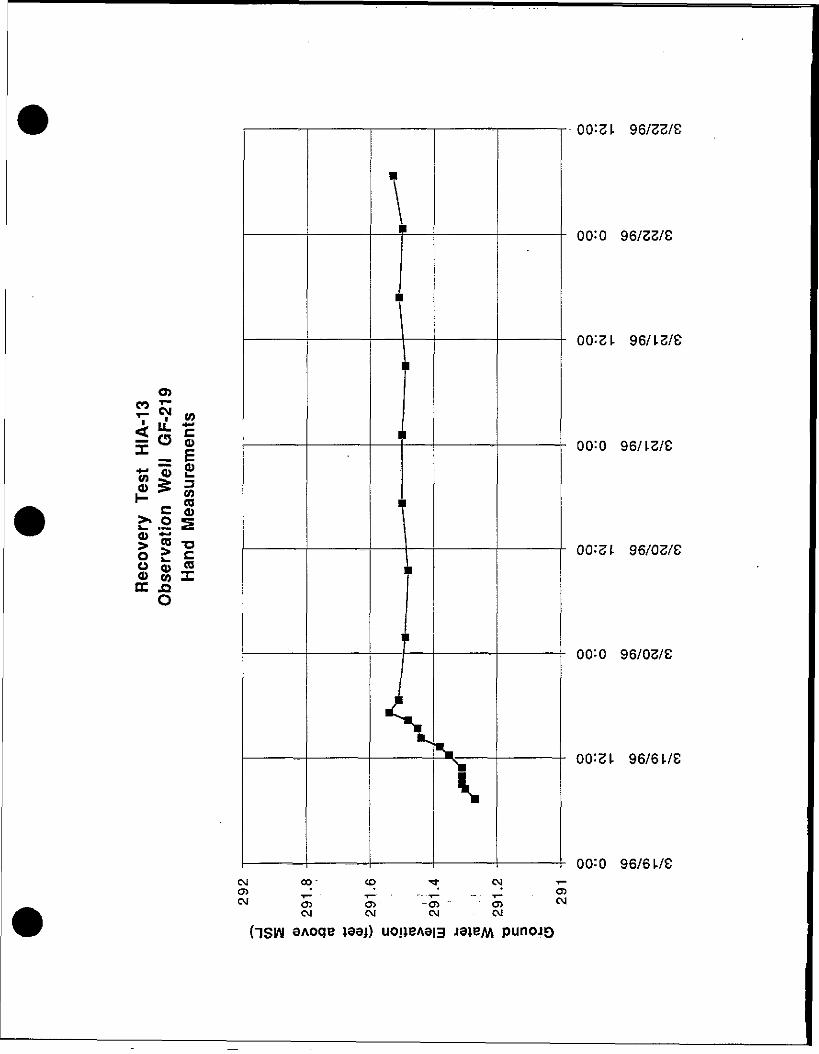
oCO CM w
"-
•q> £
CD
g >O m<D COCC AO
CD _00:31 96/03/8
00:3 \. 96/33/8
00:0 96/33/8
00:31. 96/L3/8
oo:o 96/L3/8
00:0 96/03/8
00:31. 96/6 L/8
00:0 96/6 L/CCM CO CD Tf CM i-O> ^ . T^ • --r - - - -r~ °*04 cn 01 -en en w
CM CM CM - CM
(~ISW SAoqe )aa > uo;)BA3|3 J3)BM
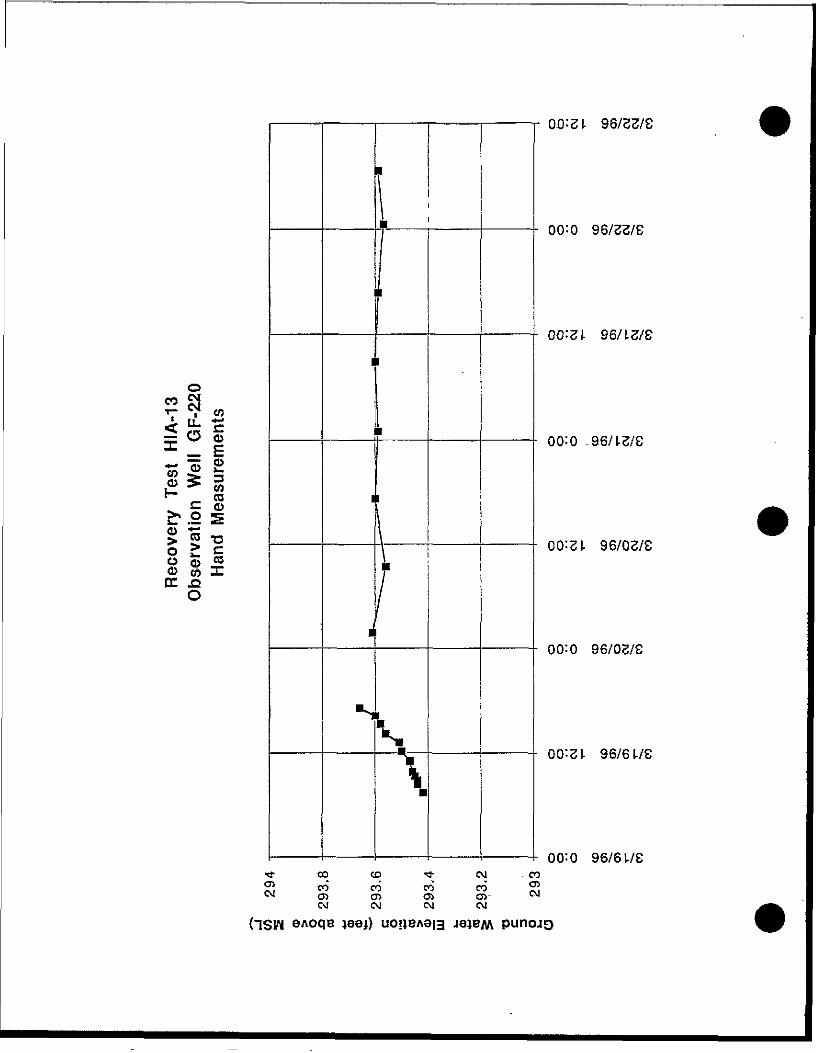
oCO 5 *? «^ O o
*! 1l~ -* CO
£- ra
<jj "*•*
Ci± roO
•<
1
1
ds
1
1
•
^x
r co co S- CM 0^ co" co co co- . ^^ en oi o> oi c
CM CM CM CM
96/33/8
00=0 96/33/8
00:31. 96/L3/8
00:0 -96/Lg/S
00:0 96/03/8
00:31. 96/6 L/C
00:0 96/6L/S
(1SW
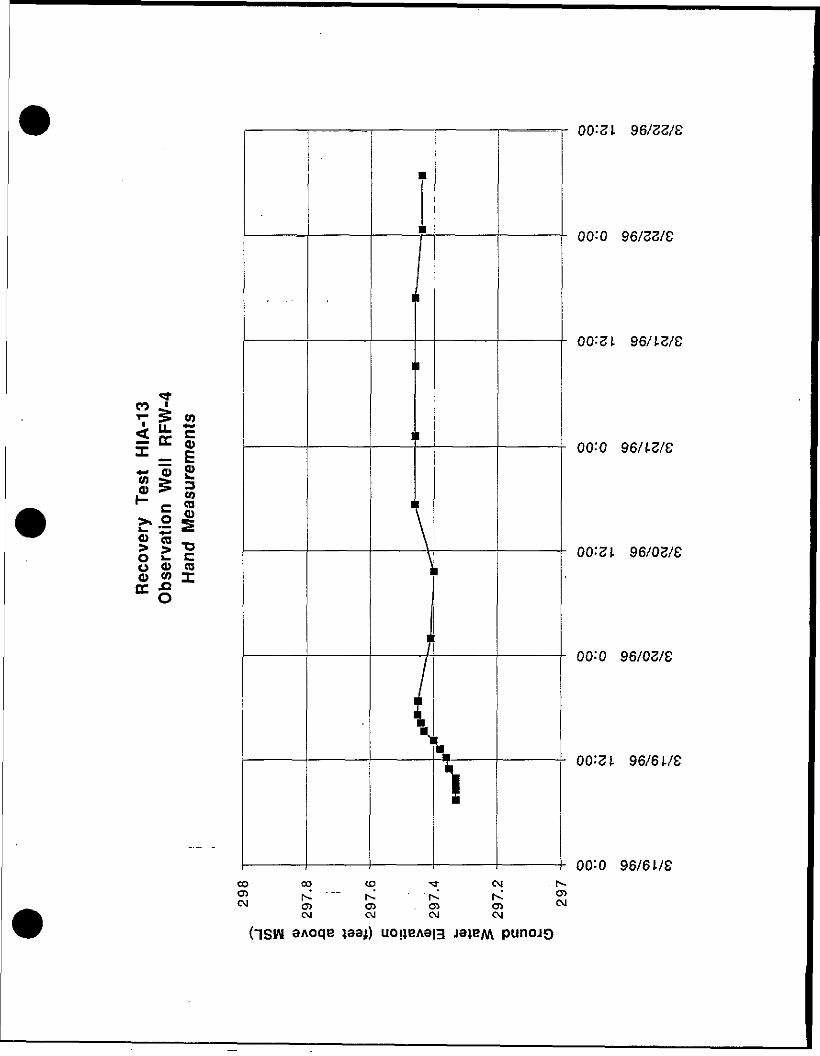
CO '" 5 CO
- E*- "S 2to > h£ ? S•" CO
_> > o £ cU CD COo> « X
\1
00:31 96/33/8
00:0 96/33/8
00'-3 L 96/L3/8
00=0 96/1-3/8
00:31. 96/03/8
00:0 96/03/8
00:31 96/6 L/C
00:0 96/61/8co co <D - r CM .S ^ "" ~^~ ^ ^0x1 o> en . en en
CM CM CM CM
("1SW 3Aoqe t33|) UOUEA9I3 Ja^BM punojo
Hydrographs-Recovery Test MID-04«,/ . . - o . . r <*'
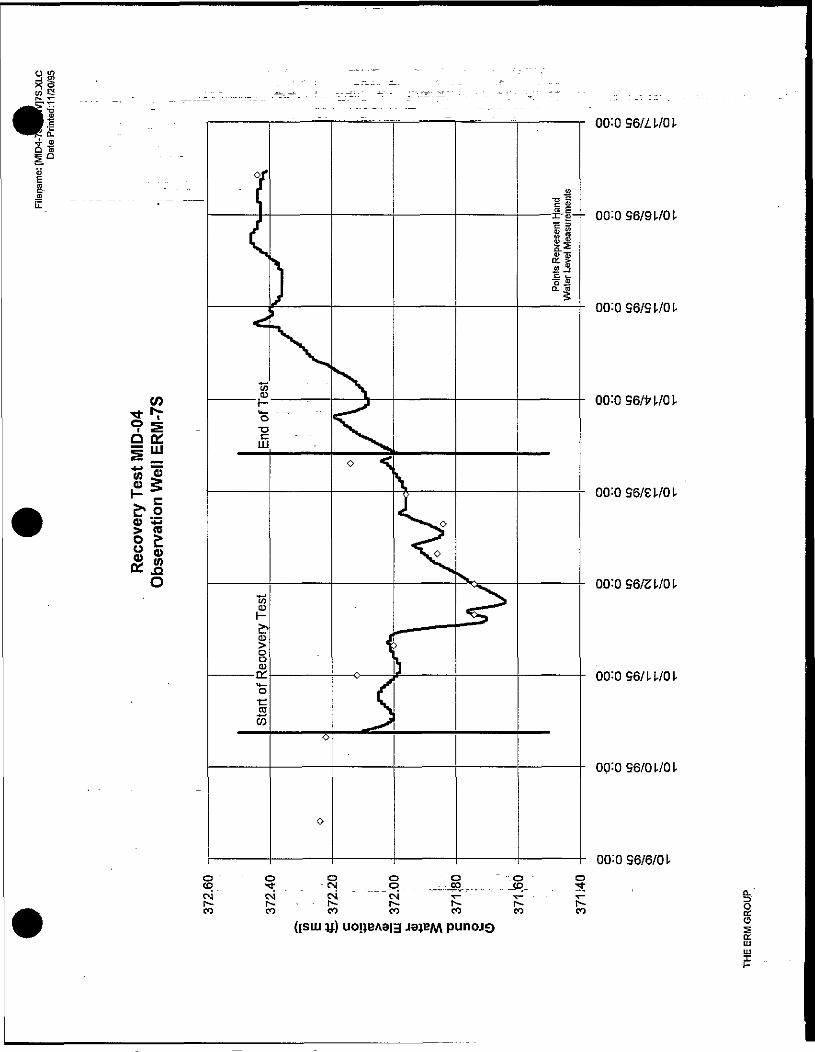
00:096/H/OL
S - -D ^S.QH msiCD 35> (0
CD ^o: o
I— 00:0 96/9 L/OL
00:Q96/9L/OL
00:096/£L/Ol.
00:096/LL/oi-
00:096/01/01.
00:0 96/6/01-O " O O O - O • O OtD. "* CM ^ _O ._^:^M._._. .. _<D_ . -CM" CM' CM CM* - ^ T-:r— [ , - r |x- r-- r- r*-c o c o c o c o c o c o c o
punojoccUJUJ
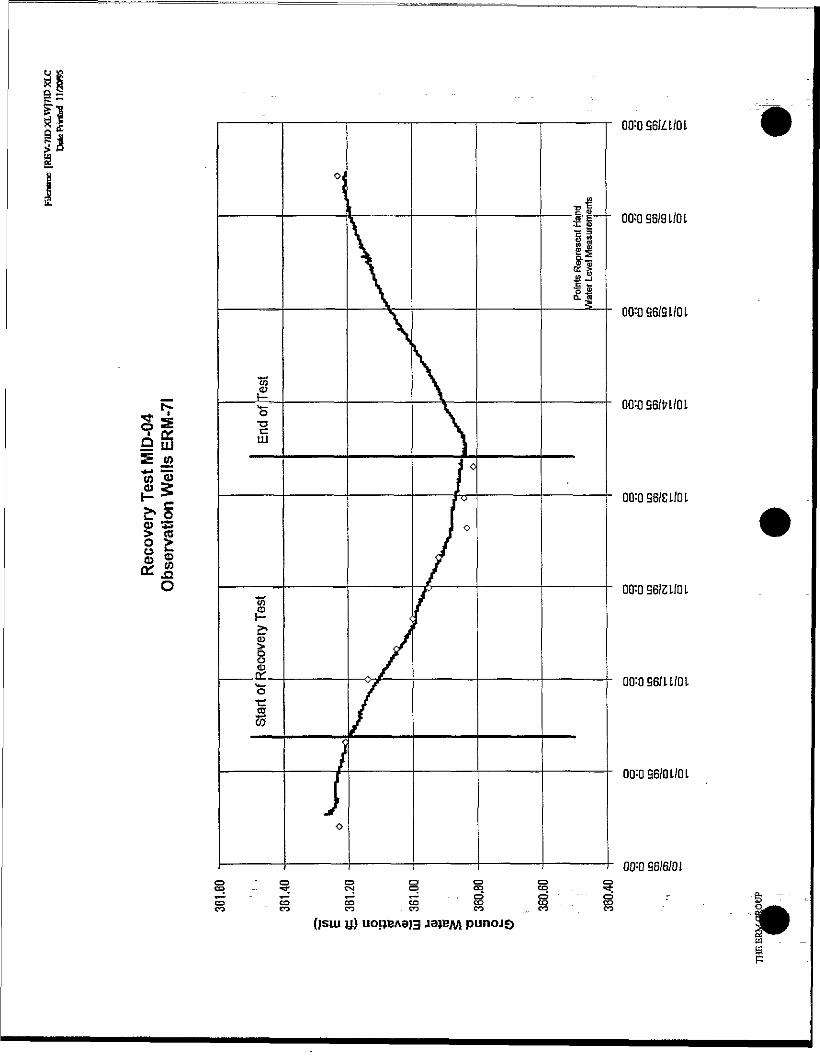
O «p9 iuIIC.O> 13O c*« i
•S3CO
c:LLJ
O,I
io
03
-Di—i——————i—~~*———i——————i———————i———————u oo:0 96/1 I/O Ib•cSCO
^S'5'E' 00=096/91/01
00= 0 S6/QL/01
00=0 96/Sl/Ot
00=096/2 L/QL
00=096/01/01
00=096/6/01
(isuj u) UOIJBA9H JSJEftA punojo
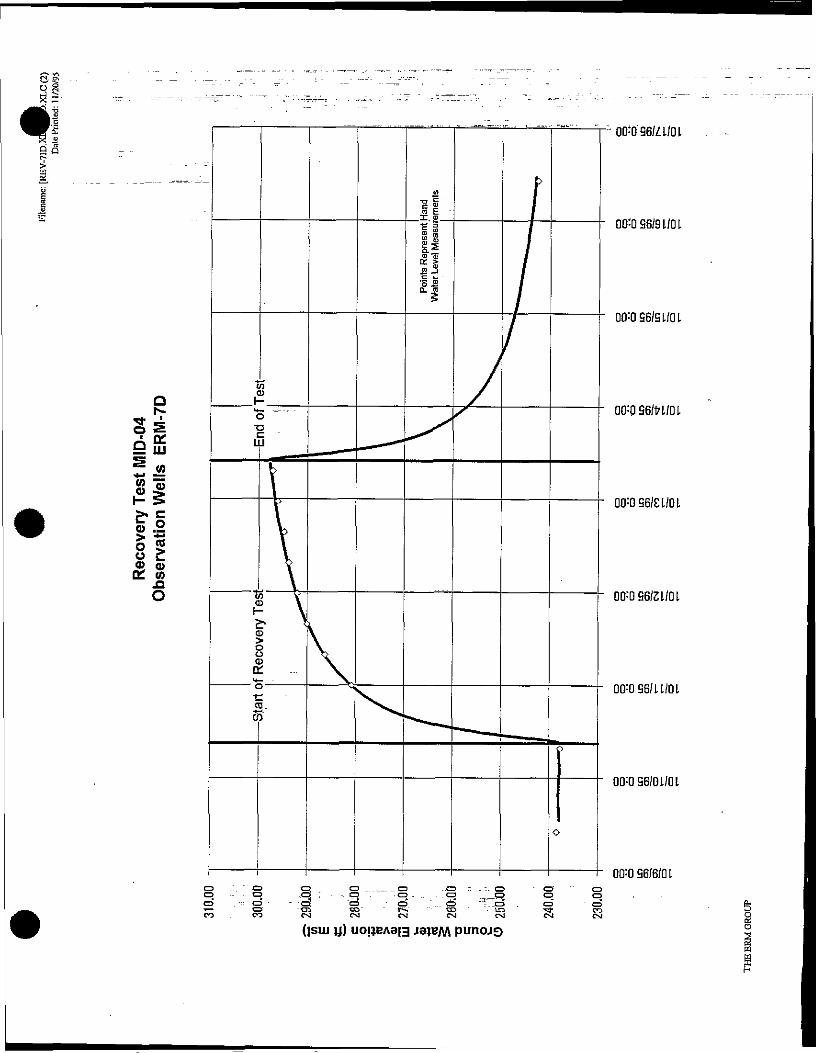
Sc
Ss
" *(0 TS
0.2> "So 5£ £Jfi CDo£ co
C £
OQ-096/n/OL
00=0 96/9 L/OL
00=0 96/9 L/Oi
00=0.96/171/01
00=0 96/G I/O L
00=096/21/01
00=096/11/01
00=096/01/01
00=0 96/6/0 L
CJ C^ O ' " C3 "t'.lo . 0 - 0 fc-en co j . co in d- eo 3c s i c s J c « J C N c « j e s i c N i Ooi(|SUI y) UO£BA9|3 J3JBM nimniev o
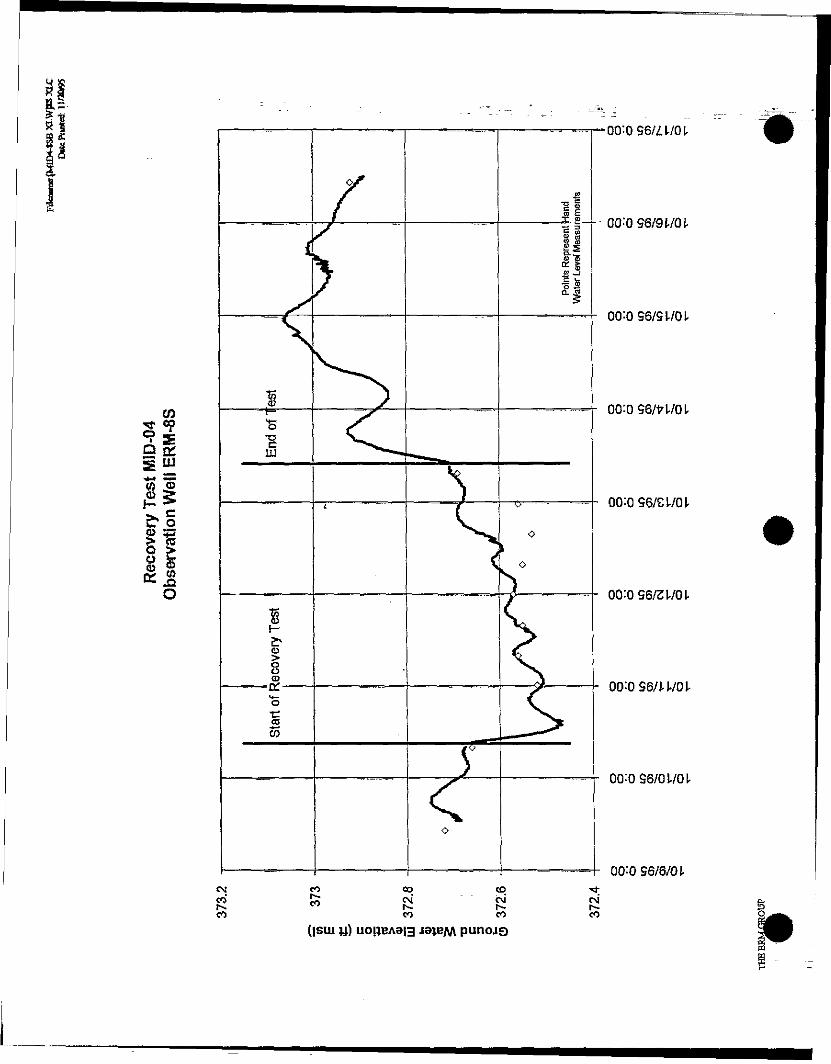
LU
> eo
00:OS6/£L/OL
00:096/31/01
00:Q96/H/01
00 0 96/01/01
QO'-O 96/6/01CM CO CO CD tco t: CM" CM CMr-. CT i - Is- r-co co co co
(|sui u) UOI1EA913 jaieM punojo
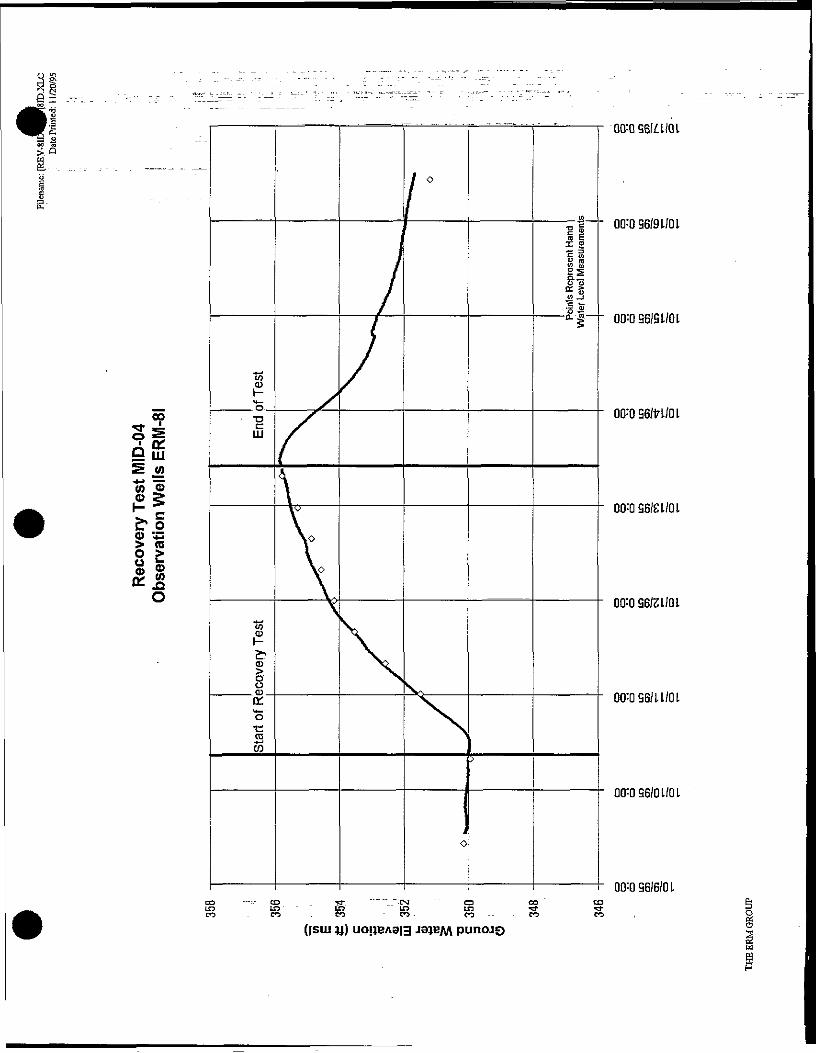
00=0 S6/Z I/O L— s
OUCD Q)
00=096/91/01
00=096/81/01
co - x 00=OS6M/01rj- CD g
SLUS w*« "oo 5:I- •* |——————|—\o———[——————I——————I——————I——————\- 00=Q96/£L/Ot
00=036/21/01
00=096/11/01
00=0 96/0 L/OL
00=0 96/6/0 LCO CO• *a-CO CO
(|sui u) uoi}BA3|3 J31EM punoj£>
CO —:-- CD f .CM C3 CO COl£) l£3 ' - tn " LT5 UT3 f "d-CO CO CO CO- CO - - C O CO
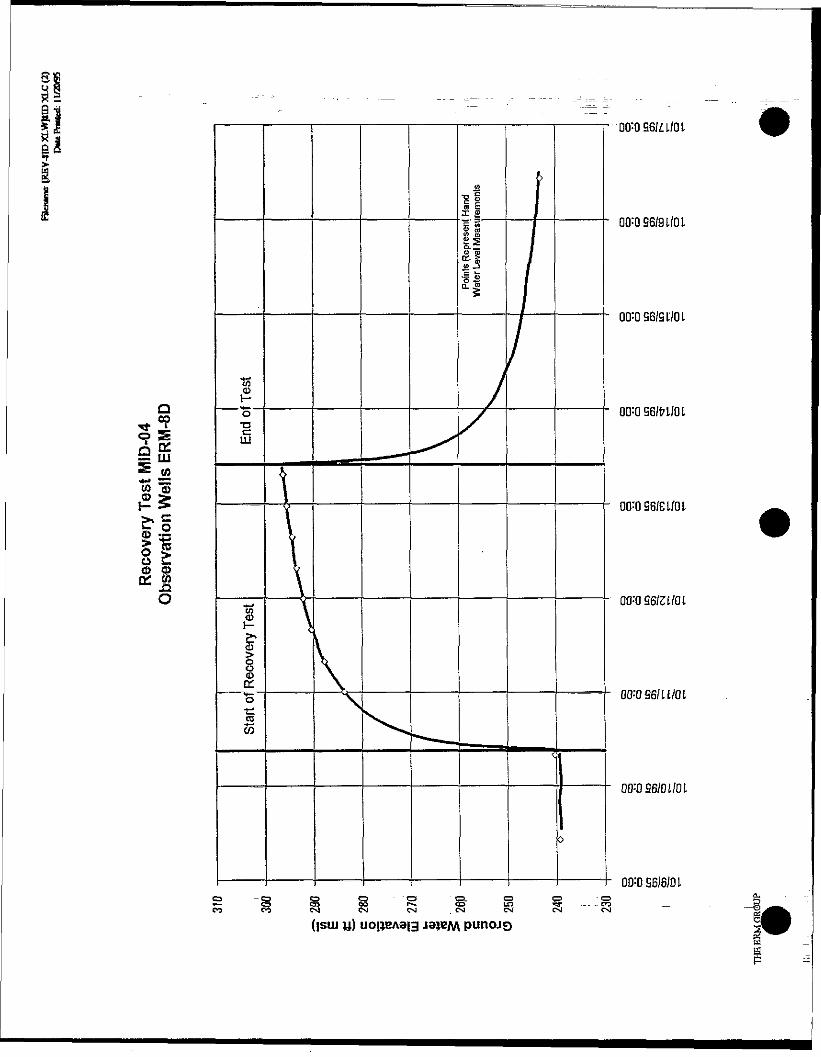
si8.1» J j—————I — I—————i—————I—————I --——I —— I -" l "00=096/£ 1/0L« 3
00=096/91/01
00=096/91/01
g —— '5- ————————— ———— —————— 7^ —————————— - 00=096/fl/OL
? Q DCy LUJ2
t/J "500=096IEL/01
5U L.
00=096/21/01
00=0 S6/L I/O L
QLTQS6/QL/OL
00=056/6101
y) uoijEAae
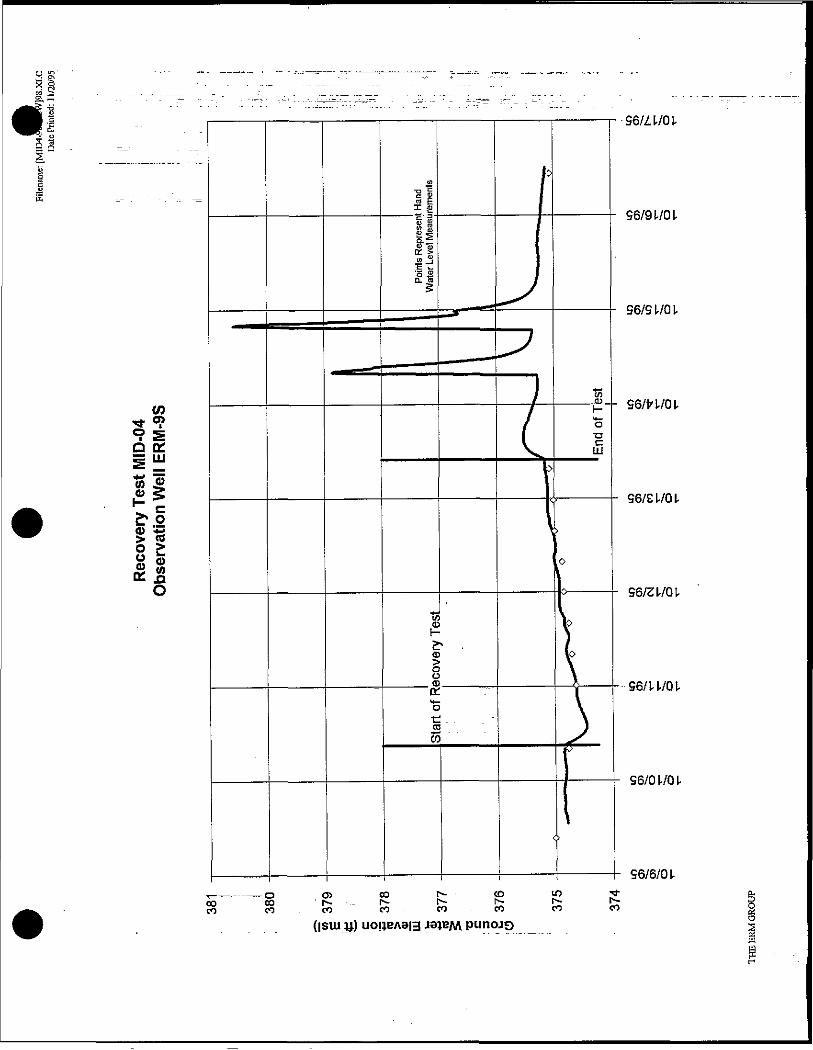
CT.
• 96/2.1/01
<0 —————————————————————————————————+ S6/K/01
D
ooCDK
96/91/01
96/91/01
96/E1/01
O ————————————————————————————————— s————- 96/31/01
96/11/01
96/01/01
96/6/01
punoao
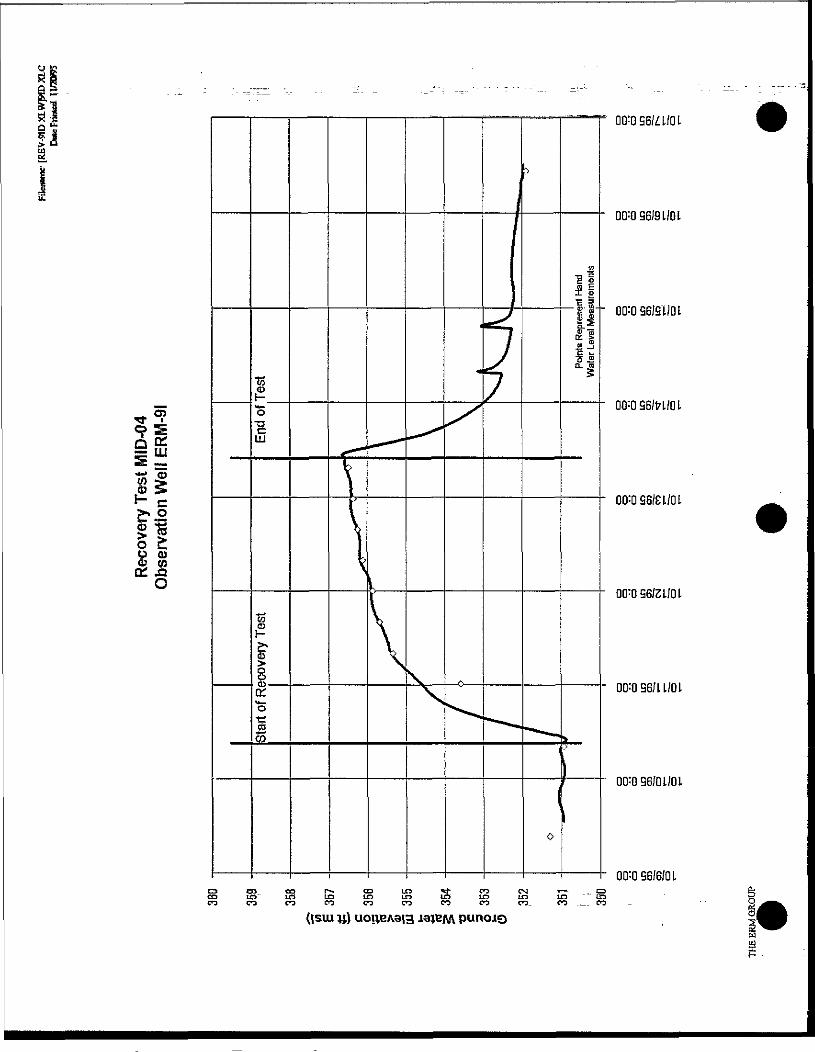
00=096/91/01
00=096/91/01
00:Dg6/£L/0i
o cO CDCJ COCfL £1O
00=096/21/01
00=096/11/01
00=0 96/01/01
00=096/6/01r ^ . c o L n * * - c o c s i « - - oi r 3 i T 3 L J D u n i i r > m i r 3 " l £ sco co co co co co_ co ._ C*D _
(|sui y)
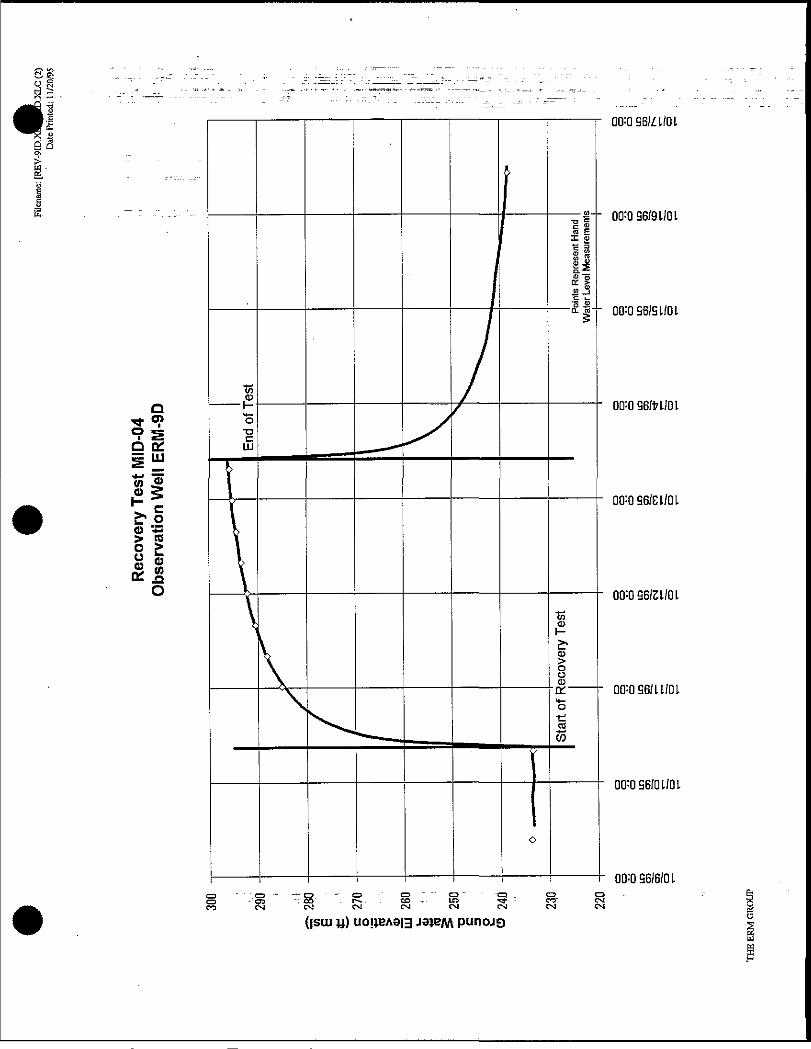
il I.£ 00=0 96/Z I/O L
OOQ) (0
00=096/91/01
- 00=096/91/01
00=096/H/Ol
i =w
00=096/£l/OL
00=096/31/01
00=OS6/U/Ol
00=0 96/0 L/OL
CDCDCO
00=096/6/01
(JSLIJ y) uoiiBAeig JBIBM punojQ
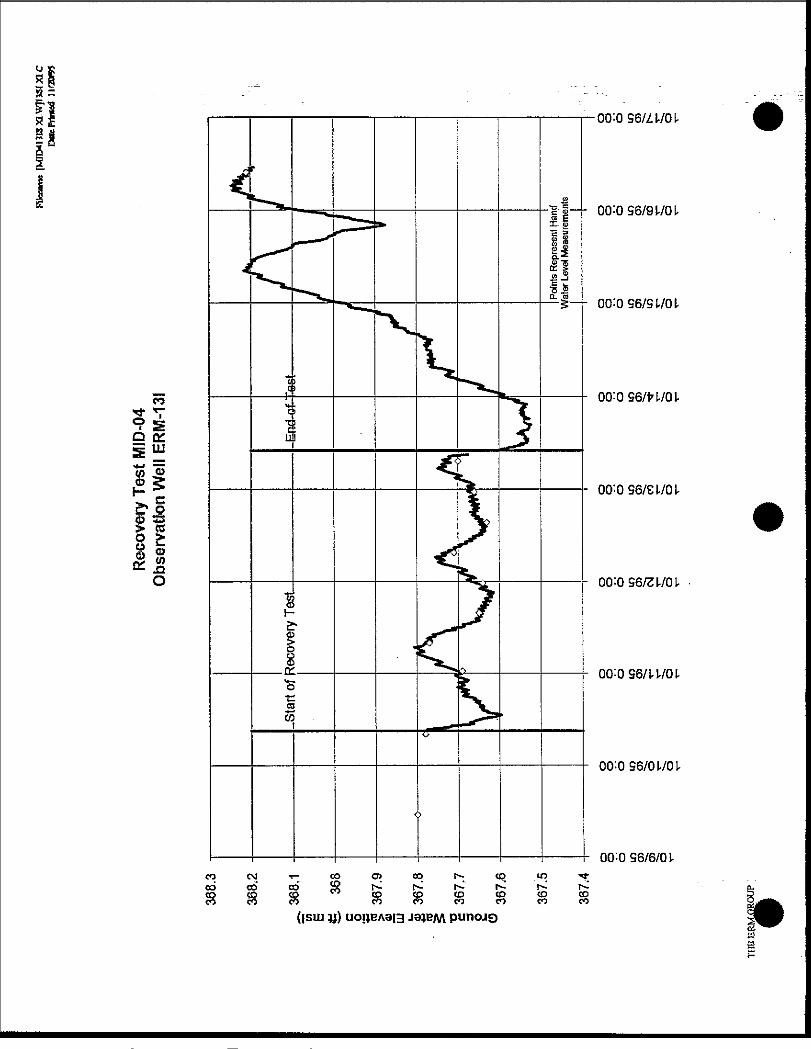
CO
> CCo ?•8 i
LUJK<>
00:096/£1/01
<D
co
1O•eCOCO
— 00:0 96/91/01
00:0 96//1/01
00:0 96/91/01
00:0 96/K/01
r 00:0 96/21/01
00:0 96/11/01
00:0 96/01/01
OO'-O 96/6/01
c co co r p t- h- f rC O C D C D ^ ' C D C D C D t O C O C Pc o c o r t r t c o c o r t c O c o
(ism y) uoi)BA3|3 JejBM punoJQ
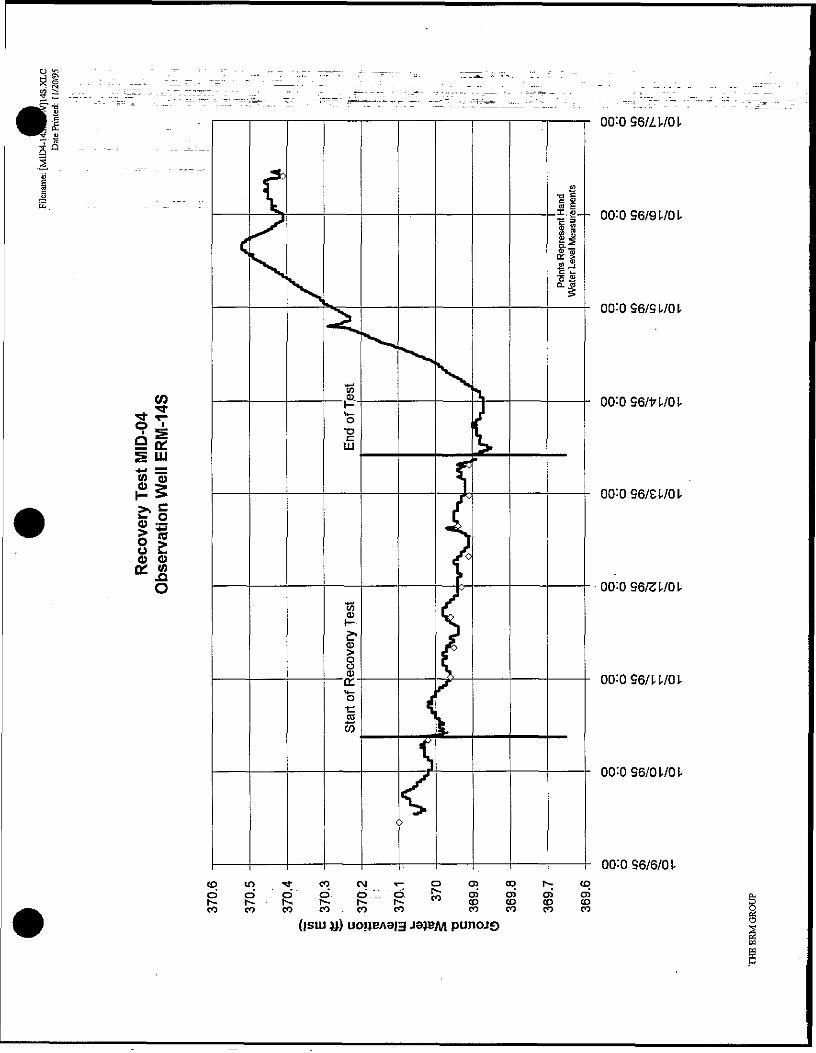
Q0:096/il/01
=-S~ OOU 96/91/01
00=096/91/01
CO ————————————p-——————————J|—————————- 00:0 96/fr 1/01
IiS LU
to "53° * ' 00:096/£1/01
fG) ~S|u Ccp p
):096/S1/01
00:0 96/11/01
00:0 96/01/01
00:OS6/6/01
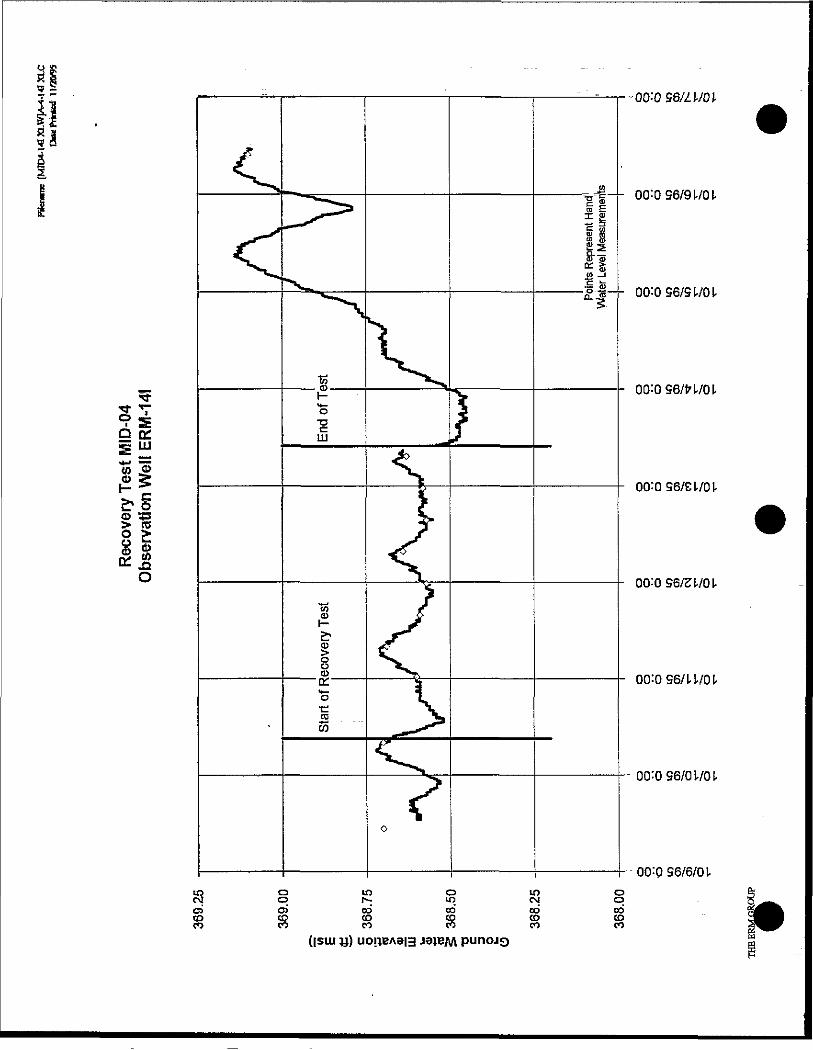
i
8|
LU
00:096/£1/01C oo :p> (C° 5® is
^ 00:096/cTl/01
CO
CD
80 ^ 00:0 96/11/01b•cccCO
•%-t-h 00:0 96/9 1/01§EX £
•S 00:0 96/91/01
- 00:0 96/i 1/01
00:096/H/01
00:0 96/01/01
00:OS6/6/01us o in o in oCM C3 I-^ « CM OC) O> CO CO* CO CO"KD CO CD CO CD CDCO C*3 CO CO CO CO
([siu y) uojiBAS|3

•
CO
00:096/H/01
w a;00:096/E!/0!
£\2 .3> « »r
00:0 96/21/0!QX
00:096/Z!/0!
00:0 96/91/01
GlTO 96/91/0!
00:0 96/11/01
00:OS6/01/0!
00:0 96/6/0!co to m m •**•co .x co _,: coco g co ^ co
co co(|sui y)
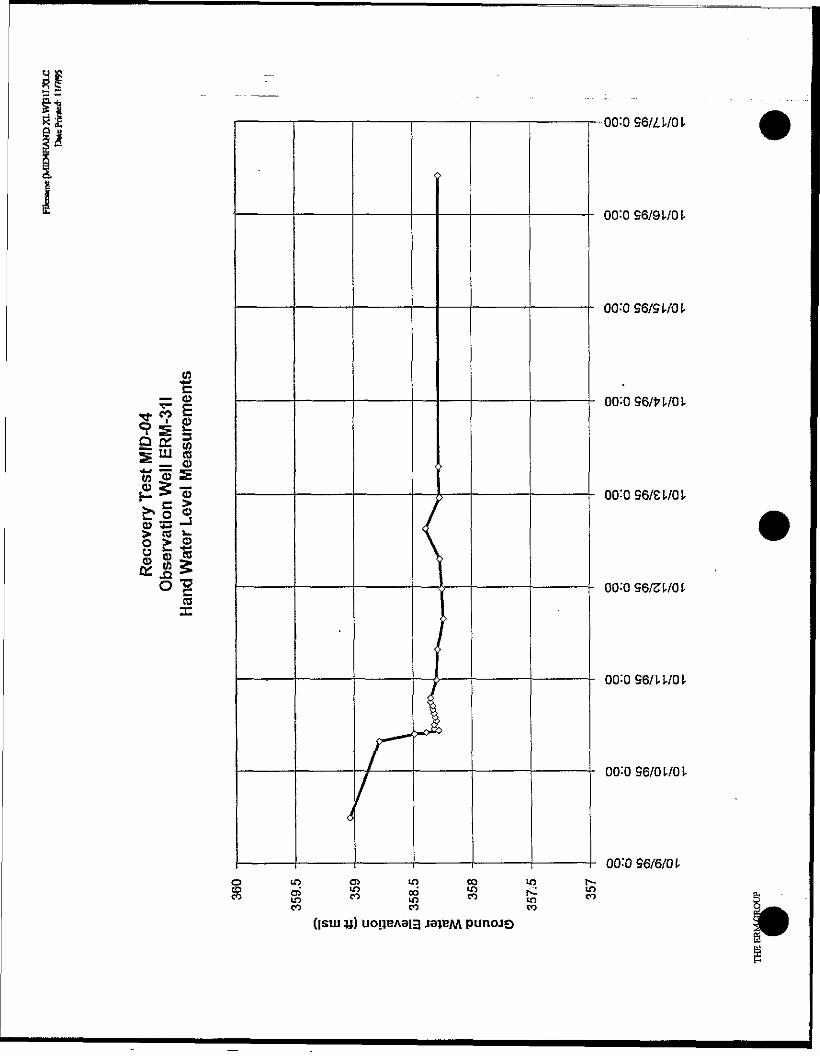
I— tp
?! I^85 1s "J ca
O
o > ®£5£
00:0 96/21/01«X
00:0 9Q/L1/01
00:0 96/91/0!
00:0 S6/S1/0!
00:0 96/H/01
00:Q96/ei/0!
00:OS6/11/0!
00:0 96/01/01
OO'-O 96/6/0!o m CD tn co LOC£3 m in n-J lO *i"*co ^ co ^ co in
CO CO CO
(|SLU y) UO1.1EA3I3 J3}BM pUHOJO
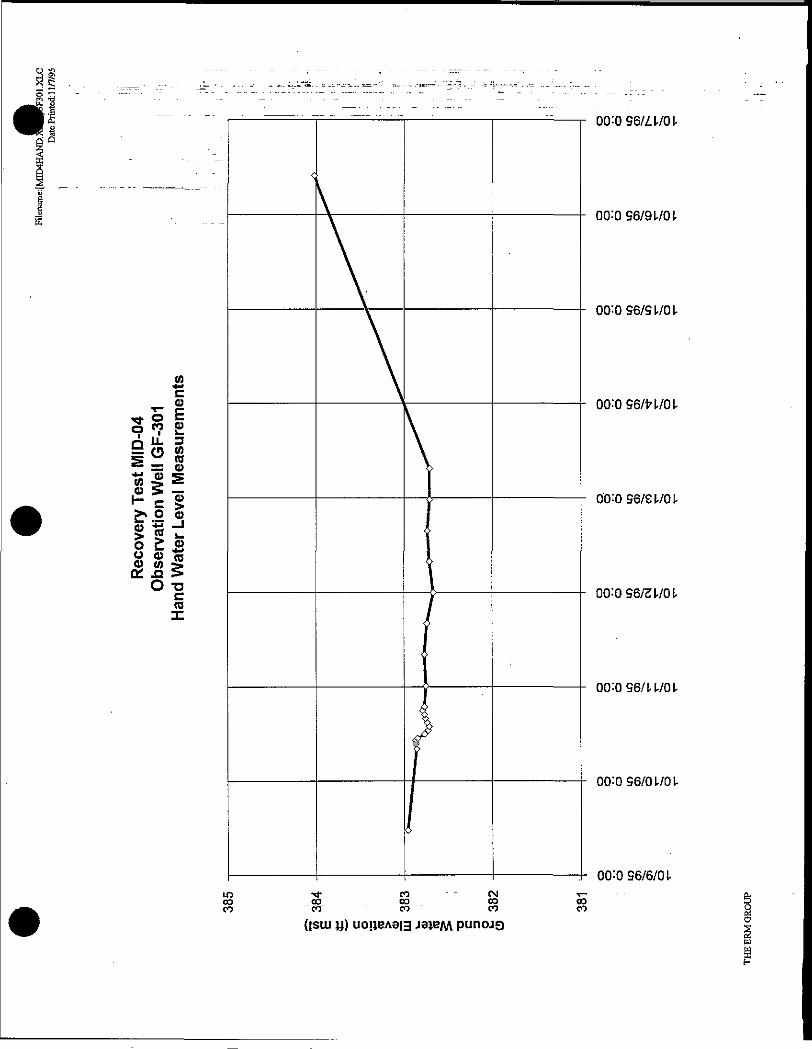
co*jcT-§« IS3 O
O *2 —'> S feo £ <»% S «O CO >
O T3CDX
E 5 v 00:0 96/e 1/01o c
00:096/i!/0!
OQ:Q 96/91/0!
00:0 96/91/01
00:096/ 1/0!
00:0 96/21/01
00:0 96/11/01
OO'-O 96/01/01
00:0 96/6/0!m xj- CO - CM t- a.co oo co _ co co 5CO CO CO " CO CO g
(|siu y) UOUEA9I3 jajBM punojo i

o
LOVS
co £
c S
5 £ y CD toSJSl
• 00:0 96/Z1/01
00:0 96/91/01
00:096/91/0!
00:096/.>1/0!
00:096/S1/0!
00 :o 56/21/01
:0 96/! 1/01
00:0 96/01/0!
00:0 96/6/01t- GO cq ^ CM Oco o o
CO COCO CO CO CO
(|siu y) uoijeA3|3 jaa AA punojo
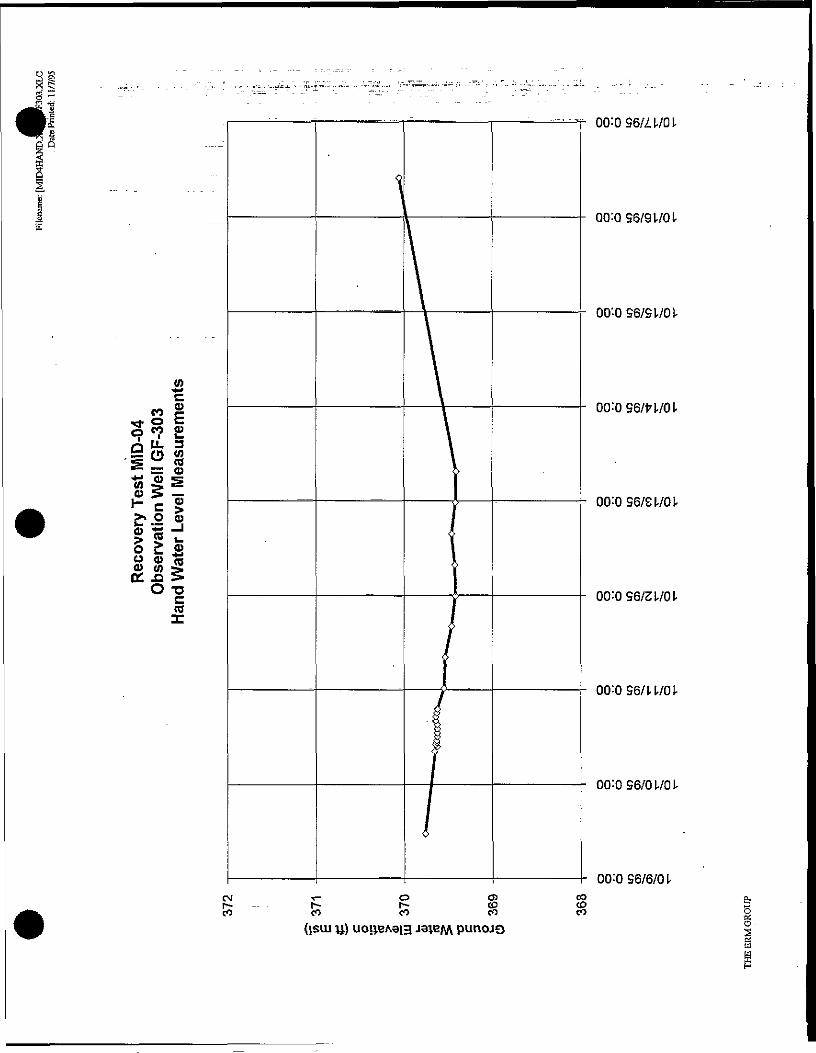
o
(0**c*A ®CO r-o c< <D
Q LU 35= to
1- c §>» o oI'ST!o £ S
O -oc(0X
00:0 96/21/0!(0
OQ:096AU/D1
00:0 96/91/0!
00:0 96/91/0!
00:OS6/H/01
00:0 S6/E1/01
00:096/11/01
00:0 96/01/01
00:OS6/6/01CM T- O Oi CO o,r— - - r*- r-- CD CD 3CO CO CO CO CO O
(ism y) uoi}EA9|3 J3ie/\A punoJO
Attachment K2 .'.'...Semi-log Data PlotsDrawdown vs. Log Time
Drawdown vs. Log Time-Pumping Test HIA-2
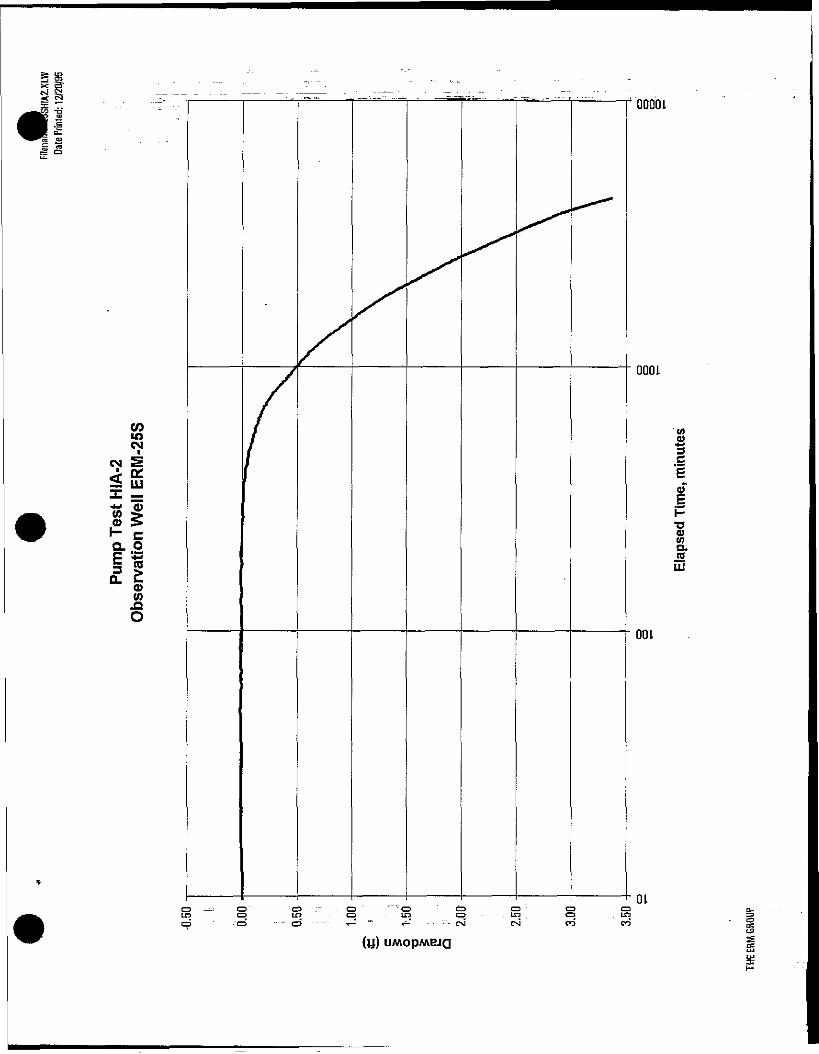
COtoCM
CM S
*-> <DCO >CD >[_ ca o
a gtoO
QOOOL
0001
•a0)tn°-
001
OLcz> - in CD trjEN CN CO CO
UMOPMBJQ
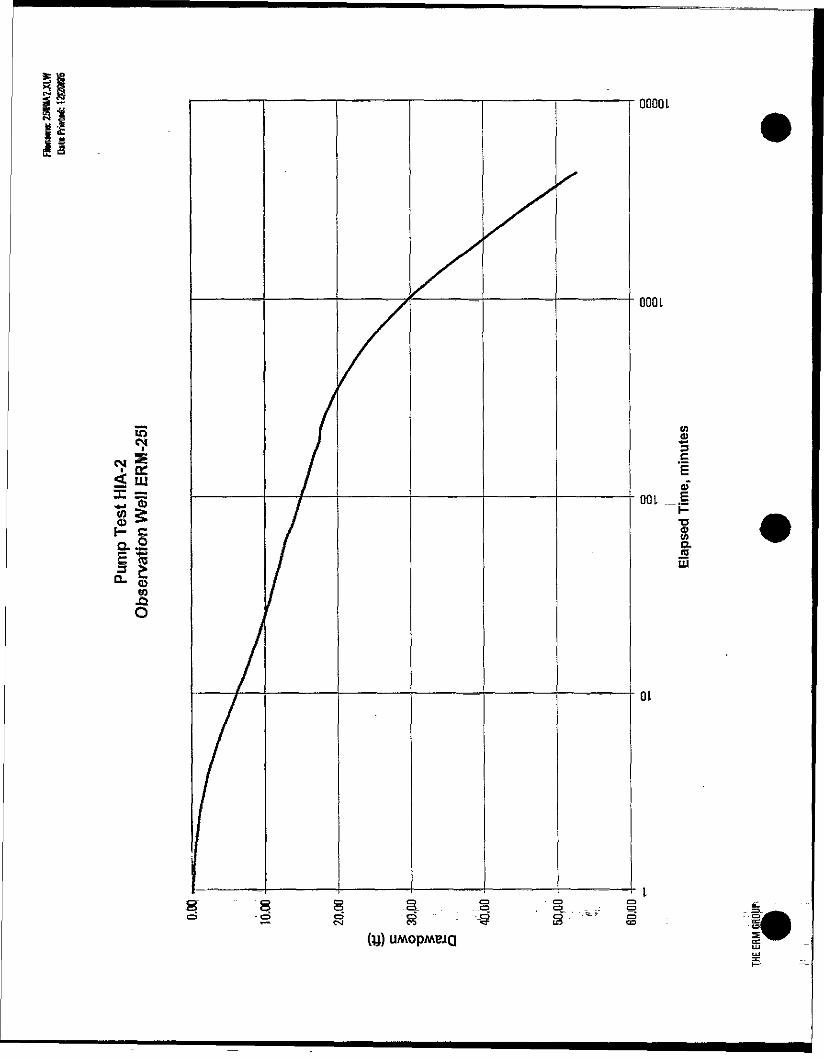
m<*
CN||
<t LU
*- "S
3 >n *«"• o>to
0000 L
000 L
oOOL _.!
.3UJ
OL
(y) UMOpMBJQ
e_=-- ^
§•
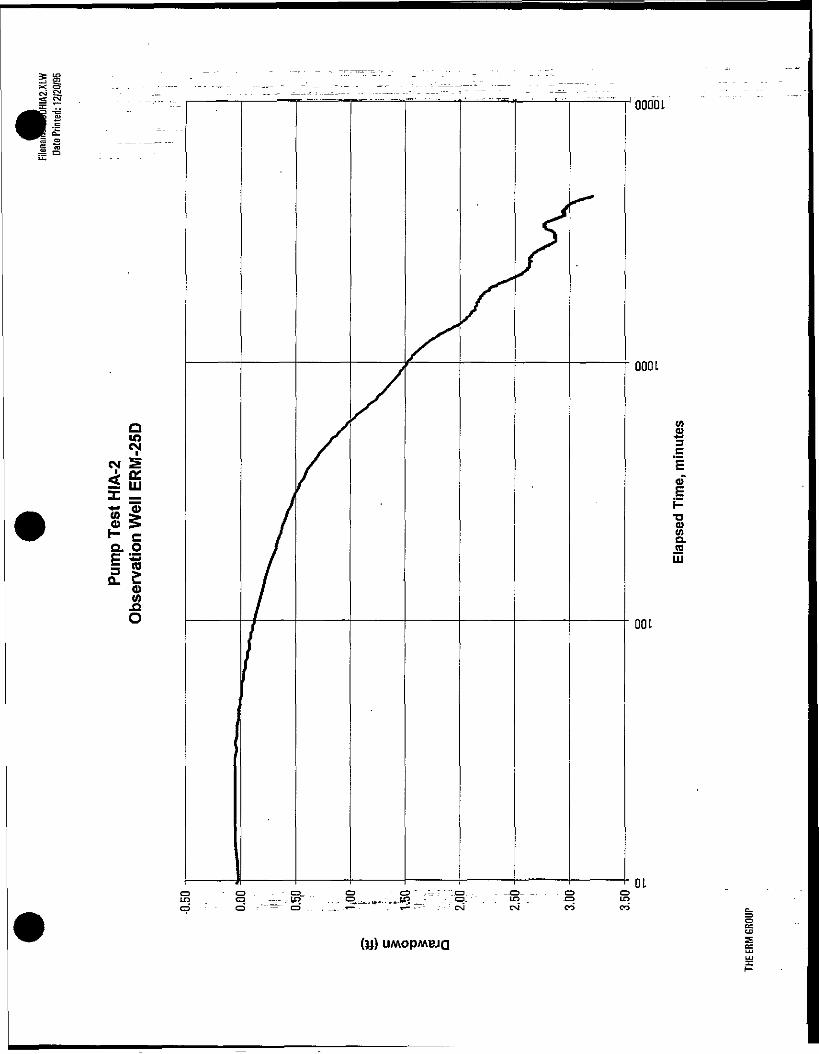
IS, t>l . ._ . .————————————————_——=——————- ——— '——" ' ---— - ...-,————<----™ -----==-- -r- — _j^=——^-u.- -——--I--JJ;; t. ——_i______-_i_________———————________] -,—rtrti00001
000 L
a10CN
CM
3C
(0 >CD >H S 8.CL O / «
01
(y) UMOPMBJQ
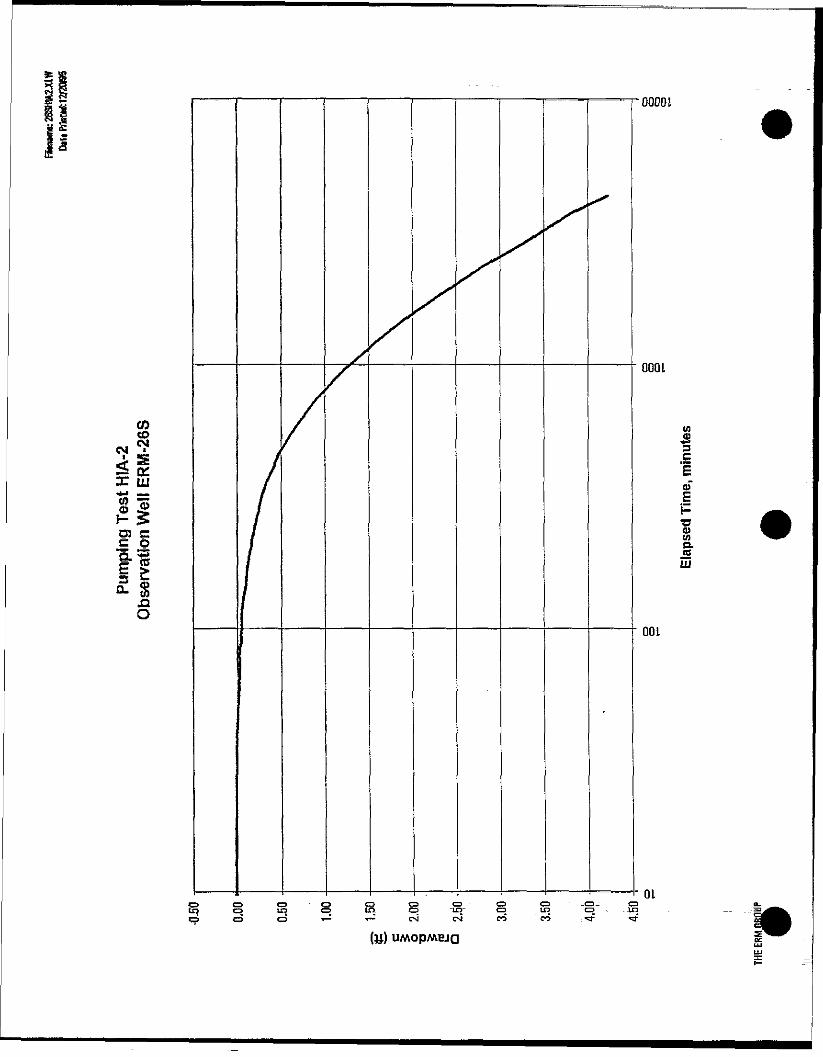
COCDCM
jl
LUCO^t / .|H £O) Cc o
0000 L
000 L
OlW)a.J5HI
001
01
(y) UMOpMBJQ
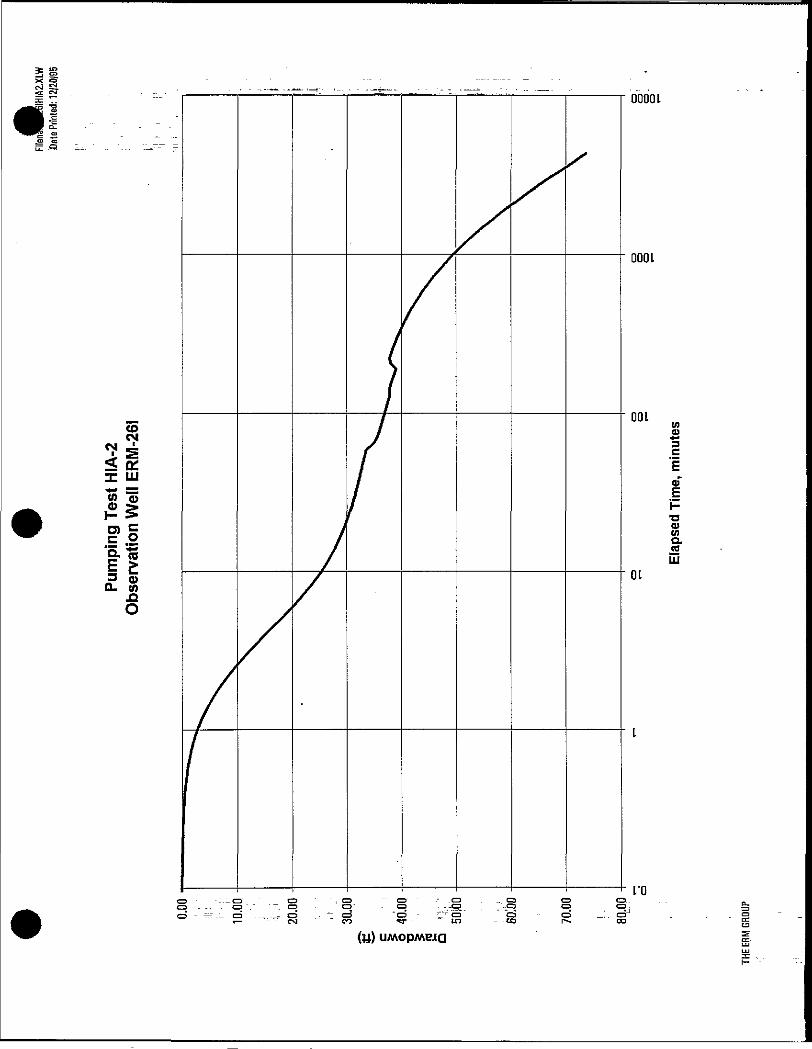
to
c .2"113 <j)a. co
00001
000 L
•aCDCfla.UJ
01
I'D'£~tC3
(y) UMOPMBJQ
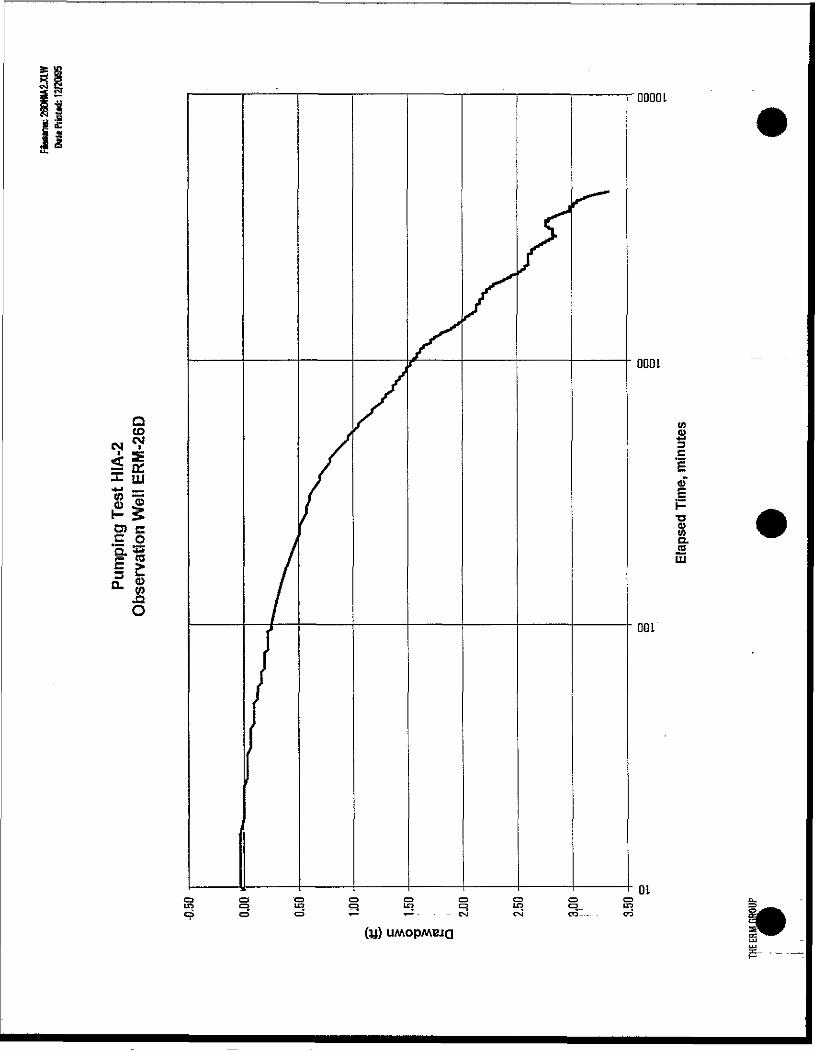
O) CC QD- •£E P3 £n 5*u. OT
J2O
0001
9 v «« 8 / 1CM i X •=
X LU
1 ?
0000 L
•q03tnO.2LLJ
001
01CDCD.
UMOpMBJQ
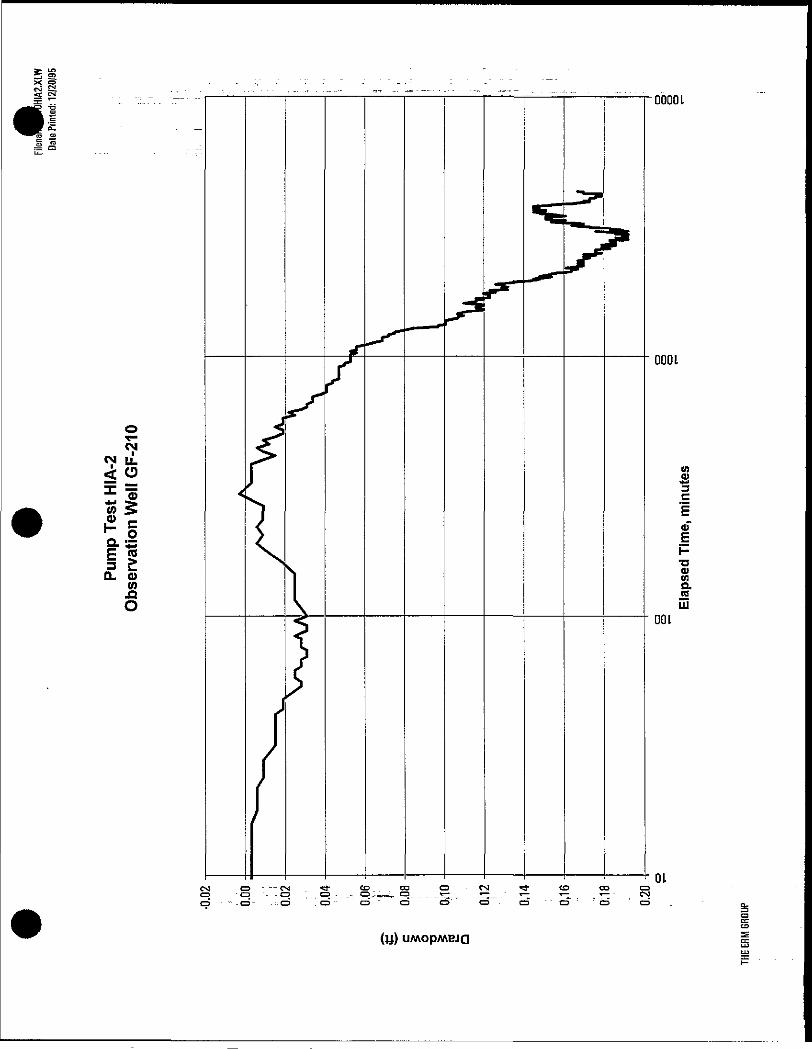
x opJ E"3 S
oT-dli.
I ID_ CD
U)
(y) UMOpMEJQ
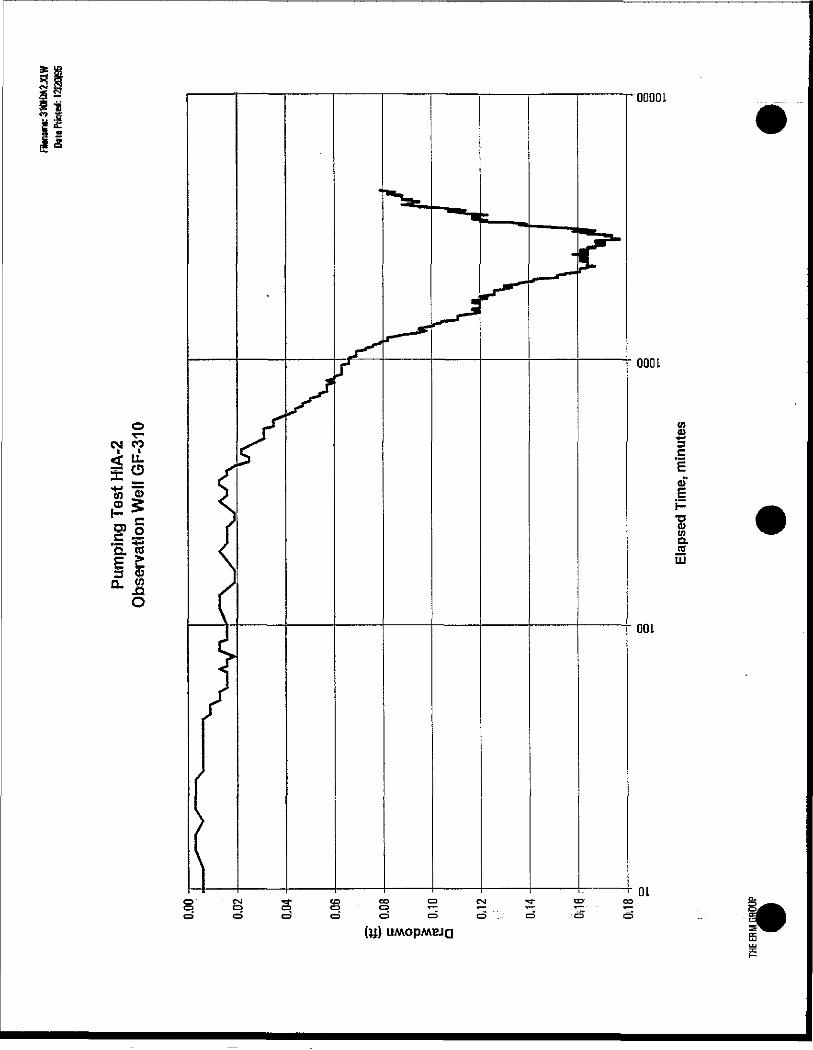
0000 L
000 L
o i-» aT- r £CM CO ^ 3
go•*• a>
G. OS C JHE £3 <P
(y) UMOpMEJQ
a.
:•
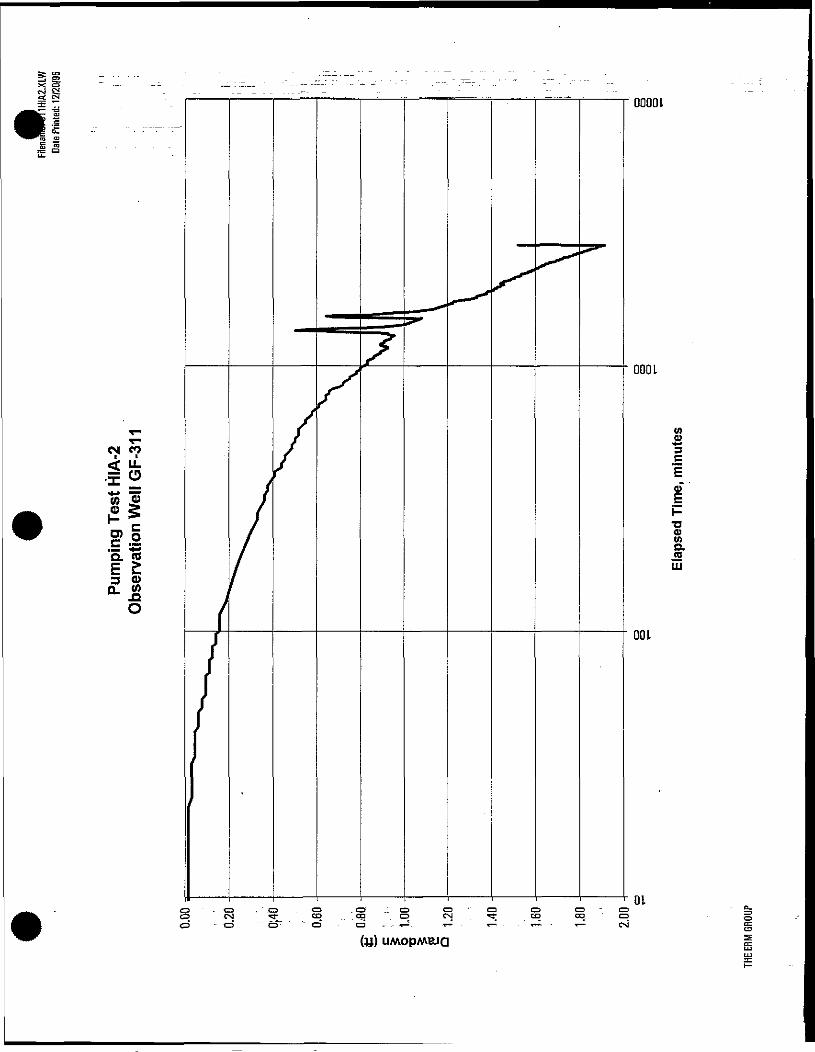
-5
0-5o
po
M_ Q.Q. <0E LLJ
0)
000 L
001
01
(y) UMOPMBJQ
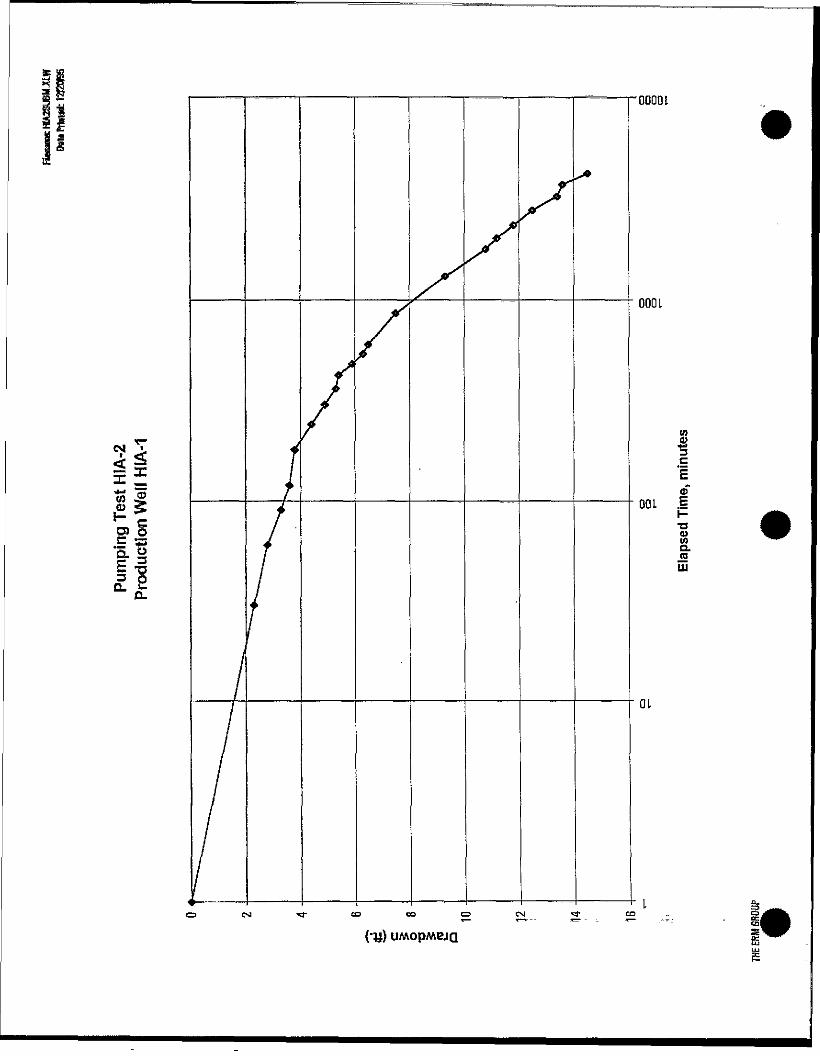
3
CM L
O) O.E 3- 3l!
= =•+JCO CD / ,-
00 L I
•ooooi
000 L
•o0Q.
UJ
OL
co co
•y UMOpMBJQ
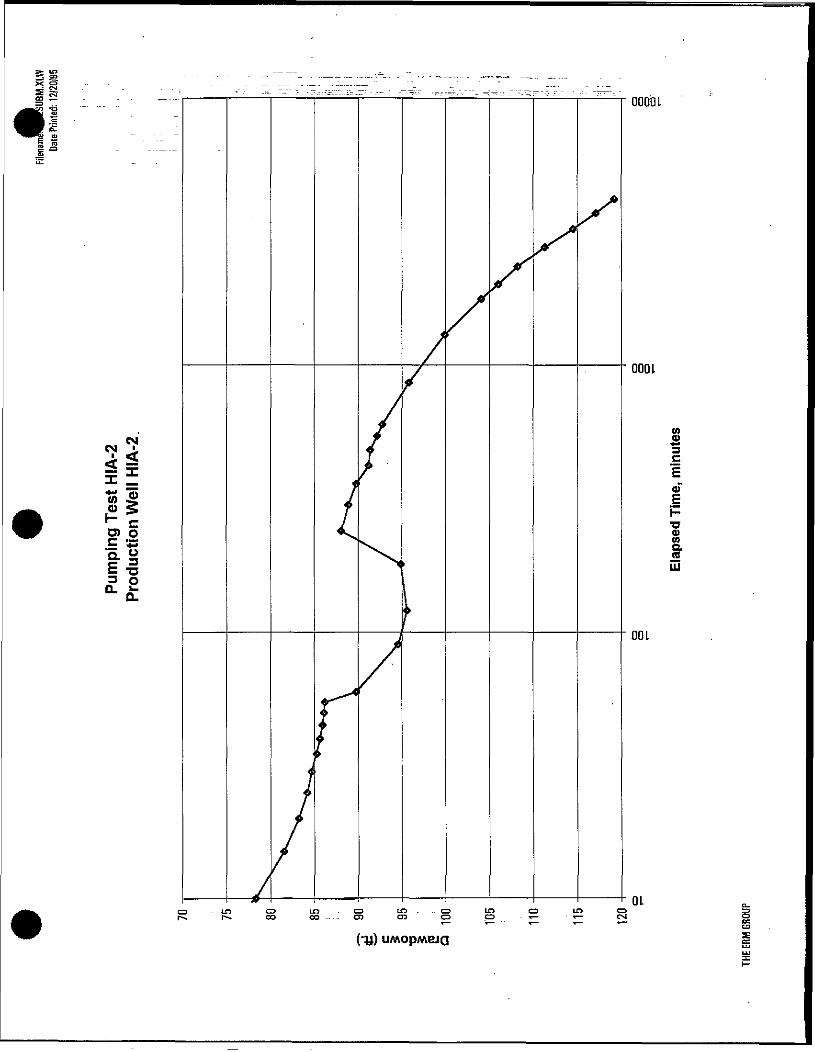
CMCM
x ±w £o sTO OC ',J3o O
0)
HC
ootioi
oooi
0)Q.jfflLU
00 L
01
UMOpMBJQ
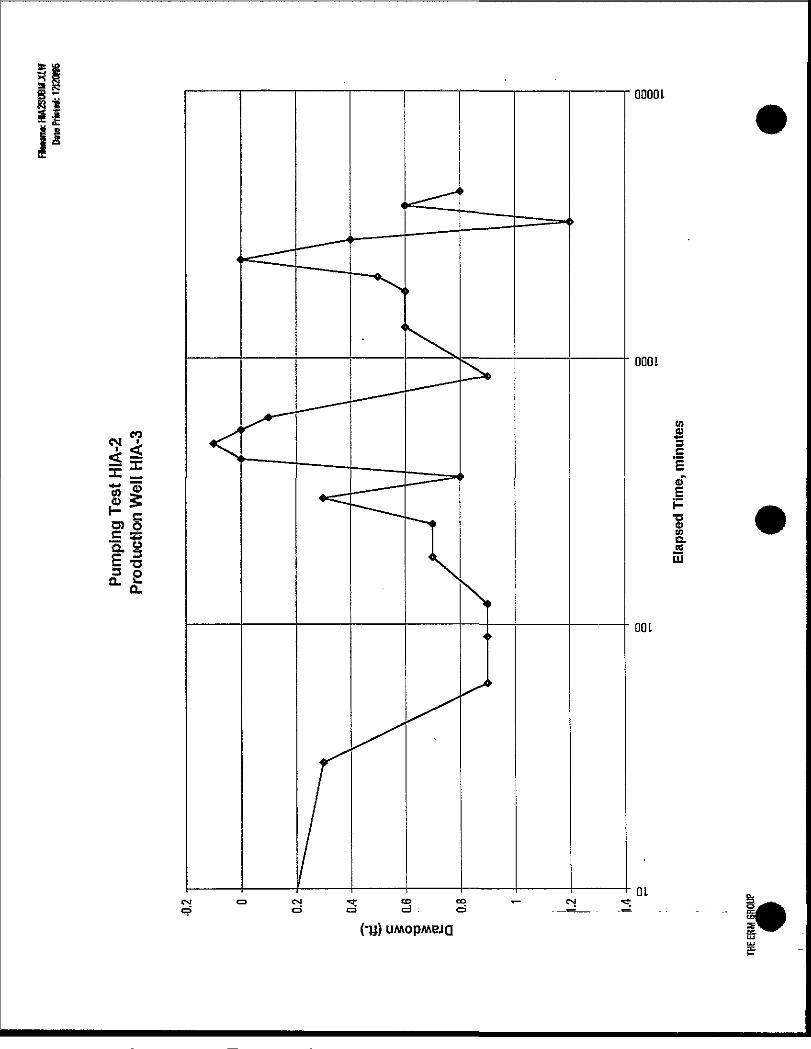
51 •00001
0001
E -3 O
tn
UMOpMBJQ
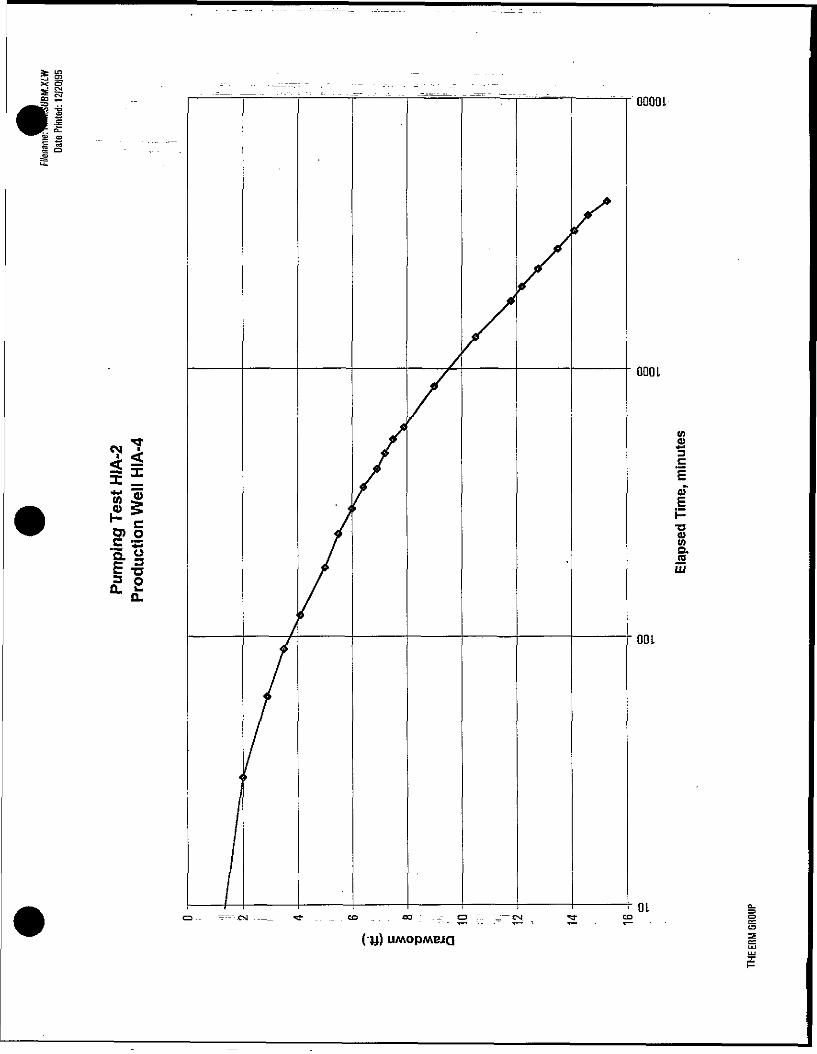
X cq—• £Jeo S
X ±«IQ> S
P> O
"5. "
00001
000 L
o>wD.JBUJ
00 L
01
UMOpMEJQ
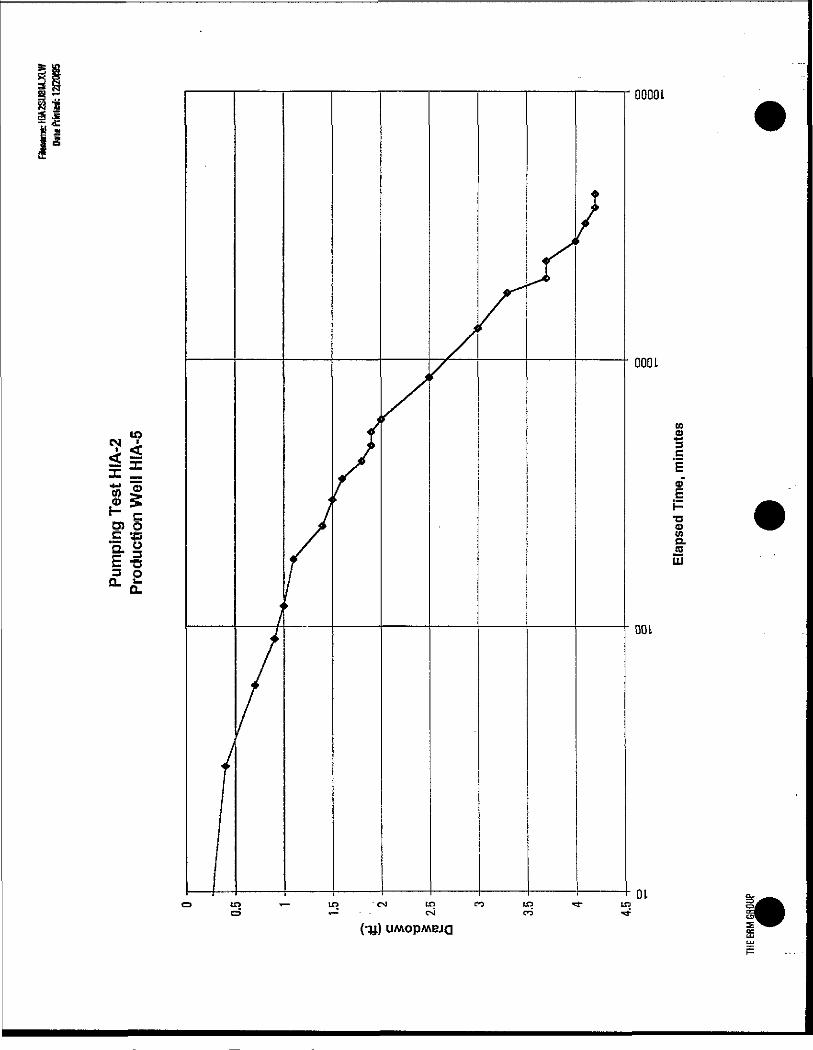
CMrf Sx :E
*~ cOl Q
3 O
to•9
•ooena.J5UJ
01is> *— in "OJ to co LO 3- taCS »-; _ csj CO %*
(•y) UMOpMBJQ
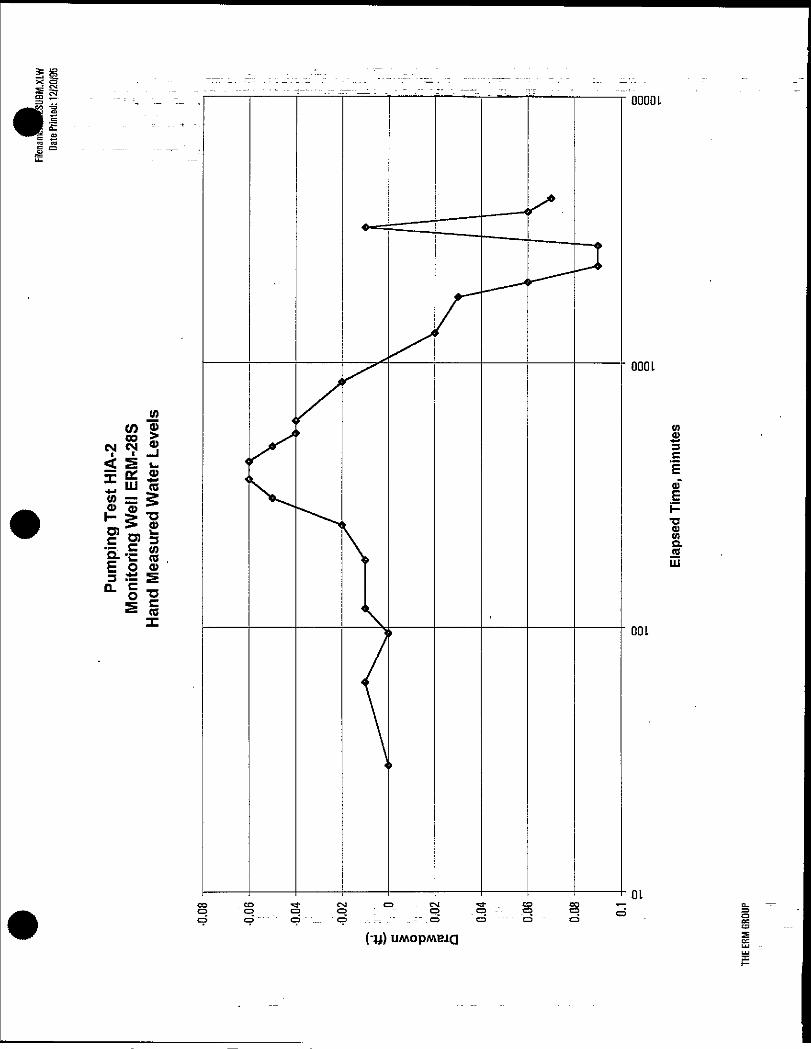
0000 L
000 L
_toCO CD I tn
N 8 « ^/ I= ry ojJ LU *W = g.°> <» f!
•=: .= to \ na*-v .— "*Us ^
01
(•y) UMOpMBJQ
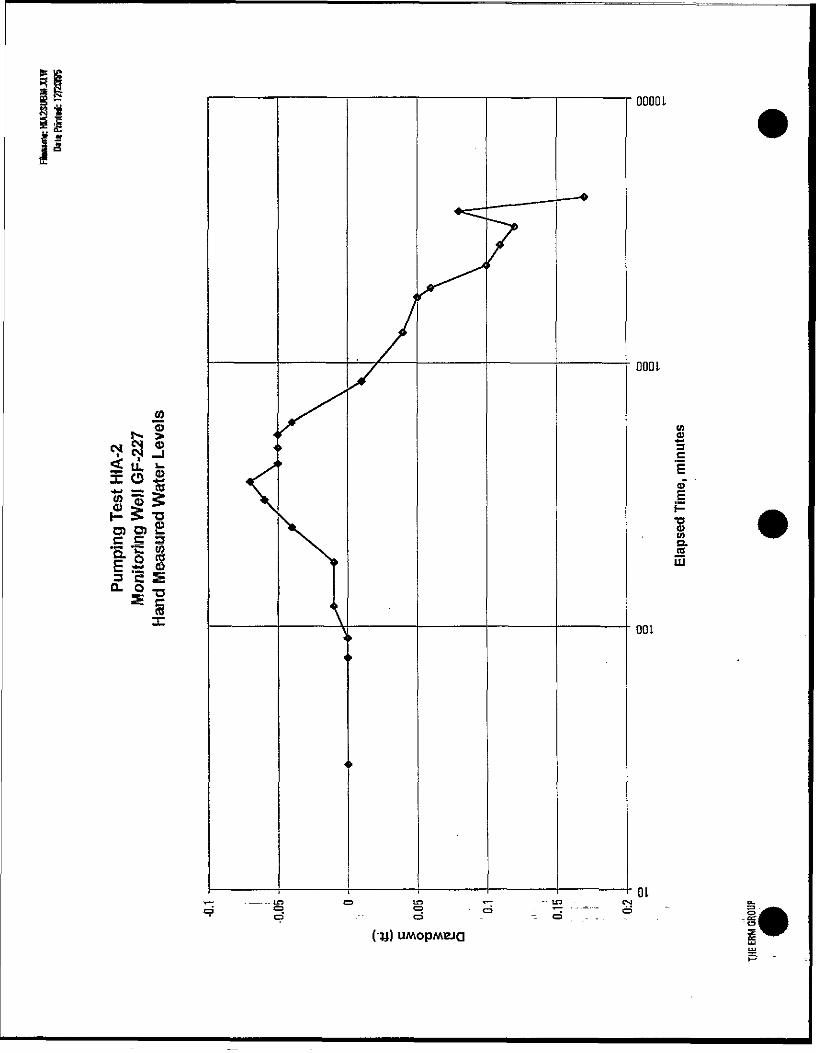
O a>CM
Z/n Cu*•* ti* —. CO§11
O3 Ol C.£ 3E s- s>3 e g
tax
OOOOL
0001
(A
toO.taUJ
001
OLtra CD inCD =CD --- CD
UMOPMBJQ
Drawdown vs. Log Time-Pumping Test HIA-9
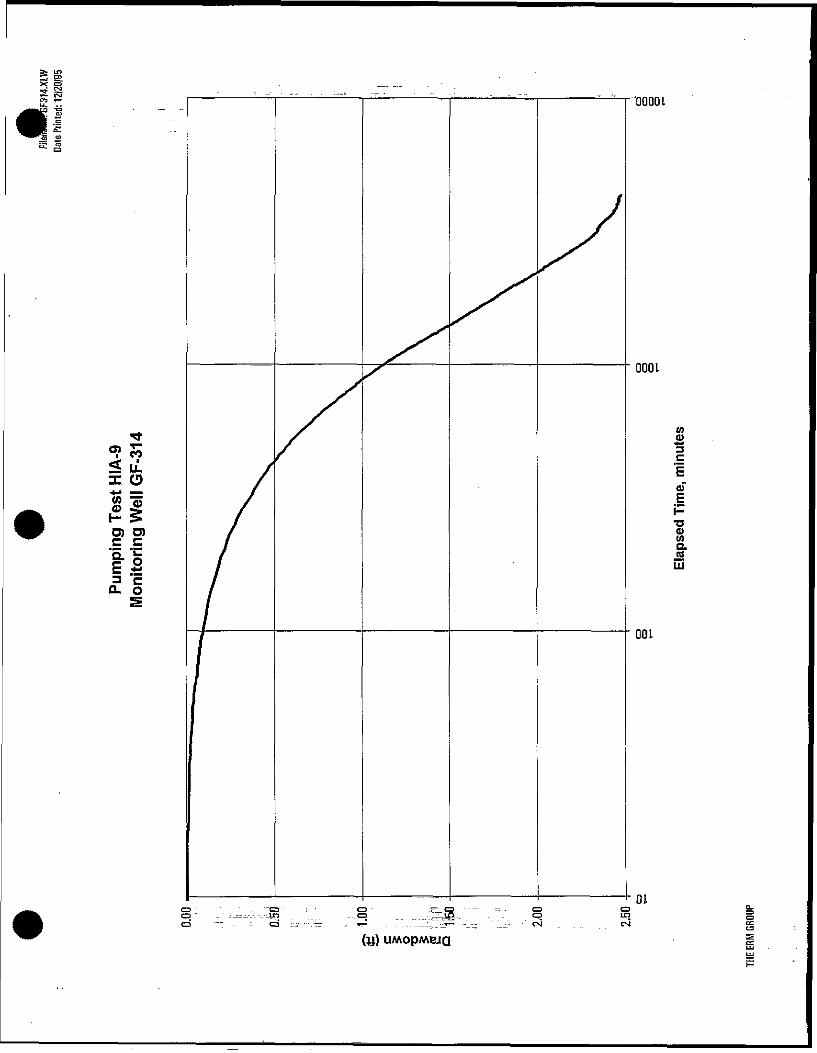
*±en < uLU)
01 O)C CII£ §
'00001
0001
(AQ.JSLU
001
01CDCD_CD
UMOpMBJQ
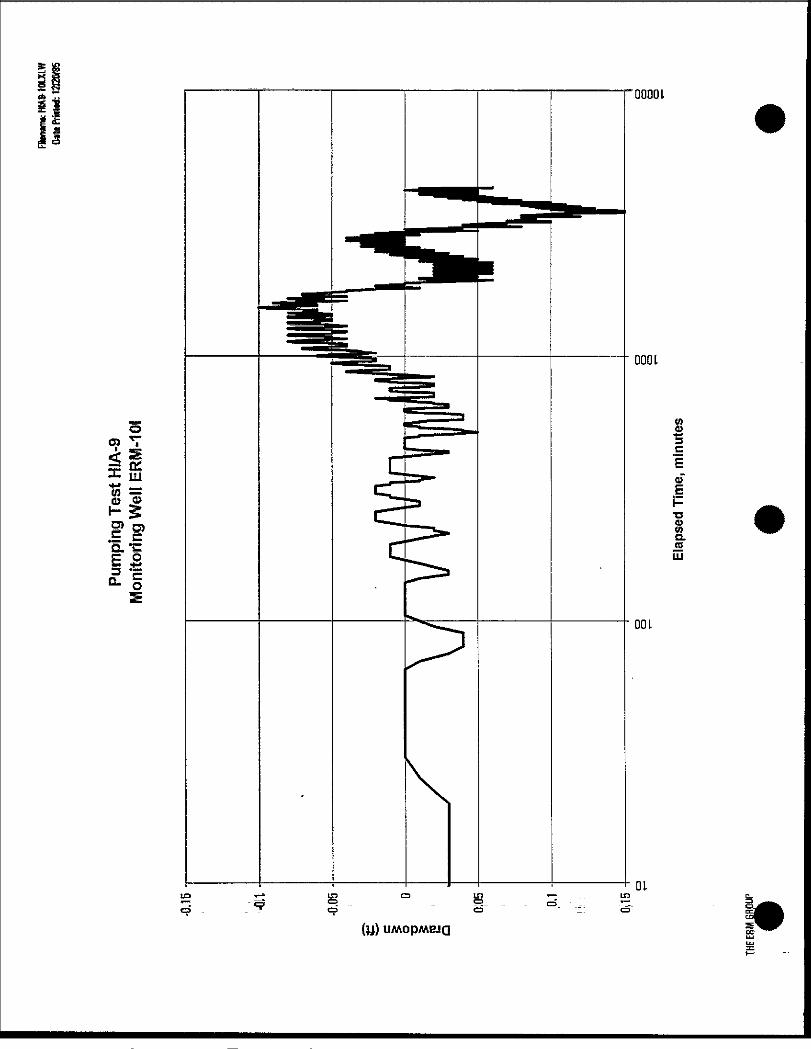
0000 L
0001
co TT» iSx LUliI" §2*0) _ a.g O »**L LU
£l
OL
(y) UMOPMBJQ |
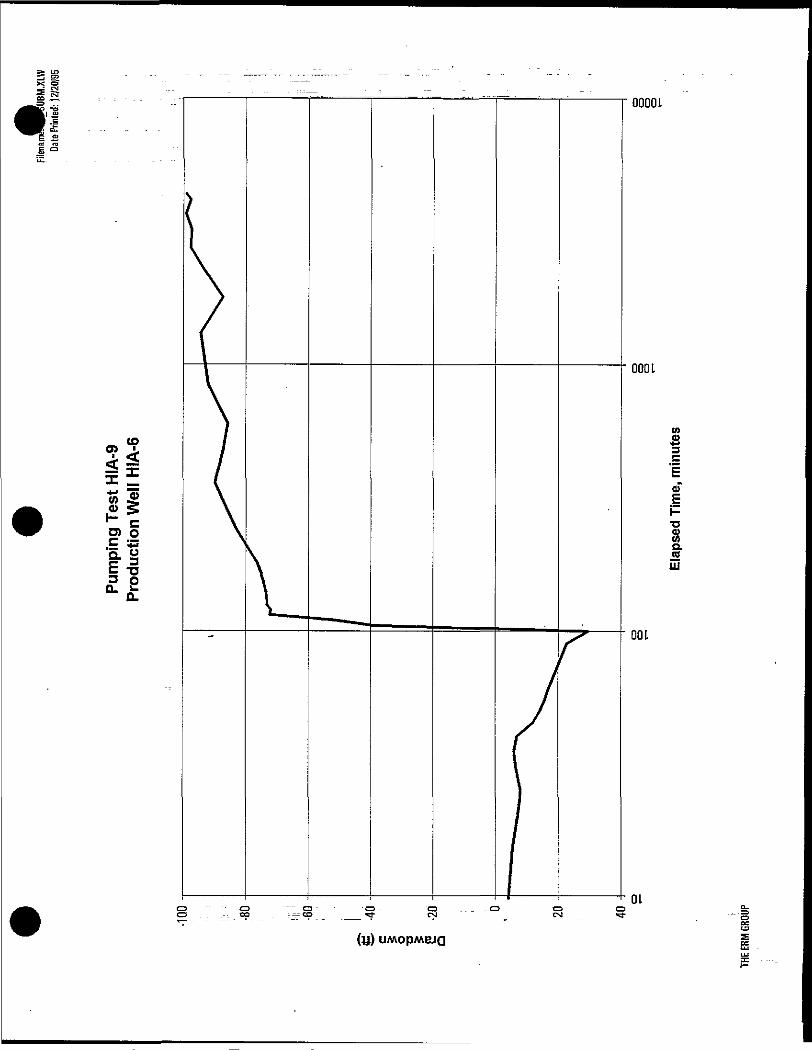
f a
i i
IIw 4
Q. §c =3I?
toto*J3C
EoTE
•DCJwo.nLU
CD O ~ CD CD- CD ^ - O CD CDCD . . _-, co . ^cn ^ CM CM -53-01
(y) UMOpMBJQ
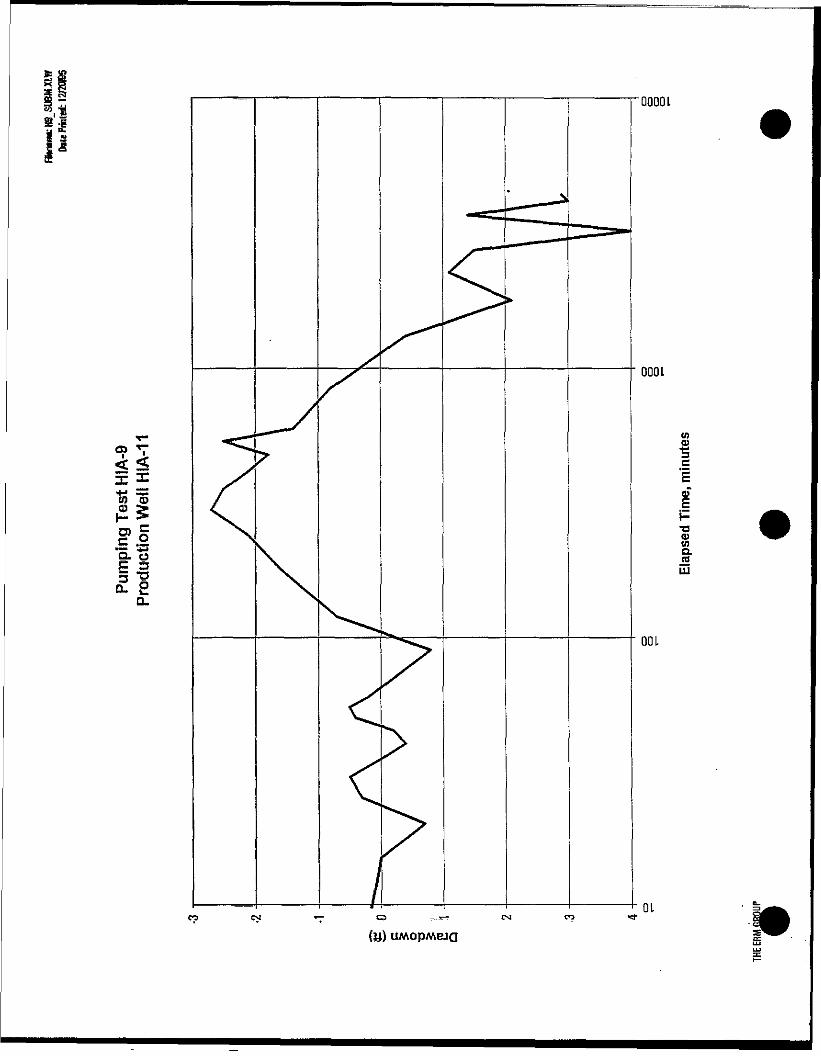
X•4-1 __.CO <D
C ilI— -=-'0.0i-8£ ea.
oooo L
ooo L
OJEi-a?tna_«UJ
00 L
OL
(y) UMOPMBJQ
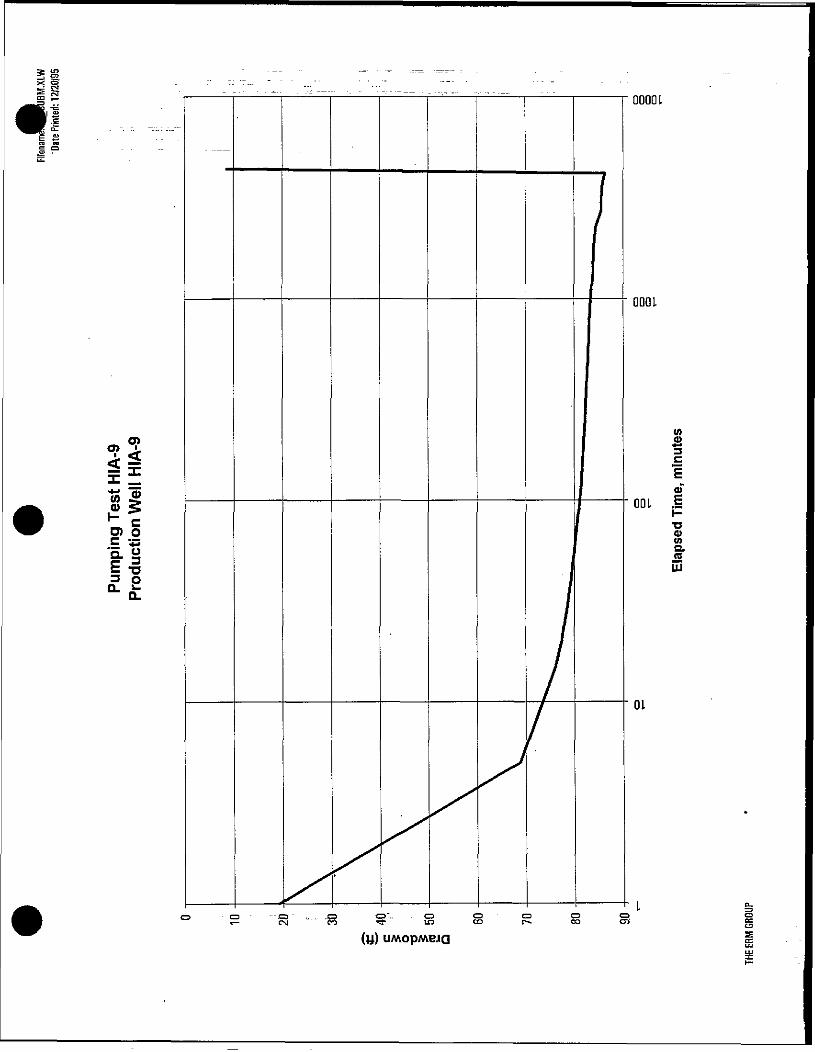
IItoCDc
O) OC -JJ
i
0000 L
000 L
001T3UMQ.J2LU
01
UMOpMBJQ
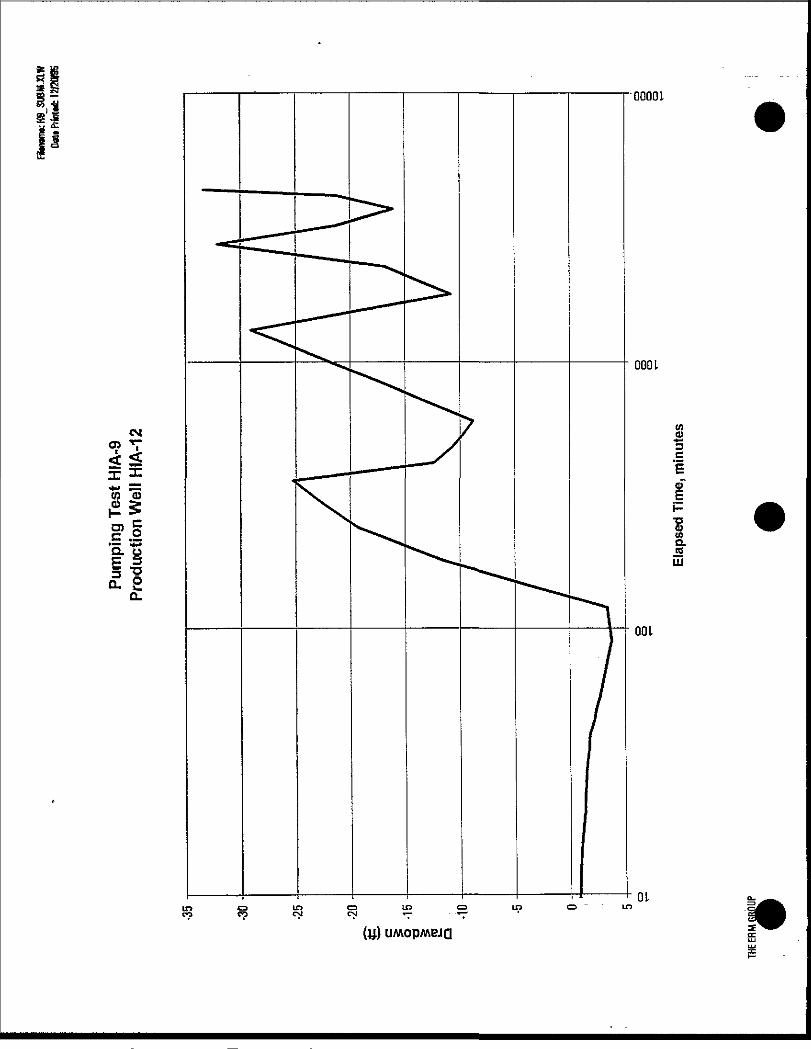
00001
000 L
CM
0>O
s>* 1^ 10.0 - *|= ^ B
£ eQ.
QLCD UTJ CD ITS
UMOPMBJQ
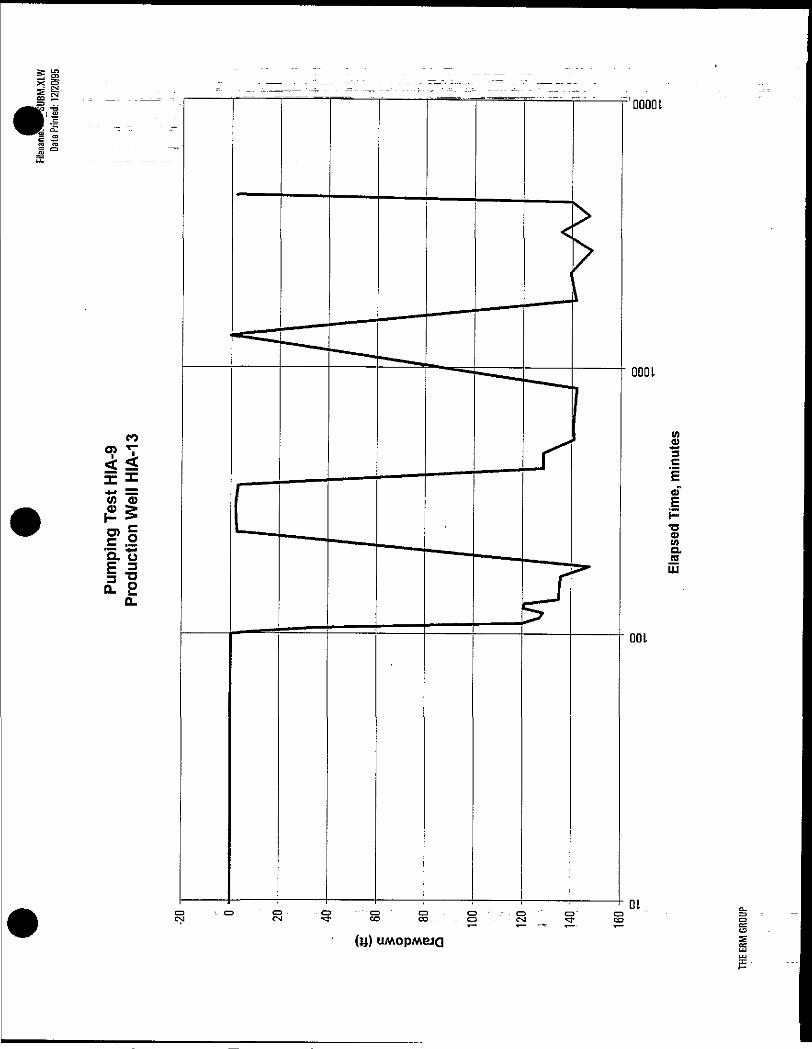
• Mi 2 00001
000!
co
ii __i_————J i-*J 3ZCO CD
•o0>enQ.
M ~Q P
(y) UMOPMBJQ
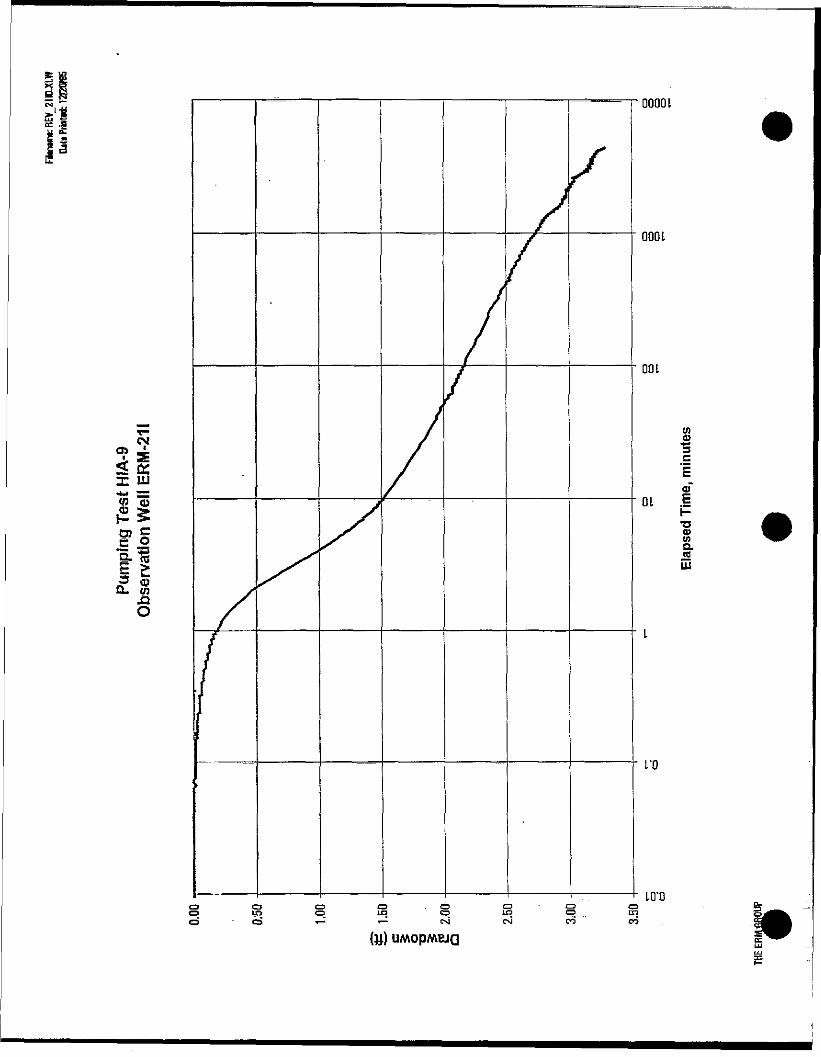
CM
*"t3)
—« *CL to.aO
0000 L
000 L
001
tno„eEoT
01 I
wQ.
L'O
LO'OCD CD CD ' CD OCD l5 <q U3 CDo - ca T- ^ CM
(y)
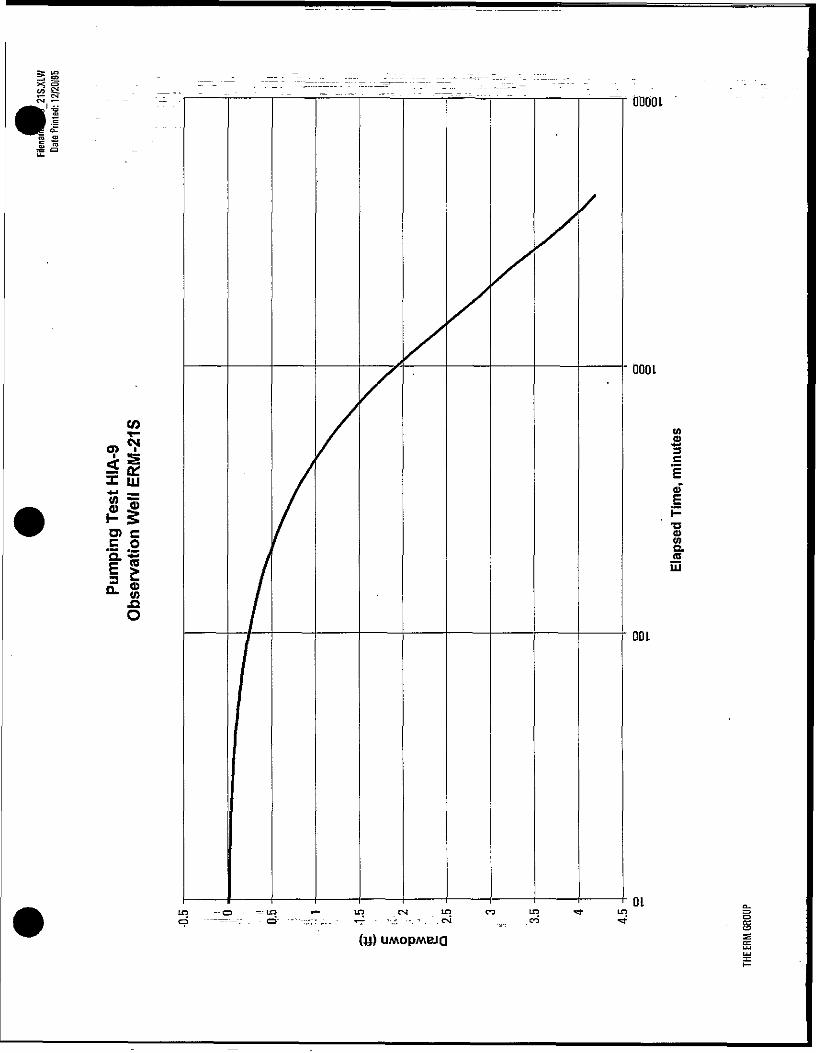
et . " _-- r . ^ ~"_ - - _ - - - - - - ---- _:_--_------ -------- ---- -- - =uTJOOl
0001
X LU
E I / E0?(/J
o
01I CO UD "3" l£3i . .... .CO ^
UMOPMBJQ
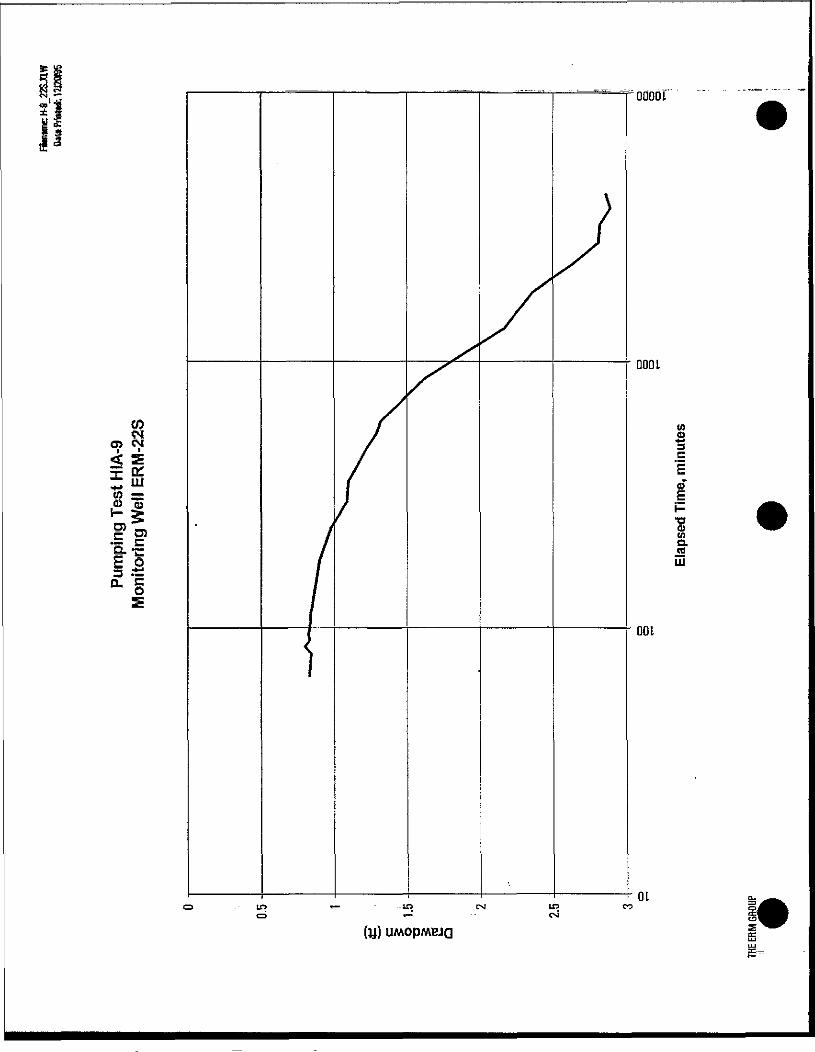
CD
O)C
o*JEo
V> I wfl>0> CM / SC
r LU / oto = I E
ofloof
ooo L
•aQ)tna.J8LU
001
01inCM
(y) UMOpMBJQ
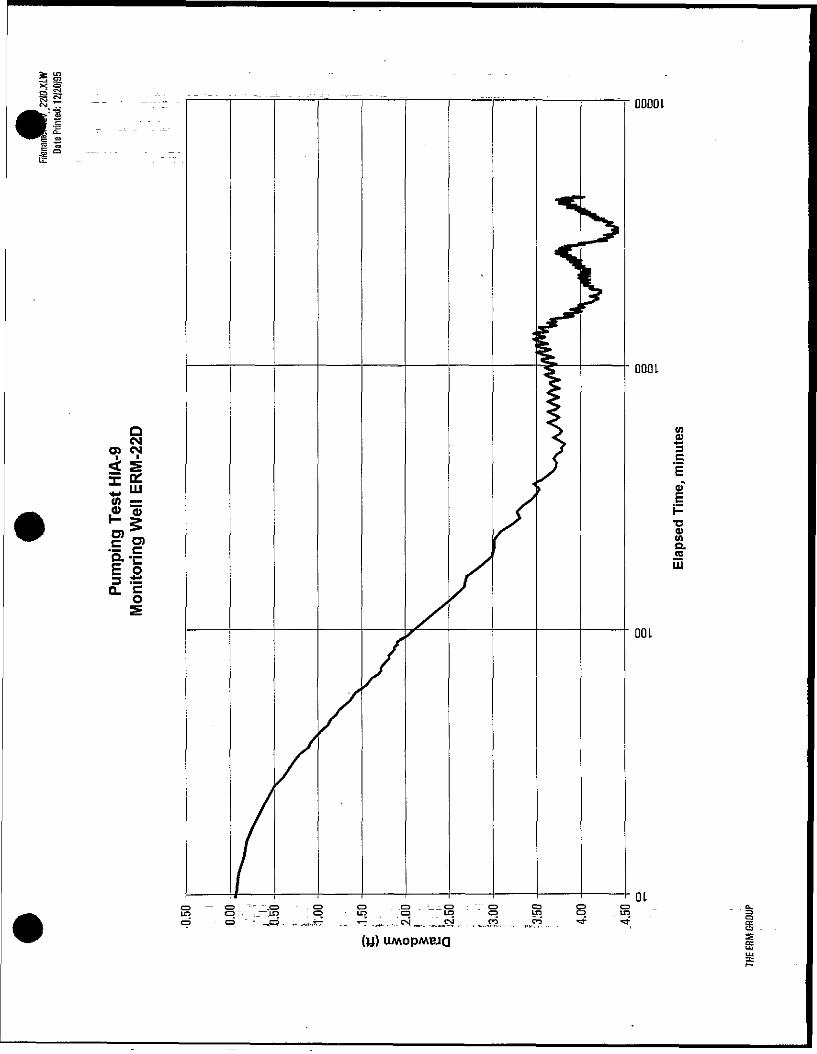
. OOOOL'I " ' 'eis:
000 L
Q " S WCM 3
<? <? / i< s~*<« =
c.jBLU
(y) UMOpMB4Q 1
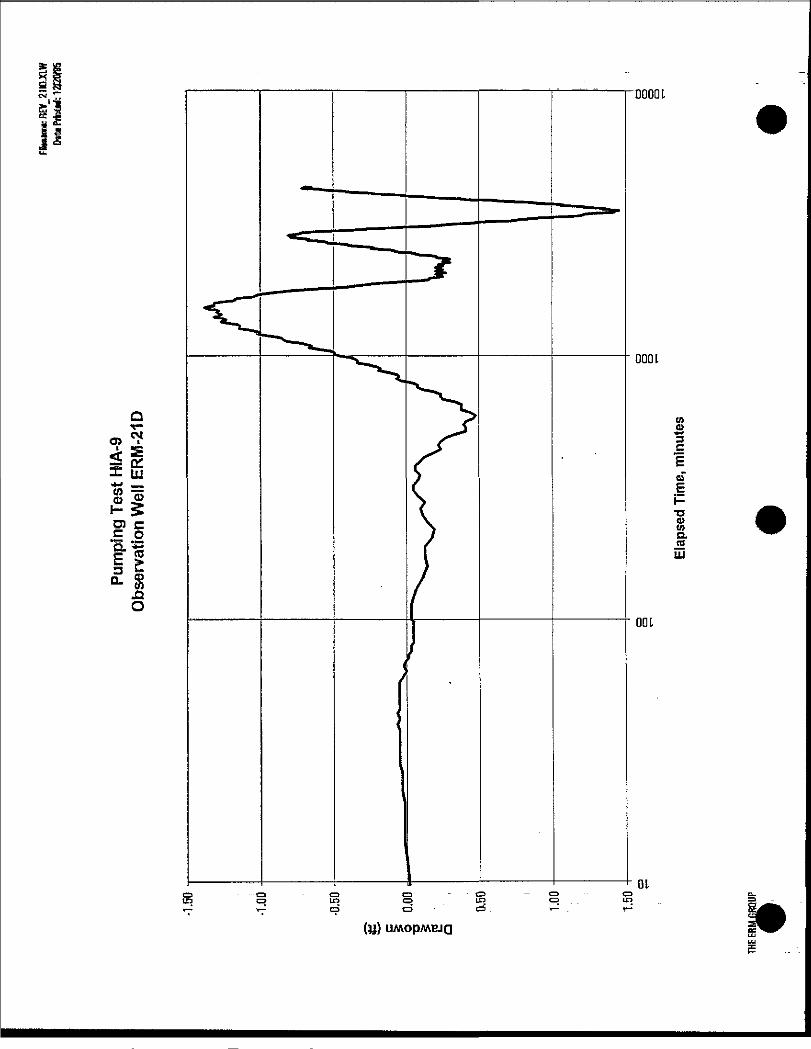
0000 L
0001
Q
X LU•*•* _*» "7ZCD
a,
OlC— -TST • ™»._ O 7 a^ TO
E~ (03 |
O
01Q_
»=——— -
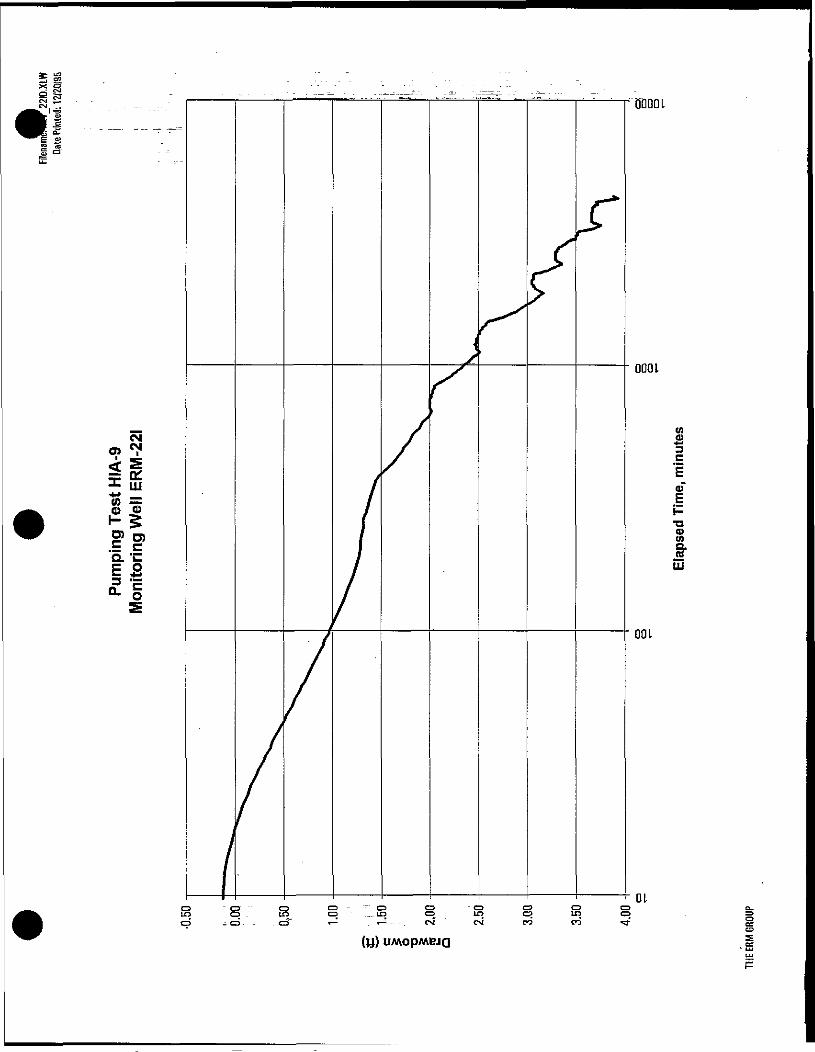
CMO «*< S1 K-1- LU**•* —8 5t- g"5. -cc o= -E°- o
Semi-log Plots-Recovery Test HIA-13

C0?fi ........ __._„_...„ ..- , , _ , . . _ .,_ ... ___ , . - . ..„, „ ...O) -" • _ - ~" - "——"-" - _ ~ ~~ _~_ _^ -• - - - - - ----- --• --.-.. - _ - ' . . - - -!r- - . - -- - - - - - ..--.-- . - _ - - - ; - . - - •-. ii- _ ^~
00001
co «CO "S
S^I2E cc £>X UJ Dco*r = cc
2.Q coO Q
0001
CD001 £
Q.CD
<o us . r eo cj i— o CEO O O — O - O O O5
gLU
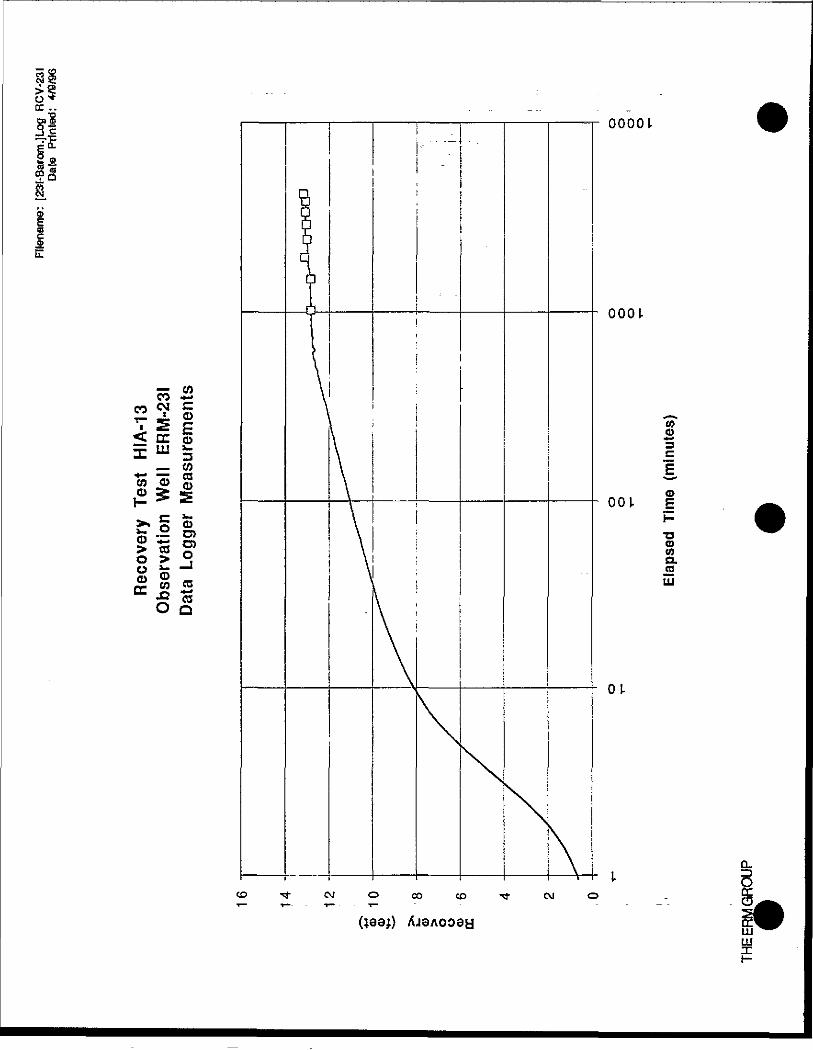
00001Mi O
O Q
0001
CO •*-*CM C
z 5 \ i— co
"S " co o coH "
£ ° I40 * O5> OJ o i \ Wo > °, \i a.o ir -1 \l : .. «
UJ
001
OJ-
s
ccLLJLUX

s - . ^- . --^..'l———I • • • —... t --__-T^- -. l——^_ ooocu
w «TO O
c0> • w
CD
X LU 3CO
*^ — COo o> a>
0001
0(U
»Q.os--* ! \ ea
w 2-Q coO Q
01
co co CM
SLU

CO CO - OJO O ' CD O
•00001
0001
CO «CO CM 5
< - £ X*- cc o5 m 5 i \ c« - g ' ^ ES ^ 5 - o o i
^ ~- •w , O
pi.- V fflen 2.n egO Q
01
UJ

Q Q.
c\J £
00001
0001
- ffi I iv ; °— to \ Etr T: to \ =
o>001 E
H
coQ.
UJ
01
in o toCM CM r-
UJ
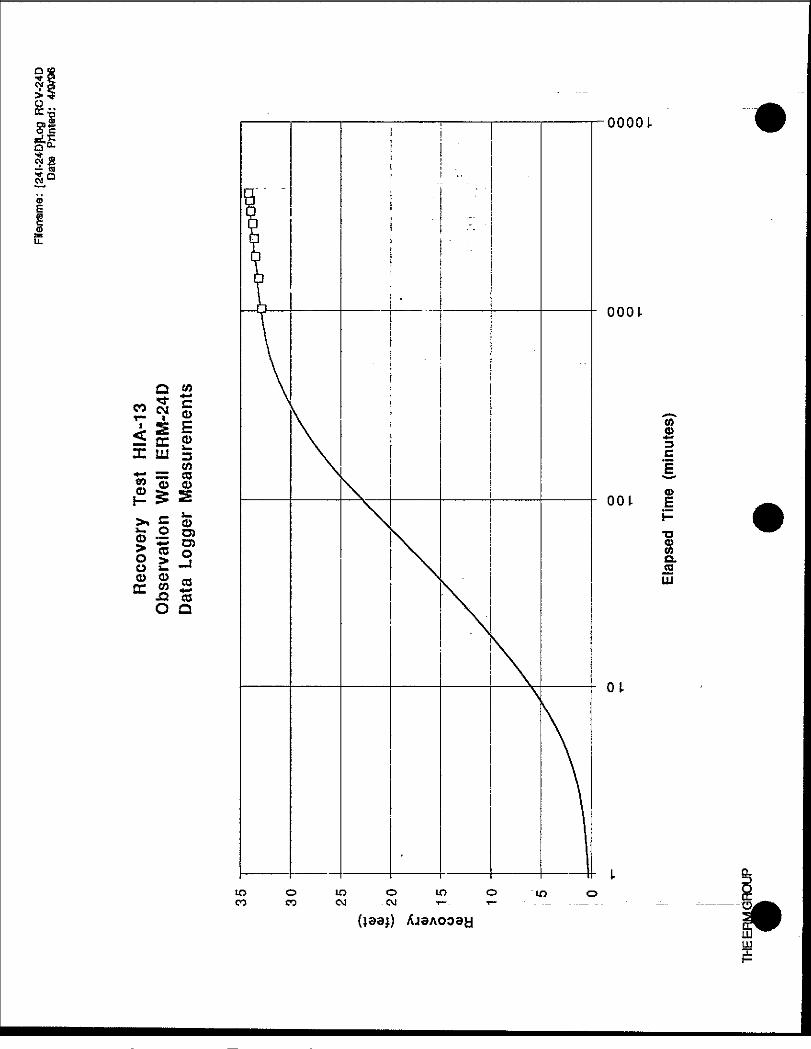
5"°-« s
O *"
—. v O
« =£ iS tr o
0)
_ CO"o o
S o» g CO
n.oLUDC m ~ *J2 ca
O Q
-00001
0001
to
o>OOL £
01-
10 o in o in o toCO CO CJ -CM T-. T- - - — P
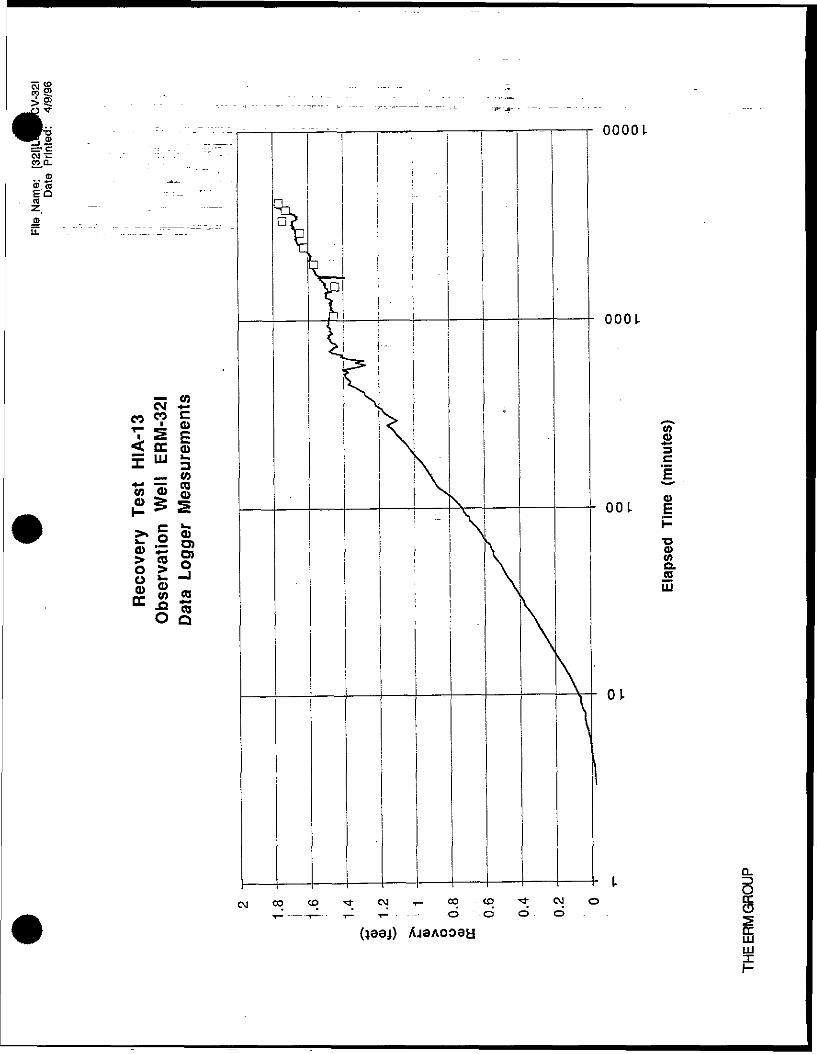
< °)
- - '- .--.---.-.- - ——-- -T—— -.———- - ———,———,———r 000010>
cy ~co Q-
.. Scp toC'Q
0001
CM «••°° C I 1 I ! 1 >! I I | | |
- E V ! 1 *«r | N
*. - I I i !\ Eco fl> S i i "X. !O > • K «l± > S 1—————1————————r—fV~1————————- 001 E>* S Sm •- °>O •*- ra> co 2*0 > 5 , , ,- 1 I I I I . I I \ l I I
I ' ' I \- «, i i I KO Q
01
Cv] C0_ CD
(139*) _
S
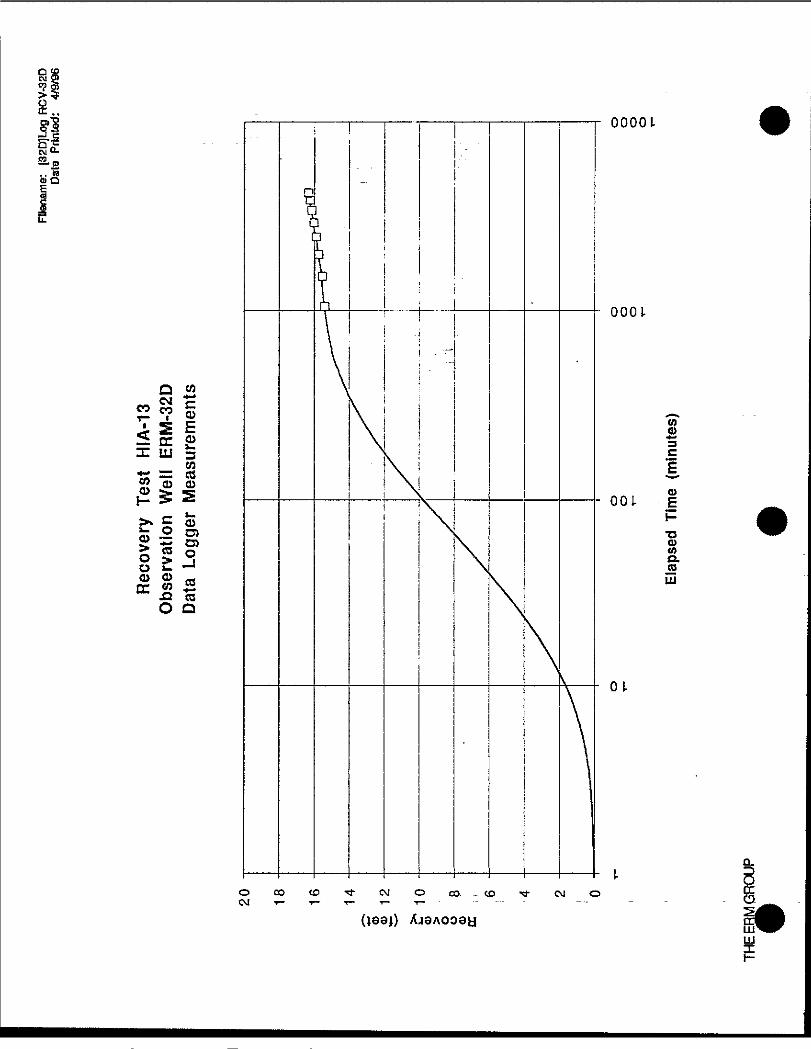
OOOOL5*
Q
OJ -
0001
«
= iu 5 \ i =to \ i E— ca x cO ^ ^£ I \ ' O
001- E
O > io C —' \ cod> o - -cc S3 •»-*O Q
01
Q.
UJx
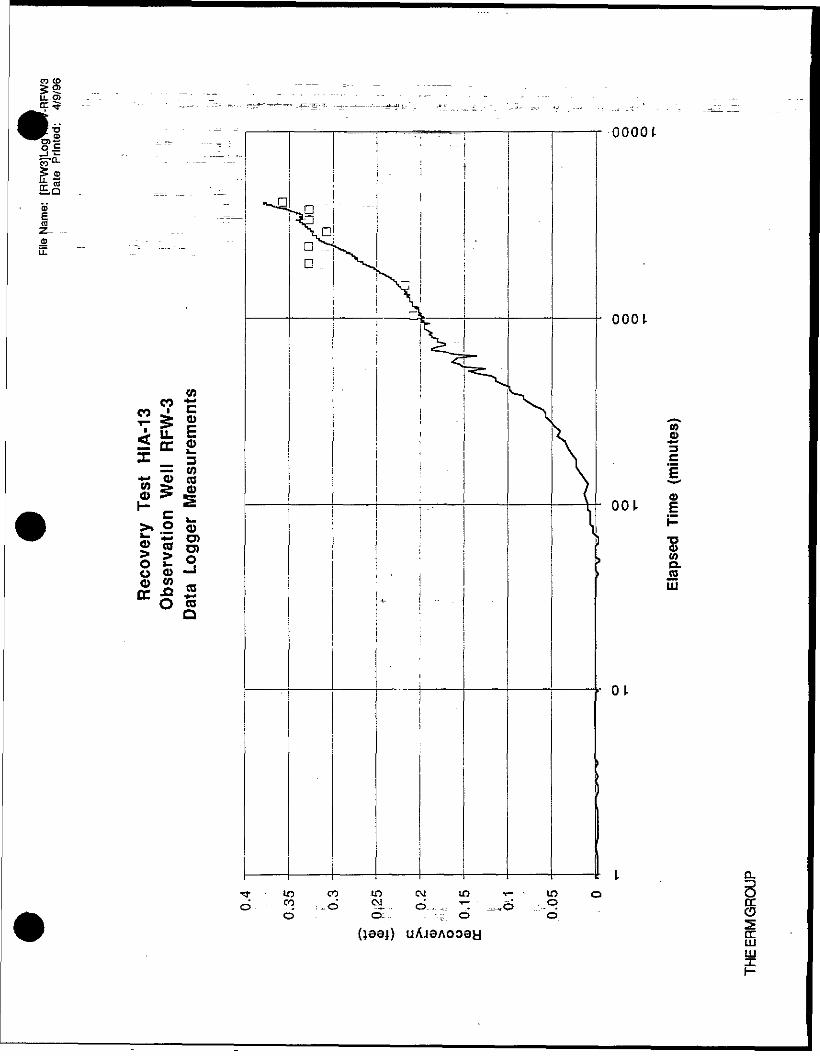
CO (D ... __ __ ._ ____
1L.-O - - .~. ~"_T .' . " " "' """ "" """ - - •• -. ---
; -.. , -_--7-^i , ooooiq!
CO
5 S I
— CO
% 2c , , 001 1ir k.
to co ir> CM in t-
0001
ell "S i±' I i i "PS: *» O) . ; o>o ?o <l> "-11 i jo
ja <o°s
01
ccLUx
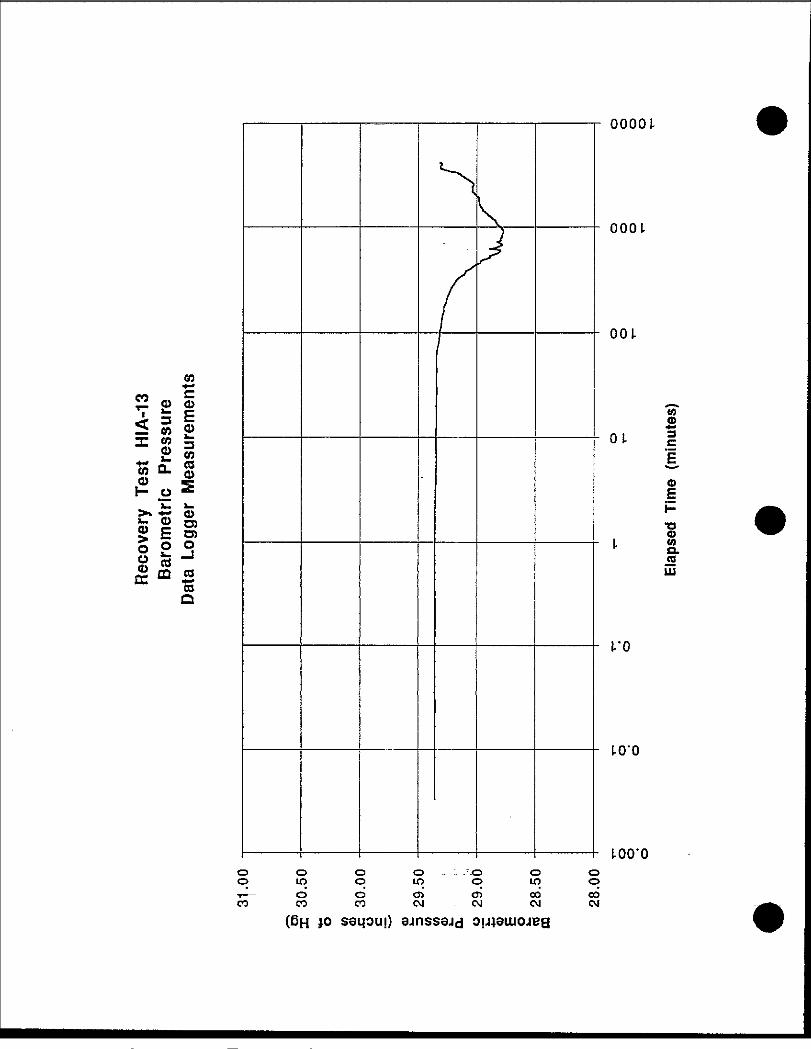
CO
CO =<2 o g3 =
i
X
O
o
eo «k.
O
E
o
o>O ° H
8 m «o
00001
0001
001
O)
IcQ)
oCOa.gUJ
lO'O
lOO'OO O O O -r-O O Oo in o in o in o-r- — d CD oi cri oo coCO CO CO CM - OJ CJ CJ
(6H {0 saijou!) ejnssejd o
Drawdown vs. Log Time-Recovery Test MID-04
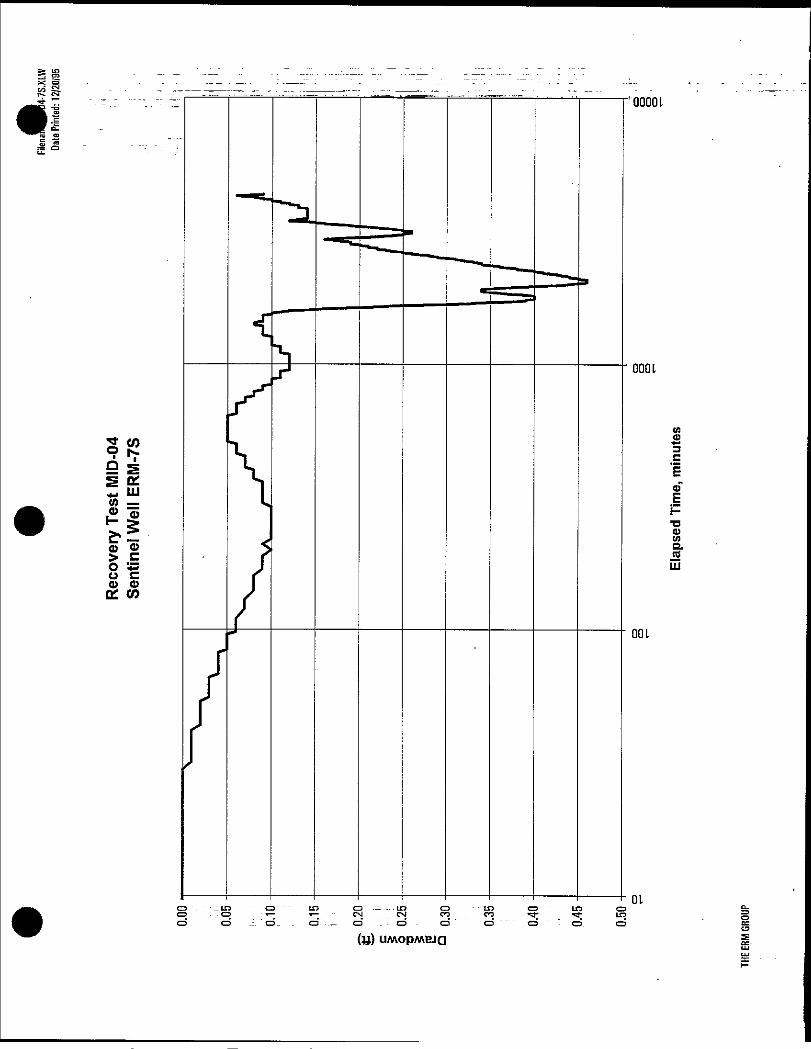
^ CO
9 5s tt,M LU(0 —
0) O> cO '4=O CCO ffiQ£ CO
"00001
0001
™
utoQ.
LU
00 L
01C3 '--I ---LO O "LO C3CN _ OJ CO CO -3;CD . - C3 - CD O •" ' CS
(y) UMOpMBJQ
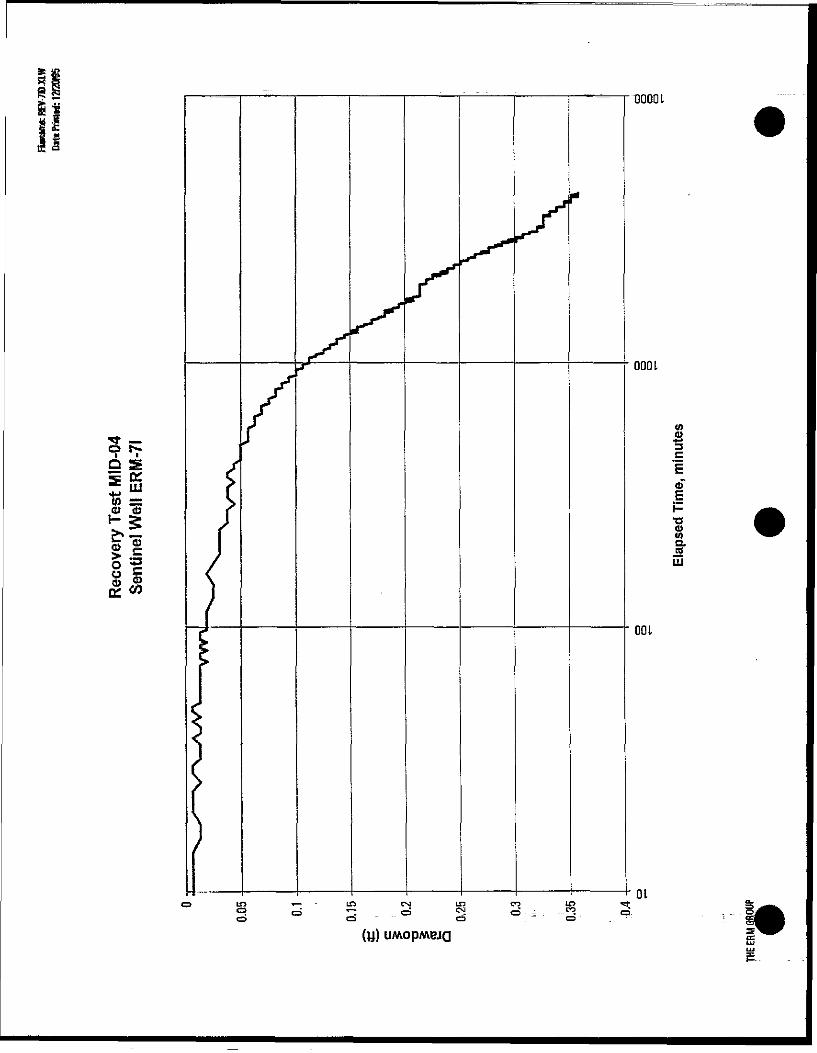
to «
II5 -g*iIE w
— m i r\ \ I I l I I i **J
"0000 L
000 L
E
(AQ._(gUJ
001
01LO CM LR COT CD ^ CDo - - o
(y) UMOp/ABJQ
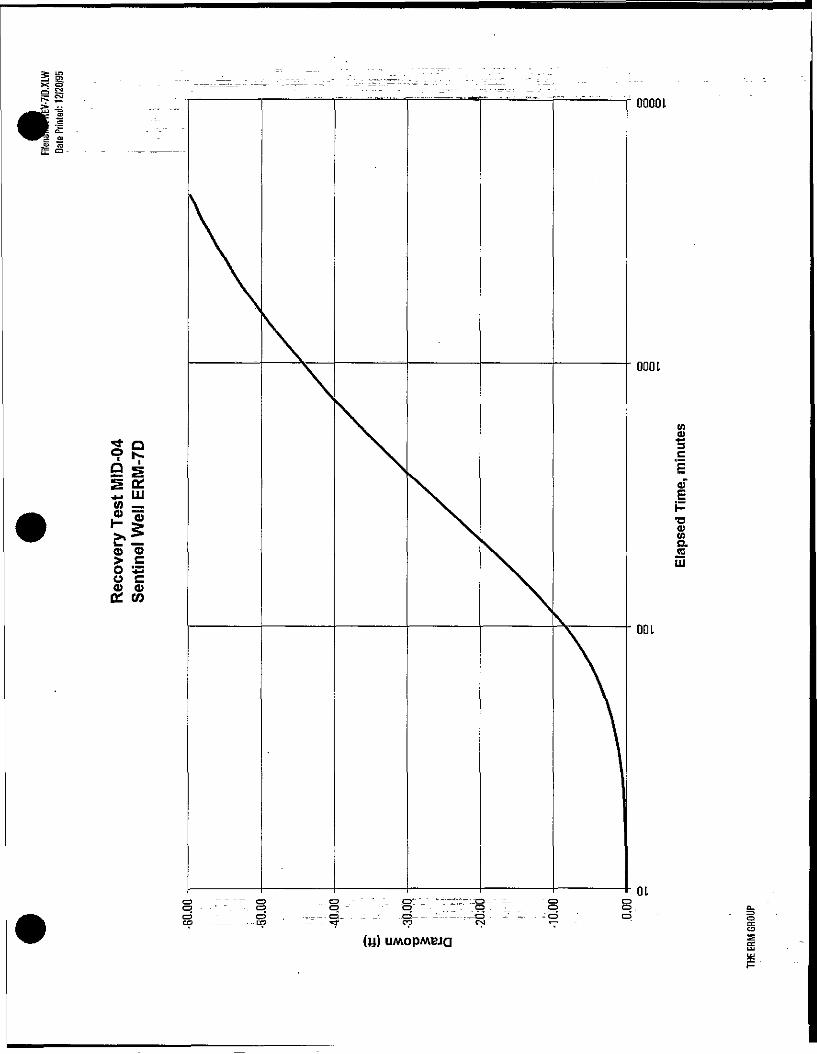
P K X =E
g Q£
a> o.£ X LUO £>
O C0) <u01 CO
(y) UMOPMBJQ
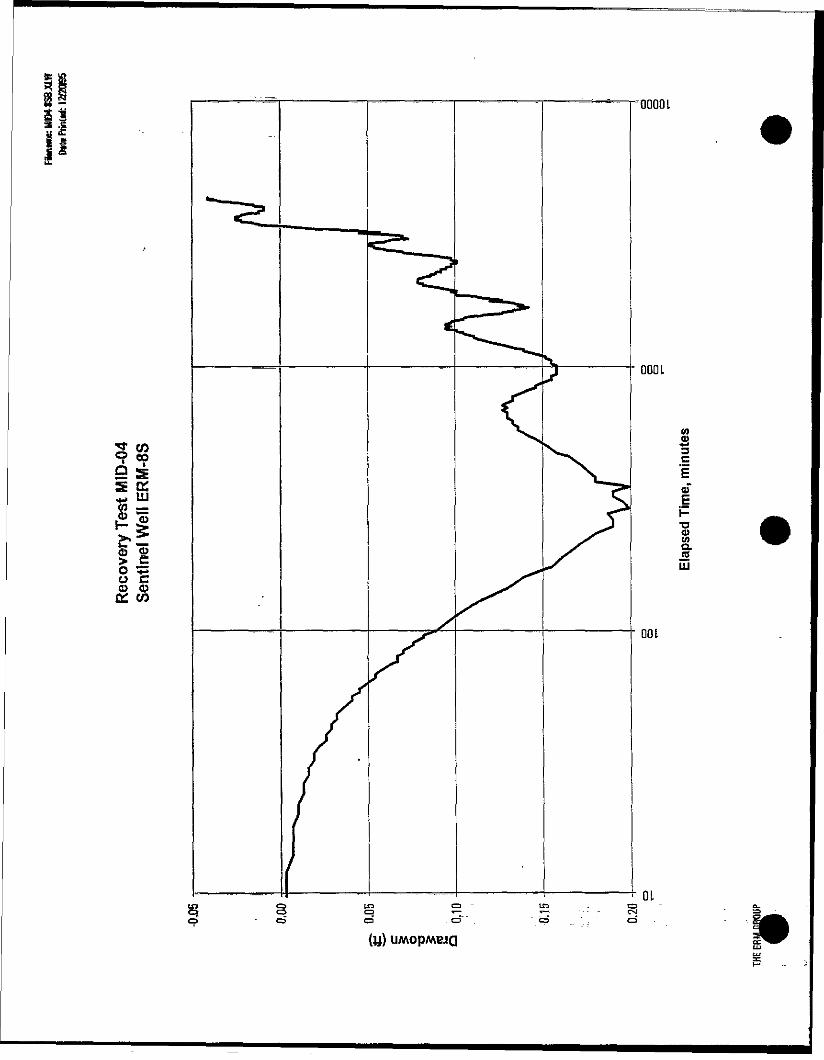
00001
000 L
2 a:
I -*T I ^
O CO Q££ CO
(y) UMOpMEJQ
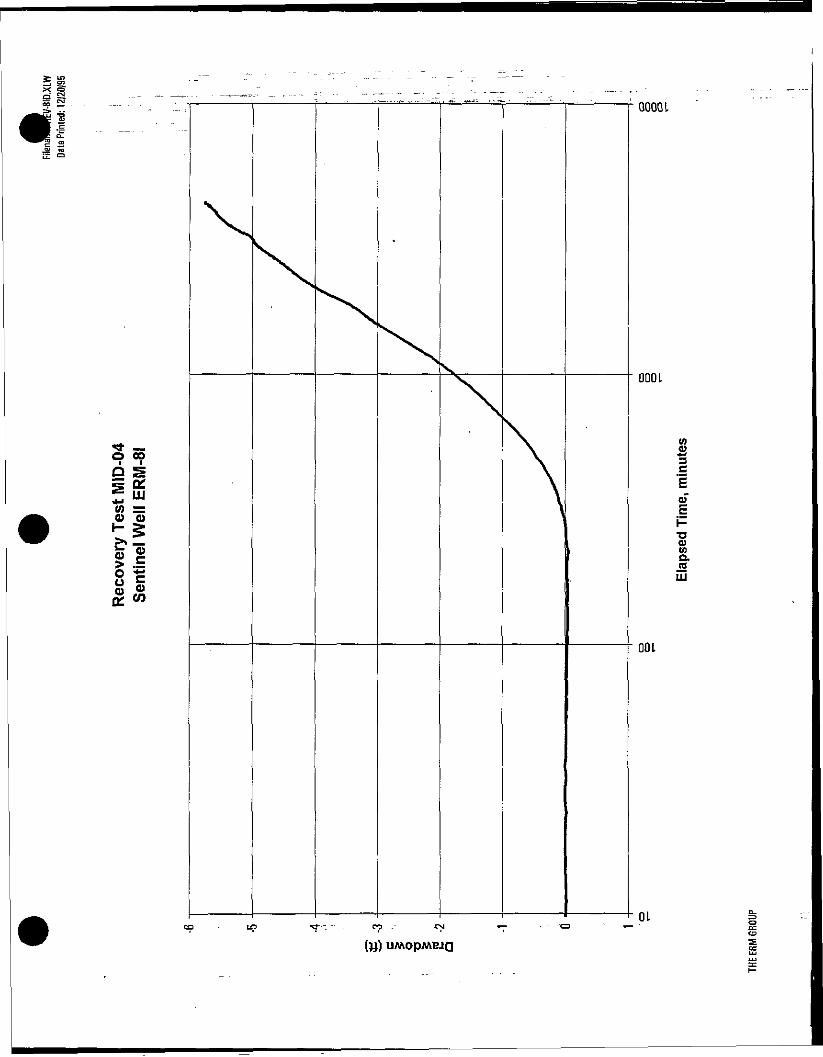
-
9o
to =<D 0)
00001
000 L
tn
cEoT
O)wQ.JOLU
001
OL
UMOpMBJQ

0001
(AQ
o:Q "*• x E
to LU
O CD> CQ u eCD CD01 CO
0000 L
to
H•pCDtnQ.taUJ
001
01
(y) UMOpMBJQ
Q_•
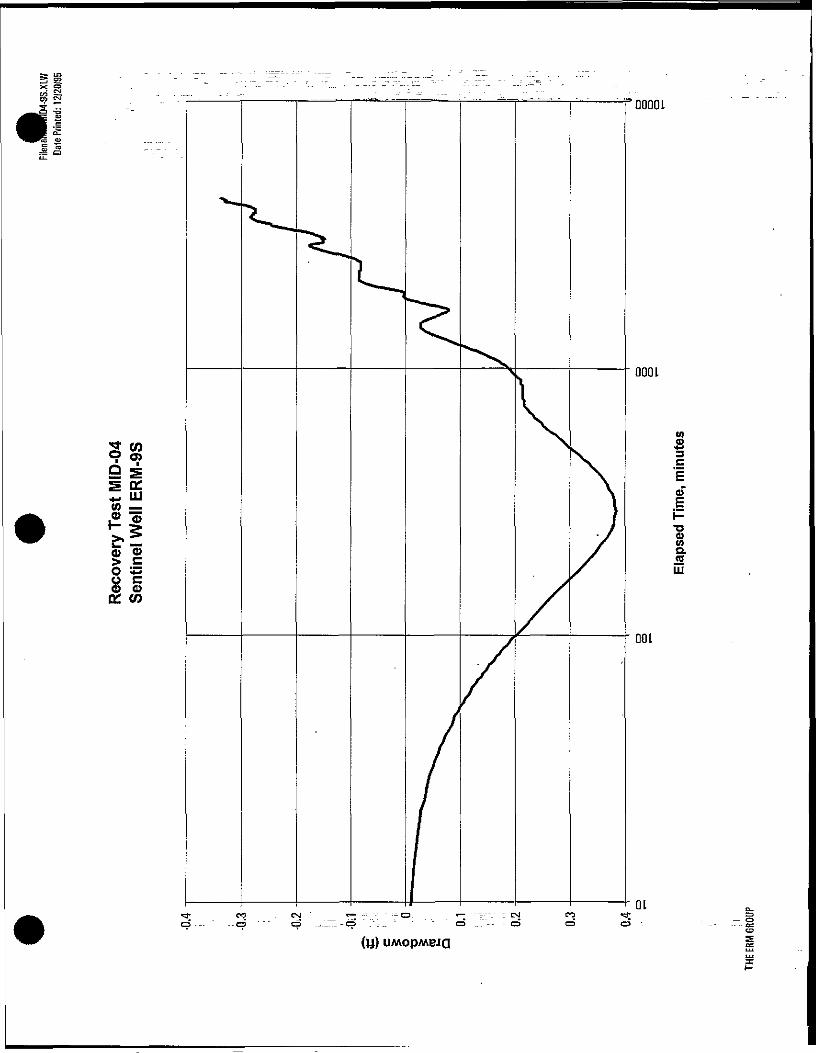
00001
0001
tow ^
Q ' -
CO —
O.aLU
o c01 CO
01«— -------.- : CM CO *d;O ...:--- - CD C3 O
(y) UMOPMGJQ
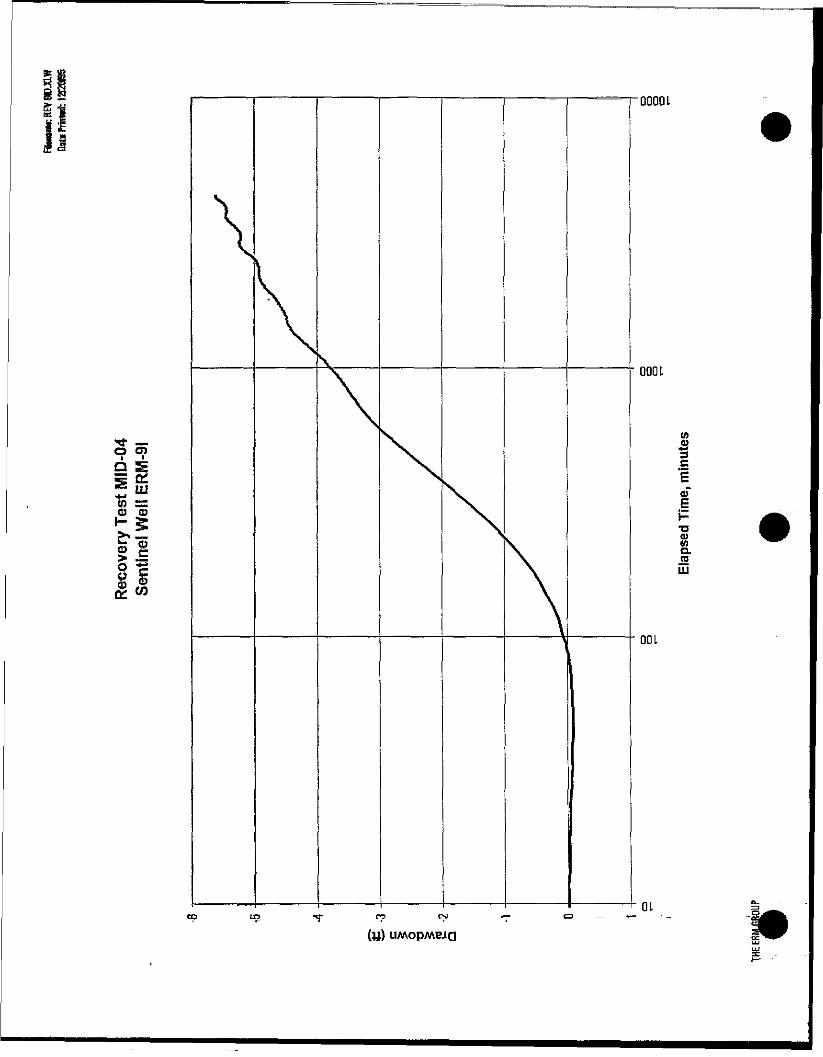
9 9Q 01
toCD
s e3 -g§Irv CO
'0000I
000 L
CDtta.2LU
00 L
QL
(y)

"00001
000 L
+, LUtO —
— » «CO CD \ 0.> c \ jSO 55 \ UJO CCO O01 CO
UMOpMEJQ
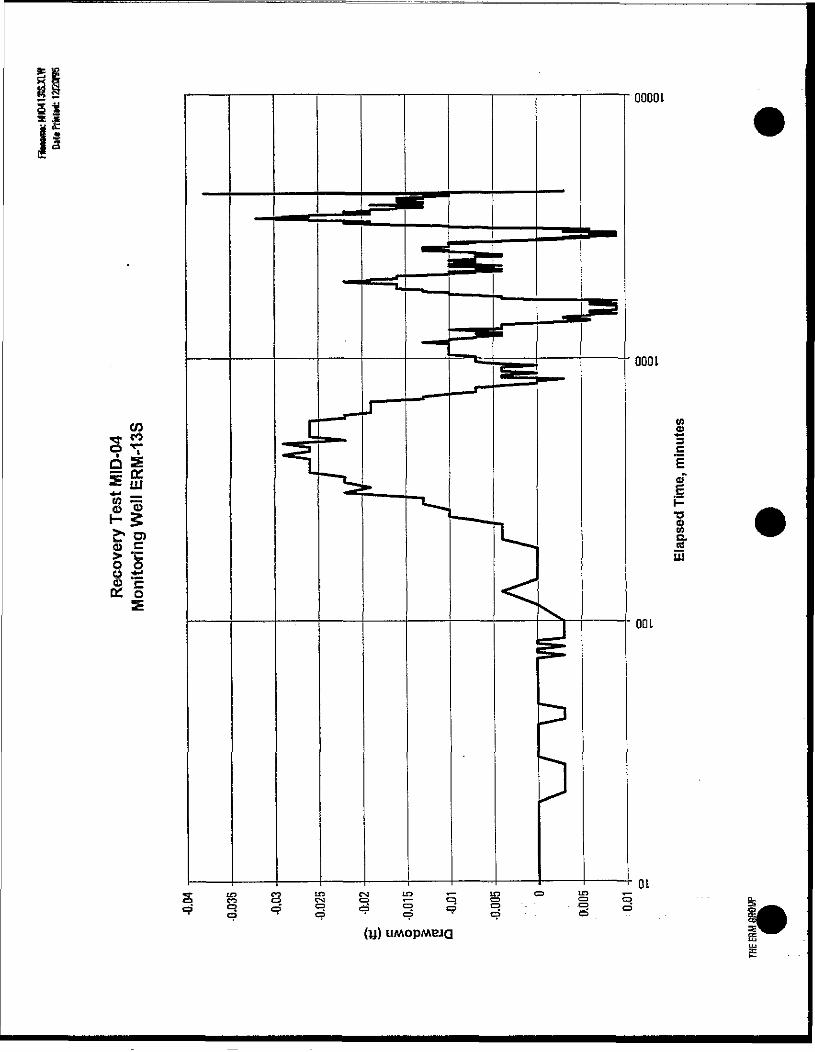
0000 L
0001
co r S
8
O oo ;gL? O
Q.
UJ
(y) UMOpMPJQ
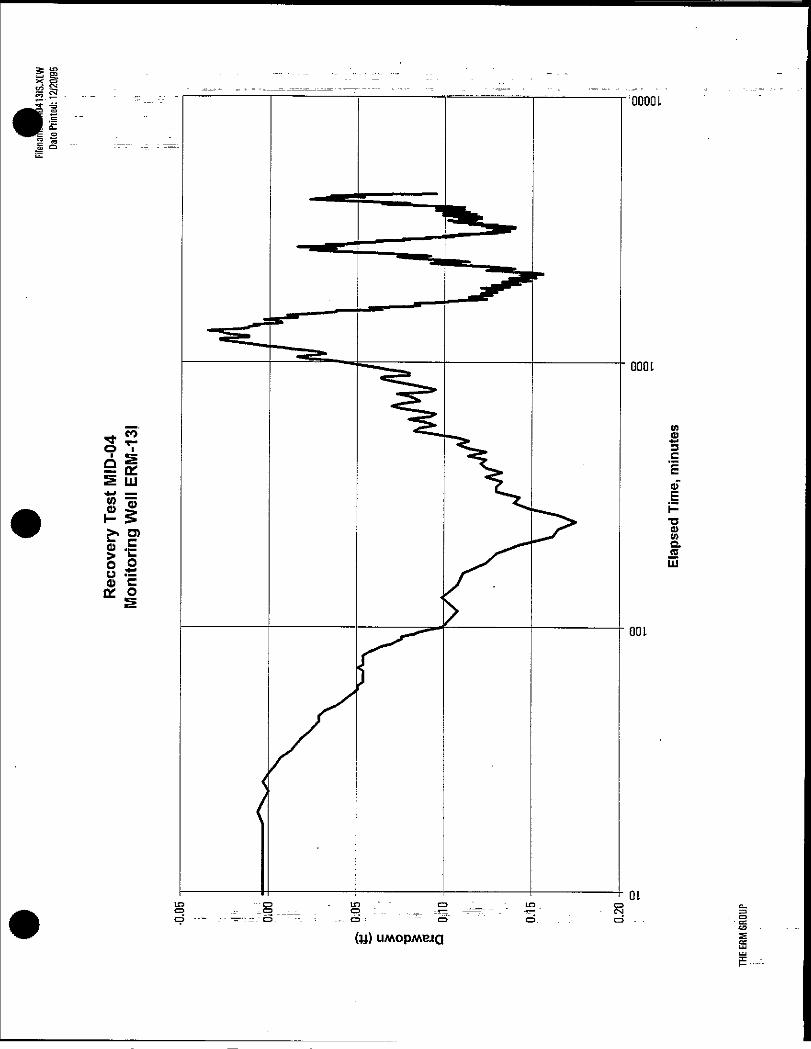
'QOQOL
000 L
to
O ^a* 1il ^H•o0>wQ.
00 ^r LU
0) *C01 O
OL
(y) UMOpMBJQ
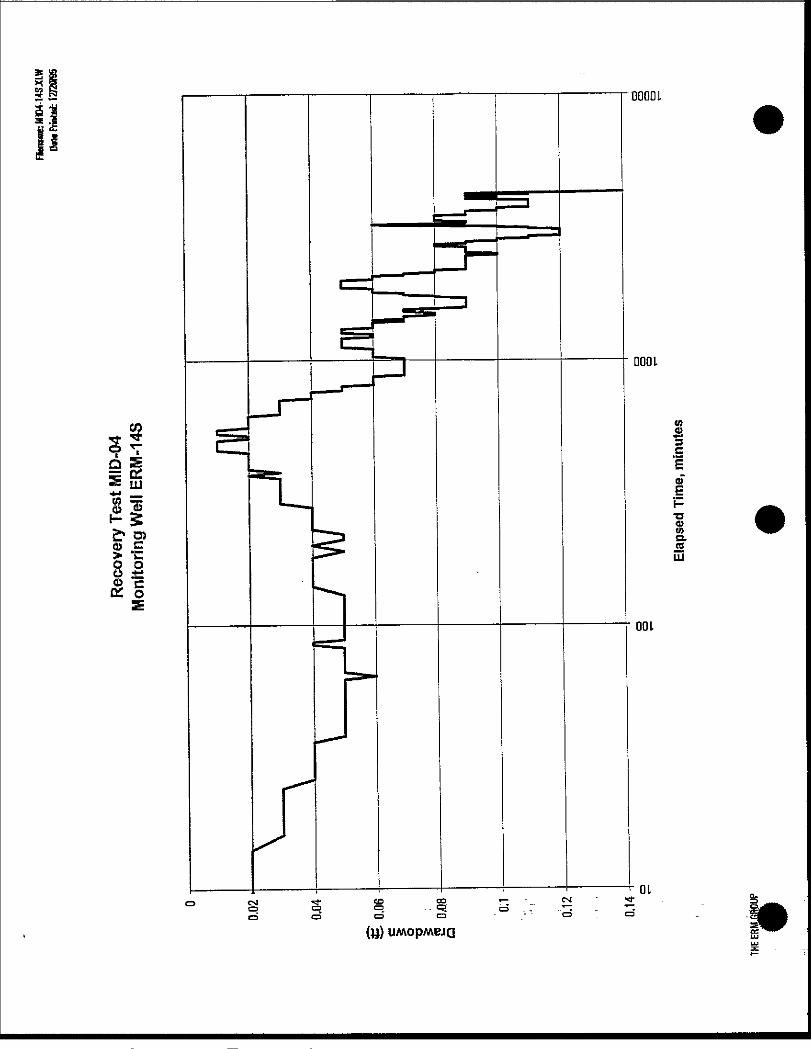
CO
* tu
II£• o)® J£> "Co oo :£el> c01 O
DOGOL
0001
o>P•oCD
UJ
001
QLCM fo o.C3 C3
UMOpMBJQ
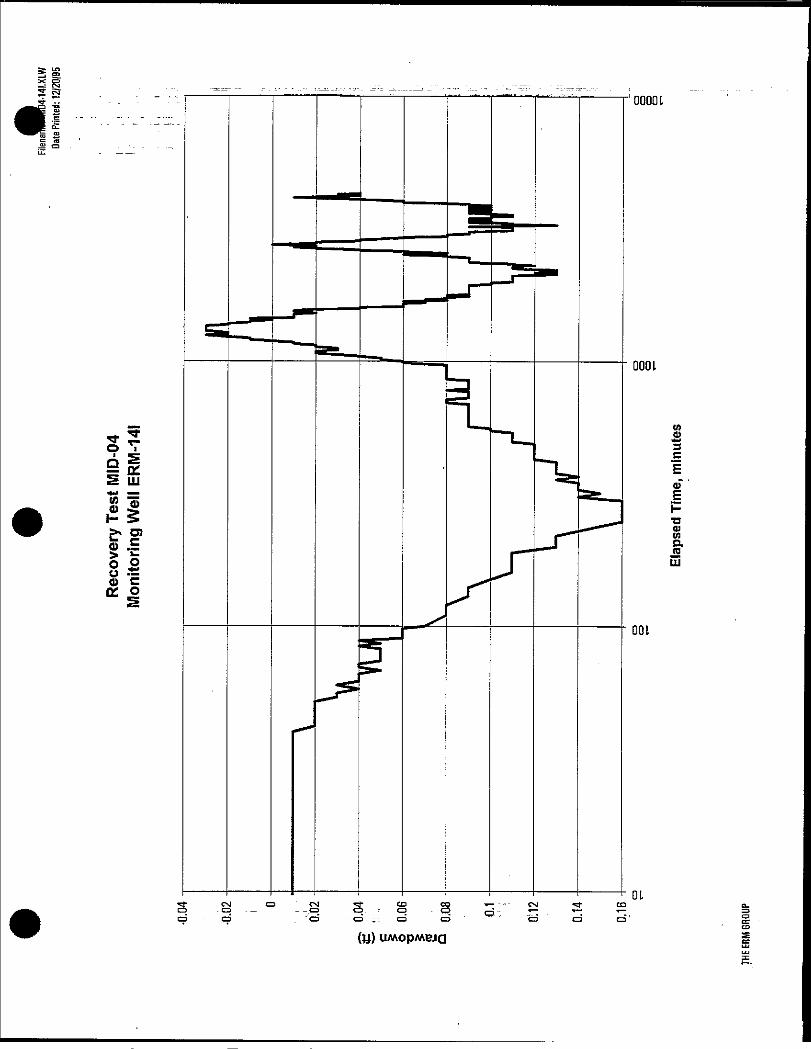
i§5 LU
O)
O O8'EDl O
<uCO
000 L
tno.JSLU
001
OL
(y)

Appendix LGround Water Flow Modeling
DRAFT REPORT
Middletown Airfield NPL SiteMiddletown, Pennsylvania
Ground Water FlowModeling
1 July 1996 - - -
ERM Program Management Company855 Springdale Drive
Exton, Pennsylvania 19341
ERM,

Section: Appendix L-TOC .: . . V " '"-,-""':"-. . . 1 ".!-__.. ." .'./...""..' L, '_ .". • page: i of ivDate: .. July l,199£=r' ^ J .,.;.:_ . .... ,.1 ':.L'" "...'^ ... . -.RevisionNo.: 0
TABLE OF CONTENTS
L.O GROUND WATER FLOW MODELING " ~ i
L.1 INTRODUCTION - ....... :i:........ 1
L.2 MODELING OBJECTIVES —-~ 2
1.3 SCOPE OF WORK _... - 3
L.4 ^ MODEL SELECTION '.. ". r 4
L.5 REVIEW AND EVALUATION OflEXISTINGDATA 5
L.5.1 GEOLOGY ^ 5
L.5.2 -WATER BALANCE , . V ... .J. • / . . . : 5
L.5.3 AQUIFER CHAKACIEKISTTCS 6
L.5.4 PREVIOUS MODELING - 7
L.6 - - - - - - - CONCEPTUAL MODEL 8
L.7 MODEL SETUP AND INPUT PARAMETERS 10
L.7.1 _ _ MODELED AREA 10-
L.7.2 VERTICAL DIVISION OF THE MODEL GRID 10
L.7.3 MODEL BOUNDARY CONDITIONS V 13L.7.3J. . - Layer 1 Stream Boundaries 13L.7.SJI ."Layer 1 Areal Recharge 13L.7.3.3. -- '""Layers 2,3, and 4 Boundaries _ __~ - 13L.7.3.4 -Initial Conditions. .... - ••-. . 14
L.8 MODEL CALIBRATION ~ 15
L.8.1 REFERENCE WATER LEVELS AND WELL PUMPING RATES 15
Section: Appendix L-TOC ..." ^ - - . _ _ - . page: _ ii of ivDate; July 1,1996 _ ~ -. : RevisionNo.: 0,
L.8.2 CALIBRATION PERFORMANCE .._.. . 16
L.9 SENSITIVITY ANALYSIS 18
1.9.2 TRANSMISSIVITY AND AREAL RECHARGE .: 18
1.9.2 VERTICAL CONDUCTANCE . _ _ , . _ . . : _ „ _ _ lg
L.10 MODELING SCENARIOS _ 20
L.10.1 SCENARIO! - CURRENT CONDITIONS 20
L.102 SCENARIO2-RECONFIGURED WELLS 20
L.1Q3 SCENARIO 3 - REDUCED HIA PUMPING 20
L.11 CONCLUSIONS AND RECOMMENDATIONS 21
L.12 REFERENCES 22
LIST OF TABLES _ _ FQILOWING PAGE
L-l HIA Production Well Data 15
L-2 Modeling Scenarios 21
LIST OF FIGURES
L-l Plan View of Model Grid 11
L-2 Side View of 3D Model Grid 12
L-3 Transmissivity Distribution Across Model Area 13
L-4 Simulated Heads in Layer 1- For Calibration Rim 17
L-5 Simulated Heads in Layer 2 - For Calibration Run 17
Section: Appendix L-TOC~:~ -,. Vl ILr! " " M... ."' ".....::'" _. .I'l"' ""=T" :-"-' ""-" -" ' .-.Page: iii of fv
Date: July 1,1996. . . . . " . _ . . . . . - , . . : . . . 2-" -- -RevisionNo.: 0
L-6 Simulated Heads in Layer 3 - For Calibration Run 17
L-7 'Simulated Heads in Layer 4 - For Calibration Run 17
L-8 Model Boundaries in Layer 1 14
L-9 Residuals in Layer 1 - For Calibration Run 18
L-10 Residuals in Layer 2 - For Calibration Run 18
L-li —~ Contour Map of Residuals in Layer 1 - For Calibration Run 18
L-12 -Contour Map of Residuals in Layer 2 - For Calibration Run 18
L-13 Comparison of Residuals for Sensitivity Analysis of
Transmissivity/Recharge Ratio 19
L-14 "'.- -Comparison ofResiduals for Sensitivity AnalysisofRecharge Rate 19
L-15 Comparison of Residuals for Sensitivity Analysis ofKuiku Ratio inLayer 20
L-16 Comparison of Residuals for Sensitivity Analysis ofKuiku Ratioin Layer 2 20
L-17 .... Simulated Water Levels for Scenario 1, Layer 1 21
L-18 Simulated Water Levels for Scenario 1, Layer 2 21
L-19 --Simulated Water Levels for Scenario 1, Layer 3 21
L-20 ~* Simulated Water Levels for Scenario 1, Layer 4 21
L-21 CSimulated Water Levels for Scenario 2, Layer 1 22
L-22 - Simulated Water Levels for Scenario 2, Layer 2 22
L-23 .-CSimulated Water Levels for Scenario_2, Layer 3 22
L-24 - .- ._ Simulated Water Levels for Scenario 2, Layer 4 22
L-25 Simulated Water Levels for Scenario 3, Layer 1 23
Section: Appendix L-TOC .:_ .""Page: iv of ivDate: July 1,1996 . - - . . . RevisionNo.: 0_
L-26 Simulated Water Levels for Scenario 3, Layer 2 23
L-27 Simulated Water Levels for Scenario 3, Layer 3 23
L-28 Simulated Water Levels for Scenario 3, Layer 4 23
Section: AppendixL,! . "... . .._.._. " .. .. --Page: _ 1 of 25
Date:. . July 1,199.6 -T" "-"-"- "- " ' -" "-- • "'~" . ..-RevisionNo.:" 0
L.O GROUND WATER FLOWWODJgLING
L.1 - INTRODUCTION ................ _
The Ground Water Flow Modeling was a part of the Supplemental Studies_Investigation (SSI) conducted at the Middletown Airfield NPL Site,Pennsylvania. In accordance with the April 1992 Explanation ofSignificant Differences (ESD), the SSI at the .jVfiddletpwn Airfield NPL Site,Pennsylvania was to include:
• an assessment of the impact of contaminated soils on ground waterbased on vadose leaching modeling, and
• evaluation of the future timing, location, and rates of contaminantmovement based on ground water flow and transport modeling.
Comparisoffof constSuent concentrations in soiTsamples againstscreening criteria specified by the Environmental Protection Agency (EPA)and the Pennsylvania Department of Environmental Protection (PADEP)did not identify specific source areas that would impact ground water.Since no "contaminant source areas were defined, vadose zone modelingand. contaminant transport modeling were not warranted. However, 3-dimensional ground water flow modeling was performed-to evaluateseveral pumping scenarios and determine the reconfiguration of theHarrisburg International Airport (HIA) production well rates. This workwas conducted under Contract Number DACW 45-93-D-0017, DeliveryOrder Number 009. _ ._..." ._ : r " ..:.'. _
THE ERM GROUP . . L; .. MIDDLETOWN ITS. L-JULY 1,1996
Section: Appendix L2 .__ : Page: 2 of 25Date; July 1,1996 ~~ ~ ; Revision No- _ Q
1.2 MODELING OBJECTIVES
The objectives of the ground water flow modeling were to:* develop a 3-dimensional model to simulate ground water flow in the
area of the HIA and the North Base Landfill;* to determine if the current HIA pumping configuration was
effectively capturing the impacted ground water beneath the airport;and
• evaluate alternative HIA pumping scenarios to contain thejmpactedground water.
Previous studies and recent site information were taken intoconsideration. The modeling results were evaluated to provide arecommendation of how to reconfigure the current HIA well operatingscheme to maximize plume containment, or a justification describing whyreconfiguration is not necessary.
THE ERM CROUP MIDDLETOWN-FFS,L.-JULY 1,1996
Section:. _.._. L Appendix L.3 .; ' - ''/"VV " !/.= :...I. J- "_ ."...IlL-.. -.- -. "I """ - ---" .", ^ -. ... Page: 3of25"Date: -- July 1,1996 " " " """" ~ " RevisionNo.: 0
L.3 SCOPE OF WORK -
Numerical modeling was used to evaluate reconfiguration of the HIAproduction wells, considering only ground water flow and the presentcontaminant plume location. The modeling approach consisted of severaltasks: - - - ~-~r., • • • =. .
• Review and evaluation of existing hydrogeologic data;
• Develop a conceptual model of the site ground water flow regime;• Ground Water Flow Modeling, including:
creation of a 3-dimensional numerical flow model to evaluateground water flow patterns,
calibration and validation of the flow model;
simulations of HIA production wells;
simulation of the alternative reconfiguration of HIA productionwells; and ———
• Reporting.
THE ERM GROUP " MIDDLETOWN JFS.L.-JULY 1,1996
Section: Appendix L.4 .Page: 4 of 25Date: July 1,1996 7 _ ..." _ - - -Revision No.: 0
1.4 MODEL SELECTION
ERM applied the USGS's Three Dimensional Modular Ground Water FlowModel (kODFLOW) developed by McDonald and Harbaugh (1988)/MODFLOW is a well documented, tested, and accepted program. Theexecution of numerical modeling efforts is enhanced through the use ofGround wa'ter Modeling System (GMS),_a_pre- and post-processor,developed by the Department of Defenselh conjunction with BrighamYoung University. The 3-D numerical ground water flow modelexpanded on the 2-D analytical element modeling performed during thecapture zone analysis.
THE ERM GROUP MIDDLETOV J.FFS.L.-]ULY 1,1996
Section: " Appendix L.5~ _..'-.. - ._..",.„-„. . ... ----- ............ -- Page:' 5 oF25Date: July 1,1996_J ."'"" . "••"_; ."""'"'..: -';;" "- ~' . "~ """"RevisionNo.: -0
L.5 -REVIEW AND EVALUATION OF EXISTING DATA
The hydrogeologic data collected to date was incorporated into anevaluation of the site hydrogeology. The boundary conditions andaquifer parameters determined from the capture zone tests and analysis,performed as part of the SSI, were incorporated into the development ofthe numerical model. The results o£ the capture zone tests and analysisare detailed in Appendix K. -
A ground water contour map developed from the water levelmeasurements collected in May 1995, prior to the site-wide samplingevent, was used to represent current conditions (Appendix C, Plate 8)..
L.5.1 ..-Geology _ ________ _ __.....
The Site and the surrounding area are underlain by a complex sequence ofinterbedded sedimentary roclss known as the Gettysburg Formation of theTriasslc Age Newark Group. Wood (1980) has mapped the Site and itsvicinity as underlain by "red and maroon, micaceous and silty mudstonesand shales, locally calcareous and some thin red siltstone to very finesandstone interbeds." To-±he northeast of the Site in the Meade HeightsArea and beyond, the Gettysburg Formation consists primarily ofsandstone units. The strike of bedding ranges from N5°E to N65°E withan average strike of N43°E. The dip of bedding is" to the northwestranging from 19& to 3.8° with an average dip of 26°NW. The bedrock maybe extensively fractured and jointed locally, but no faults have beenmapped in the immediate vicinity of the site. Over most of the Site, the. Geftysburg_Forma~tiqn is overlain by Quaternary Age alluvium(unconsolidated silts, sands and gravels) and by anthropogenic fillmaterial. The bedrock is moderately to extensively weathered near itsinterface with the overlying alluvium and fill.
Ground water at the .Site occurs under unconfined (water table) conditionswithin the alluvium and the weathered upper zone of the GettysburgFormation. The water table aquifer extends to a depth of about 40 feet atthe HIA and to a depth of about 20 feet in the North Base Landfill Area.The confined ground water system in the Gettysburg Formation consistsof a series of stacked aquifers that generally dip 26°NW and which extenddowndip from a few hundred feet to as much as 3,000 feet below landsurface. The aquifers are fractured parallel to the strike of bedding,allowing for a preferential flow of water parallel to strike.
THE ERM GROUP MIDDLETOWN.FFS.L.-JULY 1,1996
Section: Appendix L5 _ ..?age: 6 of 25Date: July 1, 1996 . / . " Revision No.: 0
For the purposes of modeling, the Site geology may be divided into four _broad categories: unconsolidated overburden, shallow weatheredbedrock, intermediate and deep fractured bedrock. A more detaileddiscussion of the Site's geology is provided in Section 2,33 of the FocusedFeasibility Study Report.
L.5.2 Water Balance
In order to define the model it was necessary to evaluate the rate at whichground water is recharged by precipitation infiltration and the _relationship between streams and ground water. As will be shown duringthe discussion of model calibration and sensitivity, the calibration of themodel is highly dependent upon the rate of infiltration. .
On an annual basis the total stream discharge within a drainage basin isequal to the total precipitation infiltration plus surface runoff. Over a longterm, inputs to the regional hydrologic system are balanced by outputs.An annual water balance is generally expressed as:
where:P = annual precipitation (inches/year)I = annual infiltration (inches/year) _.. _R = surface runoff (inches /year)ET = evaporation and plant transpiration (inches/year)
The annual average precipitation, P, for the Middletown area isapproximately 44 inches per year (Chow, 1964). Normal annual runoff forthe region is approximately 20 inches per yearXLinsley, 1979). The annualaverage evapotranspiration, ET, was estimated from climatological data tobe approximately 12 inches per year (Linsley, 1979). Based on a regionalwater balance, the annual average infiltration rate is approximately 12inches per year. The reasonable range of the annual infiltration rate wasdetermined to be 6 to 18 inches per year, roughly 50% above or below theestimated average value. The regional modeling made the assumptionthat recharge was uniformly distributed.
t.5.3 Aquifer QiaracteristicsMeisler and Longwill (1961) reported the results of aquifer testsperformed in 1959 at the Olmsted Air Force Base, Middletown,Pennsylvania. The wells tested include Da-78 in the North Base Landfill
THE ERM GROUP MTDDLETOWN.FF3.L.-JULY 1,1996
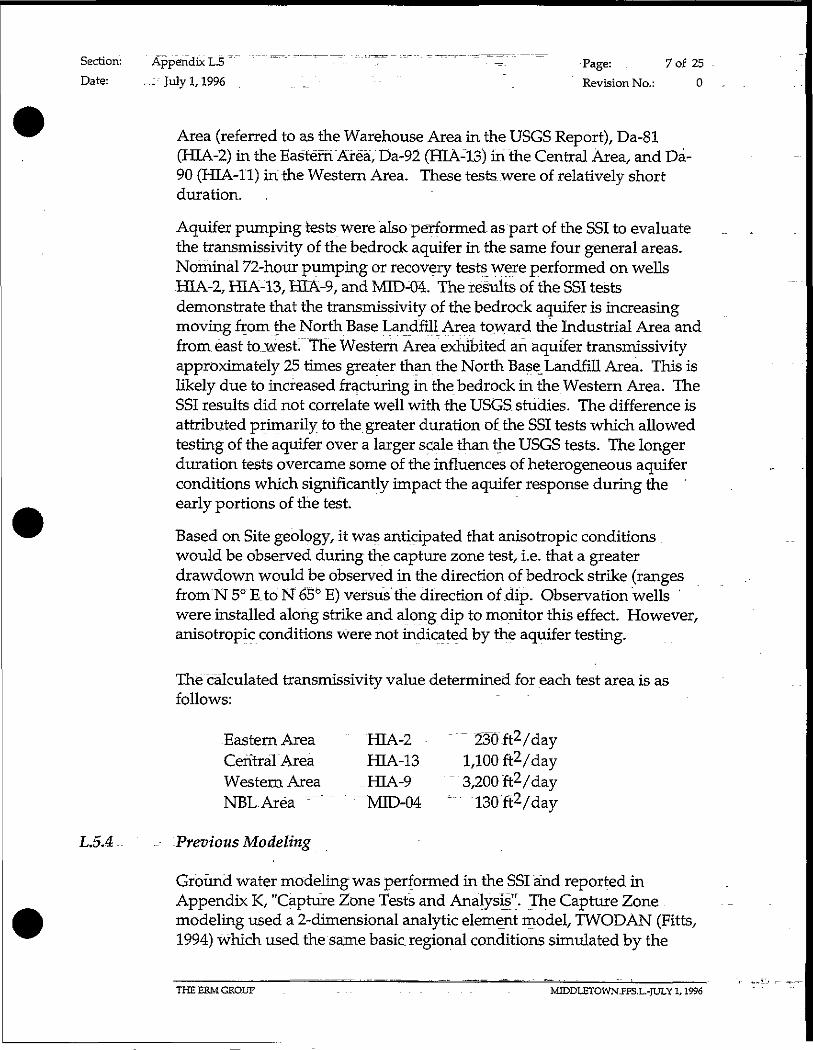
Section: AppendixL.5 """ """ " " " " """ .- '"" " "~" " —.'~ ' Page: 7of 25Date: ,.: July 1,1996 . _;_ "_ RevisionNo.: 0
Area (referred to as the Warehouse Area in the USGS Report), Da-81(HIA-2) in the Eastern Area, Da-92 (HIA-13) in the Central Area, and Da-90 (HLA-11) in the Western Area. These tests were of relatively shortduration.
Aquifer pumping tests were also performed as part of the SSI to evaluatethe transmissivity of the bedrock aquifer in the same four general areas.Nominal 72-hour pumping or recovery tests were performed on wellsHIA-2, fflA-13, HIA-9, and MID-04. The results of the SSI testsdemonstrate that the transmissivity of the bedrock aquifer is increasingmoving from the North Base Landfill Area toward the Industrial Area andfrom east to._west. The Western Area exhibited an aquifer transmissivityapproximately 25 times greater than the North Base Landfill Area. This islikely due to increased fracturing inthebedrock in the Western Area. TheSSI results did not correlate well with the USGS studies. The difference isattributed primarily to the greater duration of. the SSI tests which allowedtesting of the aquifer over a larger scale than the USGS tests. The longerduration tests overcame some of the influences of heterogeneous aquiferconditions which significantly impact the aquifer response during theearly portions of the test.
Based on Site geology, it was anticipated that anisotropic conditionswould be observed during the capture zone test, i.e. that a greaterdrawdown would be observed in the direction of bedrock strike (rangesfromN5°E_toJSf656E) versus the direction of .dip. Observation wellswere installed along strike and along dip to monitor this effect. However,anisotropic conditions were not indicated by the aquifer testing.
The calculated transmissivity value determined for each test area is asfollows:
Eastern Area HIA-2 " " 230-ft2/dayCentral Area fflA-13 1,100 ft2/dayWestern Area . fflA-9 " 3,200 ft2/dayNBLArea --~'~ "MID-04 ^ 130 /day
L.5,4 -Previous Modeling
Ground water modeling was performed in the SSI and reported inAppendix K, "Capture Zone Tests and Analysis". The Capture Zonemodeling used a 2-dimensional analytic element model, TWODAN (Fitts,1994) which used the same basic regional conditions simulated by the
THE ERM GROUP . ... ... ... MIDDLETOWN.FF3.L.-JULY 1,1996
Section: Appendix l~5 - . ...Page: " 8 of 25Date: -= July 1,1996 J "RevisionNo.: 0
MODFLOW Model. The TWODAN model provided an excellentreference and starting point for the 3-D MODFLOW model discussedherein.
THE ERM GROUP MTDDLETOWN.FP3.L.-JULY 1,1996
Section: Appendix L.6 . . _ _ . . . _ . _ _ . . . _ . _ . .... Page: 9 of 25Date: 7 July 1,1~996 " _" " " =~. '--"-—— - - - - ————— - -Revision No~ . 0
L.6 CONCEPTUAL MODEL _ _ _ ._. ._.,..
The model configuration is a 3-dimensional model that represents the Siteas~a porous medium even though there appears" to be some fracture flowof ground water. The conceptual 2-D analytic element model presented inthe Capture Zone Analysis was expanded to 3-D to incorporate the areageology (in cross sections), the aquifer bottom elevations, aquiferboundaries, and production well locations*. This 3-Djnodel is the basis fordefinition of the hydrogeologic conditions for the computer model input.
The characterization of the aquifer included potential ground waterdischarge to streams and an estimatedjrate of precipitation recharge to theaquifer. The conceptual model was constructed using regional and site-specific geologic information, on-site monitoring well data, productionwell data, regional climatic information, and stream elevation data fromUSGS topographic maps. The thirteen HIA production wells and fiveMiddletown Borough production wells are located within the model area.
The conceptual model for the regional aquifer that surrounds theMiddletown Airfield was based on the following:
1. Based on published geologic data, the regional aquifer (Gettysburgformation) within the modeled area was developed under a similargeological setting and experienced similar weathering and erosionconditions. As a result, the aquifer has generally similar hydrauliccharacteristics on the regional scale. However, the area along theSusquehanna River exhibits higher aquifer transmissivity thanobserved in the upland areas of the model based on the capture zonetests performed as part of the SSL "Therefore the transmissivity of theaquifer varies across the modeled area, from the highly conductivezone along the Susquehanna River, near wells HLA-9 and HIA-13, tothe less conductive upland area, near MID-04.
3. . The area geology (in cross sections), the aquifer bottom elevations,aquifer boundaries, and production well locations provided the basisfor definition of the 3-DJhydrogeologic conditions for the computermodel input. The .3-D model is divided into 4 layers, representing theoverburden; shallow bedrock, intermediate bedrock, and deepbedrock intervals.
4, . -The predominant source of ground water is infiltration fromprecipitation. Ground water generally flows toward surface waterbodies, such as streams, ponds, and rivers, which have measurable
THE ERM GROUP MIDDLETOWN-FFSJL.-JULY 1,1996
Section; Appendix L,6 ..Page; 10 of 25Date: July I,1996 -Revision No.: 0
surface water elevations. On the regional scale, it is reasonable toassume that the infiltration rate is relatively uniform~bver the entirearea.
5. The capture zone tests conducted at the Middletown Airfield foundthe aquifer is relatively isotropic, i.e. aquifer transmissivity isconsistent in different orientations. ~
The model was calibrated to water level conditions and actual pumpingconfiguration observed on 8 May 1995. -The model scenarios were basedon the annual average conditions, and all input parameters and outputresults represent annual average values.
THE ERM GROUP" ~ MTODLETOWN.FF3.L.-JULY 1,199~6
Section: Appendix L.7 . - Page: " ' 11 of 25Date: . -July 1,1996" " """ _ .=.---— ... .-.-.=_ -- — ^ - - - - - "RevisionNo.: 0
L.7 MODEL SETUP AND INPUT PARAMETERS
L.7.1 Modeled Area
The MODFLOW model was developed as a regional ground water flowmodel. Regional modeling simulates an entire ground water drainagebasin and incorporates natural aquifer boundaries. Modeling on aregional scale simulates a much larger area than the area of interest andresults in a model with many more model cells than a model limited to thearea of interest. However, the regional model provides a more realisticdescription of the aquifer, avoiding artificial model boundaries. Theregional model is very sensitive to changes in aquifer properties andeliminates the possibility of significant errors in the calibration of regionalaquifer transmissivity. By comparison, models of limited areas withartificial boundaries will allow calibration of a model with grosslyunrealistic aquifer properties by allowing the boundaries to drive thecalibration. These limited area models are generally not sensitive tochanges in aquifer conductivity or areal recharge rates.
The MODFLOW model grid for the Middletown Airfield Siteincorporates an area of approximately 17 square miles. The modelgrid was oriented in the direction of geologic strike and dip. Thisorientation provided the ability to incorporate anisotropic effectsinto the model. However, as anisotropy was not observed in theaquifer pumping tests, no anisotropy was incorporated into thefinal model.
Plate L;i and Figure L-l present the MODFLOW model grid. Themodel grid was constructed using the adaptive grid module ofGMS. The grid cells are centered on the well, coordinates with aminimum cell size of 20 feet, a bias of 1.4, and a maximum celldimension of lOOO'feet. The resulting grid is 84 rows by 93columns. The site "area including the North Base Landfill Area andthe Industrial Area covers about 5.4 square miles.
L.7.2 - --Vertical Division of the Model Grid
The MODFLOW model was divided into four vertical layerscorresponding to the overburden, shallow bedrock., intermediatebedrock, and deep bedrock intervals. The layers proceed from top
THE ERM GROUP MIDDLETOWNJTS.L.rIULY 1,1996
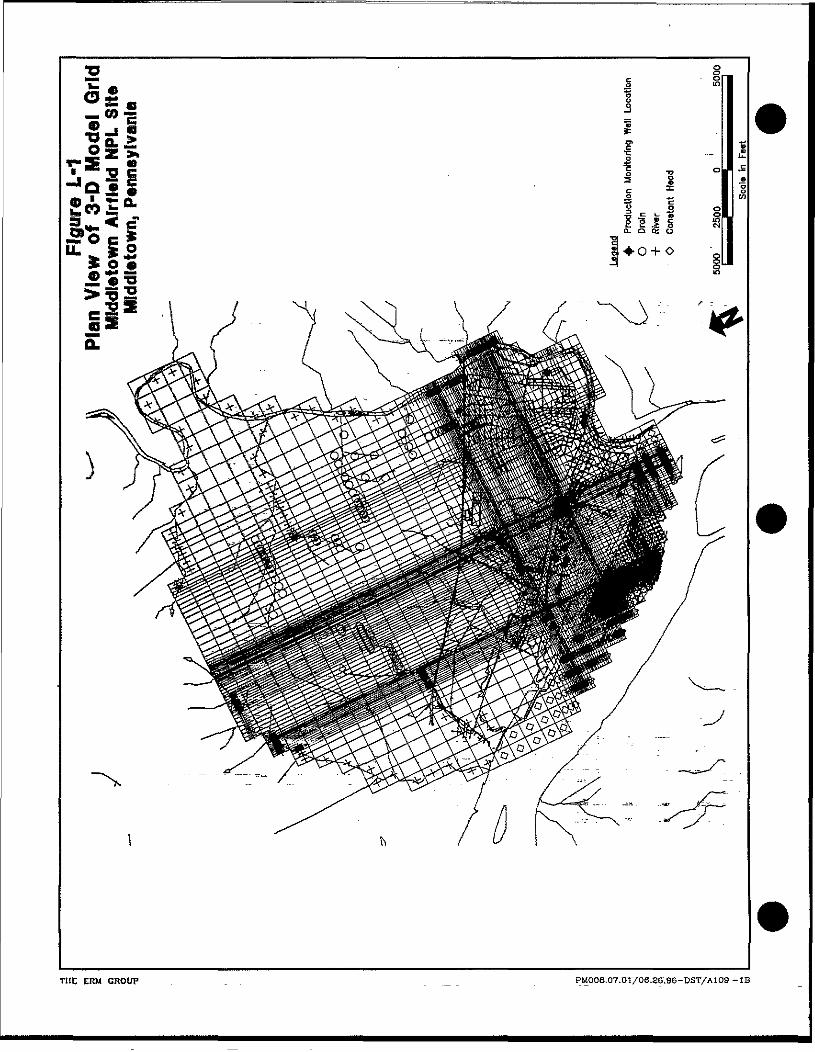
THE ERM GROUT . _ . PMOOB.07.cn/06.36.96-DST/A109 -IB
Section: Appendix L.7 - Page: 12 of 25Date: July. 1,1996. .;"..__' . 'T "..;_""'--'™'" '" ." "T"! -'"". 1"M"'::'";_"~ ""-" """ "Revision No.: 0
(Layer 1) fo bottom (Layer.4}, as shown in Figure L-2. Layer 1 isunconfined and generally represents the overburden. Thetransmissivity of the layer is dependent on the saturated thicknessof the layer. Layers 2 through 4 are confined. The transmissivityin these layers is independent of the water level in the aquifer.
Figure L-2 presents the vertical division of the aquifer relative todepth. The bedrock aquifer was divided vertically into threehorizontal layers on the basis of the open intervals of theproduction wells. The shallow bedrock was assigned a thicknessof 80 feet. The intermediate bedrock layer was assigned athickness of 400 feet, which corresponds to the average openinterval of the, production wells. The deep bedrock layer wasassigned a thickness of 180-feet. It should be recognized that,other than the bottom depth of the overburden/shallow aquifer,these depth divisions are not input to the model for Layers 2,3, or4. These layers are described to the model by their transmissivity,the product of hydraulic conductivity and layer thickness,
To begin the model, the transmissiyity values determined from the SSICapture Zone pumping tests.; which represent the total bedrock aquiferTbedrock, were used. The transmissivities of Layers 2 through 4 wereassumed to contribute to the total aquifer transmissivity proportional tothe defined layer thickness, i.e. that the hydraulic conductivity of eachlayer was identical. Thus, the following relationship was defined:
Tbedrock = T2 + TS + T4 (L.7.2.1)
where: Tbedrock => total transmissivity of the bedrock aquiferT2, TS, T4 => transmissivity of layers 2,3, & 4, respectively.
The transmissivity of a layer is given by:Ti = Ki*bi (L.7.2.2)
where Ki~= layer hydraulic conductivity, andbi = layer thickness.
Then the transmissivity of the bedrock aquifer can be written:
Tbedrock = Ki*b2 + Ks*b3 + K4*b4 (L.7.2.3)Assuming that K is uniform in all layers, Kbedrock/ then
THEERMGROUP ...... .. . . . . - - - - _.._._ . _ .. iWDDtETOWNJ?FS.L.-JULY I,1996
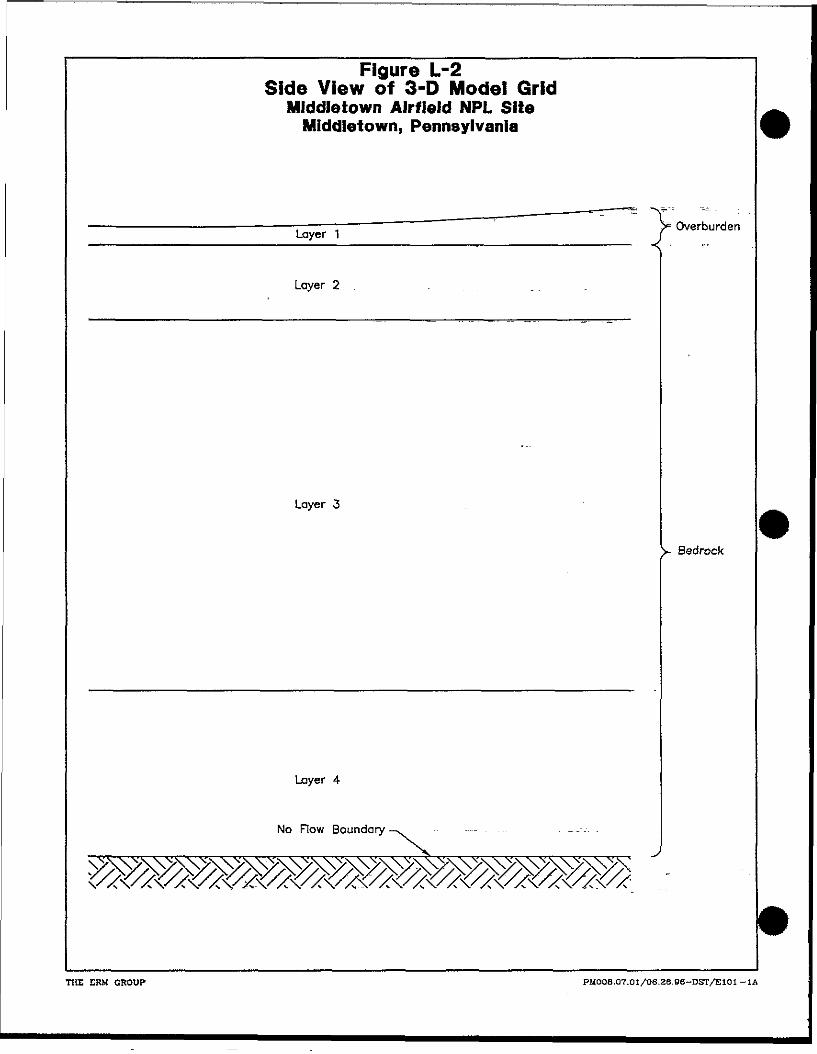
Figure L-2Side View of 3-D Model Grid
Middletown Airfield NPL SiteMiddletown, Pennsylvania
>^ OverburdenLayer 1 /
Layer 2
Layer 3
V Bedrock
Layer 4
No Flow Boundary
THE ERM CROUP PM008.Q7.01/06,2B.B6-DST/E10I-1A
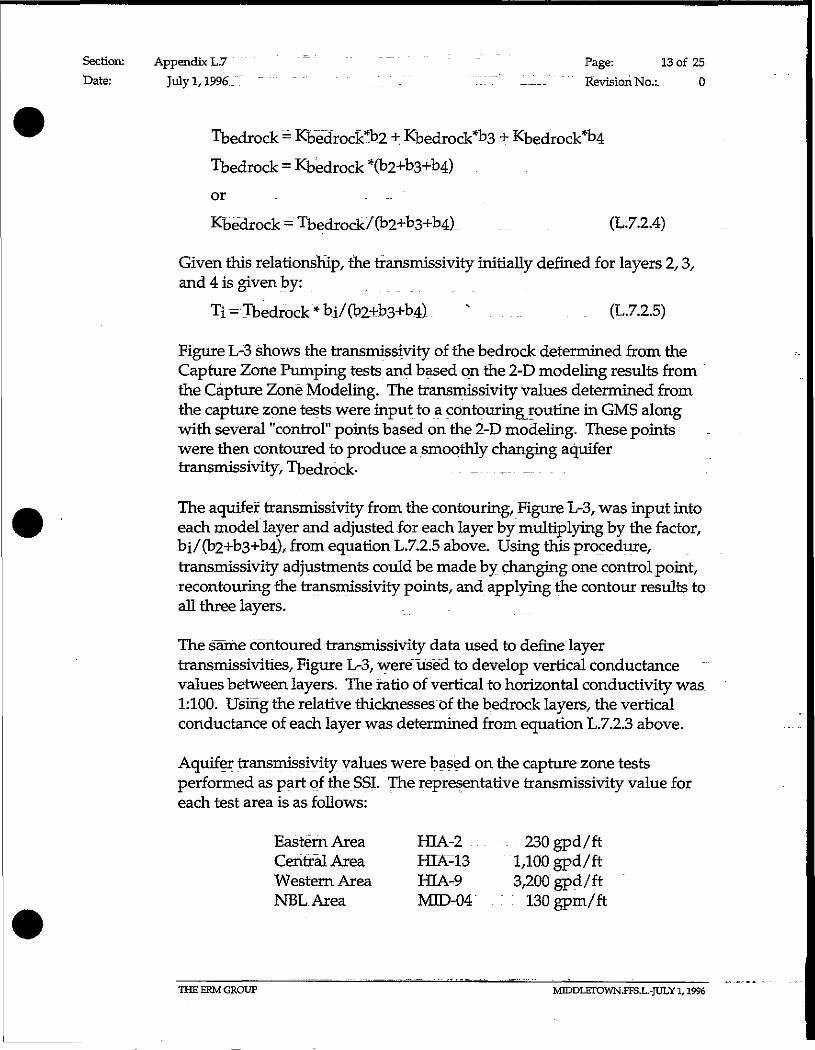
Section: Appendix L.7 """ " "" Page: 13 of 25Date: July 1,1996.. 7 _." .:: 1_....'._... _ ". ," :.:" __:__ Revision NO.L 0
Tbedrock = Kb~e<irock*b2 +. Kbedrock*b3 + Kbedrock*b4Tbedrock = Kbedrock *(b2+b3+b4)or
... . (L.7-2.4)
Given this relationship, the transmissivity initially defined for layers 2, 3,and 4 is given by:
Ti = Tbedrock *bi/(b2+b3+b_4) * . .... . . (L.7.2.5)
Figure L-3 shows the transmissivity of the bedrock determined from theCapture Zone Pumping tests and based on the 2-D modeling results fromthe Capture Zone Modeling. The transmissivity values determined fromthe capture zone tests were input to a contouring routine in GMS alongwith several "control" points based on the 2-D modeling. These pointswere then contoured to produce a smoothly changing aquifertransmissivity, Tbedrock- _..._._. _.
The aquifer transmissivity from the contouring, Figure L-3, was input intoeach model layer and adjusted .for each layer by multiplying by the factor,bi/(b2+b3+b4), from equation L.7,2.5 above. Using this procedure,transmissivity adjustments could be made by changing one control point,recontouring the transmissivity points, and applying the contour results toall three layers.
The same contoured transmissivity data used to define layertransmissivities.. Figure L-3, were used to develop vertical conductancevalues between layers. The ratio of vertical to horizontal conductivity was1:100. Using the relative thicknesses of the bedrock layers, the verticalconductance of each layer was determined from equation L.7.2.3 above.
Aquifer transmissivity values were based on the capture zone testsperformed as part of the SSI. The representative transmissivity value foreach test area is as follows:
Eastern Area HIA-2 -230 gpd/ftCentral Area HIA IS 1,100 gpd/ftWestern Area HIA-9 3,200"gpd/ftNBL Area MID-04 130gpm/ft
THE ERM GROUP MIDDLETOWN JTS.L.-JULY 1,1996
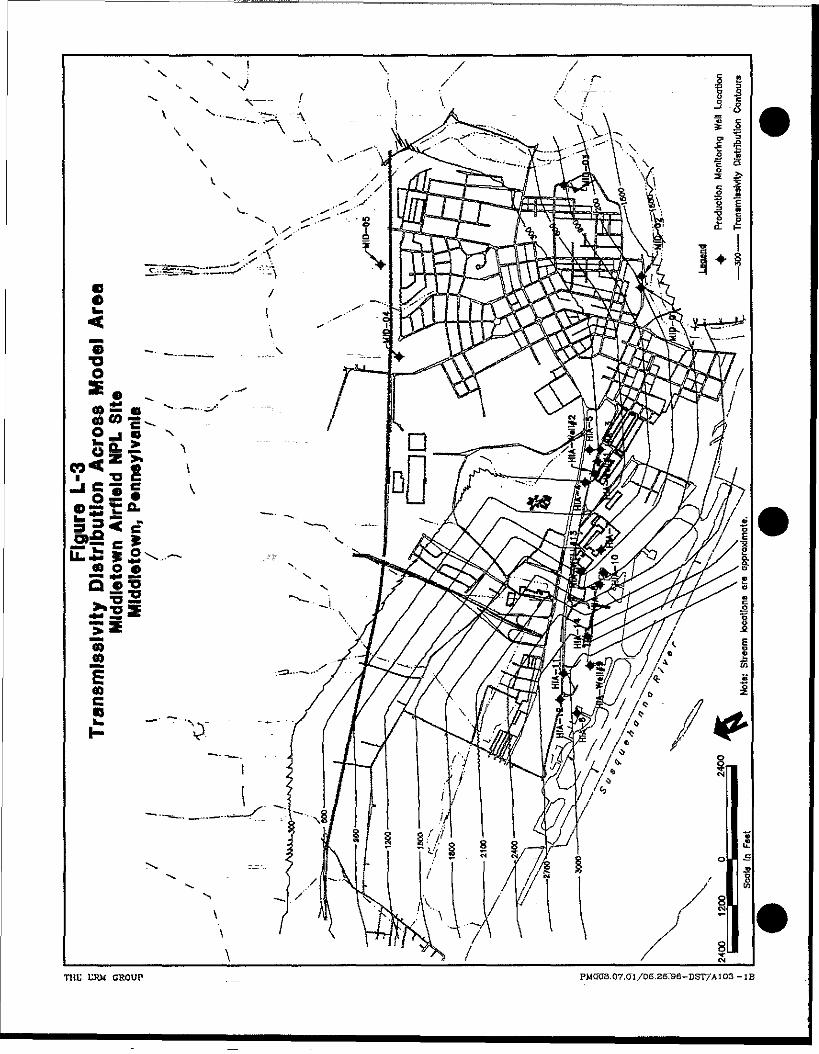
THL URW CROUP ..___ PMQ~CB.07,Cri/06.26:96-DST/M03 -IB
Section: Appendix L . 7 - - - - - - Page: 1 4 o f 2 5 "Date: July 1,1996 '.: t_. ;-..:. "'-".... .. -l"'.'-.._ '"'--.':"- :"I-~-- RevisionNo.: 0
L.7.3 Model Boundary Conditions
L.7.3.1 "".'. Layer 1StreamBoundaries
As discussed previously, a regional model was developed incorporatingonly natural aquifer boundaries. By simulating an entire ground waterdrainage basin, all ground water entered and left the model through Layer1, the overburden/shallow aquifer. Figure L-8 presents the entire modelgrid and the model boundary conditions in Layer 1.
Streams were simulated using one of three possible conditions:
_ • : Constant head: Only the Susquehanna River was simulated as aconstant head boundary (all at elevation 280.00 ft msl). This isequivalent to a MODFLOW River boundary as long as the groundwater level remains at or above the bottom of the river.
• River Cells: Perennial streams were simulated as river cells. Thesecells will contribute water to the aquifer in the case that the groundwater levels drop below the surface water elevation.
• Drain Cells: Intermittent streams are best simulated as drain cells asopposed to River cells. Should the ground water drop below thedrain elevation, the drain (stream) will go dry and will not contributewater to the aquifer.
Elevations of the stream cells in the model were determined from the1:24,000 scale USGS quadrangle map.
1.7.3.2 Layer 1 Areal Recharge
Precipitation recharge was applied uniformly across the model area at arate of 10 inches per year.
L.7.3.3 - -'Layers 2,3, and 4 Boundaries
Layers 2,3, and 4 have interlayer boundaries which communicate with theoverlying or underlying layer. The production wells are located in Layer -3. The bottom of Layer 4 is a no-flow boundary. The side boundaries ofthese deep layers are fixed as no-flow boundaries at the limits of the activemodel area. The active model area in Layers 2,3, and 4 is identical to theactive area of Layer 1.
THE ERM GROUP M3DDLETOWN.FFS.L.-JULY 1,1996
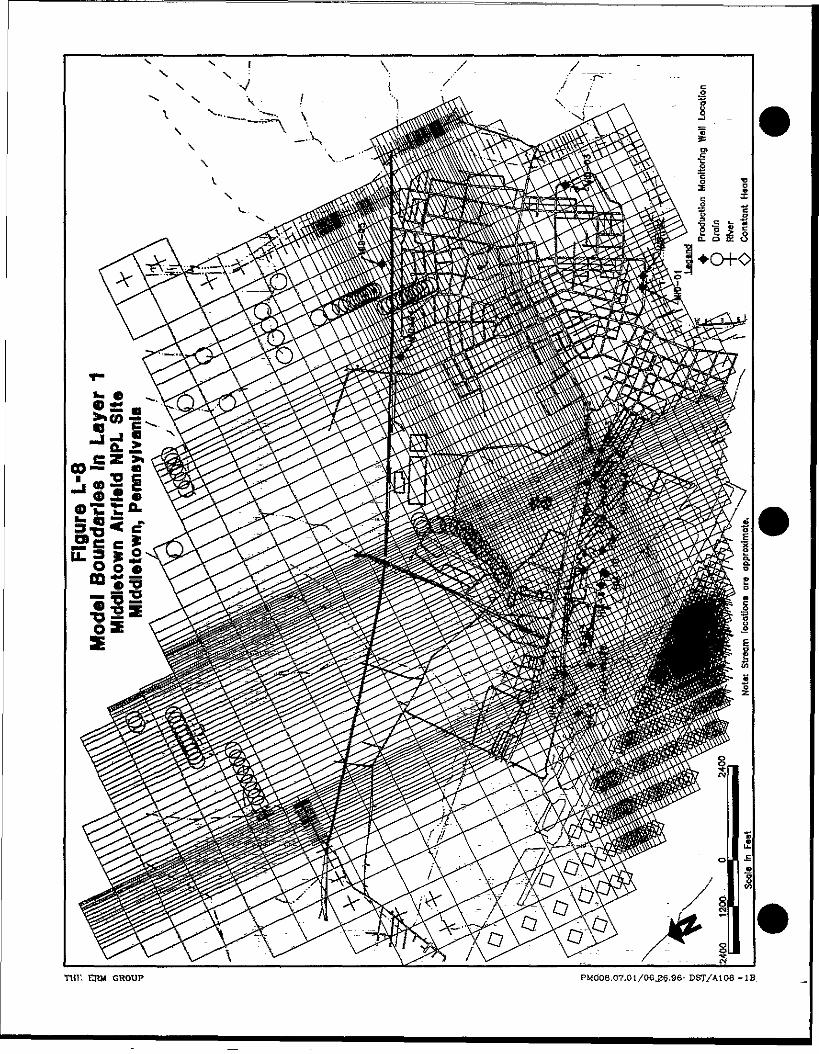
TUC ERM GROUP PMOOB.07.01/06,26.96-DST/AIOB-IB.
Section:. AppendixL.7 - - - ----- - — - - - - -- - . - . — - - Page: .ISof 25Date: July 1,1996 RevisionNo.: 0
L.7.3.4 - -Initial Conditions
The MODFLOW model was run in a steady-state simulation, which ismost appropriate for evaluating the long term hydraulic influence of theHIA production wells on containment of ground water contamination.The model was calibrated to water level conditions and the actualpumping configuration observed on 8 May 19-95. The model scenarioswere based on the annual average conditions, and all input parametersand output results represent annual average values.
Table L-l pres nts_ihe annual average pumping rates of the HIAproduction wells for 1990 through 1995. _Since the pumping configurationof the HLA production wells varies, the average over the 5 year period wasused as a representative annual average. The Middletown wells MID-01,MID-02, MID-03, MID-04, and MID-05 operate at relatively consistentrates. Therefore the pumping rates of the Middletown Borough wellswere based on the annual average rate in 1990 (GeoServices Ltd., 1992).
THE ERM GROUP MIDDLETOWN-FFS.L.-JULY 1,1996
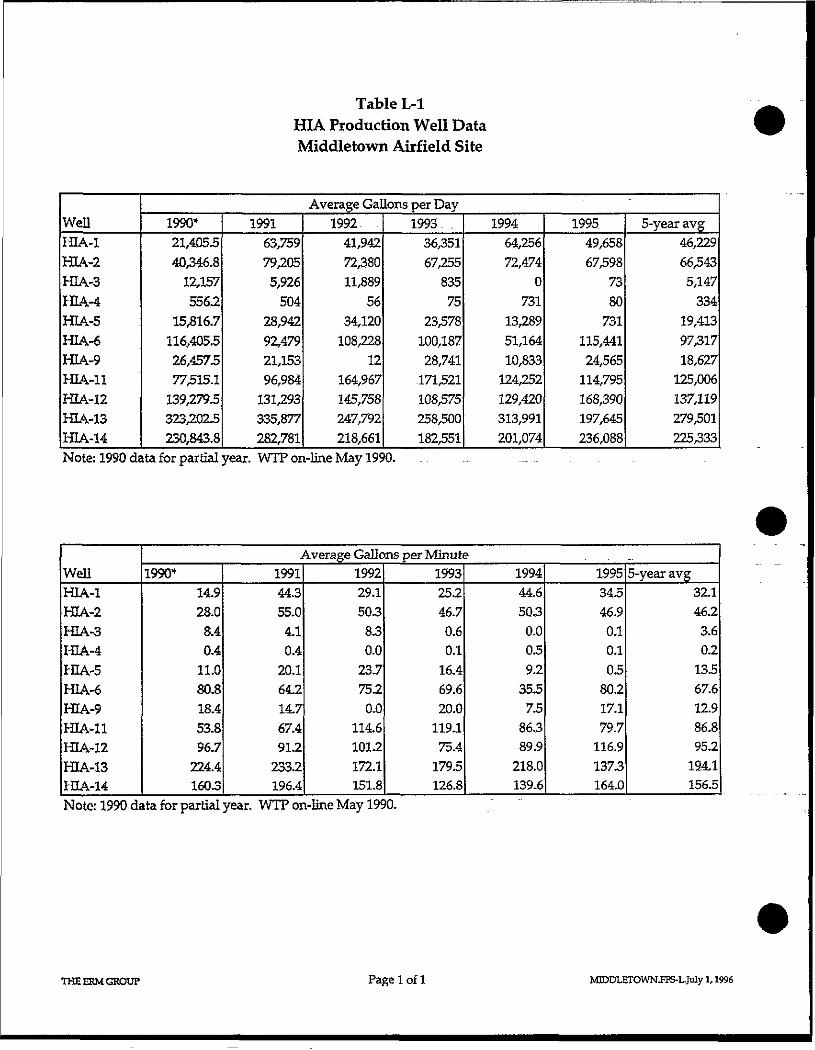
Table L-lHIA Production Well DataMiddletown Airfield Site
WellHIA-1HIA-2HIA-3HIA-4HIA-5HIA-6HIA-9HIA-11HIA-12HIA-13HIA-14
Average Gallons per Day1990*21.405.540,346.812.1573563.
15,816.7116,405526.457577.515.1139,2793323,2023230843.8
199163,75979,2055,926504
28.94292.47921,15396.984131,293335,877282,781
1992-41,94272,38011,889
5634,120108,228
12164,967145,758247,792218,661
1993-3635167,255
83575
23,578100,18728,741.171.521108,575258,500182.351
199464,25672,474
0731
13,28951,16410,833124,252129,420313,991201,074
1995.49,65867,598
7380731
115,44124,565114,795168,390197,645236,088
5-year avg46,22966,5435,147334
19,41397,31718,627125,006137,119279,501225,333
Note: 1990 data for partial year. WTP on-line May 1990.
WellHIA-1HIA-2HIA-3HIA-4HIA-5HIA-6HIA-9HIA-11HIA-12HIA-13HIA-14
Average Gallons per Minute . _1990*
14.928.08.40,411.080.818.453.896.7224.41603
199144.355.04.10.420.164.214.767.4913.233,2196.4
199229.1503830.023.775.20.0
1146101.2172.1151.8
199325.246.70.60.116.469.620.0119.175.41795126.8
199444.65030.0059.23537586.389.9218,0139.6
199534546.90.10.10580.217.179.7116.9137.3164.0
5-year avg32.146.23.60.213567.612.986.895.219-4,1156.5
Note: 1990 data for partial year. WTP on-line May 1990.
THE ERM GROUP Page 1 of 1 MIDDLETOWN JTS-L-July 1,1996

Section: Appendix L.8 . . Page: . 16 of 25Date: --July 1,1996 ..."'. _ " "... . , ..'_.' . '-. '." RevisionNo.: 0
L.8 MODEL CALIBRATION
L.8.1 Reference Water Levels and Well Pumping Rates
The model was calibrated to the water level conditions observed andpresented in the SSI. Ground water contour maps (Appendix C, Plates 7and 8) developed from the water level measurements collected in May1995, prior to the site-wide sampling event, were used to represent currentconditions in the overburden and bedrock aquifers. Model calibrationwas performed by adjusting the hydraulic parameters of the aquifer, suchas hydraulic conductivity, elevations of streams, stream bottomconductance, and recharge rate, in order to achieve a relative fit toobserved conditions. -
The calibrated model run included simulation of the pumping ofseveral HIA wells in accordance with the actual configuration ofthe HIA wells at the time of the observed water levels and all fiveof the-Middletown Borough wells.
The average pump rates of the HIA wells were based on recordsfrom the HIA Water Plant Daily Reports which records the totalpumpage, duration of pumping, and pump rate for eachproduction well (Table L-l). Since the HIA water system operates
"" on an "on demand" basis, the wells are continuously cycling onand off. The average daily pump rate used in the computer modelprovide a realistic withdrawal arnount, however^ the simulateddrawdown is somewhat less than observed from the fieldmeasurements.
The configuration of the HIA" wells during this time period is asfollows:
Operating Status Pump Rate . __. Avg. Daily Rate(May 8-9.1995)______(gpm)________(gpm*
Lead Well HIA-13 _ 423 -2432nd Lead HIA-1 .._.. _195 _ 107Lag Well fflA-6 562 ..._.. ,2822nd Lag^ ~ HIA-12 . M2 _- T "T"-. 41 :HVAC -HIA-14 385 _ 1" J ,185 ..
THE ERM GROUP . MTODLETOWNJFFS.L.-JULY 1,1996
Section: Appendix L3 Page: 17 of 25Date: July 1,1996 — ._ _ Revision No.: 0
Based on the consistency of operation of the Middletown Boroughwells, the annual average pump rates for MID-01 through MJTKJ5were used (Personal communication, Ken Klinepeter, Borough ofMiddletown). The annual average pump rates for the MiddletownBorough wells are as follows:
MID-01 _ — 295 gpmMID-02 214 gpmMID-03 67 gpmMID-04 --_... . _89gpm " ; ~"MID-05 ... 167 gpm
L.8.2 Calibration Performance
Comparison of the computer simulated water levels to the groundwater levels observed in May 1995 during the SSI, was performedfor both the overburden and intermediate layers. The differencebetween the observed and simulated ground water levels isknown as the residual. The residuals are a direct measure of themodel's ability to reproduce the observed hydraulic conditions,which is the goal of the model calibration. Transmissivity andvertical conductance parameters were adjusted until the residualor difference between the computer simulated and field measuredwater level elevations were within a reasonable range. Streambedand drain conductance values were set high such that these cellswere essentially constant head cells in Layer 1. . _ . . . "
The objective of calibrating the model is to reproduce the observedwater levels in the area of interest within an error of one typicalcontour interval. In the HIA area, the contour interval is typically2 feet. In the North Base area, the contour interval is typically 5feet, (See Appendix C, Plates 7 and 8, Focused Feasibility Report,which illustrate the potentiometric surface contours observed inthe overburden and bedrock aquifers on 8 May 1995). However,this goal must be tempered by the ability to achieve it in aheterogeneous aquifer system with wells of varying depths andvarying pumping rates. Many of the residuals fell within thecalibration target range. However, some of the residual values,especially in the North Base area, did not.
Figures L-4 through L-7 illustrate the simulated water levelcontours from the calibrated model run for layers 1 through 4,
THE ERM GROUP ~ MrorjLETOWNJFFS.L-.rULY 1,1996
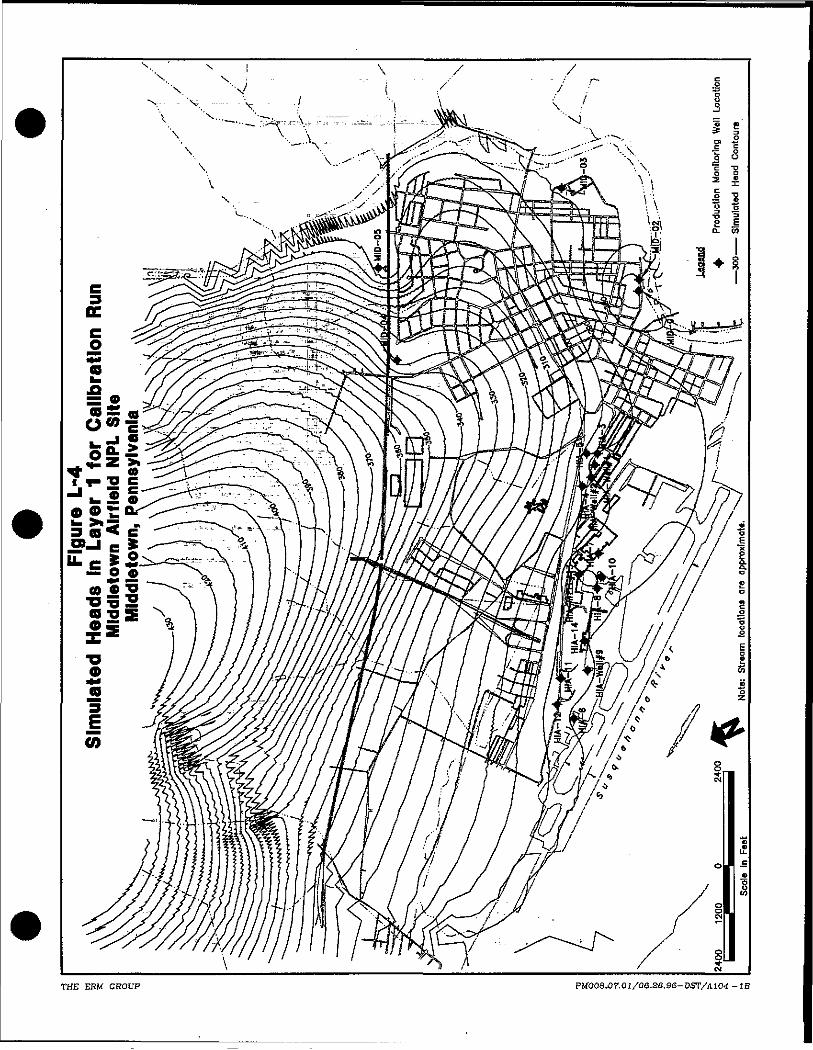
THE ERM GROUP PM008,07.01/06.26,96-DST/A104 -IB
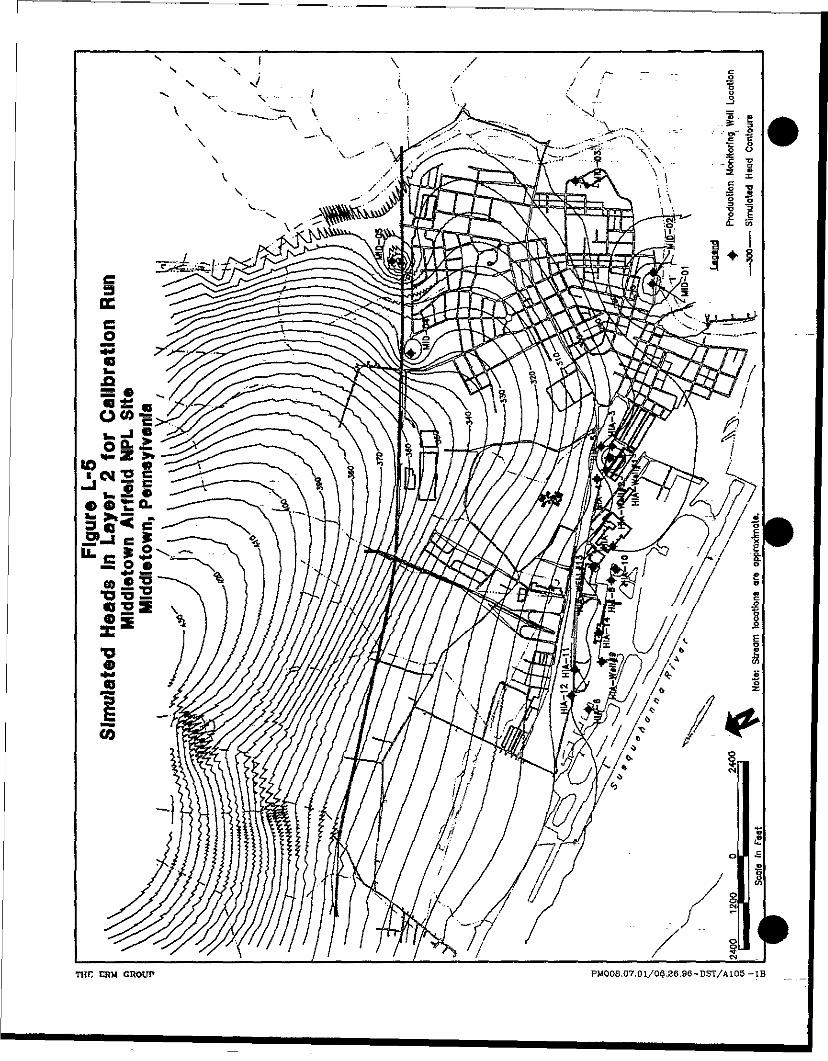
THE CRM GROUP PM008.07,01/06,26,96-DST/A105-IB
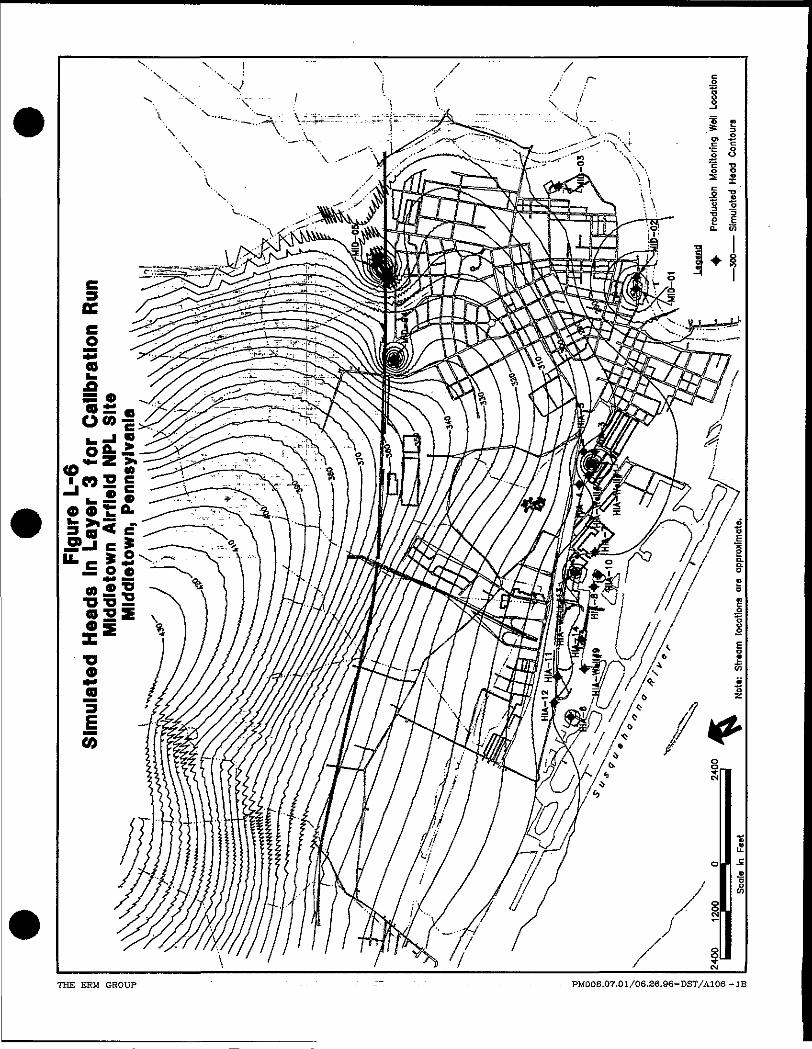
s J>
THE ERM GROUP ' - . • - - - . - PM008.07.01/06.26.96-DST/A106 -IB
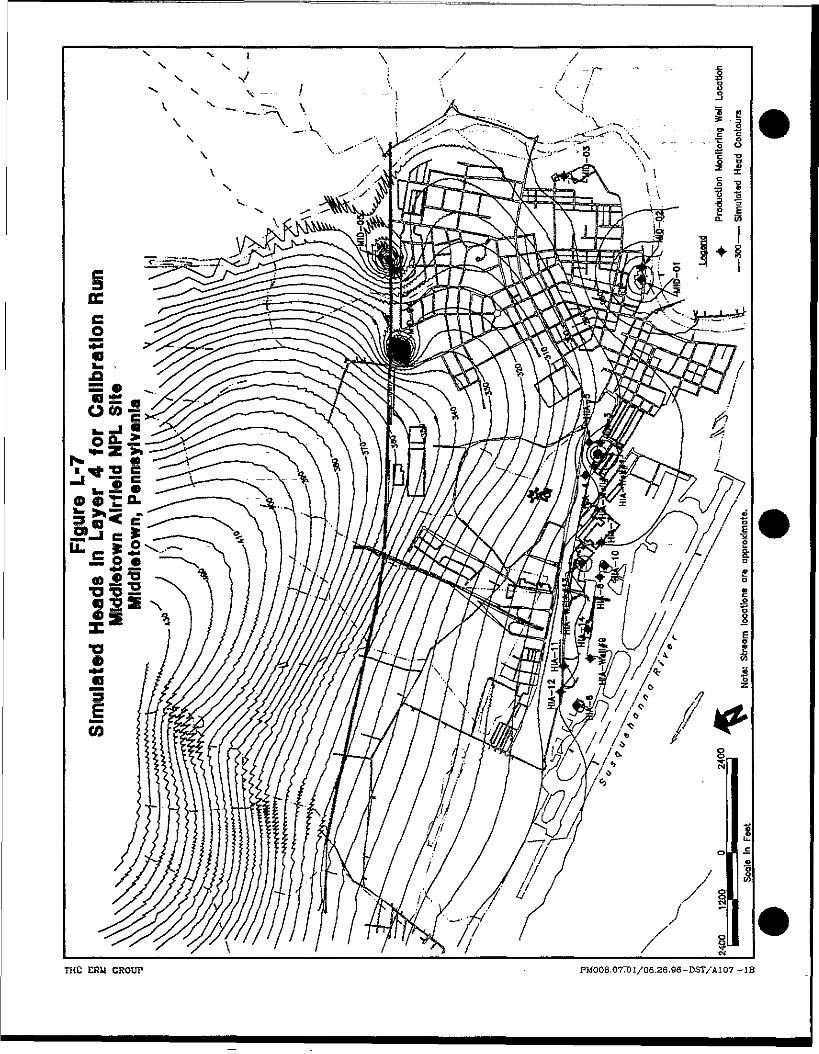
THE ERM CROUP - PMQ06.07701/06.26.96-DST/A107 -IB
Section: Appendix L.8 . , - . _ . . . . . - . Page: 18 of 25Date: July 1,1996" ^" " \ " -——— -- ---... RevisionNo.: Q
respectively. Figures L and L-10 present bar charts of theresiduals.from the final calibration run for the shallow andintermediate zones (Layer 1 and 2), respectively. The wells aregrouped such that the North Base Landfill wells are grouped alongthe left-hand side of the graph. Positive values indicate that theobserved water levels were higher than the simulated, levelsnegative values occur where the observed water levels were lowerthan the simulated levels. Figures L-ll arid L-12 present contoursof the residuals for Layers 1 and 2, respectively. The residuals inthe Industrial Area of the Site show a good match between thesimulated heads and the observed water levels. The modelsimulated heads in the NBL Area are lower than the observedwater levels.
The difficulties encountered in achieving residuals within thetarget of one contour interval is attributed to heterogeneousconditions within the aquifer, the "on-off' operation of the HIAproduction wells, and the presence of strong vertical gradients,especially in the NorthBase Landfill.Area.
THE ERM GROUP MDDDLETOWN JTS.L.-JULY 1,1996
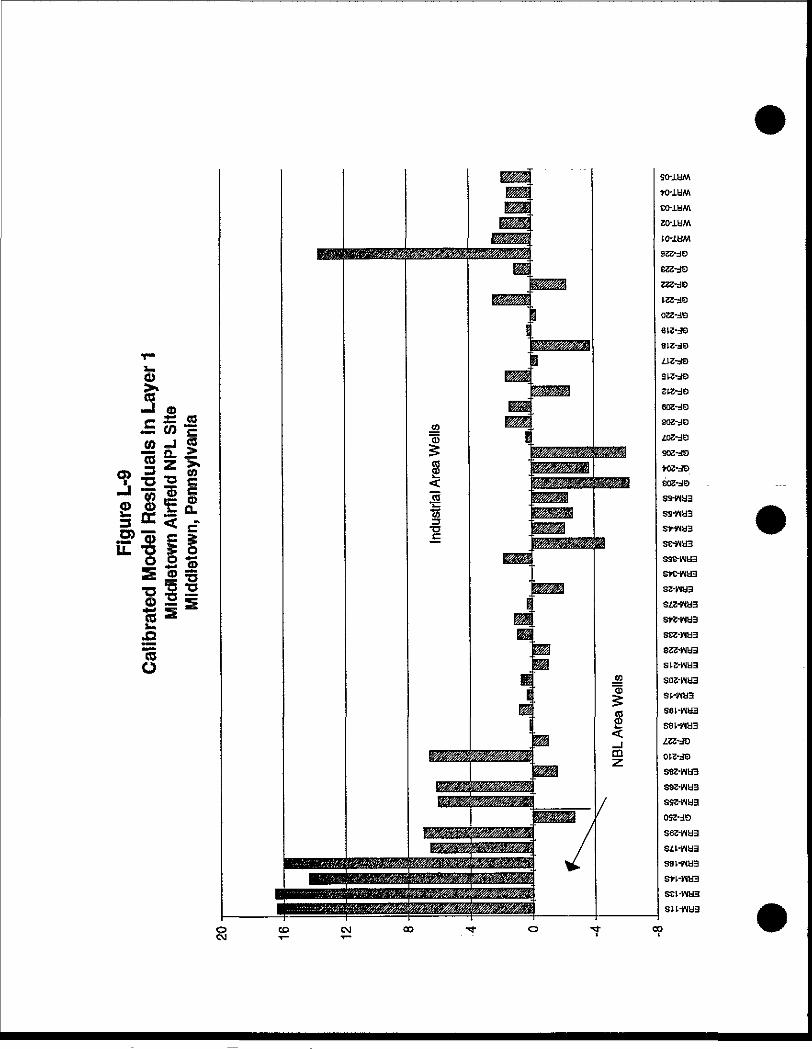
Q)
c 3s &••• rn 3
CO -J P—— Q. >
^ 2 2 i••*• __n O 5
® ® a!i ^ c"^"o s= 3U. T3 3 o02^S •o§2m S s1s£75O

CMv.O
^H! >B^M fmm•y >k0 3 S *T 'D 2 c-i « .2 S® «$ S Q-S E ' cD) o = 5ESHs « •052
cdO
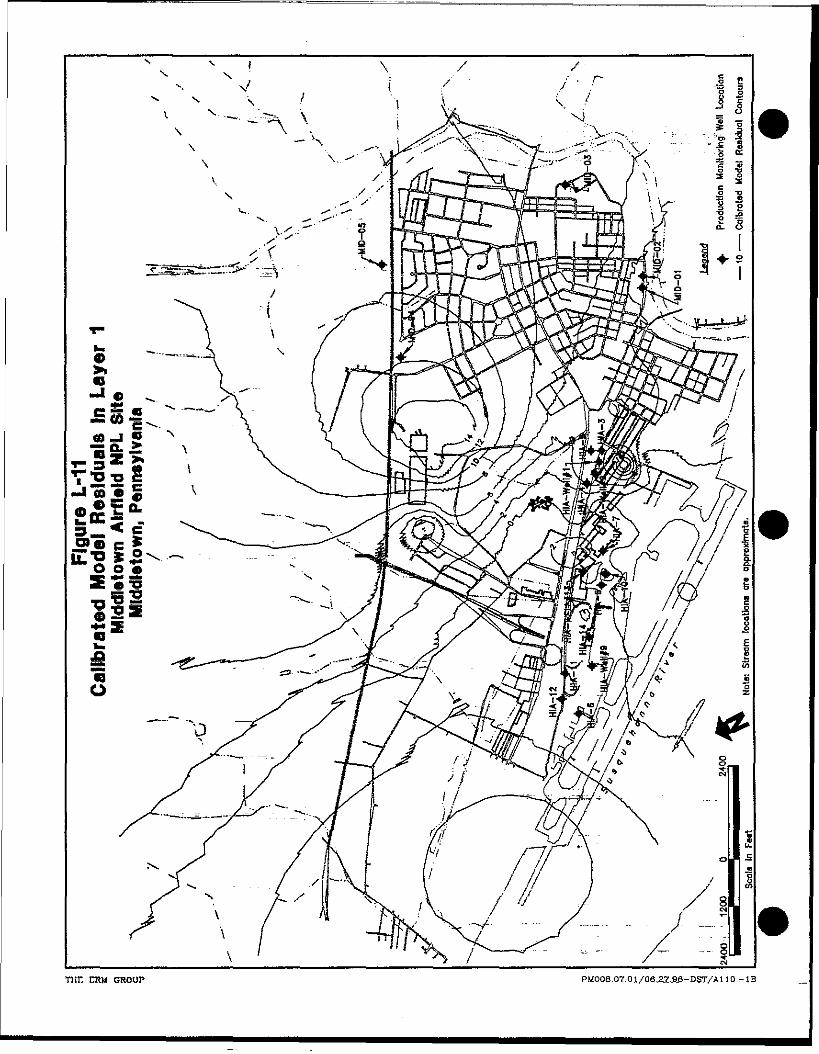
THE CRM GROUP PM008.07.01/06J2ZJi6-D5T/A110-IB
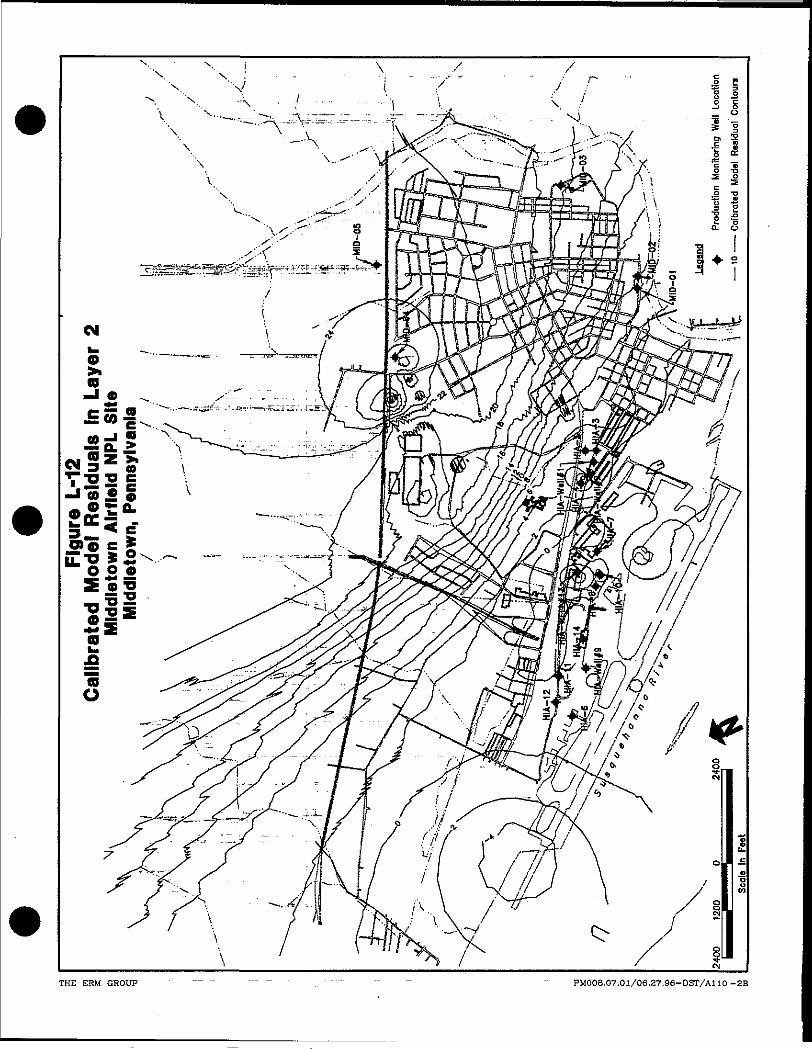
.2 E
THE ERM GROUP ~~ " - - - - - - - - - - - - - PM008.07.01/06.27.96-DST/A1IO -2B
Section: Appendix L.9 _ . . . _ _ . __Eage: 19 of 25Date; July 1,1996 Revision No.: 0
1.9 SENSITIVITY ANALYSIS
The next step was to perform a sensitivity analysis of the ground waterflow model by varying the model parameters and determining the impacton the model results. Model parameters evaluated in the sensitivityanalysis include hydraulic conductivity., vertical leakance between layers,and the regional infiltration rate. _ . . . .
L.9.1 --- Transmissivity and Areal Recharge
As discussed previously, the regional modeling approach produces a verysensitive model which results in a reliable calibration of regionaltransmissivity. Once calibration is achieved., if the aquifer hydraulicproperties and areal recharge values are is increased or decreased, suchthat the ratio of transmissivity to areal recharge rate is held constant., thenthe heads in the model will not change. However, changing either of theseparameters independently will result in a significant change in thesimulated water levels.
Figure L-13 illustrates the results of increasing or decreasingtransmissivity and areal recharge while maintaining a constant ratio oftransmissivity., (hydraulic conductivity in Layer 1 and vertical .conductance) to areal recharge. Three sets of model residuals (observedhead-simulated head) for the wells measured during the SSI are shown.One set represents a decrease in the aquifer hydraulic properties by afactor of 50% with a 50% decrease in areal recharge (i.e. the ratio oftransmissivity to areal recharge is held constant), one set of barsrepresents the calibrated model, and one set represents a 50% increase inthe aquifer hydraulic properties and areal recharge. As expected, thereare no significant differences between the three runs, as long as the __. _transmissivity to areal recharge ratio is held constant.
Because the aquifer heads are proportional to the ratio of transmissivity toareal recharge, only one of these values needs to be changed in a regionalmodel to test sensitivity to these variables. Because areal recharge is easilychanged, it was varied while the hydraulic properties of the aquiferremained fixed at the calibrated values.: Figure L-14 presents the residualsfor a 50% decrease and a 50% increase in the areal recharge compared tothe calibrated areal recharge in Layer 1. It can be seen that the model is
THE EKM GROUP MIDDLETOWN J?FS,I_-JULY 1,1996
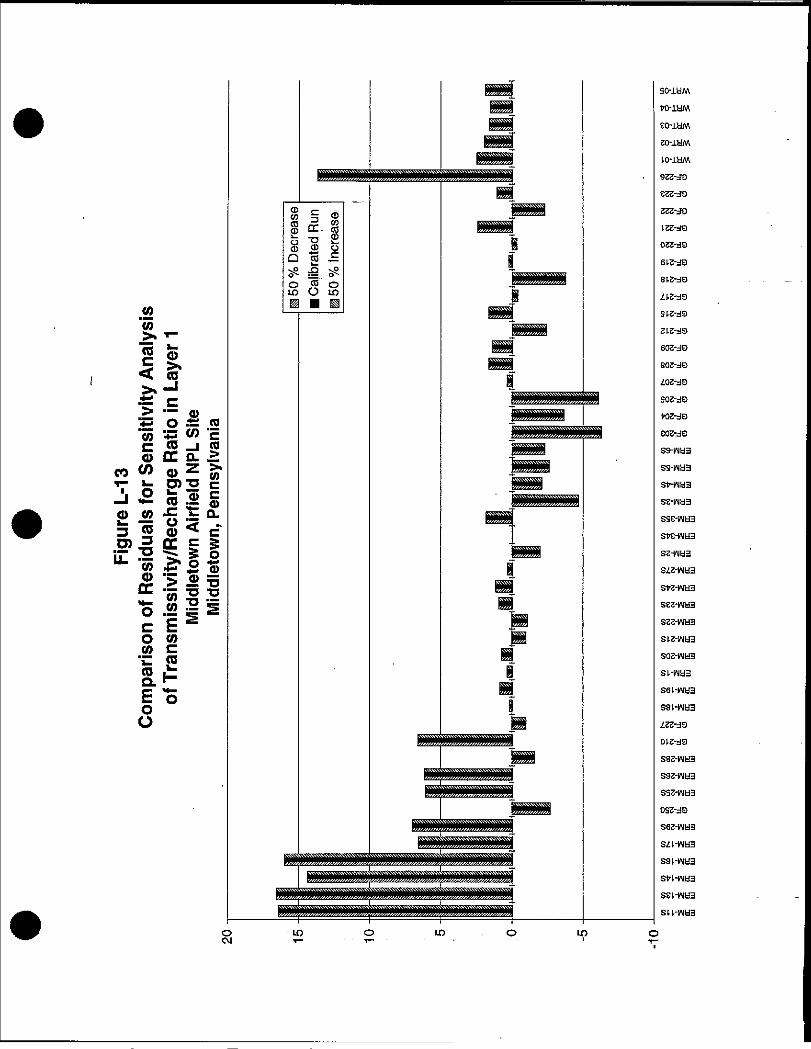
Figure L-1 3
Comparison
of Residuals fo
r Sensitivity A
nalysis
of Tr
ansmissivity/Recharge Ratio in Layer
1Middletown
Airfi
eld NPL
Site
Middletown, Pennsylvania
nn
<D i—w i 8® ir S(D tt C6C — <Dy H: >-® <D OQ g £5? rQ 5S0 <B 0in O ir>S3 • S3
kWVWWWWWVVW.VW.V
J'i
i
i
PMgJjJMBBS B
ihwMHffijgE
IiragESSj
3 LO O ID CJ T- ,_
iLm ^ k j AVAN
HMIHM
> u cT
SO-IHM
TO-1UM
EChlHM
20-1UM
tO-lUM
923-d3
£23-dS
sro-dct53-dO
OS3-dS
6l2-d9
B13-JO
UZ-dQ
StS-d9
2lS-dO
603-dO
BOS-dQ
i02-JS
SOS-d9
t03-dD
E03-dO
S9-HH3
ss-waast widass-waasse-wysswMrtjyssz-wuaSia-HUE
sta-wu3sez-waiszs-waasiz-wuaSOS-HU3
st-waasetsfliaaS8I--HU3
ZZ3-d3
OVS-dS
sas-wy3S92-HU3
SS3-MU3
os5-=raS62-HU3
SZI--HH3
S9L-Ha3
st-t-wasset-wasSH-WU3
3
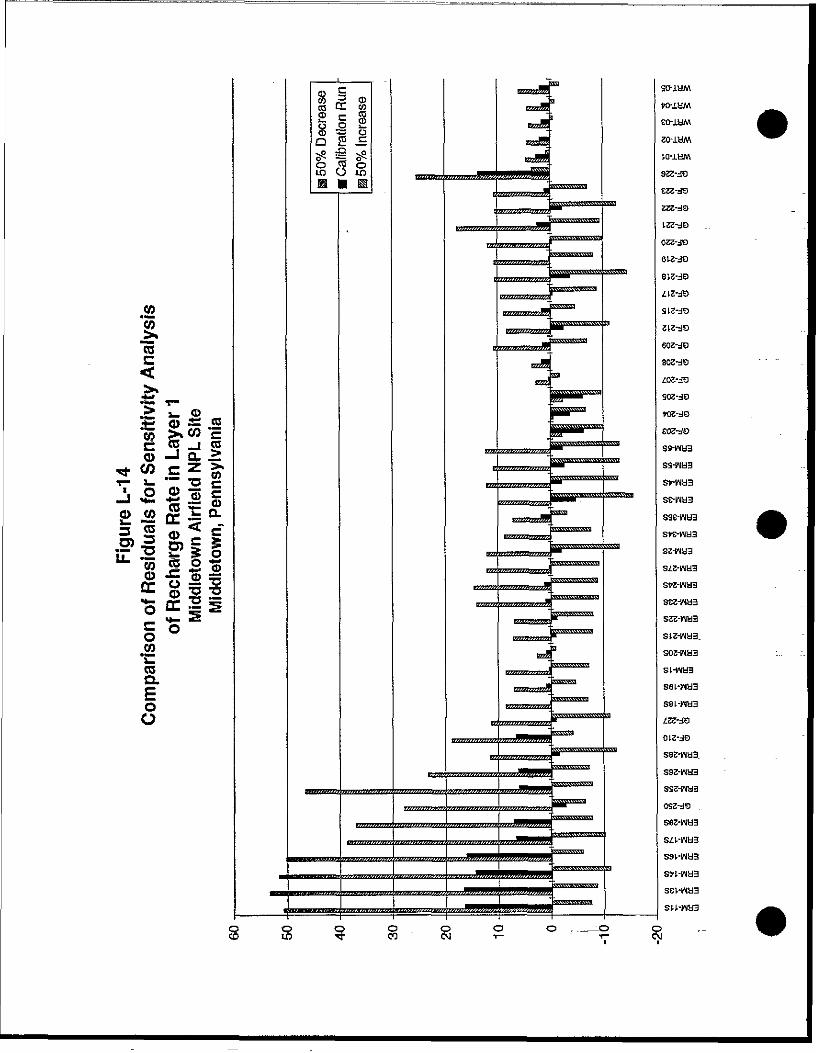
Section:..._ .AppendixL.9 , _ Page: 20of 25Date: - July 1,1996". = " . " ~V=~"_:.__" - ._-,- _.. ......" _."..".". . RevisionNo 0
sensitive to changing areal recharge. The lower recharge rate results inlower simulated water levels (higherpositive residuals) whereasincreasing the recharge rate results in higher simulated water levels(negative residuals). The magnitude of me .change is related to the aquifertransmissivity/ however, it is not directly proportional to thetransmissivity.
L.9.2 ... -Vertical Conductance
In the discussion and sensitivity analyses presented in Section L.9.1, theaquifer parameters transmissjvity and vertical conductance were adjustedproportionally with areal recharge to demonstrate how .thes_e parametersare "linked" together in the regional model,, as they are in a natural system.An evaluation of the sensitivity of the model to variations in verticalconductance without changing the aquifer transmissivity or areal rechargewas performed. Figures L 15 and L-16 show how changing the verticalconductance-impacts the water levels in Layers 1 and 2, respectively.Three simulations "are presented on each of these figures, one shows thecalibrated run with an effective ratio of horizontal to vertical hydraulicconductivity, Kh:Kv, of 100:1, the other simulations show Kh:Ky ratios of150:1.and._5_OjL: -_- _.__ - - _„__,__._„___. ._,_ . _.....
Based on the results shown on Figures L-15 and L-16, the Kh:Kv ratio isrelatively sensitive parameter. The higher Kh:Kv ratio of 150:1 resulted inlower simulated ground water levels in Layers 1 and 2 (higher positiveresiduals between the observed and simulated water levels). The greatestimpact to water levels occurs in the NBL area. .The magnitude of thechange appears to be a function of distance from the river and thetransmissivity of the aquifer. Thusjpround water levels are very sensitivein the NBL.area and relatively insensitive in the Industrial area. Thegreatest sensitivity in the Industrial area was in the immediate vicinity ofthe pumping well HIA-13. It is.expected that.the greatest effect would beobserved where the vertical gradients are the largest, as in the immediatevicinity of a pumping well. Well nests ERM-23 and ERM-24(approximately 100 feet from HIA-13) show a greater sensitivity to theKh:Kv ratio than, wells ERM-IOI, 181, and 3& (over 500 feet from HIA-13).
THE ERM GROUP MIDDLETOWNJ:FS,L.-JULY 1,1996
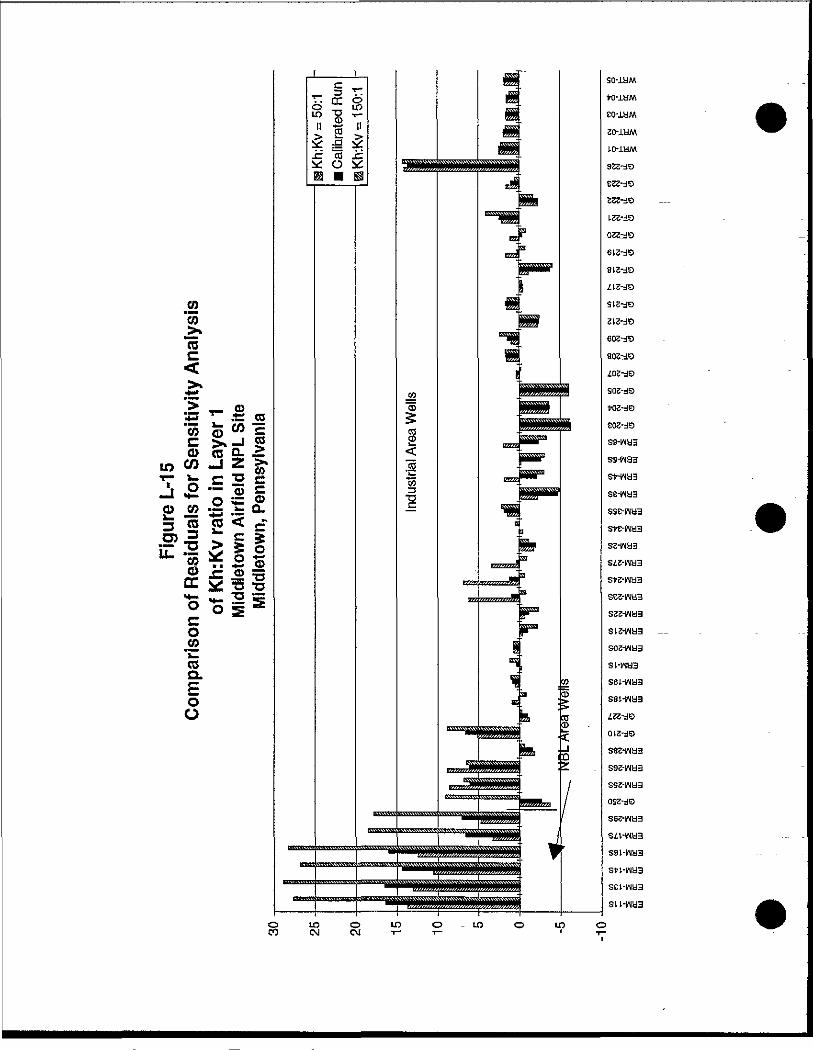
"w15c
^ _ <B
Figure L-1 5
Comparison
of Re
siduals for Sens
of Kh:Kv
ratio
in Layei
Middletown
Airfi
eld NPL S
Middletown, Pennsylvan
n
iC
ill03
*" r \jf
if "c5 £\jS O
mm <*»
———————— 1 ———————— k
SB
3 to O
Indust
rial A
rea Wells
j
mtfffi
I
tfffff.
VTfft
I WKBBE
KggWB&
I^
1K
^ ^ ^ BB™1
< 1
^ ^
vfffa
pS
___________3^ "
\
U7&j?JB ff
ggQXSS]
J S
V|WSb3
Q
52Ta=a
ig
fe
H TOgJ
/?
1DaCjQy
1
IO O - to O IO C
TO-iaMeo-iaM20-J.aM
61-3-dO
31.2-dG
603-dD
WZ-dQ
€03- 3
S9-HU3
ss iaa
se iaasse-waaste-waase-waasze-nya
si-naa
set-waa
013-dO
ses-naa
sse-naa
sci-wyasu-waa
3CO CJ OJ

Analysis
.£ CM ®^ " ±: co« « w 1C >-J §fl) CO D- —to en -i z £
i- i. C "O C
-^ ° o 1 I<u .52 'S •- °-S sg E < c*!*»_S> £ 0> CC ^ -o -o
co.2co0.
oO ,,fa,a,a,a,,,,e,,,r,,t,a,,,f,aftftfffftrrffemfttfftfff,ffrm,,tfM
StE-dO
eoe-do
BDE-dD
ZOE-dO
soe-ds
lee-Naaise-waaras-waa
it-waaist-wus
le-waais-naa
Section: Appendix L.10 _ Page: 21 of 25Date: July 1,1996 _.. RevisionNo,: Q
L.10 MODELING SCENARIOS
The objective of the modeling is to evaluate the hydraulic containment ofthe plume using the HIA production wells. - . . ..
Three modeling scenarios including the simulation of current conditionsand reconfiguration of the HIA production wells were performed. Themodeling scenarios., as detailed in Section 2.2.5.3 of the Scope of Services,,involving soil remediation and reconfigured wells and SVE remediationwere not evaluated because no specific source areas were identified. Itshould be noted that two reconfiguration scenarios were simulated inaddition to simulation of current conditions. The reconfiguration wasbased on knowledge of HIA operations, results of the current conditionssimulations, and screening of several scenarios using the 2-D analyticelement model developed during the capture zone analysis. All scenariosassume steady state conditions. Table L-2 presents the pumping rates foreach scenario. Well pumping rates were simulated as annual averages.
L.10.1 Scenario 1 - Current Conditions
This scenario includes current HIA well configuration (average annualpumping rates for each HIA production well) with the operating airstripper, and the five Middletown wells, MID-Ol-through MID-05.
The total annual average pumping rate is 708,7 gpm fromTthe HIA wells.The annual average pumping rate for the Middletown wells was 693 gpm.Figures L-17 through L-20 present the ground water contours generatedmodel layers 1,2,3, and 4, respectively. Capture zones are depicted forLayers 2,3, and 4. The capture zones for these three layers are identical,within the accuracy of the interpretation. This is reasonable consideringthe large screened intervals of the pumping wells and the large;area ofinfluence. The capture zones are similar to those determined for average.annual pumping conditions using the TWODAN capture zone modeling(Scenario 4, Appendix K). The capture zones appear to overlap.However, there is a potential for some ground water to escape capturebetween the Eastern and Central area, and between HIA-13 and theWestern area wells. None of the capture_zones reach outto theSusquehanna River.
The capture zone in the unconfined overburden aquifer, Layer 1, is notdepicted on Figure L-17. The modeled capture zone is very small and it's
THE ERM GROUP Mn EIQWN.FFS.L.-JULY 1,1996
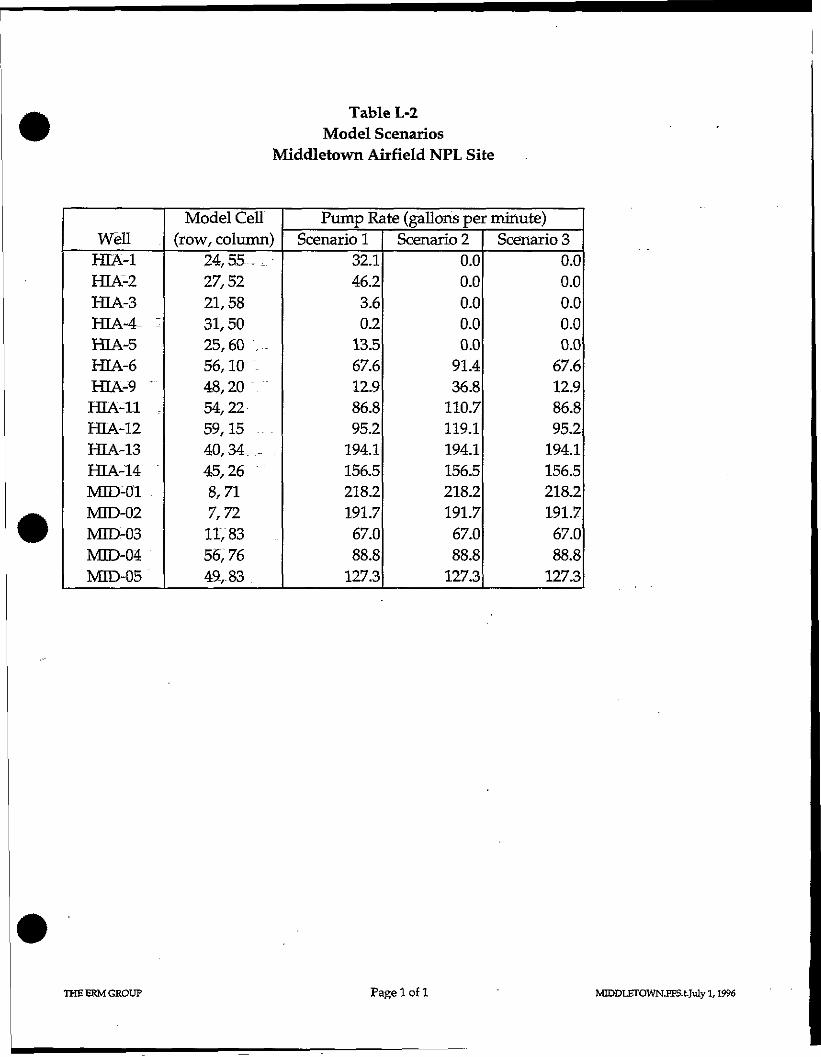
Table L-2Model Scenarios
Middletown Airfield NPL Site
WellHIA-1HIA-2HIA-3HIA-4- :HIA-5HIA-6HIA-9 -HIA-11 ..HIA-12HIA-13HIA-14MID-01MID-02MID-03MID-04MID-05
Model Cell(row, column)
24, 55-,.-27,5221,5831,5025,60 ,- "56, 10 -48, 2054,2259,1540,34.--45,268,717,7211,8356,7649-, 83
Pump Rate (gallons per minute)Scenario 1
32.146.23.60.213.567.612.986.895.2194.1156.5218.2191.767.088.8127.3
Scenario 20.00.00.00.00.091.436.8110.7119,1194.1156.5218.2191.767.088.8127.3
Scenario 30.00.00.00.00.067.612.986.895.2194.1156.5218.2191.767.088.8127.3
THE ERM GROUP Page 1 of 1 ' MTODLETOWN.EFS.t.July 1,1996
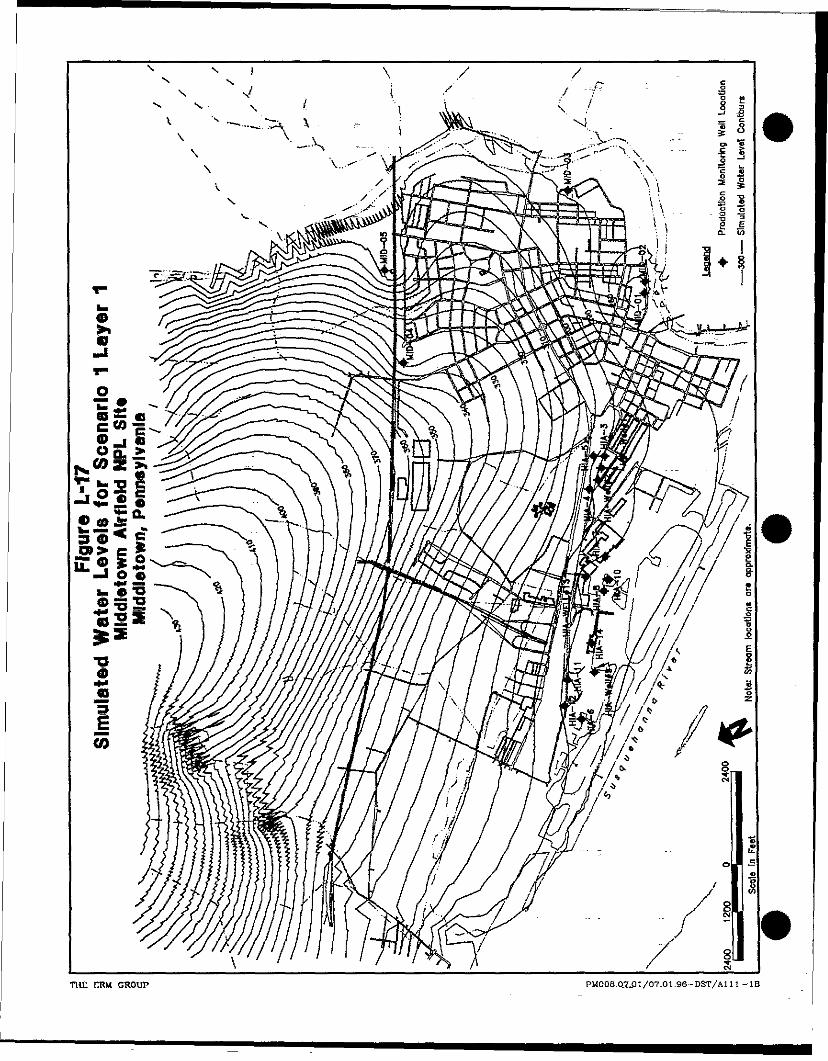
TllC HRM CROUP PMOOS,0_7JD1/OT-01,96-DST/Al 11 -IB
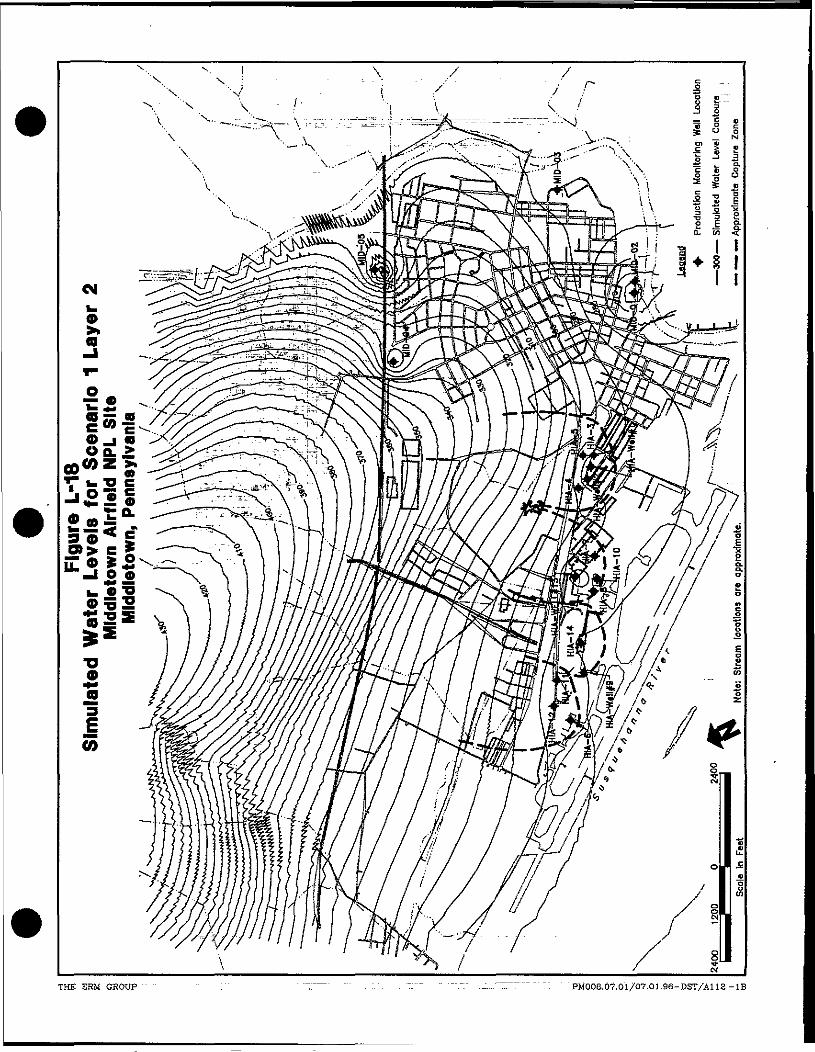
CM
«M mmf ^ m
2/3* *»> = *
THE EHM GROUP . "7.~~ ."' . '..'.- . "-'-"" " "".".' . ...."~~T'~~" PM008.67.01/07.01.96-DST/A11S -IB
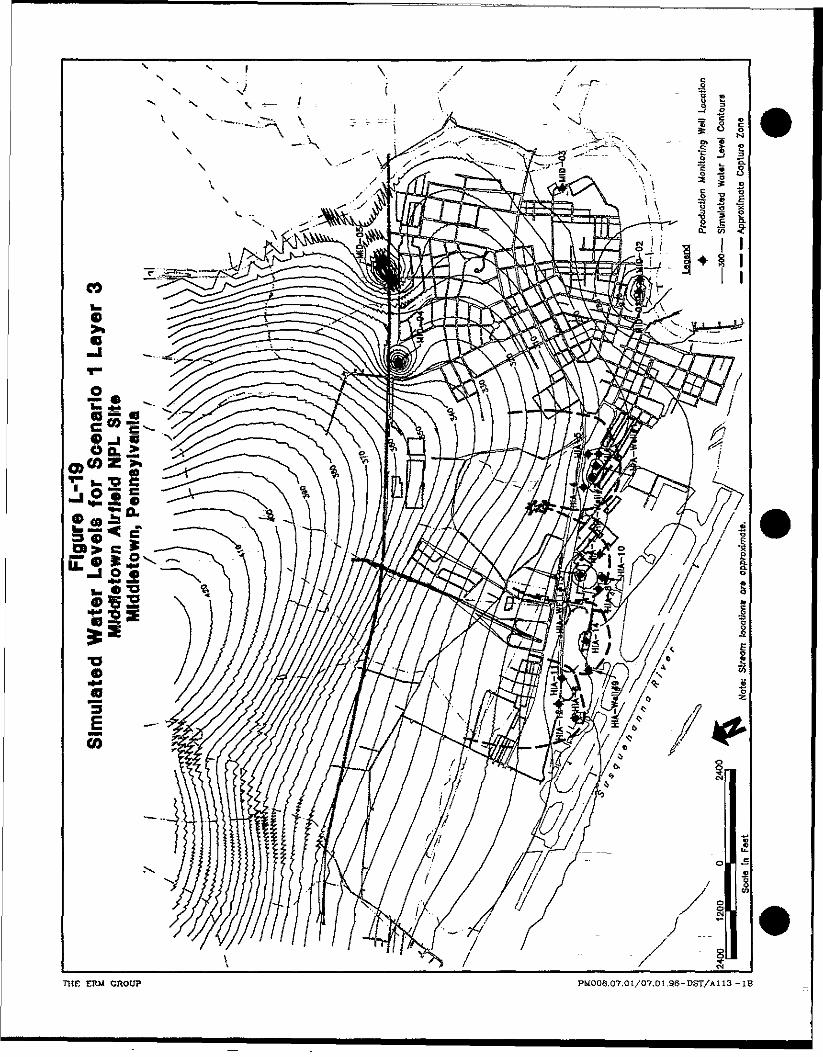
-i 3
THE ERM CROUP PM006.07,OI/07.01,96-DST/A113-IB

THE ERM GROUP - ------- ----- - - - — — -; PM008.07.01/07.01.96-DST/A114-IB
Section: Appendix L.10 . Page: 22 of 25Date: July 1,1996 "'" - . . . . = - RevisionNo.: 0
width would be subject to significant uncertainty in the analysis.However, ground water contours produced for the SSI from May 1995data (Plate 7 in the FFS report) suggest that HIA-13 has a significantcapture area for the overburden aquifer. The difference between themodeled capture area and the observed is related to several factors:
• the pumping rate for HIA-13 during the May 1995 monitoring eventwas 423 gpm (when pumping) and average daily of 243 gpm for thatday. The average annual pumping rate simulated for HIA-13 was194 gpm.
• there had been a significant drought during and prior to the May1995 monitoring event, and
• increasing the vertical conductance between model layers 1 and 2may be necessary to allow the influence of pumping to have a greaterimpact on Layer 1. . ' .... _ _ _ . _ _ . . . . . . . ..
L.10.2 Scenario 2 - Reconfigured Wells
This scenario includes reconfiguring the HIA wells such that the HLAwells in the Eastern Area (HIA-1 through HIA-5) are not pumping andcompensating for the reduced pumping in the Eastern Area by increasingthe pumping in the Western Area (HIA-6, HIA-9, HIA-11, and HIA-12).The total pumping rate for the HIA wells was maintained at the 708.7 gpmannual average rate. The wells in the Eastern area, HIA-1, -2, -3, -4,. and -5,were turned off and their pumping volume was transferred to the WesternWells, HIA-6, -9, -11, and -12. The Eastern wells pump an annual averageof 95.6 gpm. Figures L-21 through L-24 present the simulated groundwater levels for layers 1,2,3, and 4, respectively. Capture zones aredepicted for Layers 2,3, and 4. As observed in Scenario l,,_the_capturezones for these three layers are identical, within the accuracy of theinterpretation.
The result of transferring the pumping from the Eastern area to theWestern area was to slightly increase the capture zone width and reach inthe Western area and eliminate the capture zone of the Eastern wellsentirely. The Western area and Central area capture zones how overlapwith less potential for ground water escaping between HIA-13 and theWestern wells than in Scenario 1.
THE ESM CROUP MTDDLETOWNJTS.L.-JULY 1,1996
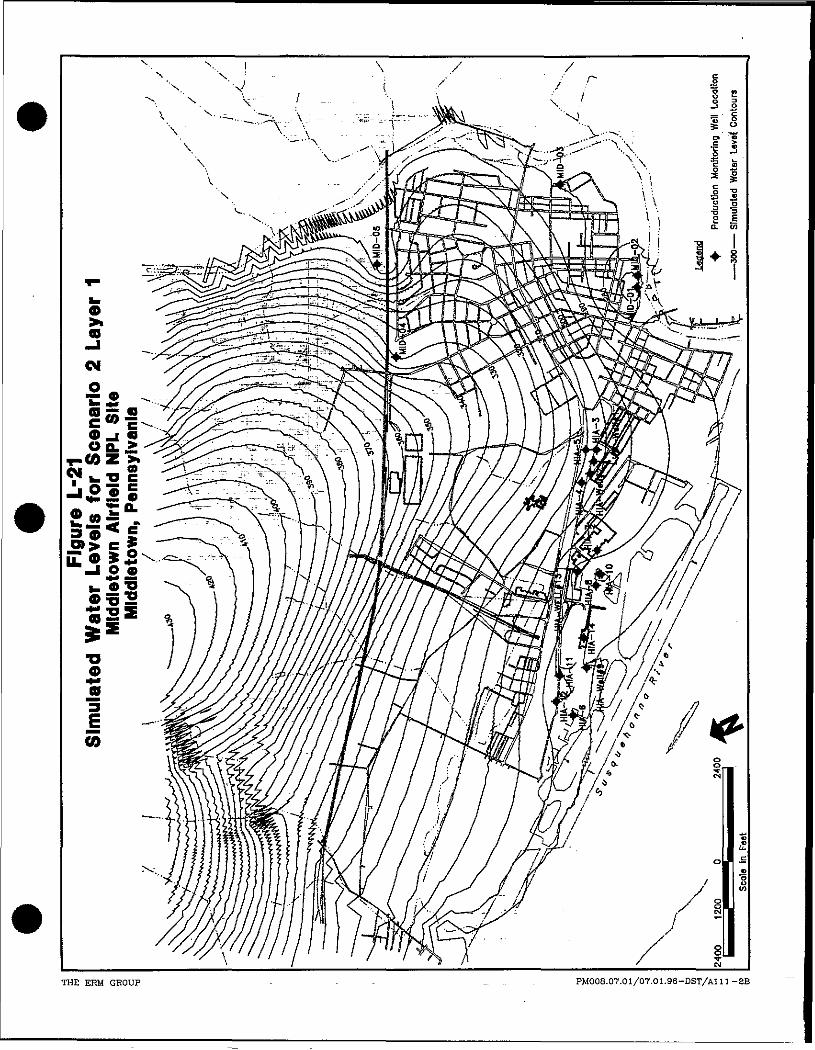
THE ERM GROUP - - - - -- PM008.07/01/07.01.36-DST/A! 11 -2B
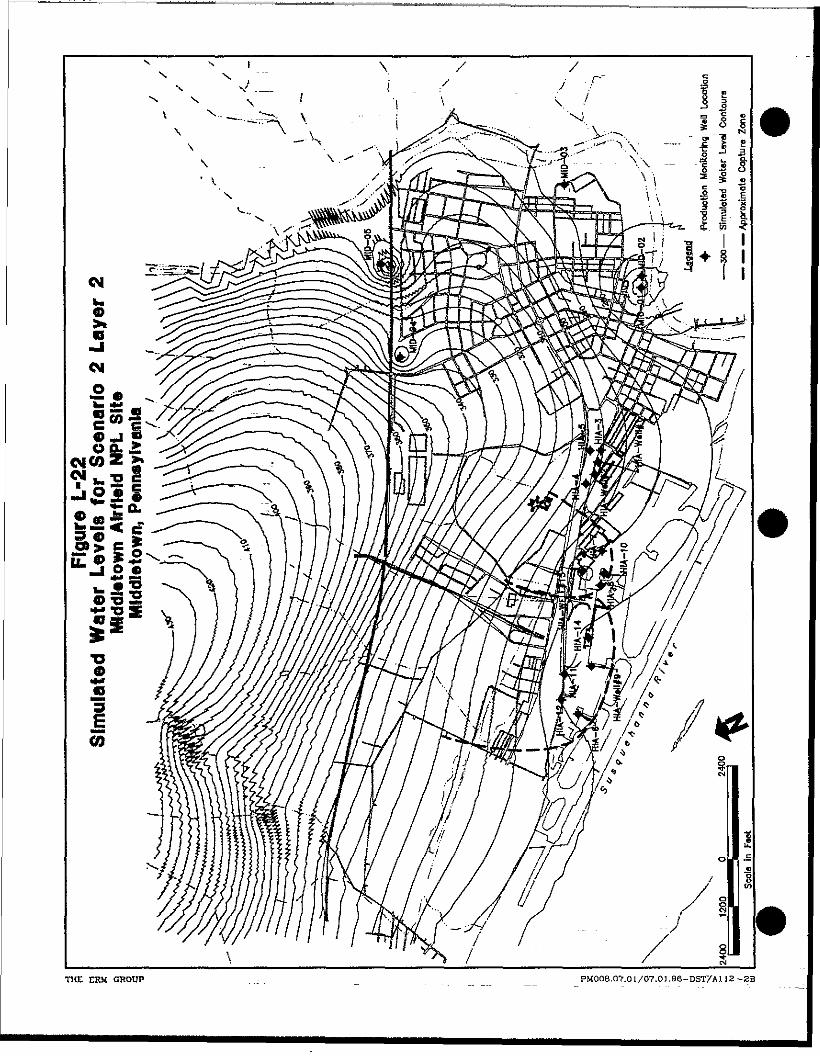
THE ERM GROUP .__ .: PM006.07.01/07.01.96-DST/A112 -2B
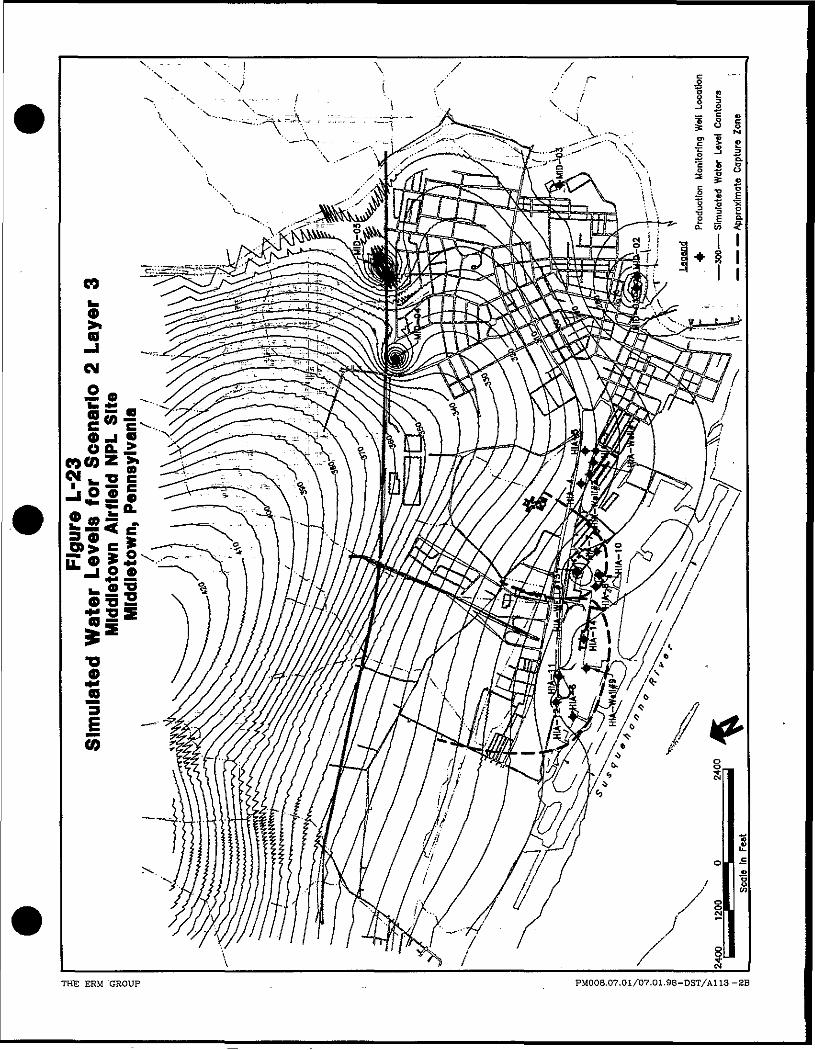
THE ERM GROUP . .. PM008.07.01/07.01.96-D3T/A113-2B
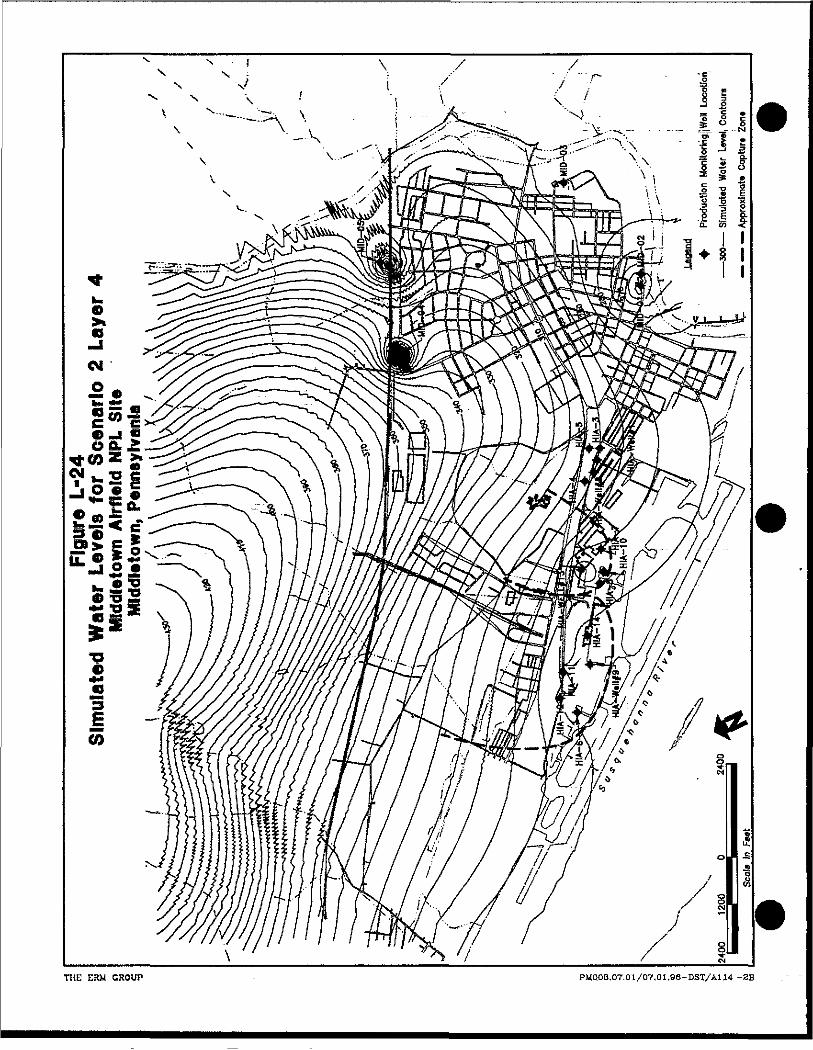
THE ERM CROUP - PMQOB.Or.0-l/07.OI.96-DST/AU4 -SS
Section: Appendix L.10 - - - .. ' *" -.-— •*-==- Page: 23 of 25Date: -July 1,1996 T" ' ~" """"" •———- —— ----- RevisionNo.: 0
L.10,3 Scenario 3 Reduced HIA Pumping
This scenario includes reconfiguring the HIA wells such that the HIAwells in the Eastern Area (HLA-1through HIA-5) are not pumping andremaining HIA wells pump at their average annual rate (i.e. the totalpumpage from the HIA wells is reduced by 95.6 gpm, the amount ofpumpage from the Eastern Area). The pumping rates for the Middletownwells are the same as Scenarios 1 and 2. Figures L-25 through L-28 presentthe simulated ground water levels for layers 1,2,3, and 4, respectively.Capture 'zones are depicted for Layers 2,3, and 4. As observed inScenario 1/the capture zones for these three layers are identical, within theaccuracy of the interpretation. The capture zones are essentially identicalto those depicted in Scenario 1 for the Western and Central areas.
THEERMGROUP " ~ " ~ ~ MIDDLETOWN JTS.L.-JULY 1,1996
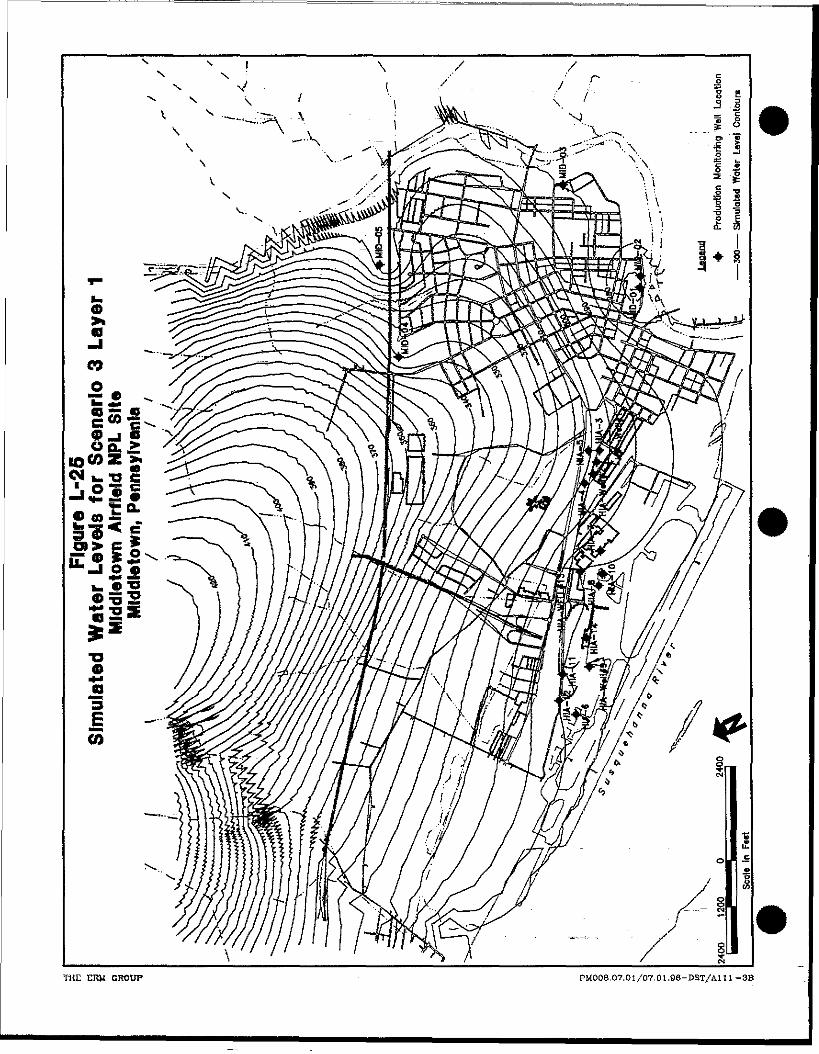
THD ERM GROUP PM008.07.01/07.01,96-DST/A111-3B
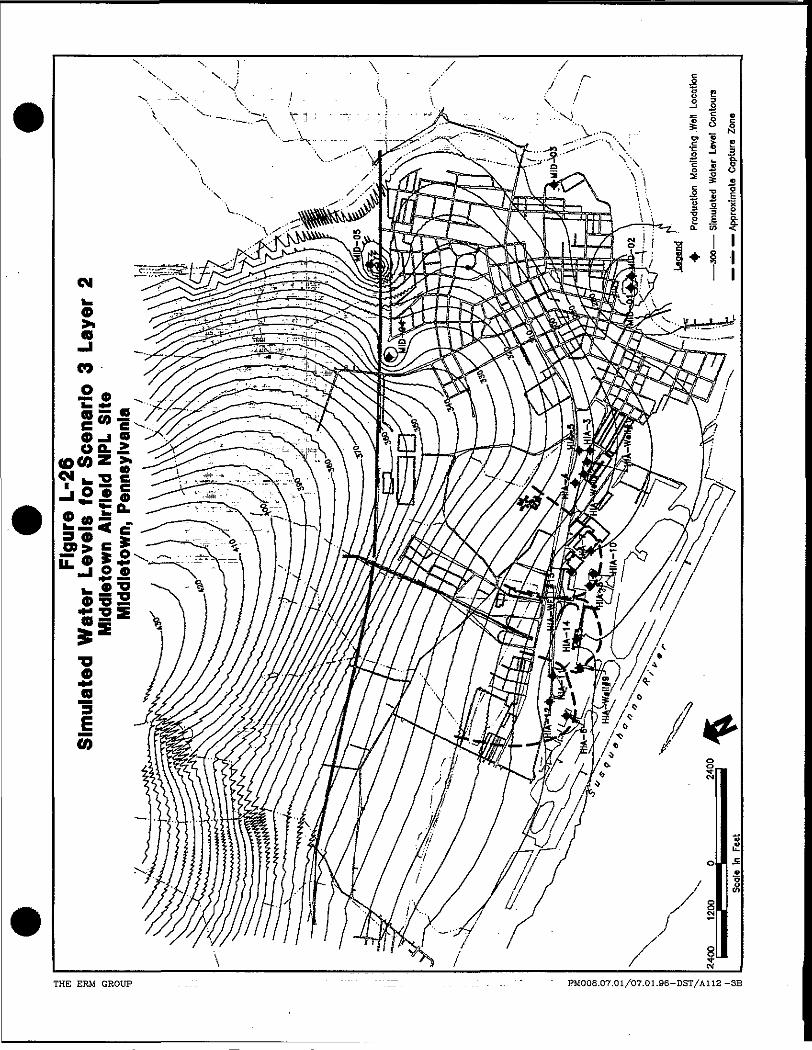
CM
THE ERM GROUP . _... " " '-.LT. . . . _ : . - . " " PM008.07.01/07.01.96-DST/A112-3B
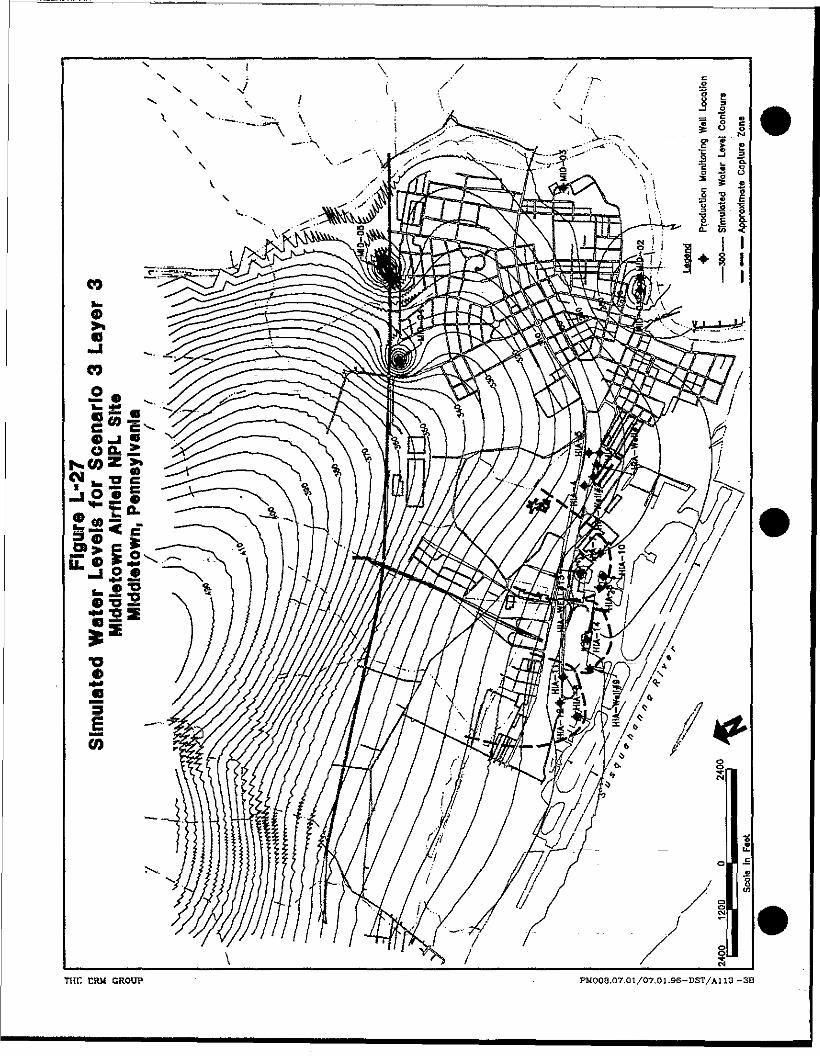
T»n CRM GROUP - PM008.07.01/07.01.96-DST/A113-3B
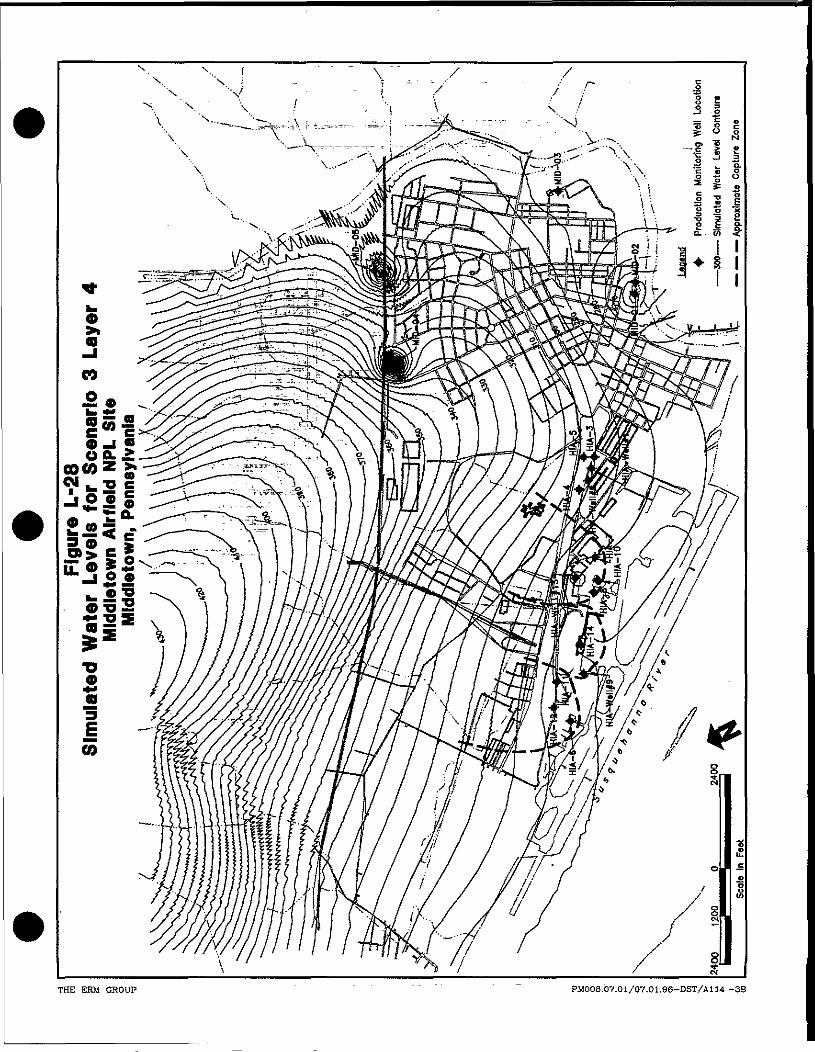
THE ERM GROUP " -- -- - PM008.07.01/07.01.96-DST/A114-3B
Section: Appendix L.11 'Page: 24 of 25Date July 1,1996 " -Revision No.: 0
CONCLUSIONS AND RECOMMENDATIONS
The MODFLOW model presented herein is a regional ground water flowmodel which has been calibrated .to the May 1995 ground water levelscollected during the SSL The model is satisfactorily calibrated to evaluatethe current hydraulic capture of the HIA production wells, and to developand evaluate alternate pumping scenarios to contain the ground water.
The current average annual pumping rates of the HIA production wellsprovide an effective containment for most of the impacted ground water _beneath the HIA.
The capture zone for layers 2,3, and 4, in the bedrock aquifer, wereessentially identical. This suggest that two-dimensional modeling, asdescribed in Appendix K, is an acceptable approach to performing furthercapture zone analysis.
The calibration of the model did not meet the objective of one contourinterval accuracy. Additional calibration time would be required toachieve this objective. The difficulty in achieving the objective is the resultof heterogeneous aquifer conditions, strong vertical hydraulic gradients,and differences between the average pumping rates which have created along term effect on water levels and the varying pumping schedule onwhich the HIA production wells operate. That is, if the wells wereoperated continuously at the same pumping rates (versus the currentvariable pumping schedule), the observed ground water levels wouldlikely be closer to the simulated steady-state water levels. However themodel was satisfactorily calibrated within the Industrial Area to achievethe project objective of evaluating the reconfiguration of the HIAproduction wells.
THE ESM GROUP MTODLETOWN.FFS.L.-JULY 1,1996
Section: "Appendix L.12 - . - .-... =_ —. - Page: 25 of "25"Date: July 1,1996 .... .'.:..:: .,. V:..;.r. __ ". :. . .:. . :. RevisionNo.: 0
L.12 REFERENCES:
Brigham Young University, 1995. GMS, Department of Defense,Groundwater Modeling System, Reference Manual Version 1.1.
Chow, V.T. 1964, "Handbook of Applied Hydrology", published byMcGraw-Hill, Inc. q
Driscoll, F. G. 19861 "Ground Water and Wells", published by JohnsonDivision, St. Paul, Minnesota.
Fitts, C. R. 1994, 'TWODAN", user's manual, Version 2.0.
Freeze, R.A. and J.A. Cherry 1979, "Groundwater", published by Prentice-Hall, Inc.
Gannett Hemming, Environmental Engineers, Inc. Final Remedial• Investigation Report, Middletown Airfield Site, Middletown,
Pennsylvania, July 1990.
HydroLogic, 1989. "ANIAQX Version 2.5 Operations Guide", Missoula,MT, - : : """
Linsley, R.K. and J.B. Frartzini 1979, "Water Resources Engineering", thirdedition, published by McGraw-Hill, Inc.
McDonald J.M. and A.W. Harbaugh. 1988. A modular three-dimensionalfinite-difference ground-water flow model. Techniques of Water ResourcesInvestigations of the U.S. Geological Survey Book 6. 586 pp.
Meisler, H. and S.M. Longwill, 1961. Ground-Water Resources of OlmstedAir Force Base, Middletown, Pennsylvania, Geologic Survey Water-Supply Paper 1539-H. ._.... ._..
Strack, O.D. 1989, "Ground Water Mechanics", published by Prentice-Hall,Inc." " " - - — . • -— . . . . . . .....
Supplemental Studies Investigation, Work Plan for Capture Zone Testsand Analysis, Middletown Airfield NPL Site, Middletown, Pennsylvania,
THE ERM GROUP MIDDLETOWN JFS.L.-JULY 1,1996
Section: Appendix L.12 Page: 26 of 25Date: July 1, 1996 - Revision Not 0
prepared by Environmental Resources Management, Inc., 14 July 1995,prepared for Air Force Regional Compliance Office.
USEPA. 1992. Explanation of Significant Differences. Middletown AirfieldSite. Clarification of December 1990 Record of Decisioft by the UnitedStates Environmental Protection Agency.
USACE. 1993. Scope of Services. Middletown Airfield NPL Site. SVE Pilot,Groundwater Restoration Analysis, Sampling - PR004,
THE ERM GROUP 1VODDLETOWNJFFSX.-JULY 1,1996
EPA REGION IIISUPERFUND DOCUMENT MANAGEMENT SYSTEM
DOC ID /PAGE# _J
IMAGERY COVER SHEETUNSCANNABLE ITEM
SITE NAME kt
OPERABLE UNIT
ADMINISTRATIVE RECORDS- SECTION____VOLUME (/O I '
REPORT OR DOCUMENT TITLE h gr£-Cl&» n f"? & To ~ //
n0 1 - TixlDATE OF DOCUMENT
DESCRIPTON OF IMAGERY.
NUMBER AND TYPE OF IMAGERY ITEM(S).