appendix k urban decay study - lake elsinore
TRANSCRIPT

Lake Elsinore Walmart Supercenter Project ESA / D130767 Administrative Draft Environmental Impact Report August 2015
W1690-Lake_Elsinore_CA_(Third) -- 1705810.1
APPENDIX K Urban Decay Study

URBAN DECAY STUDY FOR
LAKE ELSINORE WALMART
2015
Prepared for:
City of Lake Elsinore
Prepared by:
THE NATELSON DALE GROUP, INC. 24835 E. La Palma Avenue, Suite I
Yorba Linda, California 92887 Telephone: (714) 692-9596
Fax: (714) 692-9597 www.natelsondale.com

TABLE OF CONTENTS
SECTION PAGE
I. INTRODUCTION .............................................................................................................................. 1 II. EXECUTIVE SUMMARY ................................................................................................................. 7
II-A. Summary Conclusions Regarding Potential for Urban Decay ............................................... 7 II-B. Overview of Existing Retail Market in Trade Area ................................................................. 7 II-C. Impact of Proposed Project’s “GAFO” Sales.......................................................................... 9 II-D. Impact of Proposed Project’s Grocery Component .............................................................. 10 II-E. Impact of Proposed Project’s Restaurant Space ................................................................. 12 II-F. Impact of Proposed Project’s Fueling Station/Convenience Store ...................................... 13 II-G. Potential Reuse of Existing Lake Elsinore Walmart Site ...................................................... 13 II-H. Cumulative Impacts of Projects Planned in the Trade Area ................................................ 15 II-I. Potential for Urban Decay .................................................................................................... 19
III. RETAIL DEMAND ANALYSIS METHODOLOGY .......................................................................... 22
III-A. Market Area Boundaries....................................................................................................... 22 III-B. Population and Income Levels ............................................................................................. 24 III-C. Retail Sales Demand ............................................................................................................ 25 III-D. Distribution of Retail Expenditures ....................................................................................... 26 III-E. Capture Rate Analysis .......................................................................................................... 27 III-F. Potential Retail Sales Volumes ............................................................................................ 29 III-G. Supportable Retail Space..................................................................................................... 30 III-H. Demand for Grocery Sales and Supportable Grocery Space .............................................. 32
APPENDIX A: RETAIL DEMAND ANALYSIS – LAKE ELSINORE RETAIL TRADE AREA APPENDIX B: RETAIL INVENTORY – LAKE ELSINORE RETAIL TRADE AREA APPENDIX C: PICTURES OF HIGH VACANCY RATE CENTERS

I. INTRODUCTION
This report evaluates the potential economic impacts of the proposed Walmart-anchored shopping center project in the City of Lake Elsinore. In particular, the study evaluates the extent to which the proposed project would have competitive impacts on existing retail facilities in the trade area and consequently have the potential to result in urban decay. In addition to addressing the potential impacts of the proposed project itself, the study also considers cumulative impacts, taking into account the impacts from other planned and proposed retail projects in the trade area.
The project site totals approximately 17.66 acres located near the intersection of Central and Cambern Avenues. For purposes of this analysis, the project is assumed to include the following components:
• A 166,322 square foot Walmart store, including 39,155 square feet devoted to grocery sales/support space, in addition to a 7,888 square foot outdoor garden center
In early 2015, the site plan for the Walmart store portion of the project was revised. This included a reduction in overall floor area from the previous site plan, such that the planned store is currently 11,835 square feet smaller than previously proposed. For purposes of this study, the previous floor areas planned for the proposed Walmart store, as enumerated above, have not been changed to match the revised site plan. Since the floor areas for the store which are analyzed in this report are larger than the floor areas shown in the current site plan, the analysis presented in this report represents worst-case conditions and thus likely overstates the project impacts to some degree.
Additional retail development totaling 16,000 square feet, with “outlots” developed with the following probable uses:
• Outlot 1: 9,200 square feet of specialty retail space1
• Outlot 2: 3,700 square feet of drive-thru restaurant space
• Outlot 3: 3,100 square feet of drive-thru restaurant space
Based on the latest project information, the analysis assumes that the project would open in 2017. The economic impact analysis addresses six key issues:
1. The potential for the proposed project’s general merchandise space to negatively impact existing “GAFO”2 stores in the trade area;
2. The potential for the proposed project’s grocery component to negatively impact existing supermarkets in the area;
1 This outlot could alternatively be developed with a gas station/carwash and a 3,100 square foot convenience store. To evaluate the proposed project’s maximum potential impact, the baseline scenario assumes the 9,200 square feet of specialty retail space would be developed. However, Section II-F also evaluates impacts related to the potential gas station alternative. 2 “GAFO” is a retail industry acronym for the General Merchandise, Apparel, Furniture, and Other/Specialty sales categories. These categories correspond to the typical merchandise mix of a general merchandise department store such as the proposed Walmart store. The GAFO retail categories are also referred to as “shopper” or “comparison” goods.
THE NATELSON DALE GROUP, INC. Urban Decay Study for Proposed Lake Elsinore Walmart
Page 1

3. The potential for the proposed project’s 16-pump fueling station to negatively impact existing service stations in the trade area;
4. The potential for the proposed project’s restaurant space to negatively impact existing restaurants in the trade area;
5. The degree to which there will be market demand to support reuse or redevelopment of the existing Lake Elsinore Walmart building if this store is vacated3 due to its proximity to the approved Walmart Supercenter in Wildomar and the proposed Walmart Supercenter in Lake Elsinore; and
6. The cumulative impacts associated with the proposed project when its impacts are considered together with economic impacts of all major retail projects currently planned for development in the trade area.
The economic analysis is used to determine, in accordance with the California Environmental Quality Act (CEQA), the proposed project’s potential to create urban decay. CEQA does not trigger an automatic presumption that urban decay will occur as a result of other businesses being closed. However, store closures can lead to conditions of urban decay. For the purpose of this analysis, urban decay is defined as physical deterioration due to store closures and long-term vacancies in existing shopping centers that is so prevalent and substantial that it impairs the health, safety, and welfare of the surrounding community. Physical deterioration includes, but is not limited to, abandoned buildings and commercial sites in disrepair, boarded doors and windows, long-term unauthorized use of properties and parking lots, extensive gang or offensive graffiti painted on buildings, dumping of refuse or overturned dumpsters on properties, dead trees or shrubbery, extensive litter, uncontrolled weed growth, and homeless encampments.
Overview of Methodology
For purposes of estimating impacts in the relevant retail sales categories, this analysis considers a trade area that includes the majority of the City of Lake Elsinore, in addition to surrounding unincorporated areas of Riverside County. The analysis projects total resident purchasing power within this trade area, and uses this projection of total demand as the basis for determining the extent to which the proposed project could be supported in the market area without negatively impacting existing businesses. The study methodology includes the following major steps:
1. Estimate the current potential demand for retail sales in the trade area, based on existing demographics;
2. Estimate the portion of total trade area demand that could realistically be “captured” by retail facilities in the trade area, based on an evaluation of the amounts and locations of competitive retail facilities outside of the evaluated trade area;
3. Forecast future (14-year) growth in the amount of supportable retail sales, based on projected increases in the trade area’s resident population;
3 At this time it is not known if the existing Lake Elsinore Walmart store, located on 31700 Grape Street, will be closed after the proposed Walmart Supercenter is opened. TNDG believes that store closure is a possibility, as the existing store is located at the approximate midway point between two proposed Walmart Supercenters (the proposed project evaluated in this analysis and an approved Wildomar Walmart Supercenter located at Bundy Canyon Road and Interstate 15 [I-15]). The existing Lake Elsinore Walmart store is approximately 3.0 miles away from both proposed Supercenters. Thus, if this store were to close, it would be attributable to the strategic locations of two new Supercenters developed by Walmart. See Section II-G for further discussion.
THE NATELSON DALE GROUP, INC. Urban Decay Study for Proposed Lake Elsinore Walmart
Page 2
4. Forecast future growth in retail sales by individual retail category;
5. Estimate supermarket demand by determining the portion of total food store sales captured by supermarkets (versus other types of food stores such as convenience markets);
6. Estimate net supermarket demand after accounting for the capture of available demand by the proposed grocery component of the Walmart store; and
7. Evaluate the impact of the project on average sales per square foot levels at the existing supermarkets in the trade area.
For the non-grocery retail categories, the potential impacts are expressed in terms of the square feet of existing businesses that could potentially be displaced by the proposed project. For the grocery category, in addition to evaluating the potential square footage displacement, the report evaluates direct potential sales impacts (in terms of dollars per square foot) to existing supermarkets in the trade area. This additional level of analysis for supermarkets is possible because the universe of supermarkets in the trade area is a manageable number (there are seven supermarkets in the trade area). Thus, it is possible to estimate the existing aggregate and average sales of these supermarkets, based on data from the California State Board of Equalization (SBOE) and Trade Dimensions International, Inc., a market research firm of The Nielsen Company (see Section II-D).
Description of Trade Area
According to the International Council of Shopping Centers (ICSC) – the premier trade association of the shopping center industry – a community center similar in scale and scope to the proposed project would typically have a trade area of 3 to 6 miles. To be analytically conservative, this analysis evaluates a smaller trade area for potential market support for the proposed project4. Starting with a three-mile radius as an initial reference point, The Natelson Dale Group, Inc. (TNDG) designed a customized polygon as the trade area. This polygon takes into account natural traffic barriers (such as major roads and highways) and the locations of existing competitive shopping centers. The trade area boundaries are defined as follows:
• Western Boundary – The western boundary extends approximately to Riverside County line in the Cleveland National Forest. For the most part, the effective boundary is Grand Avenue, given that there is little developed land beyond this street, outside of a nominal amount of residential and commercial development along the Ortega Highway (State Route 74 [SR-74]). Grand Avenue is approximately 3.6 miles from the proposed project site.
• Eastern Boundary – The eastern boundary starts approximately at the intersection of Railroad Canyon Road and Canyon Hills Road. It extends further along the western boundary of the City of Canyon Lake to Greenwald Avenue/Riverside Street. Finally, at its most northern section, it runs along El Toro Road to the northern boundary. The eastern boundary is approximately 3.0 to 3.5 miles from the proposed project.
• Southern Boundary – The southern boundary starts at SR-74, just south of Tenaja Truck Trail. It extends further in the northerly direction along Stoneman Street to
4 A smaller trade area than that recommended by the ICSC provides a conservative approach for estimating retail demand in that it potentially excludes demand from some residents that may patronize the proposed project. That is, by only including the demand from residents that live closer to the project than the standard 3 to 6 mile radius (as recommended by the ICSC), the analysis provides a “conservative” estimate of the trade area’s potential retail demand.
THE NATELSON DALE GROUP, INC. Urban Decay Study for Proposed Lake Elsinore Walmart
Page 3
Railroad Canyon road until it reaches the Railroad Canyon Road/Canyon Hills Road intersection (the approximate start of the western boundary). Similar to the western boundary, the relevant western section of the boundary is primarily Grand Avenue, given that there is little developed land beyond this street. The most relevant section of the boundary is Railroad Canyon road, which includes the majority of developed area long the entire boundary. This relevant portion of the southern boundary is approximately 3.0 miles from the project site.
• Northern Boundary – At El Toro Road, the northern boundary reaches as far north as the intersection of Glen Eden Road and Interstate 15 (I-15). The boundary extends further west to the Riverside County line in the Cleveland National Forest. The northern boundary is approximately 3.6 miles from the proposed project site.
As noted above, the trade area design takes into account the locations of existing competitive shopping centers, along with the location of an additional proposed Walmart Supercenter (see discussion below). This is the primary reason for the selection of the southern boundary (represented by Railroad Canyon Road5), which represents the approximate midpoint between the proposed project and another proposed Walmart Supercenter in the City of Wildomar. The Wildomar Supercenter is proposed for development near the I-15/Bundy Canyon Road intersection (on the east side of I-15). All else equal, given that Railroad Canyon Road is the approximate midpoint between the two proposed stores, residents living north of the border would be more likely to shop at the proposed Lake Elsinore Supercenter, while residents living south of the border would prefer to shop at the Wildomar Supercenter. Thus, as discussed in the urban decay study for the approved Wildomar store, this street also functions as the northern boundary for that proposed store.
A map of the trade area boundaries is provided as Figure I-1 on the following page.
5 As noted above, the most relevant section of the southern trade area boundary is Railroad Canyon Road, which includes most of the developed area around the southern border.
THE NATELSON DALE GROUP, INC. Urban Decay Study for Proposed Lake Elsinore Walmart
Page 4

Figure I-1: Lake Elsinore Retail Trade Area
Project Site
THE NATELSON DALE GROUP, INC. Urban Decay Study for Proposed Lake Elsinore Walmart
Page 5

What this Study Provides
Since this study is being completed as part of the Environmental Impact Report (EIR) process for the proposed project, it focuses strictly on the types of economic impacts that are defined as significant by the California Environmental Quality Act (CEQA). Specifically, per Section 15131(b) of the CEQA Guidelines, a project’s economic impacts on a community are considered significant only if they can be tied to direct physical changes in the market area (i.e., physical deterioration of existing retail centers/facilities). For purposes of this analysis, TNDG has established the following criteria to determine if the project’s market impacts would be significant enough to create a lasting physical change in the market area:
• Any diversion of sales from existing retail facilities would have to be severe enough to result in business closings; and
• The business closures would have to be significant enough in scale (i.e., in terms of the total square footage affected and/or the loss of key “anchor” tenants) to affect the long-term viability of existing shopping centers or districts, subsequently resulting in urban decay. Urban decay may be described as a downward spiral of store closures and long-term vacancies. While the phenomenon of urban decay is not defined under CEQA, it is assumed to be indicated by significant deterioration of structures and/or their surroundings. Such deterioration occurs when property owners reduce property maintenance activities below that required to keep their properties in good condition. A store closure, in and of itself, does not constitute urban decay. While the closure of a business is clearly a severe impact to the owners and employees of the firm, within the context of CEQA it is only significant if it results in sustained vacancies and related deterioration of the physical condition of the vacant building(s).
Within the above context, the analysis includes a description of the “baseline” condition of existing retail facilities in the trade area. In particular, TNDG completed a detailed inventory of existing tenants and vacancies in the trade area.
THE NATELSON DALE GROUP, INC. Urban Decay Study for Proposed Lake Elsinore Walmart
Page 6

II. EXECUTIVE SUMMARY
II-A. SUMMARY CONCLUSIONS REGARDING POTENTIAL FOR URBAN DECAY
Based on the data and analysis presented in this report, TNDG concludes that the proposed project would not result in urban decay in the evaluated trade area.
It is TNDG’s conclusion that the project as proposed would not have significant economic impacts on existing retailers. The analysis supporting this conclusion is summarized in Sections II-B through II-I, with the study methodology documented in Section III.
II-B. OVERVIEW OF EXISTING RETAIL MARKET IN TRADE AREA
As part of the analysis, TNDG completed a comprehensive inventory of all existing retail tenants and vacancies in the trade area. The detailed inventory is provided in Appendix B of the report, while a summary of the findings is provided in Table II-1 on page 9. Note that the summary shown in Table II-1 excludes the Lake Elsinore Outlets – a 369,000 square foot outlet shopping center strategically located at Nichols Road and Interstate 15 (I-15) in the City of Lake Elsinore. This outlet center is excluded from the inventory and the analysis because its trade area is significantly larger than the trade area for the proposed project6. For the analysis to fully and accurately account for the sales attracted to the Lake Elsinore Outlets, it would be necessary to evaluate a much larger trade area than has been considered in this analysis. The assumption of a larger trade area would, in turn, overstate the level of market demand available to support smaller retail facilities such as the proposed project and dilute the proposed project’s potential urban decay impacts. Such an approach is inconsistent with the conservative assumptions used in the analysis.
As noted above, the primary delineator of the southern boundary – Railroad Canyon Road – essentially functions as the dividing line between the trade area for the proposed project and the trade area for the approved Wildomar Walmart Supercenter. Given that this street represents the approximate midpoint between the two proposed Supercenters, all retail development along the north and south sides of this street has been included in the retail inventory. However, to account for the fact that this retail development is also supported by residents who live south of this boundary, the analysis discounts the square footage of this space along Railroad Canyon Road by 50%. The rationale for this discount factor is that southern boundary also functions as the northern boundary for the Wildomar store’s trade area7. Thus, it is reasonable to assume that 50% of this space is supported by residents in the Lake Elsinore trade area, while the remaining 50% of this space is supported by residents in the Wildomar trade area. There is approximately 889,024 “unadjusted” square feet retail development surrounding this boundary (see Appendix B, Table B-2 for a list of these shopping centers and stores). Based on the discount factor discussed above, the 889,024 square feet of space along this border has the equivalent impact of 444,512 square feet of existing retail space in a more central portion of the trade area8.
6 According to the ICSC, an outlet mall has a trade area radius of up to 75 miles. Further, the outlet shopping center format is positioned to attract visitors’ retail expenditures. 7 See Economic Impact Report prepared for approved Wildomar Walmart Supercenter. 8 This 444,512 square feet of effective retail space is also accounted for in the Wildomar Economic Impact Report, (prepared under separate cover). Thus, the two economic impact reports, combined, account for the total amount of developed retail space along Railroad Canyon Road.
THE NATELSON DALE GROUP, INC. Urban Decay Study for Proposed Lake Elsinore Walmart
Page 7

The total inventory of “effective” competitive retail space in the trade area is estimated at approximately 1.39 million square feet, as shown in Table II-1 on page 99. Most of the trade area’s retail space includes neighborhood and community-scale facilities focused on the shopping needs of local residents. The overall retail vacancy rate in the trade area is estimated at 8.4%, which is within the range (5% to 10%) generally considered to be reflective of a healthy retail market10. In addition, this vacancy rate is below the current (3rd Quarter, 2013) 10.5% national vacancy rate for strip, neighborhood and community shopping centers, as estimated by REIS, the nation’s leading provider of commercial real estate information11.
It should be noted that TNDG identified two shopping centers with relatively high vacancy rates12. These existing centers are highlighted below:
• The Lake Elsinore Town Center (≈ 180,000 sq. ft.), located on the northwest corner of Malaga Road and Mission Trail in Lake Elsinore, has an estimated 27% vacancy rate.
• The Lake Elsinore Valley Center (≈ 75,000 sq. ft.), located on the southwest corner of Lakeshore Drive and Railroad Canyon Road in Lake Elsinore, has an estimated 31% vacancy rate.
Regarding the significant vacancies identified above, the most important and relevant finding for purposes of this study is that none of the buildings is currently exhibiting urban decay conditions (this finding is documented in the photographs provided in Appendix C). That is, at the time of TNDG’s photo survey (November 2013) none of the buildings exhibited visible signs of significant deterioration of structures and/or their surroundings; none had significant indications of deferred maintenance; none had graffiti; none had boarded-up windows; and there were no indications of landscape neglect (weeds, brown grass, etc.). In addition, property owners are currently actively marketing all of these vacant spaces to prospective tenants. This provides a strong indication that the property owners consider these centers to be fully viable properties.
The breakdown of the existing retail inventory by category is summarized on Table II-1 on the following page.
9 The table also shows the unadjusted inventory of retail space in the trade area, which is approximately 1.84 million square feet. 10 “Real Estate Principles: A Value Approach, 3rd Ed., 2010, Ling and Archer”. According to the standard real estate textbook used in real estate courses at both undergraduate and graduate levels, the natural vacancy rate, for purposes of estimating potential gross income, for apartment, office, and retail properties is 5% to 15%. The textbook indicates that this is the typical vacancy rate when the market is in equilibrium. 11 See http://journalrecord.com/2013/10/10/blog-slow-but-steady-growth-for-national-market/. Accessed on 10/22/2013. 12 Potentially problematic shopping centers include those with a minimum gross leasable area (GLA) of 50,000 square feet and a 20% or higher vacancy rate.
THE NATELSON DALE GROUP, INC. Urban Decay Study for Proposed Lake Elsinore Walmart
Page 8

Table II-1: Inventory of Existing Retail Development
Lake Elsinore Retail Trade Area
Retail Category Square Feet
Total (unadjusted)
Effective 1/
Clothing and Clothing Accessories 45,656 32,763
General Merchandise 304,816 225,946
Home Furnishings and Appliances 41,084 37,867
Specialty/Other 191,450 159,753
Food and Beverage 306,448 222,008
Food Service and Drinking 245,160 194,436
Bldg. Materials & Garden Equip. & Supplies 126,006 122,153
Auto Parts 52,206 28,831
Gasoline Stations 32,763 25,431
Services Space 327,763 227,534
Vacant Space 164,927 117,045
Grand Total 2/ 1,838,279 1,393,767
Source: TNDG (see Appendix B). 1/ See discussion above for discount factor applied to existing retail development along Railroad Canyon Road.
2/ Does not include square feet of Lake Elsinore Outlets (see discussion above).
II-C. IMPACT OF PROPOSED PROJECT’S “GAFO” SALES
It is TNDG’s conclusion that the proposed project’s GAFO13 (General Merchandise, Apparel, Furniture/Appliances and Other/Specialty) sales will not have significant impacts on existing retailers in the trade area. The analysis supporting this conclusion is summarized below.
Project Description: The proposed project would result in a net increase of 130,145 square feet of retail space devoted to GAFO sales. This total includes the non-grocery portion (120,945 square feet) of the proposed Walmart store and the potential specialty retail space proposed for development on Outlot 1.
Comparison of Existing Supply and Demand: TNDG’s demand analysis indicates existing (year 2013) market support for $174.1 million in GAFO retail sales in the trade area. The $174.1 million in market demand translates into approximately 696,272 square feet of GAFO retail space that could be currently supported in the trade area. Based on estimates from the field survey completed by TNDG, there is approximately 456,328 “effective” square feet of existing GAFO space in the trade area. Thus, TNDG estimates that the trade area could currently
13 “GAFO” is a retail industry acronym for the General Merchandise, Apparel, Furniture and Other/Specialty retail categories. The GAFO categories generally correspond to the merchandise mix of a discount department store such as Walmart.
THE NATELSON DALE GROUP, INC. Urban Decay Study for Proposed Lake Elsinore Walmart
Page 9

support approximately 239,944 square feet of additional GAFO space over and above the existing inventory.
Projected Growth in Demand: Within the trade area, potential demand for new retail space in the GAFO retail categories is projected to grow to approximately 291,447 square feet by 2017 (the proposed project’s assumed opening date), 352,284 square feet by 2021, 393,216 square feet by 2023, and 481,415 by 2027. See Table II-2, below, for TNDG’s projection of supportable square feet within GAFO retail categories from 2013 to 2027.
Table II-2: Potential Demand for NEW GAFO Retail Space
Lake Elsinore Retail Trade Area in Square Feet (all numbers are cumulative)
Retail Category
2013 2017 2019 2021 2023 2025 2027
GAFO 1/ 239,944 291,447 318,607 352,284 393,216 436,227 481,415
Source: TNDG.
1/ GAFO = General Merchandise, Apparel, Furniture/Appliances, and Other/Specialty.
Conclusion Regarding Significance of Impact: The proposed project will result in a maximum net increase of 130,145 square feet of GAFO retail space. Given that this space is well within the level of residual market support for GAFO space in the trade area, TNDG does not believe the GAFO components of the proposed project will have significant competitive impacts on existing stores in the trade area.
II-D. IMPACT OF PROPOSED PROJECT’S GROCERY COMPONENT
It is TNDG’s conclusion that a supermarket component of the proposed Walmart is not likely to cause existing supermarkets in the trade area to close. The analysis supporting this conclusion is summarized below.
Project Description: For purposes of this analysis, it is assumed that grocery component of the proposed Walmart would total 39,155 square feet (30,596 square feet of grocery sales area plus 8,559 square feet of grocery support space). TNDG projects that the Walmart grocery space would generate sales levels equivalent to the national average for grocery sales in Walmart stores of approximately $475 per square foot (gross area), or total grocery sales of approximately $18.6 million14.
14 Based on data from Progressive Grocer’s 2012 Super 50 publication, the national average sales volumes for Walmart grocery space is approximately $607.33 per square foot of sales area. Based on the floor area configuration for the grocery component of the proposed Supercenter, the estimated grocery sales area is equal to approximately 78.1% of the grocery component’s gross building space (assuming the canopy area and sales area function as the overall sales area). Thus, the sales volume for the gross building area of the store’s grocery component is estimated at $475 per square foot ($607.33 x 78.1%).
THE NATELSON DALE GROUP, INC. Urban Decay Study for Proposed Lake Elsinore Walmart
Page 10

Comparison of Existing Supply and Demand: The trade area currently has seven supermarkets totaling approximately 173,208 “effective” square feet15. Appendix B, Figure B-1, provides a list of the supermarket centers that includes the stores’ square footages and distances to the proposed project. TNDG’s demand analysis indicates that there is base year (year 2013) demand to support average supermarket sales volumes in the trade area of $497 per square foot at the seven existing supermarkets. In comparison, the industry median for supermarkets is approximately $473 per square foot nationally and $418 in the Western United States. Thus, TNDG estimates that, on average, supermarkets in the trade area currently have the potential to generate sales volumes which are above the Western regional median and the national median.
Projected Growth in Demand: Total demand for supermarket sales in the trade area is projected to increase from approximately $86.1 million in 2013 to approximately $92.5 million in 2017, the assumed opening date of the proposed project. By 2027, total demand for supermarket sales in the trade area is projected to reach approximately $115.9 million (all projections are given in 2013 constant dollars)16. Table II-3, below, evaluates the impact of the proposed project’s grocery sales in terms of the potential reduction in the sales per square foot volume at the existing supermarkets in the trade area.
Table II-3: Potential Sales Impacts to Existing Supermarkets
Grocery Component of Proposed Walmart Lake Elsinore Retail Trade Area
Description 2013 2017 2019 2021 2023 2025 2027 Total Food Sales Demand $122,983 $132,080 $136,877 $142,826 $150,055 $157,652 $165,634 Estimated Supermarket Share 70.0% 70.0% 70.0% 70.0% 70.0% 70.0% 70.0% Total Potential Sales $86,088 $92,456 $95,814 $99,978 $105,039 $110,357 $115,944 --Walmart store 1/ $0 ($18,599) ($18,599) ($18,599) ($18,599) ($18,599) ($18,599) Net Demand Available to Support Existing Supermarkets
$86,088 $73,857 $77,215 $81,379 $86,440 $91,758 $97,345
Existing Supermarket Sq. Ft. 173,208 173,208 173,208 173,208 173,208 173,208 173,208 Potential Sales per Square Foot Existing Supermarkets $497 $426 $446 $470 $499 $530 $562
Source: TNDG; Progressive Grocer, The Super 50, April 2012.
1/ Sales per square foot (gross area) assumptions: $475. Typically, new retail stores operate below average sales volumes in the first few years after opening, and then reach stabilized sales volume levels after being open for a few years. However, in order to remain analytically conservative (i.e., to depict the maximum potential impact), we have assumed that store would reach its full sales potential (based on the chain-wide average) in year 1.
15 Grocery stores with a minimum of 10,000 square feet of building space are considered supermarkets for purposes of this analysis. Regarding the project’s potential to adversely impact non-traditional markets, such as convenience stores, ethnic or specialty markets, and smaller neighborhood grocery stores (which are often below this 10,000 square foot threshold), in the experience of TNDG, these outlets do not tend to compete with traditional supermarkets, and therefore are unlikely to experience lost sales to the project. As shown in Appendix B (Table B-1 and B-2), the square footages for four of the seven stores’ are discounted by 50%, given their location along the Railroad Canyon Road southern border. 16 See Tables III-1 to III-8 and III-13 in Section III for the derivation of this estimate of market support for supermarket sales, along with the projections of growth in demand for supermarket sales.
THE NATELSON DALE GROUP, INC. Urban Decay Study for Proposed Lake Elsinore Walmart
Page 11

Conclusion Regarding Significance of Impact: The above analysis suggests that the development of the proposed project would initially cause potential average sales volumes at the seven existing supermarkets to decrease from the current level of $497 per square foot to approximately $426 per square foot. Although this represents a reduction in the potential sales volume per square foot for existing stores, it is TNDG’s conclusion that the potential average sales level of $426 per square foot in year 2017 is unlikely to be low enough to cause the closure of any of the trade area’s existing supermarkets. At $426 per square foot, potential sales volumes would still be above the Western regional median ($418) and about 90% of the national median ($473). In addition, due to continued population growth in the trade area, the projected sales impacts to existing supermarkets would only be temporary and would be partially offset by growth in retail demand. As shown in Table II-3, potential sales volumes would reach $446 per square foot in 2019, just two years after the proposed project’s projected opening date. This projected sales volume is well above the Western Regional median figure ($418) and 90% of the estimated base year amount ($436). Further, in 2023, just six years after the projected start date, projected potential sales volumes would reach $499 per square foot, which is above the current estimate of $497.
II-E. IMPACT OF PROPOSED PROJECT’S RESTAURANT SPACE
It is TNDG’s conclusion that the restaurants assumed to occupy the proposed project’s space in Out Lots 2 and 3 would not have substantial economic effects on existing restaurant establishments. The analysis supporting this conclusion is summarized below.
Project Description: For purposes of this analysis, it is assumed that the project would include 6,800 square feet of restaurant space.
Comparison Existing Supply and Demand: TNDG’s demand analysis indicates existing (year 2013) potential market support for $64.3 million in restaurant sales in the trade area. The $64.3 million in market demand translates into approximately 214,432 square feet of restaurant space that could be currently supported in the trade area. Based on estimates from the field survey completed by TNDG, there is approximately 194,436 square feet of existing restaurant space in the trade area. Thus, TNDG estimates that the trade area could currently support approximately 19,996 square feet of additional restaurant space over and above the existing inventory.
Projected Growth in Demand: Potential demand for new restaurant space in the trade area is projected to grow to 35,857 square feet by 2017 (the assumed opening date for the proposed project), 54,593 square feet by 2021 and 94,362 square feet by 2027. See Table II-4, below, for TNDG’s projection of supportable square feet within the Food Service and Drinking retail category from 2013 to 2027.
Table II-4: Potential Demand for New Restaurant Retail Space
Lake Elsinore Retail Trade Area In Square Feet (all numbers are cumulative)
Retail Category 2013 2017 2019 2021 2023 2025 2027
Food Service & Drinking 19,996 35,857 44,221 54,593 67,199 80,445 94,362
Source: TNDG.
THE NATELSON DALE GROUP, INC. Urban Decay Study for Proposed Lake Elsinore Walmart
Page 12
Conclusion: The proposed project’s restaurant space, totaling 6,800 square feet, would be well within the envelope of available demand for new space and thus is not likely to result in the closure of existing restaurants.
II-F. IMPACT OF PROPOSED PROJECT’S FUELING STATION/CONVENIENCE STORE
It is TNDG’s conclusion that the proposed project’s potential fueling station/convenience store would not have substantial economic effects on existing fueling stations/convenience stores in the trade area. The analysis supporting this conclusion is summarized below.
Project Description: In the case that Outlot 1 is not developed with the proposed 9,200 square feet of specialty retail space, it would alternatively be developed with a fueling station/car wash and a 3,100 square foot convenience store (see project description on page 1).
Evaluation of Existing Fueling Station Market: According to the most recent data from the SBOE, gasoline stations in California generate approximately $5.5 million in annual sales on average. This figure is calculated by dividing total annual taxable sales ($55,210,075,637) by the number of permits in the state (9,958)17.
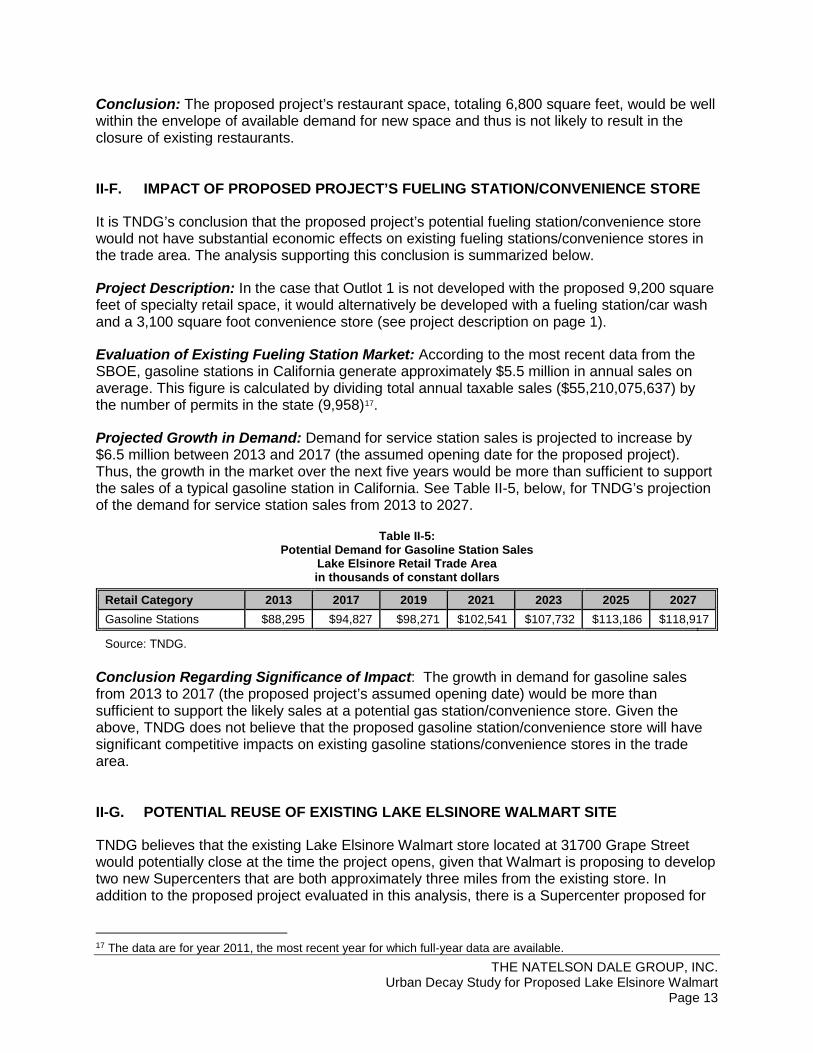
Projected Growth in Demand: Demand for service station sales is projected to increase by $6.5 million between 2013 and 2017 (the assumed opening date for the proposed project). Thus, the growth in the market over the next five years would be more than sufficient to support the sales of a typical gasoline station in California. See Table II-5, below, for TNDG’s projection of the demand for service station sales from 2013 to 2027.
Table II-5: Potential Demand for Gasoline Station Sales
Lake Elsinore Retail Trade Area in thousands of constant dollars
Retail Category 2013 2017 2019 2021 2023 2025 2027
Gasoline Stations $88,295 $94,827 $98,271 $102,541 $107,732 $113,186 $118,917
Source: TNDG.
Conclusion Regarding Significance of Impact: The growth in demand for gasoline sales from 2013 to 2017 (the proposed project’s assumed opening date) would be more than sufficient to support the likely sales at a potential gas station/convenience store. Given the above, TNDG does not believe that the proposed gasoline station/convenience store will have significant competitive impacts on existing gasoline stations/convenience stores in the trade area.
II-G. POTENTIAL REUSE OF EXISTING LAKE ELSINORE WALMART SITE
TNDG believes that the existing Lake Elsinore Walmart store located at 31700 Grape Street would potentially close at the time the project opens, given that Walmart is proposing to develop two new Supercenters that are both approximately three miles from the existing store. In addition to the proposed project evaluated in this analysis, there is a Supercenter proposed for
17 The data are for year 2011, the most recent year for which full-year data are available.
THE NATELSON DALE GROUP, INC. Urban Decay Study for Proposed Lake Elsinore Walmart
Page 13

development in Wildomar near the I-15 and Bundy Canyon Road18. Given that the existing Walmart store is at the midpoint between the two proposed Supercenters, it is reasonable to assume that a potential closure would be equally attributable to the two new proposed Supercenters19.
As shown below on Table II-6, TNDG projects that potential demand would be more than sufficient by 2017 (i.e., the assumed opening date of the proposed project) to support some type of retail reuse of the existing store, even after accounting for the demand that would be absorbed by the proposed store.
Table II-6: Potential Demand for NEW non-grocery Retail Space (Expressed in Square Feet)
Accounting for Potential Reuse of Existing Store
Retail Category 2013 2017 2019 2021 2023 2025 2027 GAFO 239,944 291,447 318,607 352,284 393,216 436,227 481,415 Food Service and Drinking 19,996 35,857 44,221 54,593 67,199 80,445 94,362 Bldg. Matrl./Garden Equip./Supplies 33,625 45,148 51,225 58,759 67,917 77,540 87,650 Auto Parts 31,255 35,699 38,043 40,949 44,482 48,193 52,093 Services Space @ 10% of Total Space 36,091 45,350 50,233 56,287 63,646 71,378 79,502
TOTAL 360,911 453,501 502,329 562,872 636,460 713,783 795,022
Proposed Project (non-grocery) (120,945) (120,945) (120,945) (120,945) (120,945) (120,945) Demand for New Space 360,911 332,556 381,384 441,927 515,515 592,838 674,077
Added Demand Resulting from Potential Vacancy*
63,195 63,195 63,195 63,195 63,195 63,195
Net Demand 360,911 395,751 444,579 505,122 578,710 656,033 737,272
Source: TNDG
Note: Totals may not sum due to rounding.
*Effective square feet of existing Walmart store. Given the existing store’s location on the southern periphery of the trade area boundary, its total square footage (126,390) is discounted by 50% to provide an estimate of the “effective” square feet of competitive space.
18 See the Urban Decay study for the approved Wildomar store, which is also prepared by TNDG. 19 The existing Lake Elsinore Walmart store is located at the southeast corner of Railroad Canyon Road and Grape Street. As discussed on page 7, the store’s total square footage (126,390) is discounted by 50%, due to its location on the southern periphery of the trade area. Thus the store’s “effective” square footage – for purposes of calculating supportable demand in the trade area – is approximately 63,195. The same rationale applies to attributing a potential closure jointly to the two proposed Supercenters. If the existing store were to close, approximately 50% of its individual trade area would be served by the proposed Supercenter evaluated in this analysis, while the remaining 50% would be served by the approved Wildomar Supercenter.
THE NATELSON DALE GROUP, INC. Urban Decay Study for Proposed Lake Elsinore Walmart
Page 14
Although the market demand analysis indicates theoretically there would be sufficient retail demand to support some type of retail reuse of the existing Walmart store immediately after it closes, TNDG has not identified any specific tenants that could potentially re-tenant the site. In addition, Section II-I highlights some caveats that could potentially delay retail reuse of the existing Walmart store.
II-H. CUMULATIVE IMPACTS OF PROJECTS PLANNED IN THE TRADE AREA
Whereas the above sections examine potential impacts strictly related to the proposed project, this section evaluates the cumulative impacts to the market based on all known planned and pending retail development/reuse projects in the trade area. Table II-7, on the following page, provides a list of these planned and pending projects, including the projects’ square footages and current status. As shown on the table, the planned and pending projects in the trade area total approximately 1.65 million square feet, with 1.61 million square feet of non-grocery space and 39,155 square feet of potential grocery space.
THE NATELSON DALE GROUP, INC. Urban Decay Study for Proposed Lake Elsinore Walmart
Page 15

Table II-7: Planned and Pending Retail Projects
Lake Elsinore Retail Trade Area
Retail Square Feet
Project Non-Grocery Grocery Total Status
Proposed Project * Central Ave / Cambern Ave Lake Elsinore 92532
127,745 39,155 166,900 Under Review
Spyglass Ranch East of N Main St / Camino Del Norte Lake Elsinore 92532
145,000 145,000 Approved
Watersedge SW of I-15; Lakeshore Dr / Diamond Dr Lake Elsinore 92530
86,600 86,600 Approved
Diamond Specific Plan ** Diamond Dr, btw Lakeshore Dr and Malaga Rd Lake Elsinore 92530
236,000 236,000 Approved
John Laing Homes (Phase 2) ** West of I-15/Mission Trail, south of Lakeshore Dr Lake Elsinore 92530
58,500 58,500 Approved
Alberhill Ridge (Tract 35001) NW portion of City, South of I-15 Lake Elsinore 92530
679,000 679,000 Approved
Family Dollar Store NWC Riverside Dr / Walnut Dr Lake Elsinore 92530
8,320 8,320 Pending
Fisherman’s Wharf Lakeshore Dr, btw Wilson Way and Bushman Ave Lake Elsinore 92530
12,748 12,748 Proposed
Lakeshore Town Center Near E Lakeshore Dr / S Main St Lake Elsinore 92530
237,400 237,400 Proposed
Wake Rider Resort Near Grand Ave / Riverside Dr Lake Elsinore 92530
11,350 11,350 Pending
Golden Corral Restaurant Central Ave / I-15 Lake Elsinore 92532
7,798 7,798 Pending
Circle K Gas Station * Riverside Dr / Joy St Lake Elsinore 92530
N/A N/A N/A Pending
TOTAL 1,610,461 39,155 1,649,616
Source: Urban Crossing; City of Lake Elsinore, Planning Department; TNDG.
* Square footage total does not include fuel station/convenience store. Impacts for this retail sales category are not evaluated on a per square foot basis. See Section II-F.
** Square feet discounted at 50%, given that projects are located at the trade area's southern border, which separates the Wildomar and Lake Elsinore trade areas. See discussion on page 7.
THE NATELSON DALE GROUP, INC. Urban Decay Study for Proposed Lake Elsinore Walmart
Page 16
As shown above in the status column in Table II-7, most of the proposed retail space is at the preliminary conceptual stage, with only the proposed project and a few relatively smaller projects (Family Dollar, Golden Corral, and Circle K) having leasing commitments from proposed tenants. For example, besides the proposed project evaluated in this analysis, many of the remaining projects are part of Specific Plan studies that have included retail space as part of conceptual development plans. In addition, others have entitlements that may expire in the future (e.g., the Alberhill Ridge project was approved 25 years ago in 1988). Finally, the Fisherman’s Wharf and Lakeshore Town Center proposed projects have not yet submitted applications to the City for development. Nevertheless, consistent with CEQA requirements, the analysis makes the conservative (i.e., worst case) assumption that all known planned and pending projects will ultimately be developed within the time period evaluated in this analysis.
Cumulative Impacts – Non-Grocery/Non-Gasoline Categories
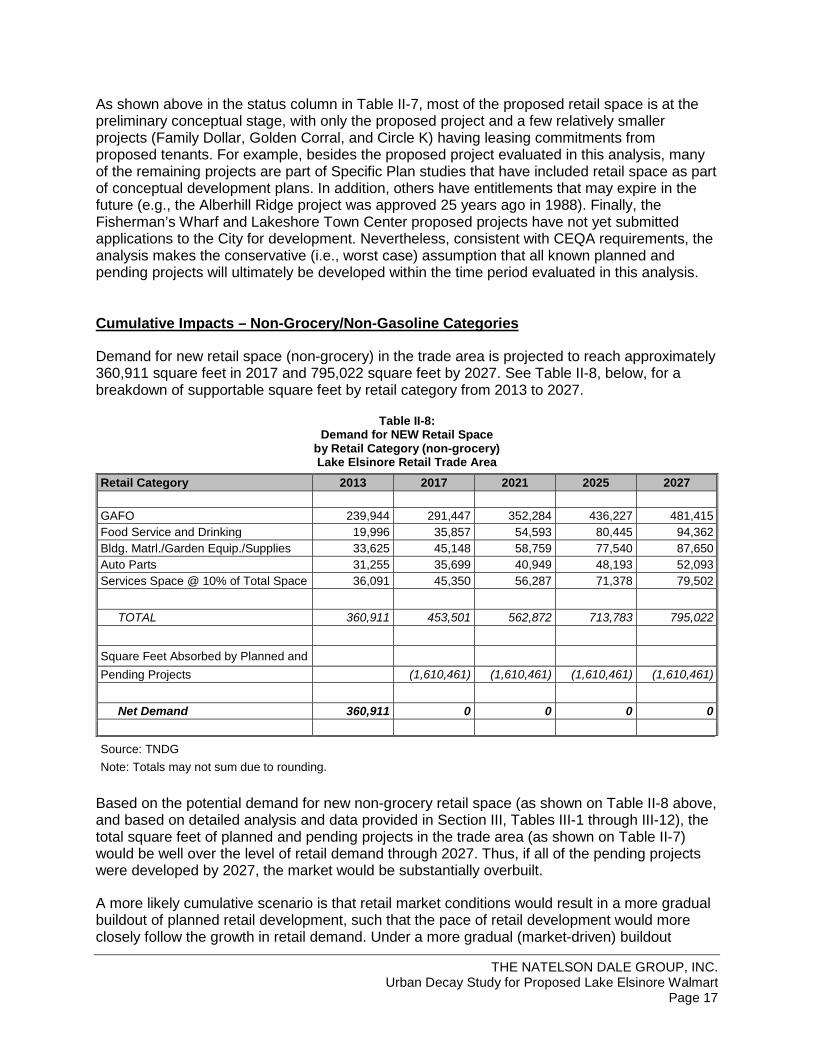
Demand for new retail space (non-grocery) in the trade area is projected to reach approximately 360,911 square feet in 2017 and 795,022 square feet by 2027. See Table II-8, below, for a breakdown of supportable square feet by retail category from 2013 to 2027.
Table II-8: Demand for NEW Retail Space
by Retail Category (non-grocery) Lake Elsinore Retail Trade Area
Retail Category 2013 2017 2021 2025 2027 GAFO 239,944 291,447 352,284 436,227 481,415 Food Service and Drinking 19,996 35,857 54,593 80,445 94,362 Bldg. Matrl./Garden Equip./Supplies 33,625 45,148 58,759 77,540 87,650 Auto Parts 31,255 35,699 40,949 48,193 52,093 Services Space @ 10% of Total Space 36,091 45,350 56,287 71,378 79,502
TOTAL 360,911 453,501 562,872 713,783 795,022
Square Feet Absorbed by Planned and Pending Projects (1,610,461) (1,610,461) (1,610,461) (1,610,461)
Net Demand 360,911 0 0 0 0
Source: TNDG
Note: Totals may not sum due to rounding.
Based on the potential demand for new non-grocery retail space (as shown on Table II-8 above, and based on detailed analysis and data provided in Section III, Tables III-1 through III-12), the total square feet of planned and pending projects in the trade area (as shown on Table II-7) would be well over the level of retail demand through 2027. Thus, if all of the pending projects were developed by 2027, the market would be substantially overbuilt.
A more likely cumulative scenario is that retail market conditions would result in a more gradual buildout of planned retail development, such that the pace of retail development would more closely follow the growth in retail demand. Under a more gradual (market-driven) buildout
THE NATELSON DALE GROUP, INC. Urban Decay Study for Proposed Lake Elsinore Walmart
Page 17

scenario, there is less potential for overbuilt conditions to occur, and consequently a reduced potential for building vacancies and urban decay to follow. Specifically, the following factors are highly likely to mitigate against the development of a significantly overbuilt retail market:
• Probability of development. We have not made any attempt to determine probability of individual proposed projects ultimately being developed. As noted above, the majority of the projects evaluated in this analysis are part of Specific Plan studies that have included retail space as part of conceptual development plans. These potential retail sites would be developed only if and when future demand dictates, which assumption is consistent with existing industry customs and practice. In addition, although some of these projects have had specific zoning approved for retail uses, they still may require project site plans or other entitlements required for retail development. Finally, some of the projects are only proposed and have not yet submitted applications to the City for development of these sites.
• Market area distinction. Evaluating the aggregate square feet proposed in the trade area implicitly assumes that the planned and pending projects’ market areas are identical to the market area for the Lake Elsinore Walmart project. However, the planned and pending projects in Table II-7 will have their own distinct market areas, which only partially overlap with the trade area evaluated in this analysis20. As such, these projects would not be limited to the same “pool” of demand projected in TNDG’s analysis.
• Projected supply increases are typically linked to population growth. The supply of planned retail square feet in the trade area greatly exceeds the amount of population growth projected for the area. Given that population growth largely fuels the demand for new retail space, it is unlikely that all of the proposed projects will be developed as initially proposed. For instance, as individual project proponents advance further along in the planning process, some projects will be scaled back, some will decide to change the overall development mix (e.g., substituting office space for retail space), while others will be completely dropped.
• First-in-line-phenomenon. In markets expected to experience above-average population growth, such as Lake Elsinore and surrounding area, project proponents often attempt to get projects moving along in the entitlement process much earlier than warranted by market demand. By getting their projects “first-in-line”, developers hope to obtain commitments from major national chain retailers before other projects are proposed and entitled. As these key retailers commit to specific projects, other proposed projects, which were likely attempting to attract many of the same tenants, will reevaluate their development plans. In some cases, they will drop development plans altogether; in others, they will shift development proposals to non-retail uses.
• Automatic market corrections. Ultimately, the planned projects will go forward only when retailers commit to locating at the project. In the event that the market becomes saturated with key retailers, major national retailers will choose not locate at some of the proposed projects in the trade area. Without commitments from key anchor tenants, developers will be unable to fill inline and other non-anchor space in their projects. Moreover, without pre-leasing commitments from retailers, many
20 This does not apply to the John Laing Homes (Phase 2) and the Diamond Specific Plan projects. The square feet of these two proposed projects is discounted by 50%, consistent with the approach in this analysis of discounting retail space along Railroad Canyon Road by 50% (see II-B on page 7).
THE NATELSON DALE GROUP, INC. Urban Decay Study for Proposed Lake Elsinore Walmart
Page 18
developers will be unable to obtain development financing for their projects21. In this case, major retailers’ site selection criteria will act as an automatic correction to an oversupply of retail space. Thus, without commitments from key retailers, developers will have to revisit their development proposals and consider alternative uses, other than retail space, for their project sites.
Cumulative Impacts – Supermarket Category
Besides the proposed grocery component of the Walmart Store, there are no other known planned and/or pending supermarket projects in the trade area. Thus, there would be no cumulative impacts in the supermarket category above and beyond the project-specific impacts summarized in Section II-D.
Cumulative Impacts – Gasoline Station Category
As shown on Table II-7, a Circle K gasoline station is proposed for development at the intersection of Riverside Drive and Joy Street in the City of Lake Elsinore. Combined, the gas station/convenience store outlot option (proposed project) and the cumulative project would total approximately $11.0 million in annual sales22. Growth in demand for service station sales is projected to increase by $6.5 million between 2013 and 2017, indicating that the market would be slightly overbuilt in the gasoline stations category if both projects were built by 2017. However, TNDG does not believe these potential sales impacts would be severe enough to cause the closure of any gasoline station in the trade area. Based on the figures discussed above, assuming both gasoline stations are built in this timeframe, excess sales over demand would be approximately $4.5 million in 2017 ($11.0 million - $6.5 million = $4.5 million). However, as a share of total service station demand in 2017, this would equal less than 5% of total trade area demand in 2017 ($94.8 million, see Table II-5 on page 13). Moreover, these potential sales impacts would be temporary, as continued growth in the market would be more than sufficient to support sales of both gasoline stations by 202023.
II-I. POTENTIAL FOR URBAN DECAY
This section evaluates the potential urban decay to occur based on the possibility of store closings or a delay in the reuse of existing vacancies that could result from development of the proposed project. As noted in the above in Sections II-C through II-F, TNDG’s retail demand analysis indicates there would be sufficient marked demand to support the proposed project without negatively impacting existing retailers in the trade area.
As discussed in Section II-H, potentially significant economic impacts are projected under cumulative conditions if all of the planned and pending projects were to be developed by 2027. As described in the previous section, it is extremely unlikely that all of the planned and/or pending projects will developed during this time frame. However, even in the unlikely event that these projects are developed by 2027, it is currently not possible to identify which (non-grocery) retail categories could possibly become overbuilt, or to identify existing businesses in those
21 See Commercial Property Faces Crisis, Wall Street Journal, Mach 26, 2009. 22 See discussion in Section II-F. Average sales are estimated $5.5 per gasoline station, according to sales data from the SBOE. 23 As shown on Table II-5 on page 13, growth in service station demand would reach close to $10.0 million in 2019 and $14.2 million in 2021. Thus, incremental demand for new service station sales would reach approximately $12.1 million by 2020.
THE NATELSON DALE GROUP, INC. Urban Decay Study for Proposed Lake Elsinore Walmart
Page 19

categories which might be forced to close if the potential retail components of these projects are ultimately developed. As previously noted, most of the planned and/or pending projects identified on Table II-7 are at the preliminary conceptual stage without commitments from specific retail tenants. Therefore, any attempt to identify specific vacancies which might possibly result, or to determine the potential for physical deterioration or urban decay, would be speculative in this context. For purposes of evaluating CEQA impacts, it is not required or valid to engage in speculative analysis.
A more likely cumulative scenario is that retail market conditions would result in a more gradual buildout of planned retail development, such that the pace of retail development would more closely follow the growth in retail demand. Under this scenario, there is less potential for overbuilt conditions to occur, and consequently a reduced potential for building vacancies and urban decay to follow. But again, any attempt to identify businesses which might be affected under this scenario, if any, whose closure might ultimately result in urban decay would be speculative, and therefore would not be required under CEQA.
Retail Reuse of Existing Walmart Store
As discussed above in Section II-G, the retail demand analysis indicates there would be sufficient demand, under project-specific conditions, to support some type of retail reuse of the existing Walmart store. In addition, the store is in a favorable location, with good freeway access and visibility (two key site criteria for many retailers), along with being next to a strong concentration of retail development on the west side of I-15. However, based on TNDG’s knowledge, the relative success in reusing closed Walmart stores for other retail uses represents a “mixed bag” of sorts, with some successfully reconfigured for other retail stores while others have remained vacant for several years. Specifically, TNDG has prepared urban decay studies, or is aware of other examples, in the following California cities that involved the simultaneous closing of an existing Walmart store and the development of a Walmart store combining general merchandise and grocery sales.
City Reuse Status
La Quinta Reused as Kohl’s
Palmdale Reused as Burlington Coat Factory and Factory 2U
Palm Springs Cathedral City Walmart closed; building was reoccupied by a 99 Cents Only store; remaining portion of store is still vacant
Hanford Still vacant; purchased by multiple real estate investment firms (2006 and 2010); was considered by Lowe’s for a store site at one time; recently purchased (July 2013)
San Jacinto24 Hemet Walmart closed; purchased by Latham Management and Counseling Service in November 2008; preliminary plans call for a medical plaza featuring a cardiac care center and outpatient facilities
Gilroy Reused as Sergins RV store
Bakersfield (White Lane)
Reused as Fallas Discount store
Source: TNDG; Information from City staff members.
24 Hemet store closed when the San Jacinto store opened.
THE NATELSON DALE GROUP, INC. Urban Decay Study for Proposed Lake Elsinore Walmart
Page 20
It should also be noted that along with potential retail reuse options, the existing Walmart building would also be a candidate for some type of adaptive reuse, including uses ranging from a recreational facility (e.g., bowling alley, ice rink, fitness center) to institutional uses (e.g., government office facility, library, church) to office/service type uses (e.g., call centers). There are numerous examples of vacant “big box” stores being converted for these types of uses25.
However, even if the property owners of the existing store are unable to attract replacement tenant(s) for the Walmart store, the closure of the Walmart store would not necessarily result in long-term physical impacts to the Lake Elsinore City Center shopping center. Without the existing Walmart store, the center would still function as a well-tenanted neighborhood-scale shopping center anchored by the existing Vons store, with it accounting for approximately 44% of the remaining center space. According to the ICSC, supermarket anchors typically account for 30% to 50% of total space in neighborhood centers26.
25 For example, 24-Hour Fitness has opened up fitness clubs in vacant big box stores in a number of markets. 26 ICSC, 2011. U.S. Shopping-Center Classification and Characteristics.
THE NATELSON DALE GROUP, INC. Urban Decay Study for Proposed Lake Elsinore Walmart
Page 21

III. RETAIL DEMAND ANALYSIS METHODOLOGY
This section examines potential retail demand associated with the population residing in the market area that would be served by the proposed project. The analysis projects future retail demand of residents in the City of Lake Elsinore, in addition to adjacent unincorporated areas of Riverside County.
III-A. MARKET AREA BOUNDARIES
The trade area is a customized polygon defined with the following boundaries:
• Western Boundary – The western boundary extends approximately to Riverside County line in the Cleveland National Forest. For the most part, the effective boundary is Grand Avenue, given that there is little developed land beyond this street, outside of a nominal amount of residential and commercial development along the Ortega Highway (State Route 74 [SR-74]). Grand Avenue is approximately 3.6 miles from the proposed project site.
• Eastern Boundary – The eastern boundary starts approximately at the intersection of Railroad Canyon Road and Canyon Hills Road. It extends further along the western boundary of the City of Canyon Lake to Greenwald Avenue/Riverside Street. Finally, at its most northern section, it runs along El Toro Road to the northern boundary. The boundary is approximately 3.0 to 3.5 miles from the proposed project.
• Southern Boundary – The southern boundary starts at SR-74, just south of Tenaja Truck Trail. It extends further in the northerly direction along Stoneman Street to Railroad Canyon road until it reaches the Railroad Canyon Road/Canyon Hills Road intersection (the approximate start of the western boundary). Similar to the western boundary, the relevant western section of the boundary is primarily Grand Avenue, given that there is little developed land beyond this street. The most relevant section of the boundary is Railroad Canyon road, which includes the majority of developed area long the entire boundary. This relevant portion of the southern boundary is approximately 3.0 miles from the project site.
• Northern Boundary – At El Toro Road, the northern boundary reaches as far north as the intersection of Glen Eden Road and Interstate 15 (I-15). The boundary extends further west to the Riverside County line in the Cleveland National Forest, and it is approximately 3.6 miles from the proposed project site.
As discussed in the report Introduction on page 3, a community center of this scale, and with the types of proposed tenants, would typically have a trade area defined by a 3- to 6-mile radius (as suggested by ICSC). Thus, the suggested trade area radius was used as a starting point to design the customized trade area polygon. See Section I for further description on the trade area design.
The trade area boundaries are shown on Figure III-1 on the following page. The trade area is referred to herein as the Lake Elsinore Retail Trade Area (LERTA).
THE NATELSON DALE GROUP, INC. Urban Decay Study for Proposed Lake Elsinore Walmart
Page 22
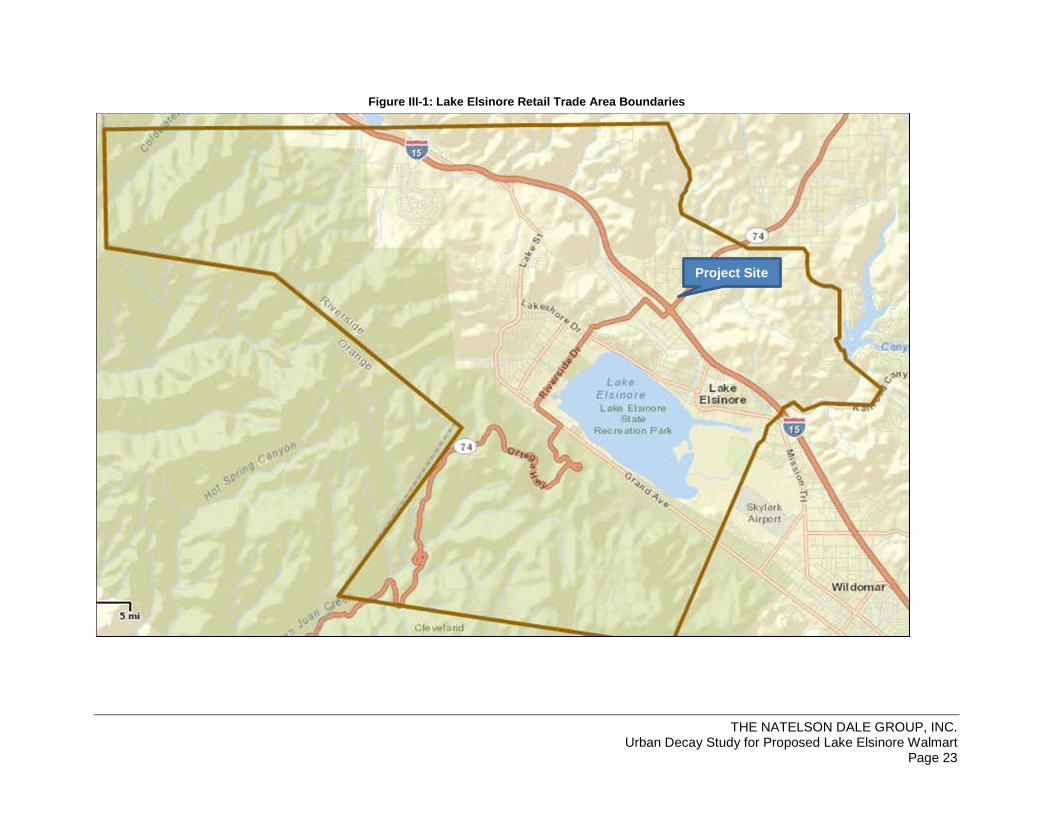
Figure III-1: Lake Elsinore Retail Trade Area Boundaries
Project Site
THE NATELSON DALE GROUP, INC. Urban Decay Study for Proposed Lake Elsinore Walmart
Page 23

III-B. POPULATION AND INCOME LEVELS The population in the trade area is projected as follows:
Table III-1: Population Projections by Year Lake Elsinore Retail Trade Area
Market Area
Estimated 2013
Population
Projected 2017
Population
Projected 2019
Population
Projected 2021
Population
Projected 2023
Population
Projected 2025
Population
Projected 2027
Population LERTA 65,270 70,098 72,644 75,801 79,638 83,670 87,906
Source: ESRI; TNDG.
The above population estimate is from ESRI, a nationally-recognized provider of demographic data, while the future projections are based on growth forecasts developed in conjunction with the Southern California Association of Government’s (SCAG’s) recently released (April 2012) 2012-2035 Regional Transportation Plan (RTP). For the growth projections, the following forecast approach was used:
• Obtain demographic forecasts from SCAG at the Traffic Analysis Zone level (TAZ) level of geography.
• Match the TAZ boundaries to the geographic boundaries of the primary trade area and regional trade area (see Figure III-1).
• Calculate the population growth rate in the TAZs that most closely correspond to the primary and regional trade area boundaries. This calculation shows that SCAG forecasts the following growth rates.
Area 2013 - 2020 2020 - 2027 LERTA 1.8% 2.5%
Per capita income in the LERTA is estimated as follows.
Table III-2: Per Capita Income Level
Lake Elsinore Retail Trade Area
Market Area 2013 Per Capita Income
LERTA $28,171
Source: ESRI, TNDG
The indicated estimates of per capita income were obtained from ESRI and increased 28% by TNDG. The reason for this increase factor is that these income estimates are based on “money income” definition of income utilized by the U.S. Census Bureau. This measure of income is narrower than the “personal income” definition used by the U.S. Department of Commerce. The broader definition includes additional income sources such as fringe benefits (health insurance, retirement funding), imputed income (interest, rent), and direct payments to medical providers by governments. Personal income therefore represents a more complete gauge of a household’s economic status. According to the Center for the Continuing Study of the California
THE NATELSON DALE GROUP, INC. Urban Decay Study for Proposed Lake Elsinore Walmart
Page 24
Economy (CCSCE), personal income is the preferred measure for purposes of projecting a household’s purchasing power (i.e., retail demand). Thus, this analysis increases the ESRI estimates of money income by 28% to estimate per capita personal income27.
III-C. RETAIL SALES DEMAND
The portion of total income spent on retail purchases varies by the income level of the individual household and also varies depending on the strength of the overall economy. In general, the percentage of income spent on retail goods decreases as income levels rise (more affluent households spend more on retail goods in absolute dollar terms, but less as a percentage of their total income).
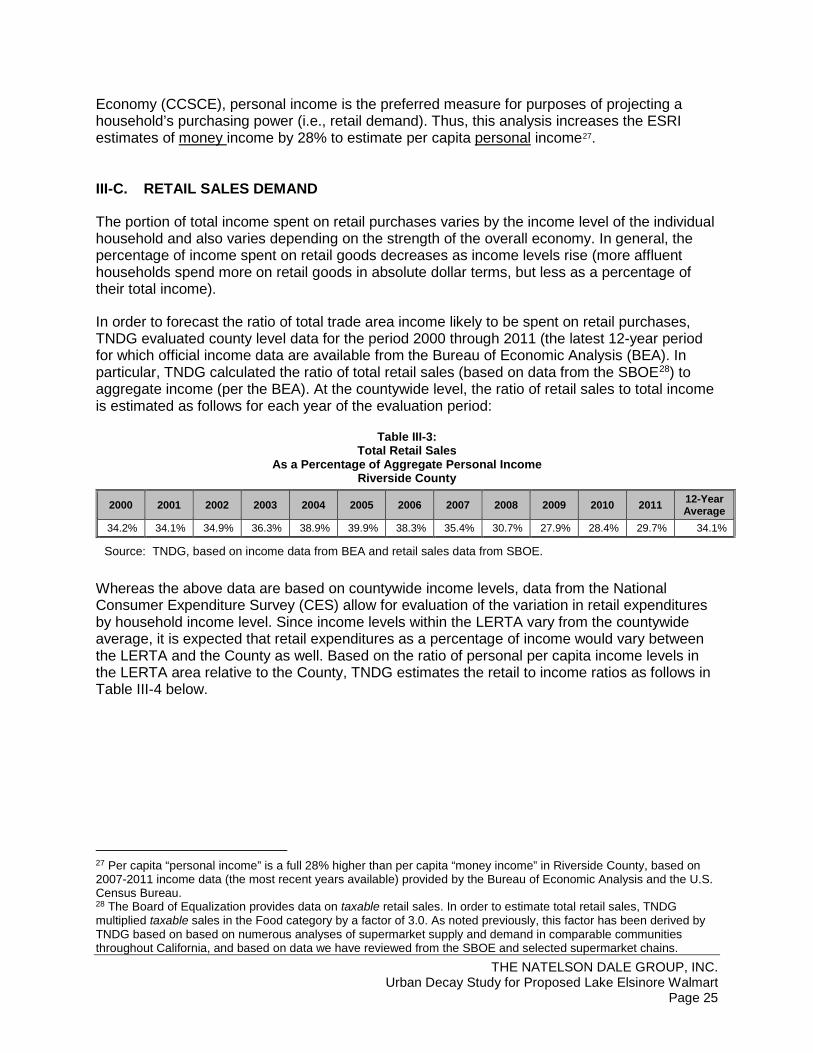
In order to forecast the ratio of total trade area income likely to be spent on retail purchases, TNDG evaluated county level data for the period 2000 through 2011 (the latest 12-year period for which official income data are available from the Bureau of Economic Analysis (BEA). In particular, TNDG calculated the ratio of total retail sales (based on data from the SBOE28) to aggregate income (per the BEA). At the countywide level, the ratio of retail sales to total income is estimated as follows for each year of the evaluation period:
Table III-3: Total Retail Sales
As a Percentage of Aggregate Personal Income Riverside County
2000 2001 2002 2003 2004 2005 2006 2007 2008 2009 2010 2011 12-Year Average
34.2% 34.1% 34.9% 36.3% 38.9% 39.9% 38.3% 35.4% 30.7% 27.9% 28.4% 29.7% 34.1%
Source: TNDG, based on income data from BEA and retail sales data from SBOE.
Whereas the above data are based on countywide income levels, data from the National Consumer Expenditure Survey (CES) allow for evaluation of the variation in retail expenditures by household income level. Since income levels within the LERTA vary from the countywide average, it is expected that retail expenditures as a percentage of income would vary between the LERTA and the County as well. Based on the ratio of personal per capita income levels in the LERTA area relative to the County, TNDG estimates the retail to income ratios as follows in Table III-4 below.
27 Per capita “personal income” is a full 28% higher than per capita “money income” in Riverside County, based on 2007-2011 income data (the most recent years available) provided by the Bureau of Economic Analysis and the U.S. Census Bureau. 28 The Board of Equalization provides data on taxable retail sales. In order to estimate total retail sales, TNDG multiplied taxable sales in the Food category by a factor of 3.0. As noted previously, this factor has been derived by TNDG based on based on numerous analyses of supermarket supply and demand in comparable communities throughout California, and based on data we have reviewed from the SBOE and selected supermarket chains.
THE NATELSON DALE GROUP, INC. Urban Decay Study for Proposed Lake Elsinore Walmart
Page 25

Table III-4:
Total Retail Sales As a Percentage of Aggregate Personal Income
Lake Elsinore Retail Trade Area
Area Income
Index Factor 2000 2005 2011
12-Year Average
County 1.000 34.2% 39.9% 29.7% 34.1%
LERTA 1.008 34.5% 40.3% 29.9% 34.3%
Source: TNDG, based on BEA, SBOE and CES data.
The above data in Table III-3 clearly show the effects of a strong economy from 2004 to 2006 and the severe recession beginning in 2008. In order to remain analytically conservative, TNDG’s analysis assumes that the retail expenditure ratio for the trade area will remain at the 12-year average (as shown in Table III-4 above). It is important to note that TNDG is projecting that the ratio will remain well below the county-indexed 2005 peak of 40.4%.
Table III-5: Income and Retail Demand
Lake Elsinore Retail Trade Area
Market Area 2013 2017 2019 2021 2023 2025 2027
Total Income $1,838,721 $1,974,731 $2,046,454 $2,135,390 $2,243,482 $2,357,068 $2,476,400
Percent of Income Spent
on Retail Goods 34.3% 34.3% 34.3% 34.3% 34.3% 34.3% 34.3%
Potential Retail Sales $630,681 $677,333 $701,934 $732,439 $769,514 $808,474 $849,405
Source: TNDG
III-D. DISTRIBUTION OF RETAIL EXPENDITURES
Projected retail demand from market area residents is disaggregated into various retail categories based upon average retail expenditure patterns observed in Riverside County from 2009 to 2011, the most recent three years for which data are available. The basic distribution of retail sales by retail category is projected as follows in Table III-6 below.
THE NATELSON DALE GROUP, INC. Urban Decay Study for Proposed Lake Elsinore Walmart
Page 26

Table III-6: Distribution of Sales by Category Lake Elsinore Retail Trade Area
Retail Category Distribution Shopper Goods:
Clothing and Clothing Accessories 15.0% General Merchandise 7.0% Home Furnishings and Appliances 4.5% Specialty/Other 8.0%
Subtotal 34.5% Convenience Goods:
Food and Beverage 19.5% Food Service and Drinking 12.0%
Subtotal 31.5% Heavy Commercial Goods:
Bldg. Matrl. & Garden Equip. & Supplies 6.5% Motor Vehicle and Parts Dealers 13.5% Gasoline Stations 14.0%
Subtotal 34.0% Total 100.0%
Source: SBOE; TNDG.
III-E. CAPTURE RATE ANALYSIS
Trade Area Capture Rates
The LERTA capture rates of resident demand are projected to be relatively high due to the tendency of residents to shop relatively close to their homes, especially for convenience goods. Generally, it is reasonable to expect that residents will make the vast majority of their retail purchases locally, provided that a competitive mix of retail stores reflective of consumer needs is available. This is consistent with one of the findings from standard urban land use theory, which indicates, all else equal, the relative attractiveness of retail outlets decreases as travel time increases for the consumer29.
Table III-7, below, shows the projected capture rates of LERTA demand for each retail category.
29 See, for example, Blair, John. Urban & Regional Economics. Irwin, 1991. Hoover, Edgar M. An Introduction to Regional Economics. Alfred A. Knopf, 1975. McCann, Phillip. Urban and Regional Economics. Oxford University Press, 2001.
THE NATELSON DALE GROUP, INC. Urban Decay Study for Proposed Lake Elsinore Walmart
Page 27

Table III-7: Capture Rates of Trade Area Demand
Lake Elsinore Retail Trade Area
Retail Category Capture
Rate Shopper Goods:
Clothing and Clothing Accessories 80% General Merchandise 80% Home Furnishings and Appliances 80% Specialty/Other 80%
Convenience Goods:
Food and Beverage 100% Food Service and Drinking 85%
Heavy Commercial Goods:
Bldg. Matrl. & Garden Equip. & Supplies 95% Motor Vehicle and Parts Dealers 95% Gasoline Stations 100%
Source: TNDG
Generally, this type of analysis would treat the area as a “closed system”; in other words, it would assume that given an adequate supply of retail stores, residents of the market area will make all of their retail purchases somewhere in the trade area. However, in this case, the capture rates have been adjusted downward for two reasons. First, to account for the fact that the LERTA does not have a super-regional shopping center; therefore, it is assumed that the area will always experience some level of retail “leakage” to other areas of Riverside County (e.g., south Corona and/or Temecula). According to the ICSC, 11% of retail space is in super-regional centers (defined here as centers with 800,000 square feet or more of gross leasable area) while the remaining 89% of the space is in neighborhood- to regional-scale centers. Second, as discussed on page 7, the analysis does not evaluate potential demand for outlet center type sales, as the retail inventory excludes the Lake Elsinore Outlets center (due to the much larger trade areas for these types of shopping centers). According to the ICSC, approximately 1% of retail space is in outlet shopping centers. Based on these data, TNDG believes that the LERTA, in the absence of such a super-regional center and the exclusion of potential demand absorbed by outlet shopping centers, could be expected to realistically “capture” up to 88% of retail demand in the shopper goods. To be analytically conservative in this analysis, TNDG has adjusted this shopper goods capture rate down to 80%.
Typically, the LERTA would be projected to potentially capture all of its demand in the Food and Beverage (grocery) category, along with Food Service and Drinking (restaurant), Building Materials/Garden Equipment/Supplies, and Motor Vehicles and Parts Dealers, because of the strong propensity of consumers to purchase goods in these categories as close as possible to their residences. Potential capture rates have also been reduced in the Food Service and Drinking (restaurant), Building Materials/Garden Equipment/Supplies, and Motor Vehicles and Parts Dealers retail categories. The rationale for this reduction in potential capture rates is based on the assumption that some residents will make some purchases in these categories outside of the trade area on shopping trips to super-regional centers that are outside of the LERTA boundaries (see discussion above).
THE NATELSON DALE GROUP, INC. Urban Decay Study for Proposed Lake Elsinore Walmart
Page 28
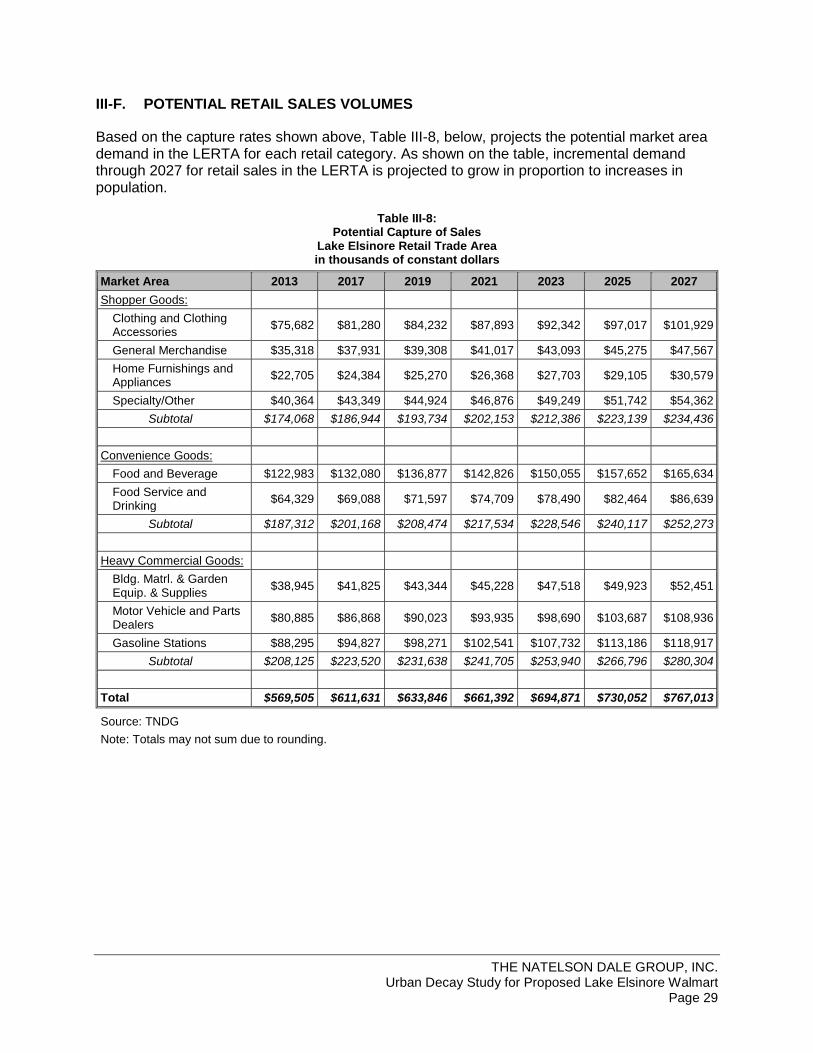
III-F. POTENTIAL RETAIL SALES VOLUMES
Based on the capture rates shown above, Table III-8, below, projects the potential market area demand in the LERTA for each retail category. As shown on the table, incremental demand through 2027 for retail sales in the LERTA is projected to grow in proportion to increases in population.
Table III-8: Potential Capture of Sales
Lake Elsinore Retail Trade Area in thousands of constant dollars
Market Area 2013 2017 2019 2021 2023 2025 2027
Shopper Goods:
Clothing and Clothing Accessories
$75,682 $81,280 $84,232 $87,893 $92,342 $97,017 $101,929
General Merchandise $35,318 $37,931 $39,308 $41,017 $43,093 $45,275 $47,567
Home Furnishings and Appliances
$22,705 $24,384 $25,270 $26,368 $27,703 $29,105 $30,579
Specialty/Other $40,364 $43,349 $44,924 $46,876 $49,249 $51,742 $54,362
Subtotal $174,068 $186,944 $193,734 $202,153 $212,386 $223,139 $234,436
Convenience Goods:
Food and Beverage $122,983 $132,080 $136,877 $142,826 $150,055 $157,652 $165,634
Food Service and Drinking
$64,329 $69,088 $71,597 $74,709 $78,490 $82,464 $86,639
Subtotal $187,312 $201,168 $208,474 $217,534 $228,546 $240,117 $252,273
Heavy Commercial Goods:
Bldg. Matrl. & Garden Equip. & Supplies
$38,945 $41,825 $43,344 $45,228 $47,518 $49,923 $52,451
Motor Vehicle and Parts Dealers
$80,885 $86,868 $90,023 $93,935 $98,690 $103,687 $108,936
Gasoline Stations $88,295 $94,827 $98,271 $102,541 $107,732 $113,186 $118,917
Subtotal $208,125 $223,520 $231,638 $241,705 $253,940 $266,796 $280,304
Total $569,505 $611,631 $633,846 $661,392 $694,871 $730,052 $767,013
Source: TNDG
Note: Totals may not sum due to rounding.
THE NATELSON DALE GROUP, INC. Urban Decay Study for Proposed Lake Elsinore Walmart
Page 29

III-G. SUPPORTABLE RETAIL SPACE
Sales per Square Foot Standards
Projected sales volume requirements per square foot of retail space by retail category are derived from typical sales standards from the Urban Land Institute’s (ULI’s) Dollars & Cents Publication and from typical sales per square foot data from representative stores in each retail category (as reported in the July 2009 issue of Retail MAXIM).
Table III-9: Sales per Foot Standards for Retail Space
Lake Elsinore Retail Trade Area
Retail Category Sales/
Square Foot GAFO 1/ $250 Food Service and Drinking $300 Bldg. Matrl. & Garden Equip. & Supplies $250 Automotive Parts $175
Source: TNDG, based on data published by ULI and Retail Maxim.
1/ GAFO = General Merchandise, Apparel, Furniture/Appliances, Other/Specialty.
Demand for New Retail Space
The sales per square foot standards are applied to the net demand numbers for each relevant retail category, as shown in Table III-10 below. This calculation essentially converts potential sales volumes to supportable square feet of new retail space. Supportable development levels will increase in the future by virtue of anticipated population growth in the LERTA (see Table III-1).
Table III-10: Demand for Retail Space (Non-Grocery)
Lake Elsinore Retail Trade Area
Retail Category 2013 2017 2019 2021 2023 2025 2027 Shopper Goods:
GAFO 696,272 747,775 774,935 808,612 849,544 892,555 937,743 Convenience Goods:
Food Service and Drinking 214,432 230,293 238,657 249,029 261,635 274,881 288,798 Heavy Commercial Goods:
Bldg. Matrl. & Garden Equip. & Supplies
155,778 167,301 173,378 180,912 190,070 199,693 209,803
Auto Parts 1/ 60,086 64,530 66,874 69,780 73,313 77,024 80,924 Total 1,126,568 1,209,899 1,253,844 1,308,333 1,374,562 1,444,153 1,517,268
Source: TNDG
Note: Totals may not sum due to rounding.
1/ Assumes that automotive parts stores account for 13% of sales in overall Automotive group category (based on countywide average in 2011).
THE NATELSON DALE GROUP, INC. Urban Decay Study for Proposed Lake Elsinore Walmart
Page 30

Existing Square Feet of Space
Provided below in Table III-11 is an estimate of the amount of existing square feet of (non-grocery) retail space, broken down by retail category, in the LERTA. As shown in the table, there is an “effective” inventory of approximately 1.15 million square feet of existing retail space (including vacant space) in the LERTA.
Table III-11: Estimate of Existing Effective Square Feet of
Retail Development (Non-Grocery) Lake Elsinore Retail Trade Area
Retail Category Square
Feet Shopper Goods:
GAFO 456,328 Convenience Goods:
Food Service and Drinking 194,436
Heavy Commercial Goods: Bldg. Matrl. & Garden Equip. & Supplies 122,153 Auto Parts 28,831 Service Stations N/A Services Space 227,534 Vacant Space 117,045
Total 1/ 1,146,327
Source: TNDG
1/ The square feet total does differs from the total provided in Table II-1 because it does not include the square feet of existing service station space. Totals are presented in this table for purposes of calculating net demand estimates/projections. Given that the analysis does not calculate demand for service stations in terms of square feet of space, the square feet of gas stations is not provided in this table (see Section II-F for an analysis of demand for service stations sales).
Demand for New Retail Space
By subtracting the existing amount of effective retail space (see Table III-11) from the potential supportable amount (see Table III-10), Table III-12, on the following page, provides the amount of new retail space that could be supported in the LERTA. Currently (as of 2013) the LERTA could support approximately 324,820 square feet of additional retail space. Due to continued population growth (see Table III-1), the LERTA would be able to support an additional 715,520 square feet of retail space, over and above existing levels, by 2027.
In addition, based on analysis of a proprietary database of shopping centers in a major metropolitan area, TNDG has determined that services space (e.g., dry cleaners, hair salons, banks, etc.) accounts for 10% to 25% of total shopping center space, depending on type of retail development (i.e., regional, community, neighborhood, etc.). To be analytically conservative, this analysis assumes that, on average, services space accounts for 10% of total space in typical shopping center settings. Thus, currently (as of 2013) the LERTA could support approximately 360,911 square feet of additional retail and services space. Due to continued
THE NATELSON DALE GROUP, INC. Urban Decay Study for Proposed Lake Elsinore Walmart
Page 31

population growth (see Table III-1), the LERTA would be able to support an additional 795,022 square feet of retail and services space, over and above existing levels, by 2027.
Table III-12:
Demand for NEW Retail Space Lake Elsinore Retail Trade Area
Retail Category 2013 2017 2019 2021 2023 2025 2027 GAFO 239,944 291,447 318,607 352,284 393,216 436,227 481,415 Food Service and Drinking 19,996 35,857 44,221 54,593 67,199 80,445 94,362 Bldg. Matrl./Garden Equip./Supplies 33,625 45,148 51,225 58,759 67,917 77,540 87,650 Automotive Parts 31,255 35,699 38,043 40,949 44,482 48,193 52,093 Total Retail Space 324,820 408,151 452,096 506,585 572,814 642,405 715,520 Services Space @ 10% of Total Space 36,091 45,350 50,233 56,287 63,646 71,378 79,502
TOTAL 360,911 453,501 502,329 562,872 636,460 713,783 795,022
Source: TNDG
Note: Totals may not sum due to rounding.
III-H. DEMAND FOR GROCERY SALES AND SUPPORTABLE GROCERY SPACE
This section evaluates the demand for grocery sales in the LERTA, along with the proposed project’s potential impact on existing supermarkets in the LERTA. Table III-13, on the following page, provides a forecast of total demand in the Food and Beverage category from 2013 to 2027, in addition to the share of food demand that would be captured by supermarkets in the LERTA. TNDG estimates that the seven supermarkets in the LERTA capture approximately 70% of total Food and Beverage demand30. The balance of sales in the overall Food and Beverage category (30% of the total) is captured by smaller convenience and specialty markets.
The table also provides an estimate of the supermarkets’ average sales volumes, in terms of sales per square foot, by dividing the estimate of supermarket demand (in dollars) by the square feet of existing supermarket space. Projections of future average sales volumes are net of the demand that would be absorbed by the proposed grocery component of the Walmart store.
30 In fully developed urban markets, supermarket sales typically account for 80% to 90% of sales in the overall Food category. This factor has been derived by TNDG based on numerous analyses of supermarket supply and demand in urban communities throughout California. In the LERTA, the seven supermarkets account for approximately 78% of the total square feet in the grocery category. All else equal, this factor suggests that supermarkets capture approximately 78% of total Food demand in the LERTA. However, available data from Trade Dimensions International, Inc. and the SBOE suggests that likely share is closer to 70%. Thus, to be conservative, the analysis assumes that supermarkets capture about 70% of total Food demand in the LERTA.
THE NATELSON DALE GROUP, INC. Urban Decay Study for Proposed Lake Elsinore Walmart
Page 32

Table III-13: Demand for Supermarket Sales and Estimate of Sales per Square Foot
Lake Elsinore Retail Trade Area in thousands of constant dollars
Description 2013 2017 2019 2021 2023 2025 2027 Total Food Sales Demand $122,983 $132,080 $136,877 $142,826 $150,055 $157,652 $165,634 Estimated Supermarket Share 70.0% 70.0% 70.0% 70.0% 70.0% 70.0% 70.0% Total Potential Sales $86,088 $92,456 $95,814 $99,978 $105,039 $110,357 $115,944 --Walmart store 1/ $0 ($18,599) ($18,599) ($18,599) ($18,599) ($18,599) ($18,599) Net Demand Available to Support Existing Supermarkets
$86,088 $73,857 $77,215 $81,379 $86,440 $91,758 $97,345
Existing Supermarket Sq. Ft. 173,208 173,208 173,208 173,208 173,208 173,208 173,208 Potential Sales per Square Foot
Existing Supermarkets $497 $426 $446 $470 $499 $530 $562
Source: TNDG; Progressive Grocer, The Super 50, April 2012.
1/ Sales per square foot (gross area) assumptions: $475. Typically, new retail stores operate below average sales volumes in the first few years after opening, and then reach stabilized sales volume levels after being open for a few years. However, in order to remain analytically conservative (i.e., to depict the maximum potential impact), we have assumed that store would reach its full sales potential (based on the chain-wide average) in year 1.
THE NATELSON DALE GROUP, INC. Urban Decay Study for Proposed Lake Elsinore Walmart
Page 33

APPENDIX A:
RETAIL DEMAND ANALYSIS LAKE ELSINORE RETAIL TRADE AREA

Table A-1PopulationLake Elsinore Retail Trade Area
Area 2013 2017 2019 2021 2023 2025 2027
Lake Elsinore Retail Trade Area 65,270 70,098 72,644 75,801 79,638 83,670 87,906
Total 65,270 70,098 72,644 75,801 79,638 83,670 87,906
Source: U.S. Census Bureau; ESRI; Southern California Association of Governments (SCAG).
Table A-2Per Capita Income ProjectionsLake Elsinore Retail Trade AreaIn constant dollars
2013
Lake Elsinore Retail Trade Area $28,171
Annual Increase Factor 0.00%
Area 2013 2017 2019 2021 2023 2025 2027
Lake Elsinore Retail Trade Area $28,171 $28,171 $28,171 $28,171 $28,171 $28,171 $28,171
Source: U.S. Census Bureau; ESRI; TNDG.

Table A-3Total Income and Potential Retail Sales ProjectionsLake Elsinore Retail Trade AreaIn thousands of constant dollars
2013 2017 2019 2021 2023 2025 2027
Percent of Income Spent on Retail Goods 34.3% 34.3% 34.3% 34.3% 34.3% 34.3% 34.3%
Area 2013 2017 2019 2021 2023 2025 2027
Total Income:Lake Elsinore Retail Trade Area $1,838,721 $1,974,731 $2,046,454 $2,135,390 $2,243,482 $2,357,068 $2,476,400
Total $1,838,721 $1,974,731 $2,046,454 $2,135,390 $2,243,482 $2,357,068 $2,476,400
Potential Retail Sales:Lake Elsinore Retail Trade Area $630,681 $677,333 $701,934 $732,439 $769,514 $808,474 $849,405
Total $630,681 $677,333 $701,934 $732,439 $769,514 $808,474 $849,405
Source: Bureau of Economic Analysis (BEA); Consumer Expenditure Survey (CES); State Board of Equalization (SBOE); TNDG.

Table A-4Distribution of Retail Sales by Retail CategoryLake Elsinore Retail Trade Area
%Distribution %Distribution %Distribution %Distribution %Distribution %Distribution %DistributionRetail Category 2013 2017 2019 2021 2023 2025 2027
Shopper Goods:Clothing and Clothing Accessories 15.0% 15.0% 15.0% 15.0% 15.0% 15.0% 15.0%General Merchandise 7.0% 7.0% 7.0% 7.0% 7.0% 7.0% 7.0%Home Furnishings and Appliances 4.5% 4.5% 4.5% 4.5% 4.5% 4.5% 4.5%Specialty/Other 8.0% 8.0% 8.0% 8.0% 8.0% 8.0% 8.0%
Subtotal 34.5% 34.5% 34.5% 34.5% 34.5% 34.5% 34.5%
Convenience Goods:Food and Beverage 19.5% 19.5% 19.5% 19.5% 19.5% 19.5% 19.5%Food Service and Drinking 12.0% 12.0% 12.0% 12.0% 12.0% 12.0% 12.0%
Subtotal 31.5% 31.5% 31.5% 31.5% 31.5% 31.5% 31.5%
Heavy Commercial Goods:Bldg. Matrl. and Garden Equip. and Supplies 6.5% 6.5% 6.5% 6.5% 6.5% 6.5% 6.5%Motor Vehicle and Parts Dealers 13.5% 13.5% 13.5% 13.5% 13.5% 13.5% 13.5%Gasoline Stations 14.0% 14.0% 14.0% 14.0% 14.0% 14.0% 14.0%
Subtotal 34.0% 34.0% 34.0% 34.0% 34.0% 34.0% 34.0%
Total 100.0% 100.0% 100.0% 100.0% 100.0% 100.0% 100.0%
Source: TNDG, based on historic trends (2010-11 taxable sales) reported by the SBOE for Riverside County.

Table A-5Projected Demand for Retail Sales by Major Retail CategoryLake Elsinore Retail Trade AreaIn thousands of constant dollars
Retail Category 2013 2017 2019 2021 2023 2025 2027
Shopper Goods:Clothing and Clothing Accessories $94,602 $101,600 $105,290 $109,866 $115,427 $121,271 $127,411General Merchandise $44,148 $47,413 $49,135 $51,271 $53,866 $56,593 $59,458Home Furnishings and Appliances $28,381 $30,480 $31,587 $32,960 $34,628 $36,381 $38,223Specialty/Other $50,455 $54,187 $56,155 $58,595 $61,561 $64,678 $67,952
Subtotal $217,585 $233,680 $242,167 $252,691 $265,482 $278,924 $293,045
Convenience Goods:Food and Beverage $122,983 $132,080 $136,877 $142,826 $150,055 $157,652 $165,634Food Service and Drinking $75,682 $81,280 $84,232 $87,893 $92,342 $97,017 $101,929
Subtotal $198,665 $213,360 $221,109 $230,718 $242,397 $254,669 $267,563
Heavy Commercial Goods:Bldg. Matrl. and Garden Equip. and Supplies $40,994 $44,027 $45,626 $47,609 $50,018 $52,551 $55,211Motor Vehicle and Parts Dealers $85,142 $91,440 $94,761 $98,879 $103,884 $109,144 $114,670Gasoline Stations $88,295 $94,827 $98,271 $102,541 $107,732 $113,186 $118,917
Subtotal $214,432 $230,293 $238,657 $249,029 $261,635 $274,881 $288,798
Total $630,681 $677,333 $701,934 $732,439 $769,514 $808,474 $849,405
Source: TNDG

Table A-6Potential Capture of Market Area Demand for Retail Sales Expressed in PercentagesLake Elsinore Retail Trade Area
Retail Category 2013 2017 2019 2021 2023 2025 2027
Shopper Goods:Clothing and Clothing Accessories 80.0% 80.0% 80.0% 80.0% 80.0% 80.0% 80.0%General Merchandise 80.0% 80.0% 80.0% 80.0% 80.0% 80.0% 80.0%Home Furnishings and Appliances 80.0% 80.0% 80.0% 80.0% 80.0% 80.0% 80.0%Specialty/Other 80.0% 80.0% 80.0% 80.0% 80.0% 80.0% 80.0%
Convenience Goods:Food and Beverage 100.0% 100.0% 100.0% 100.0% 100.0% 100.0% 100.0%Food Service and Drinking 85.0% 85.0% 85.0% 85.0% 85.0% 85.0% 85.0%
Heavy Commercial Goods:Bldg. Matrl. and Garden Equip. and Supplies 95.0% 95.0% 95.0% 95.0% 95.0% 95.0% 95.0%Motor Vehicle and Parts Dealers 95.0% 95.0% 95.0% 95.0% 95.0% 95.0% 95.0%Gasoline Stations 100.0% 100.0% 100.0% 100.0% 100.0% 100.0% 100.0%
Source: TNDG
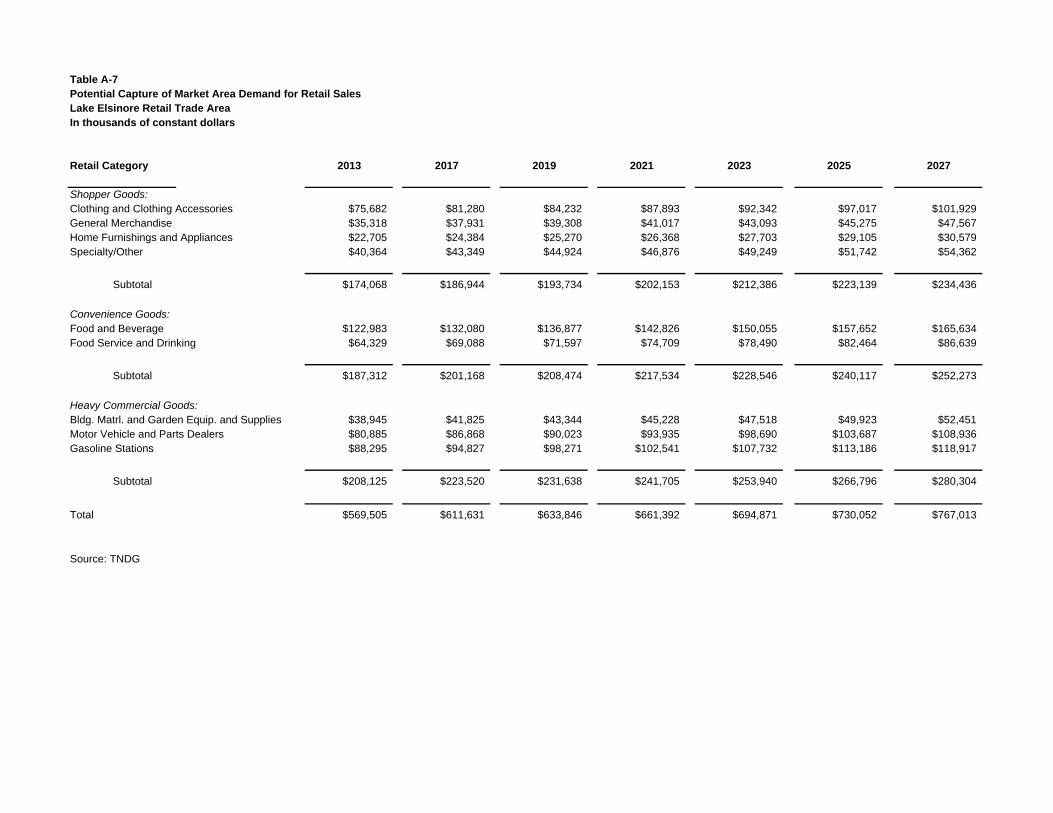
Table A-7Potential Capture of Market Area Demand for Retail SalesLake Elsinore Retail Trade AreaIn thousands of constant dollars
Retail Category 2013 2017 2019 2021 2023 2025 2027
Shopper Goods:Clothing and Clothing Accessories $75,682 $81,280 $84,232 $87,893 $92,342 $97,017 $101,929General Merchandise $35,318 $37,931 $39,308 $41,017 $43,093 $45,275 $47,567Home Furnishings and Appliances $22,705 $24,384 $25,270 $26,368 $27,703 $29,105 $30,579Specialty/Other $40,364 $43,349 $44,924 $46,876 $49,249 $51,742 $54,362
Subtotal $174,068 $186,944 $193,734 $202,153 $212,386 $223,139 $234,436
Convenience Goods:Food and Beverage $122,983 $132,080 $136,877 $142,826 $150,055 $157,652 $165,634Food Service and Drinking $64,329 $69,088 $71,597 $74,709 $78,490 $82,464 $86,639
Subtotal $187,312 $201,168 $208,474 $217,534 $228,546 $240,117 $252,273
Heavy Commercial Goods:Bldg. Matrl. and Garden Equip. and Supplies $38,945 $41,825 $43,344 $45,228 $47,518 $49,923 $52,451Motor Vehicle and Parts Dealers $80,885 $86,868 $90,023 $93,935 $98,690 $103,687 $108,936Gasoline Stations $88,295 $94,827 $98,271 $102,541 $107,732 $113,186 $118,917
Subtotal $208,125 $223,520 $231,638 $241,705 $253,940 $266,796 $280,304
Total $569,505 $611,631 $633,846 $661,392 $694,871 $730,052 $767,013
Source: TNDG

Table A-8Sales Per Square Foot Standards (non-grocery categories)Lake Elsinore Retail Trade AreaExpressed in Sales/Square Feet
Retail Category Sales/Square Feet
Shopper Goods:GAFO* $250Food Service and Drinking $300Bldg. Matrl. and Garden Equip. and Supplies $250Automotive Parts $175
*GAFO: General Merchandise, Apparel, Furniture/Appliances, Other/Specialty
Source: Retail Maxim; Urban Land Institute (ULI); TNDG.

Table A-9Potential Demand for Retail Space (non-grocery categories)Lake Elsinore Retail Trade AreaExpressed in Square Feet
Retail Category 2013 2017 2019 2021 2023 2025 2027
Shopper Goods:GAFO Total 696,272 747,775 774,935 808,612 849,544 892,555 937,743
Convenience Goods:Food Service and Drinking 214,432 230,293 238,657 249,029 261,635 274,881 288,798
Heavy Commercial Goods:Bldg. Matrl. and Garden Equip. and Supplies 155,778 167,301 173,378 180,912 190,070 199,693 209,803Automotive Parts* 60,086 64,530 66,874 69,780 73,313 77,024 80,924Gasoline Stations N/A N/A N/A N/A N/A N/A N/A
Subtotal 215,864 231,831 240,252 250,692 263,383 276,717 290,727
Total Retail Space 1,126,568 1,209,899 1,253,844 1,308,333 1,374,562 1,444,153 1,517,268
*Assumes that automotive parts stores account for 13% of sales in overall Automotive group category (based on countywide average in 2011).
Source: TNDG

Table A-10Existing Square Feet of Retail SpaceLake Elsinore Retail Trade Area
Retail Category Square Feet
Shopper Goods:GAFO Total 456,328
Convenience Goods:Food and Beverage 222,008Food Service and Drinking 194,436
Subtotal 416,444
Heavy Commercial Goods:Bldg. Matrl. and Garden Equip. and Supplies 122,153Automotive Parts 28,831Gasoline Stations N/A
Subtotal 150,984
Services Space 227,534Vacant 117,045
GRAND TOTAL 1,368,335
Source: TNDG
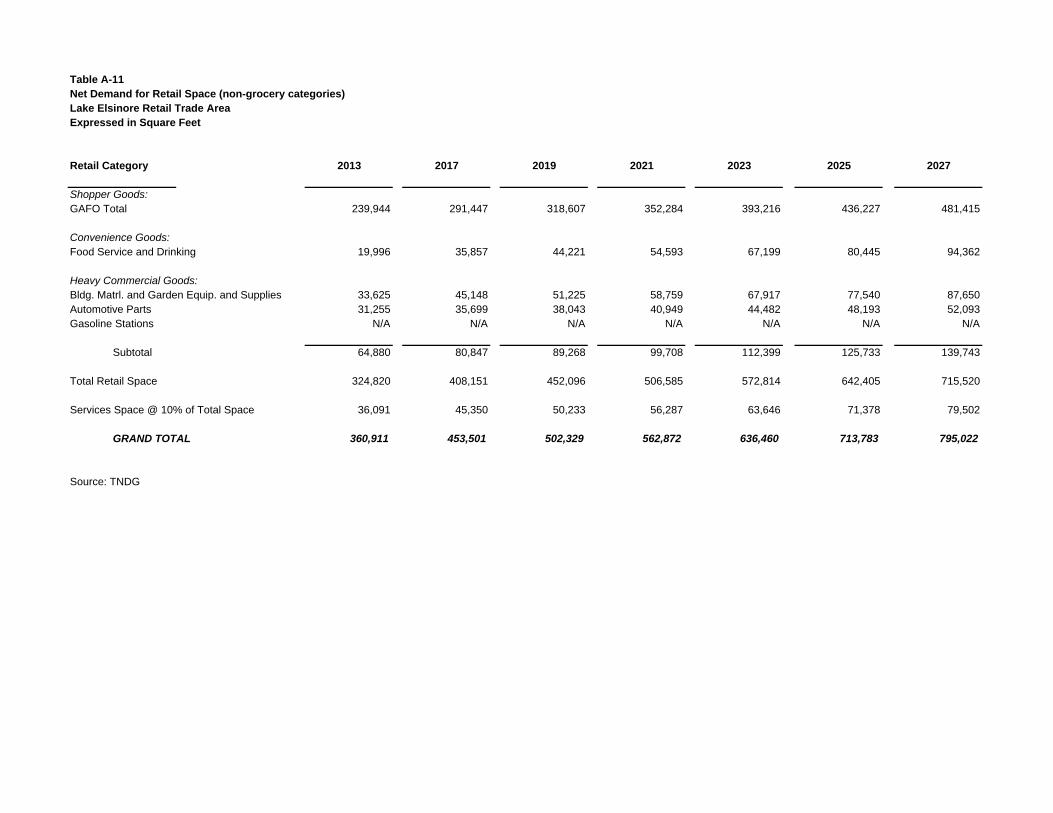
Table A-11Net Demand for Retail Space (non-grocery categories)Lake Elsinore Retail Trade AreaExpressed in Square Feet
Retail Category 2013 2017 2019 2021 2023 2025 2027
Shopper Goods:GAFO Total 239,944 291,447 318,607 352,284 393,216 436,227 481,415
Convenience Goods:Food Service and Drinking 19,996 35,857 44,221 54,593 67,199 80,445 94,362
Heavy Commercial Goods:Bldg. Matrl. and Garden Equip. and Supplies 33,625 45,148 51,225 58,759 67,917 77,540 87,650Automotive Parts 31,255 35,699 38,043 40,949 44,482 48,193 52,093Gasoline Stations N/A N/A N/A N/A N/A N/A N/A
Subtotal 64,880 80,847 89,268 99,708 112,399 125,733 139,743
Total Retail Space 324,820 408,151 452,096 506,585 572,814 642,405 715,520
Services Space @ 10% of Total Space 36,091 45,350 50,233 56,287 63,646 71,378 79,502
GRAND TOTAL 360,911 453,501 502,329 562,872 636,460 713,783 795,022
Source: TNDG
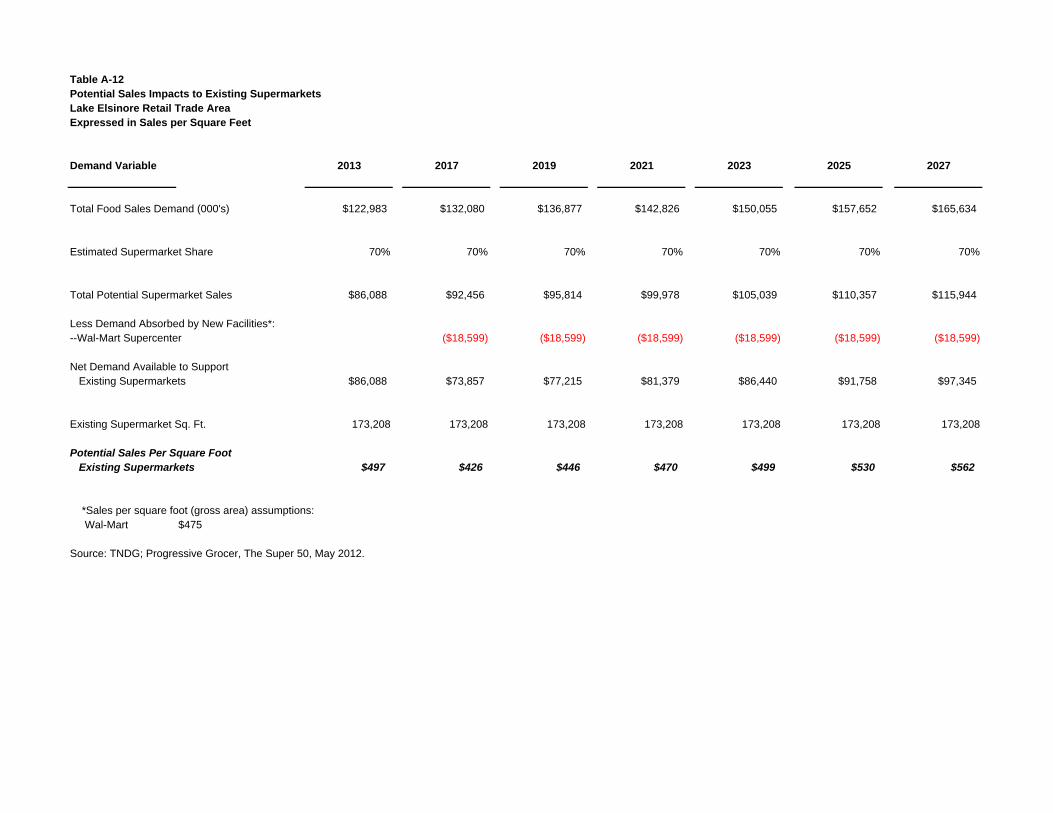
Table A-12Potential Sales Impacts to Existing SupermarketsLake Elsinore Retail Trade AreaExpressed in Sales per Square Feet
Demand Variable 2013 2017 2019 2021 2023 2025 2027
Total Food Sales Demand (000's) $122,983 $132,080 $136,877 $142,826 $150,055 $157,652 $165,634
Estimated Supermarket Share 70% 70% 70% 70% 70% 70% 70%
Total Potential Supermarket Sales $86,088 $92,456 $95,814 $99,978 $105,039 $110,357 $115,944
Less Demand Absorbed by New Facilities*:--Wal-Mart Supercenter ($18,599) ($18,599) ($18,599) ($18,599) ($18,599) ($18,599)
Net Demand Available to Support Existing Supermarkets $86,088 $73,857 $77,215 $81,379 $86,440 $91,758 $97,345
Existing Supermarket Sq. Ft. 173,208 173,208 173,208 173,208 173,208 173,208 173,208
Potential Sales Per Square Foot Existing Supermarkets $497 $426 $446 $470 $499 $530 $562
*Sales per square foot (gross area) assumptions: Wal-Mart $475
Source: TNDG; Progressive Grocer, The Super 50, May 2012.

APPENDIX B:
RETAIL INVENTORY LAKE ELSINORE RETAIL TRADE AREA
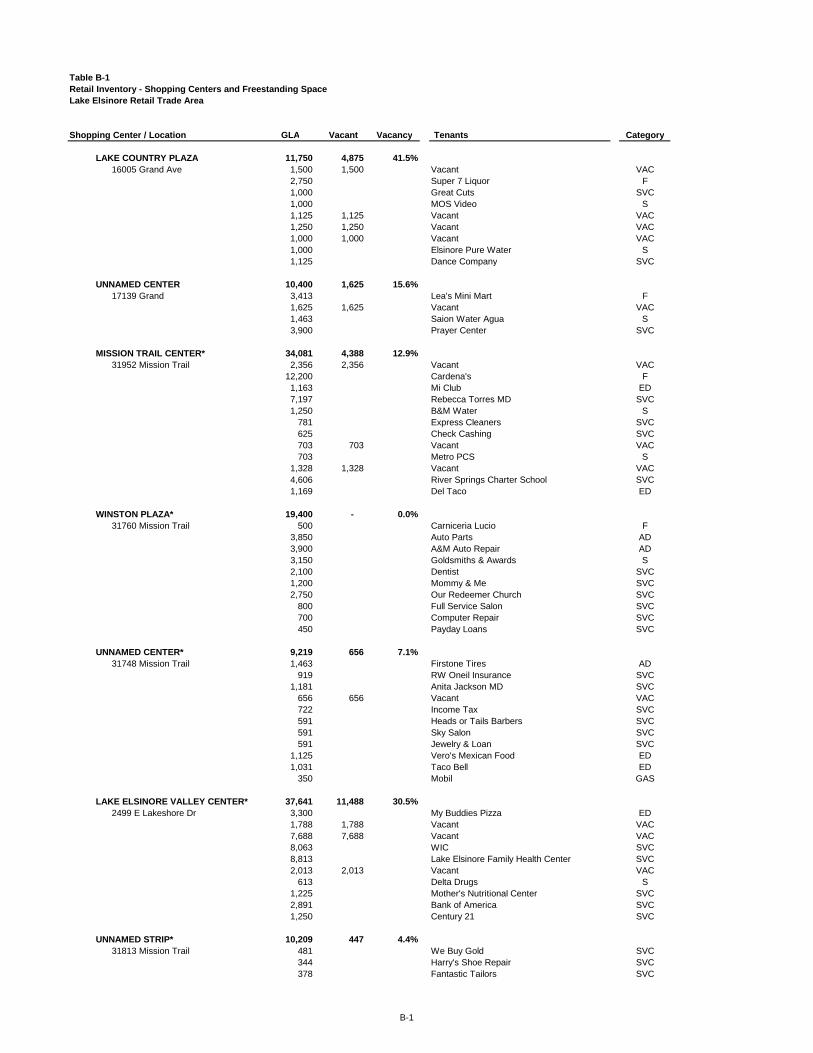
Table B-1Retail Inventory - Shopping Centers and Freestanding SpaceLake Elsinore Retail Trade Area
Shopping Center / Location GLA Vacant Vacancy Tenants Category
LAKE COUNTRY PLAZA 11,750 4,875 41.5%16005 Grand Ave 1,500 1,500 Vacant VAC
2,750 Super 7 Liquor F1,000 Great Cuts SVC1,000 MOS Video S1,125 1,125 Vacant VAC1,250 1,250 Vacant VAC1,000 1,000 Vacant VAC1,000 Elsinore Pure Water S1,125 Dance Company SVC
UNNAMED CENTER 10,400 1,625 15.6%17139 Grand 3,413 Lea's Mini Mart F
1,625 1,625 Vacant VAC1,463 Saion Water Agua S3,900 Prayer Center SVC
MISSION TRAIL CENTER* 34,081 4,388 12.9%31952 Mission Trail 2,356 2,356 Vacant VAC
12,200 Cardena's F1,163 Mi Club ED7,197 Rebecca Torres MD SVC1,250 B&M Water S
781 Express Cleaners SVC625 Check Cashing SVC703 703 Vacant VAC703 Metro PCS S
1,328 1,328 Vacant VAC4,606 River Springs Charter School SVC1,169 Del Taco ED
WINSTON PLAZA* 19,400 - 0.0%31760 Mission Trail 500 Carniceria Lucio F
3,850 Auto Parts AD3,900 A&M Auto Repair AD3,150 Goldsmiths & Awards S2,100 Dentist SVC1,200 Mommy & Me SVC2,750 Our Redeemer Church SVC
800 Full Service Salon SVC700 Computer Repair SVC450 Payday Loans SVC
UNNAMED CENTER* 9,219 656 7.1%31748 Mission Trail 1,463 Firstone Tires AD
919 RW Oneil Insurance SVC1,181 Anita Jackson MD SVC
656 656 Vacant VAC722 Income Tax SVC591 Heads or Tails Barbers SVC591 Sky Salon SVC591 Jewelry & Loan SVC
1,125 Vero's Mexican Food ED1,031 Taco Bell ED
350 Mobil GAS
LAKE ELSINORE VALLEY CENTER* 37,641 11,488 30.5%2499 E Lakeshore Dr 3,300 My Buddies Pizza ED
1,788 1,788 Vacant VAC7,688 7,688 Vacant VAC8,063 WIC SVC8,813 Lake Elsinore Family Health Center SVC2,013 2,013 Vacant VAC
613 Delta Drugs S1,225 Mother's Nutritional Center SVC2,891 Bank of America SVC1,250 Century 21 SVC
UNNAMED STRIP* 10,209 447 4.4%31813 Mission Trail 481 We Buy Gold SVC
344 Harry's Shoe Repair SVC378 Fantastic Tailors SVC
B-1

Shopping Center / Location GLA Vacant Vacancy Tenants Category
344 Glamour Beauty SVC413 Income Tax SVC481 Liberty Smoke Shop S378 Lake Elsinore Florist S241 Ed's Coins S
1,306 Mike's Hobbies S481 The Herb Cottage S447 447 Vacant VAC344 Copies SVC688 Income Tax SVC619 KC Flooring BHG447 Coin Shop S309 Carlsbad Golf S413 Ronnie's Jewelry A447 Farmers SVC309 Preformance Outfitters A309 Gerryann's Flowers S138 Boost Mobile S309 Affordable Print & Mail SVC584 Castinet.com SVC
LAKE ELSINORE CITY CENTER* 123,229 - 0.0%31700 Grape St 2,019 Basie 21 A
1,594 Diamond Dentist SVC1,381 LA Nails & Spa II SVC
678 Smoke Shop S775 GNC S872 Cleaners SVC775 The UPS Store SVC872 Sally Beauty Salon SVC
1,163 Sushi Zen ED26,625 Vons F4,844 O'Reily Auto Parts AD3,906 Fashion Today A4,297 Payless Shoes A3,266 Goodwill S
63,195 Walmart GM2,188 Denny's ED3,331 Wells Fargo SVC1,450 El Pollo Loco ED
UNNAMED CENTER* 10,497 - 0.0%351 Railroad Canyon Rd 2,231 Tuscany Dental SVC
1,575 Tuscany Wine & Liquor F1,463 Coffee Bar ED1,013 Orthodontist SVC
450 Fine Cuts SVC844 Preformance Realty Group SVC956 Eileen's Cleaners SVC638 Peace of Zen SVC691 99 Cent Store GM638 State Farm SVC
LAKE ELSINORE MARKETPLACE 371,313 2,700 0.7%29335 Central Ave 5,038 Chili's ED
3,000 Del Taco ED2,900 Panda Express ED4,550 Wells Fargo SVC2,625 Wendy's ED4,263 Archiblads ED1,181 Valvoline AD2,700 Arco GAS1,650 The Coffee Bean ED1,050 iTan SVC1,350 Kut A Beauty SVC1,950 Tacos Del Mar ED1,500 Hawaiian BBQ ED1,350 SubMarnia ED1,350 1,350 Vacant VAC2,850 Navy Federal Credit Union SVC1,200 Juice it Up ED2,025 At&t S1,350 Great Clips SVC1,519 Professio Nails & Spa SVC1,350 1,350 Vacant VAC6,413 Dentist SVC
115,700 Lowe's BHG
B-2
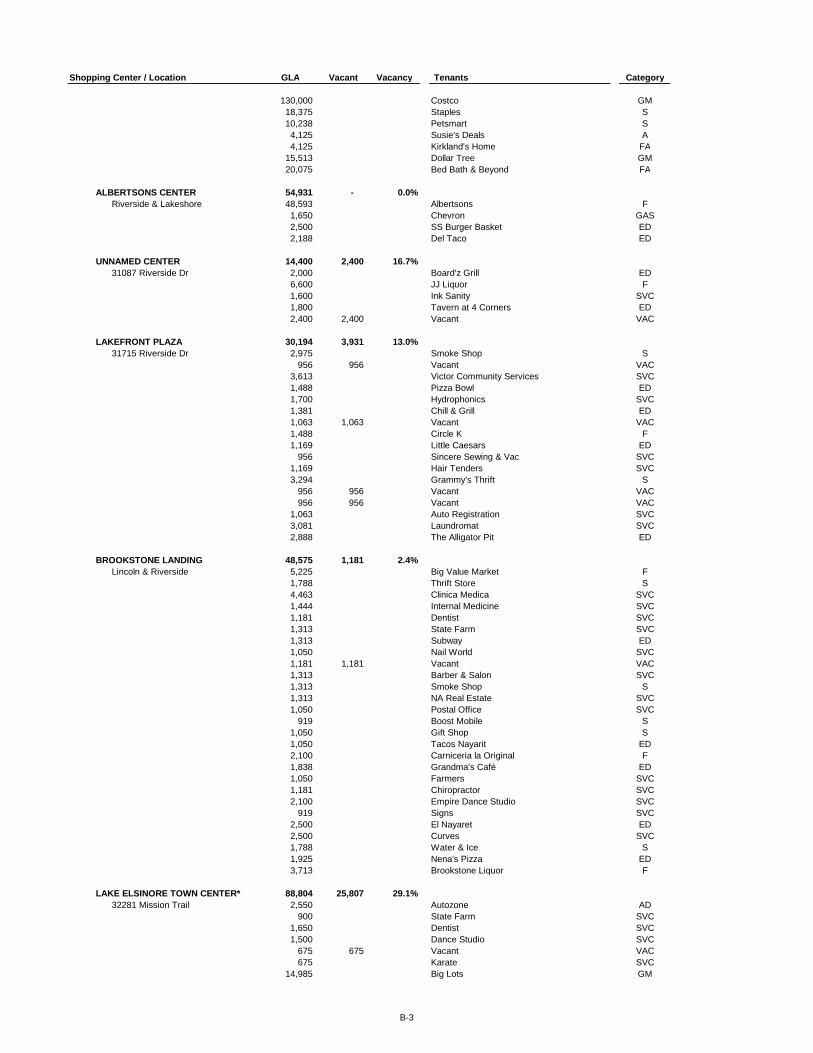
Shopping Center / Location GLA Vacant Vacancy Tenants Category
130,000 Costco GM18,375 Staples S10,238 Petsmart S4,125 Susie's Deals A4,125 Kirkland's Home FA
15,513 Dollar Tree GM20,075 Bed Bath & Beyond FA
ALBERTSONS CENTER 54,931 - 0.0%Riverside & Lakeshore 48,593 Albertsons F
1,650 Chevron GAS2,500 SS Burger Basket ED2,188 Del Taco ED
UNNAMED CENTER 14,400 2,400 16.7%31087 Riverside Dr 2,000 Board'z Grill ED
6,600 JJ Liquor F1,600 Ink Sanity SVC1,800 Tavern at 4 Corners ED2,400 2,400 Vacant VAC
LAKEFRONT PLAZA 30,194 3,931 13.0%31715 Riverside Dr 2,975 Smoke Shop S
956 956 Vacant VAC3,613 Victor Community Services SVC1,488 Pizza Bowl ED1,700 Hydrophonics SVC1,381 Chill & Grill ED1,063 1,063 Vacant VAC1,488 Circle K F1,169 Little Caesars ED
956 Sincere Sewing & Vac SVC1,169 Hair Tenders SVC3,294 Grammy's Thrift S
956 956 Vacant VAC956 956 Vacant VAC
1,063 Auto Registration SVC3,081 Laundromat SVC2,888 The Alligator Pit ED
BROOKSTONE LANDING 48,575 1,181 2.4%Lincoln & Riverside 5,225 Big Value Market F
1,788 Thrift Store S4,463 Clinica Medica SVC1,444 Internal Medicine SVC1,181 Dentist SVC1,313 State Farm SVC1,313 Subway ED1,050 Nail World SVC1,181 1,181 Vacant VAC1,313 Barber & Salon SVC1,313 Smoke Shop S1,313 NA Real Estate SVC1,050 Postal Office SVC
919 Boost Mobile S1,050 Gift Shop S1,050 Tacos Nayarit ED2,100 Carniceria la Original F1,838 Grandma's Café ED1,050 Farmers SVC1,181 Chiropractor SVC2,100 Empire Dance Studio SVC
919 Signs SVC2,500 El Nayaret ED2,500 Curves SVC1,788 Water & Ice S1,925 Nena's Pizza ED3,713 Brookstone Liquor F
LAKE ELSINORE TOWN CENTER* 88,804 25,807 29.1%32281 Mission Trail 2,550 Autozone AD
900 State Farm SVC1,650 Dentist SVC1,500 Dance Studio SVC
675 675 Vacant VAC675 Karate SVC
14,985 Big Lots GM
B-3

Shopping Center / Location GLA Vacant Vacancy Tenants Category
988 Medical Supply SVC731 731 Vacant VAC488 Sports Cards S
1,138 Chiropractor SVC1,300 Optometry SVC
650 650 Vacant VAC569 569 Vacant VAC650 650 Vacant VAC
1,992 Rent A Center FA2,969 2,969 Vacant VAC
875 H&R Block SVC2,713 2,713 Vacant VAC1,225 RadioShack FA
700 Fantastic Sams SVC700 Beauty Supply SVC963 963 Vacant VAC
21,403 Stater Bros F450 Auto Insurance SVC
1,500 Nails SVC675 675 Vacant VAC750 Dry Cleaners SVC600 Health Store S600 Postal Annex SVC450 Tobacco S
1,950 Fashion Art A2,700 2,700 Vacant VAC9,560 9,560 Vacant VAC2,954 2,954 Vacant VAC1,155 El Ranchito Taco Shop ED
990 Kokoro Sushi ED1,485 Annie's Café ED
CANYON HILLS MARKETPLACE* 49,750 750 1.5%29995 Canyon Hills Rd 2,175 Bank of America SVC
7,200 CVS S938 Panda Express ED
1,031 Calvary Chapel SVC844 Dream Tan SVC750 Los Jilberto's ED844 Subway ED
2,250 Hana Sushi ED1,688 Bites ED
844 Juice it Up ED844 Postal Annex SVC
1,125 Cleaners SVC938 Fantastic Sams SVC844 Jade Nails SVC
22,138 Stater Bros F825 Kid Starz SVC750 750 Vacant VAC675 Wolfee Donuts ED675 Salon Silque SVC
1,275 Grapes & Tomatoes ED1,100 Jack in the Box ED
UNNAMED CENTER* 14,253 - 0.0%25351 Railroad Canyon Rd 625 Papa John's ED
1,313 Ju Jit Su SVC2,438 Chevron GAS3,234 Joe's Hardware BHG1,575 Carl's Jr ED2,250 America's Tire Center AD
963 Dentist SVC619 Bow Wow Bath House SVC
1,238 Lake Vision SVC
UNNAMED CENTER 12,894 - 0.0%SEC Riverside Dr & Lakeshore Dr 3,000 Autozone AD
2,850 Xpress Auto Registration SVC1,869 Red Bowl ED1,150 Pizza Hut ED1,581 Tae Kwon Do SVC1,150 Smoke Shop S1,294 Beauty Salon SVC
LAKESHORE PLAZA 103,031 5,313 5.2%16750 Lakeshore Dr 1,563 Donuts Star ED
B-4

Shopping Center / Location GLA Vacant Vacancy Tenants Category
1,563 Dominos ED2,188 Discount Outlet A1,563 Postal Plus SVC1,875 Clothing Donation Center SVC2,031 Metro PCS S1,563 Dentist SVC3,281 Freddy Ray's BBQ ED1,563 Threadz N Things A1,875 Gen RX Pharmacy S2,188 Coin Laundry SVC1,250 Hair Cuts SVC1,563 Pizza ED1,875 Martial Arts SVC1,406 Auto Insurance SVC
31,000 Stater Bros F1,406 Smoke Shop S1,563 99 Cents Discount GM1,719 Cleaners SVC2,813 Pet Clinic SVC1,406 The Water Place S1,563 Doggie Styles Grooming SVC1,406 Rami's Beauty Palace SVC1,406 AJ's Fish Market ED1,563 Abba Multi Services SVC7,500 Taqueria La Mexicana ED1,563 Designer Nails SVC1,406 Costumes S1,563 1,563 Vacant VAC1,563 Medical Clinc SVC1,563 Color & Cut SVC1,563 Foot Massage SVC1,563 Financial Services SVC3,750 3,750 Vacant VAC2,813 Video 94 S1,563 Tattoo SVC3,438 Indoor Shopping Bazaar S
UNNAMED CENTER 9,875 1,000 10.1%16331 Lakeshore Dr 2,625 Circle K ED
1,000 1,000 Vacant VAC875 Top Nails SVC
1,125 Great Cuts SVC1,125 Mundo Cellular S1,000 Star Videos S1,125 Copy 2 Go SVC1,000 Tacos Elsinore ED
SEARS CENTER 15,569 1,725 11.1%16665 Lakeshore Dr 2,444 King Mart F
1,725 1,725 Vacant VAC2,300 Panda Palace ED9,100 Sears FA
UNNAMED CENTER* 31,919 4,347 13.6%Casino Dr & Diamond Dr 1,647 Pizza Hut ED
3,700 3,700 Vacant VAC3,375 Elsinore Buffet ED1,006 Quest Diagnostics SVC
791 Spa Swan SVC647 We Buy Gold SVC647 One Main Financial SVC647 647 Vacant VAC
1,438 King Kabob ED2,588 Don Jose ED3,450 Vincenzo's ED
863 Hang it Over S719 Spa Pedi SVC575 Fancy Nails & Spa SVC719 Tattoo SVC
1,294 Lotions & Lace S3,250 Coco's ED
703 Econo Lube AD2,550 Express Tires AD1,313 Arco GAS
DOWNTOWN LAKE ELSINORE 109,500 17,269 15.8%
B-5

Shopping Center / Location GLA Vacant Vacancy Tenants Category
161 Main St 5,500 5,500 Vacant VAC159 Main St 2,500 Venus Printing SVC159 Main St 2,000 Tulips Trophies S157 Main St 3,500 3,500 Vacant VAC141 Main St 3,000 Medical Clinic SVC137 Main St 2,025 Boulangerie ED133 Main St 3,713 3,713 Vacant VAC123 Main St 2,700 2,700 Vacant VAC115 Main St 1,013 Barber Shop SVC111 Main St 1,688 Rusticana ED105 Main St 4,388 Guadalajara ED101 Main St 3,375 Rose's Collectables S201 Main St 2,025 Whitehorn Construction SVC113 Main St 1,350 Law Office SVC117 Main St 2,025 Pest Management SVC141 Main St 1,688 Dentist SVC123 Main St 1,350 Loan Service SVC161 S Main St 4,550 Los Compadres F148 Main St 1,856 Parorana Wellness S112 Main St 1,350 Urban Décor FA110 Main St 1,350 Team Outfitters A108 Main St 1,181 Safes Keys SVC102 Main St 3,713 Fashion Avenue A100 Main St 1,856 Tom & Jerry's Antiques S106 Main St 1,856 Insurance SVC110 Main St 1,856 La Unica ED112 Main St 1,856 Hotrod Parts Music S118 Main St 1,856 Insurance SVC120 Main St 1,013 Beauty Salon SVC110 Main St 1,013 Party Supply S112 Main St 844 Daisy's Beauty Supply SVC124 Main St 1,013 Juice It ED126 Main St 1,856 1,856 Vacant VAC128 Main St 844 Eyebrow Threading SVC130 Main St 1,181 Party Supply S134 Main St 1,013 El Diego's Videos S138 Main St 844 Jewelry Repair A142 Main St 3,713 Maria's Antiques S202 Main St 3,500 Gina's Kitchen ED501 Spring St 1,700 Gas Station GAS200 Graham 1,800 Arco GAS113 Graham 2,531 M&M Liquor F117 Graham 7,500 Wrecked Cocktails ED127 Graham 1,625 Vista Print SVC127 Graham 2,600 Elsinore Pioneer Lumber Co BHG201 W. Graham St 3,294 The Chimes Antiques S122 Graham 1,500 Angel Gifts A120 Graham 1,350 Cisne's Hair SVC101 S Main St 1,650 Nora's Hair Salon SVC
FREESTANDING15788 Grand Ave 2,300 O'Hara's ED15373 Grand Ave 2,850 Quick Mini Market F15573 Grand Ave 4,250 PK's Roadhouse ED15887 Grand Ave 11,250 Lake Elsinore Market F15883 Grand Ave 2,338 The Rolling Stop ED15987 Grand Ave 2,500 2,500 Vacant VAC17595 Grand Ave 1,425 LY Gas GAS17609 Grand Ave 1,313 1,313 Vacant VAC17741 Grand Ave 1,544 Smoke Shop S17741 Grand Ave 1,544 Los Panchos Market F18445 Grand Ave 1,050 O Video S18815 Grand Ave 2,019 2,019 Vacant VAC32510 Mission Trail 2,869 Excalibur Market F31650 Mission Trail 5,000 McDonalds ED31640 Mission Trail 2,700 Chevron GAS2091 E Lakeshore Dr 14,781 CVS S160 Diamond Dr* 6,278 Walgreens S20651 Palomar St* 1,788 Roundup Gas GAS31805 Grape St* 1,444 76 Station GAS331 Railroad Canyon Rd* 1,647 In N Out ED321 Summerhill Dr* 1,438 KFC ED311 Summerhill Dr* 1,266 Jiffy Lube AD301 Summerhill Dr* 1,650 Alberto's ED31587 Canyon Estates Dr 3,931 Shell GASSEC Central & Dexter 956 Chevron GAS18461 Dexter Ave 3,325 Douglas Burgers ED
B-6

Shopping Center / Location GLA Vacant Vacancy Tenants Category
18492 Dexter Ave 4,388 Tom's Burgers ED18601 Dexter Ave 5,638 Lone Star EDMain St & I-15 1,800 1,800 Vacant VAC301 N Main St 1,238 Main St Gas GAS217 N Main St 13,513 13,513 Vacant VAC504 N Spring St 4,750 Cheesecake House Co ED16791 Lakeshore Dr 1,275 Longtin's Auto Parts AD31253 Riverside Dr 1,838 Hunny's ED31255 Riverside Dr 1,969 Suds R Us SVC31257 Riverside Dr 1,875 KFC/Taco Bell ED31395 Riverside Dr 2,400 Lord's Closet Thrift Store A31397 Riverside Dr 2,188 Thriftique Boutique A32107 Ortega Hwy 2,113 Lookout Roadhouse ED32685 Ortega Hwy 1,600 Hell's Kitchen EDNEC Riverside & Lakeshore 6,750 Gen RX Pharmacy S1501 Lakeshore 638 Abuelos ED1511 Lakeshore 1,500 Lakeshore Liquor F16989 Lakeshore Dr 3,000 Juan Pollo ED17053 Lakeshore Dr 2,138 Casa Del Lago ED1604 Lakeshore Dr 1,225 What Uh Deli ED1006 Lakeshore 3,150 Lake Star Food Store F124 Graham 1,500 Boost Mobile S16375 Lakeshore Dr 16,400 Rite Aid S16475 Lakeshore 6,000 6,000 Vacant VAC
TOTAL 1,393,767
Category Square Feet
A = Apparel 32,763 AD = Auto Parts 28,831 BHG = Building/Hardware/Garden 122,153 ED = Eating and Drinking 194,436 F = Food 222,008 FA = Furniture/Appliances 37,867 GAS = Gas Stations 25,431 GM = General Merchandise 225,946 S = Specialty 159,753 SVC = Service 227,534 VAC = Vacant 117,045
TOTAL 1,393,767
Source: TNDG; Riverside County Assessor; Shopping Center Site Plans.
Notes:* Square Feet Discounted by 50%
B-7
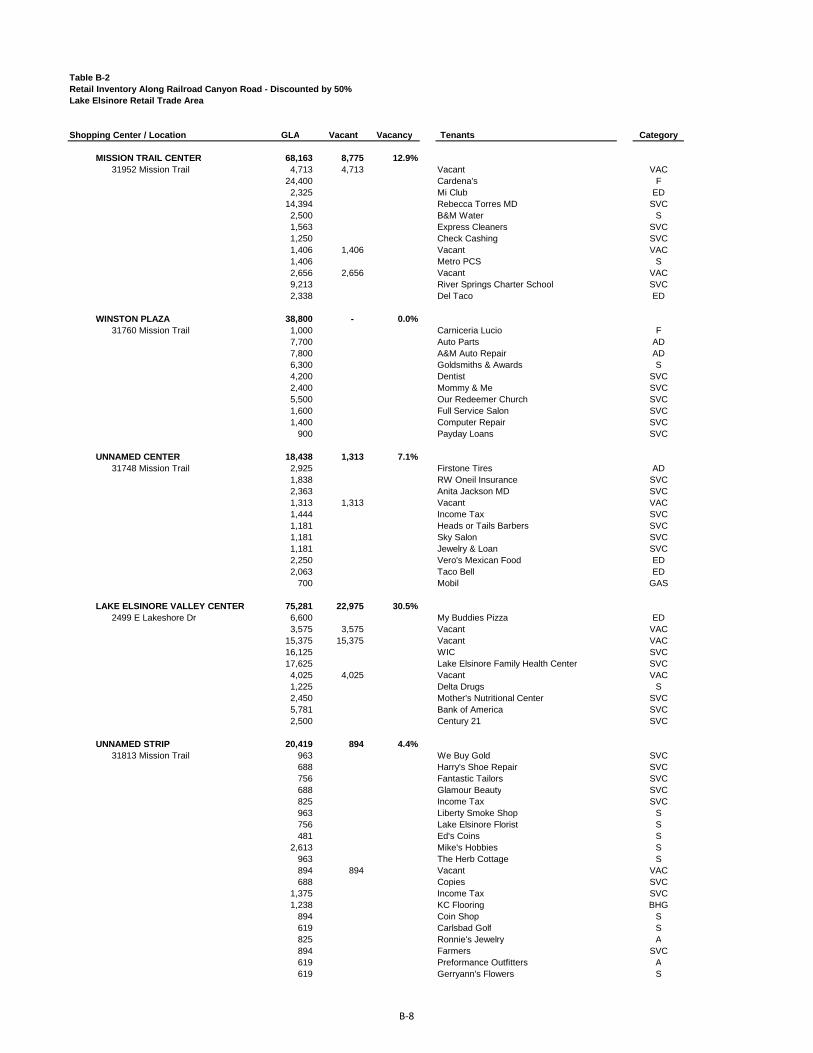
Table B-2Retail Inventory Along Railroad Canyon Road - Discounted by 50%Lake Elsinore Retail Trade Area
Shopping Center / Location GLA Vacant Vacancy Tenants Category
MISSION TRAIL CENTER 68,163 8,775 12.9%31952 Mission Trail 4,713 4,713 Vacant VAC
24,400 Cardena's F2,325 Mi Club ED
14,394 Rebecca Torres MD SVC2,500 B&M Water S1,563 Express Cleaners SVC1,250 Check Cashing SVC1,406 1,406 Vacant VAC1,406 Metro PCS S2,656 2,656 Vacant VAC9,213 River Springs Charter School SVC2,338 Del Taco ED
WINSTON PLAZA 38,800 - 0.0%31760 Mission Trail 1,000 Carniceria Lucio F
7,700 Auto Parts AD7,800 A&M Auto Repair AD6,300 Goldsmiths & Awards S4,200 Dentist SVC2,400 Mommy & Me SVC5,500 Our Redeemer Church SVC1,600 Full Service Salon SVC1,400 Computer Repair SVC
900 Payday Loans SVC
UNNAMED CENTER 18,438 1,313 7.1%31748 Mission Trail 2,925 Firstone Tires AD
1,838 RW Oneil Insurance SVC2,363 Anita Jackson MD SVC1,313 1,313 Vacant VAC1,444 Income Tax SVC1,181 Heads or Tails Barbers SVC1,181 Sky Salon SVC1,181 Jewelry & Loan SVC2,250 Vero's Mexican Food ED2,063 Taco Bell ED
700 Mobil GAS
LAKE ELSINORE VALLEY CENTER 75,281 22,975 30.5%2499 E Lakeshore Dr 6,600 My Buddies Pizza ED
3,575 3,575 Vacant VAC15,375 15,375 Vacant VAC16,125 WIC SVC17,625 Lake Elsinore Family Health Center SVC4,025 4,025 Vacant VAC1,225 Delta Drugs S2,450 Mother's Nutritional Center SVC5,781 Bank of America SVC2,500 Century 21 SVC
UNNAMED STRIP 20,419 894 4.4%31813 Mission Trail 963 We Buy Gold SVC
688 Harry's Shoe Repair SVC756 Fantastic Tailors SVC688 Glamour Beauty SVC825 Income Tax SVC963 Liberty Smoke Shop S756 Lake Elsinore Florist S481 Ed's Coins S
2,613 Mike's Hobbies S963 The Herb Cottage S894 894 Vacant VAC688 Copies SVC
1,375 Income Tax SVC1,238 KC Flooring BHG
894 Coin Shop S619 Carlsbad Golf S825 Ronnie's Jewelry A894 Farmers SVC619 Preformance Outfitters A619 Gerryann's Flowers S
B‐8

Shopping Center / Location GLA Vacant Vacancy Tenants Category
275 Boost Mobile S619 Affordable Print & Mail SVC
1,169 Castinet.com SVC
LAKE ELSINORE CITY CENTER 246,459 - 0.0%31700 Grape St 4,038 Basie 21 A
3,188 Diamond Dentist SVC2,763 LA Nails & Spa II SVC1,356 Smoke Shop S1,550 GNC S1,744 Cleaners SVC1,550 The UPS Store SVC1,744 Sally Beauty Salon SVC2,325 Sushi Zen ED
53,250 Vons F9,688 O'Reily Auto Parts AD7,813 Fashion Today A8,594 Payless Shoes A6,531 Goodwill S
126,390 Walmart GM4,375 Denny's ED6,663 Wells Fargo SVC2,900 El Pollo Loco ED
UNNAMED CENTER 20,994 - 0.0%351 Railroad Canyon Rd 4,463 Tuscany Dental SVC
3,150 Tuscany Wine & Liquor F2,925 Coffee Bar ED2,025 Orthodontist SVC
900 Fine Cuts SVC1,688 Preformance Realty Group SVC1,913 Eileen's Cleaners SVC1,275 Peace of Zen SVC1,381 99 Cent Store GM1,275 State Farm SVC
LAKE ELSINORE TOWN CENTER 177,609 51,615 29.1%32281 Mission Trail 5,100 Autozone AD
1,800 State Farm SVC3,300 Dentist SVC3,000 Dance Studio SVC1,350 1,350 Vacant VAC1,350 Karate SVC
29,970 Big Lots GM1,975 Medical Supply SVC1,463 1,463 Vacant VAC
975 Sports Cards S2,275 Chiropractor SVC2,600 Optometry SVC1,300 1,300 Vacant VAC1,138 1,138 Vacant VAC1,300 1,300 Vacant VAC3,984 Rent A Center FA5,938 5,938 Vacant VAC1,750 H&R Block SVC5,425 5,425 Vacant VAC2,450 RadioShack FA1,400 Fantastic Sams SVC1,400 Beauty Supply SVC1,925 1,925 Vacant VAC
42,805 Stater Bros F900 Auto Insurance SVC
3,000 Nails SVC1,350 1,350 Vacant VAC1,500 Dry Cleaners SVC1,200 Health Store S1,200 Postal Annex SVC
900 Tobacco S3,900 Fashion Art A5,400 5,400 Vacant VAC
19,120 19,120 Vacant VAC5,907 5,907 Vacant VAC2,310 El Ranchito Taco Shop ED1,980 Kokoro Sushi ED2,970 Annie's Café ED
CANYON HILLS MARKETPLACE 99,500 1,500 1.5%
B‐9

Shopping Center / Location GLA Vacant Vacancy Tenants Category
29995 Canyon Hills Rd 4,350 Bank of America SVC14,400 CVS S1,875 Panda Express ED2,063 Calvary Chapel SVC1,688 Dream Tan SVC1,500 Los Jilberto's ED1,688 Subway ED4,500 Hana Sushi ED3,375 Bites ED1,688 Juice it Up ED1,688 Postal Annex SVC2,250 Cleaners SVC1,875 Fantastic Sams SVC1,688 Jade Nails SVC
44,275 Stater Bros F1,650 Kid Starz SVC1,500 1,500 Vacant VAC1,350 Wolfee Donuts ED1,350 Salon Silque SVC2,550 Grapes & Tomatoes ED2,200 Jack in the Box ED
UNNAMED CENTER 28,506 - 0.0%25351 Railroad Canyon Rd 1,250 Papa John's ED
2,625 Ju Jit Su SVC4,875 Chevron GAS6,469 Joe's Hardware BHG3,150 Carl's Jr ED4,500 America's Tire Center AD1,925 Dentist SVC1,238 Bow Wow Bath House SVC2,475 Lake Vision SVC
UNNAMED CENTER 63,838 8,694 13.6%Casino Dr & Diamond Dr 3,294 Pizza Hut ED
7,400 7,400 Vacant VAC6,750 Elsinore Buffet ED2,013 Quest Diagnostics SVC1,581 Spa Swan SVC1,294 We Buy Gold SVC1,294 One Main Financial SVC1,294 1,294 Vacant VAC2,875 King Kabob ED5,175 Don Jose ED6,900 Vincenzo's ED1,725 Hang it Over S1,438 Spa Pedi SVC1,150 Fancy Nails & Spa SVC1,438 Tattoo SVC2,588 Lotions & Lace S6,500 Coco's ED1,406 Econo Lube AD5,100 Express Tires AD2,625 Arco GAS
B‐10
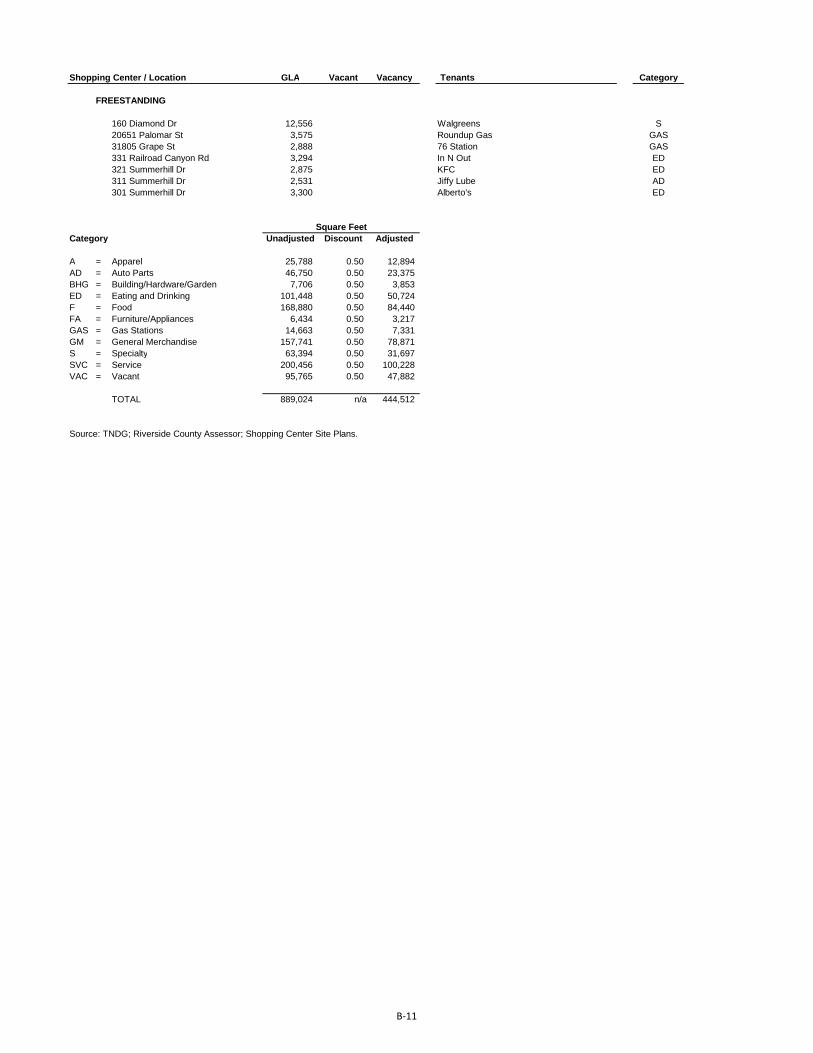
Shopping Center / Location GLA Vacant Vacancy Tenants Category
FREESTANDING
160 Diamond Dr 12,556 Walgreens S20651 Palomar St 3,575 Roundup Gas GAS31805 Grape St 2,888 76 Station GAS331 Railroad Canyon Rd 3,294 In N Out ED321 Summerhill Dr 2,875 KFC ED311 Summerhill Dr 2,531 Jiffy Lube AD301 Summerhill Dr 3,300 Alberto's ED
Square FeetCategory Unadjusted Discount Adjusted
A = Apparel 25,788 0.50 12,894AD = Auto Parts 46,750 0.50 23,375BHG = Building/Hardware/Garden 7,706 0.50 3,853ED = Eating and Drinking 101,448 0.50 50,724F = Food 168,880 0.50 84,440FA = Furniture/Appliances 6,434 0.50 3,217GAS = Gas Stations 14,663 0.50 7,331GM = General Merchandise 157,741 0.50 78,871S = Specialty 63,394 0.50 31,697SVC = Service 200,456 0.50 100,228VAC = Vacant 95,765 0.50 47,882
TOTAL 889,024 n/a 444,512
Source: TNDG; Riverside County Assessor; Shopping Center Site Plans.
B‐11

Figure B‐1Supermarket Locations
Lake Elsinore Retail Trade Area
MAP KEY
Proposed Project (distance in
miles to supermarket)
1 Lake Elsinore Market ‐ 11,250 SF (3.5 mi)
15887 Grand Ave, Lake Elsinore
2 Stater Bros ‐ 31,000 SF (2.1 mi)
16750 Lakeshore Dr, Lake Elsinore
3 Albertsons Store ‐ 48,593 SF (2.1 mi)
30901 Riverside Dr, Lake Elsinore
4 Stater Bros ‐ 42,805 SF* (3.7 mi)
32281 Mission Trl, Lake Elsinore
5 Cardenas Market ‐ 24,400 SF* (3.6 mi)
31952 Mission Trl, Lake Elsinore
6 Vons Market ‐ 53,250 SF* (3.4 mi)
31564 Grape St, Lake Elsinore
7 Stater Bros Mkt ‐ 44,275 SF* (4.4 mi)
29995 Canyon Hills Rd, Lake Elsinore
Source: TNDG; Riverside County Assessors Office; shopping center site plans.
Note: *Unadjusted square feet. See Section II‐B, page 9, for effective square feet calculations.
91011
1
2 3
45
6
7
B‐12

APPENDIX C:
PICTURES OF EXISTING HIGH VACANCY RATE CENTERS

C-1
1 Lake Elsinore Town Center
PROJECT LOCATION: NWC Malaga Rd / Mission Trl Lake Elsinore 92530
GROSS LEASABLE AREA: 179,856 SF
VACANT SQUARE FEET: 47,744 SF
VACANCY RATE: 26.5%

C-2
2 Lake Elsinore Valley Center
PROJECT LOCATION: SWC Lakeshore Dr / Railroad Cyn Rd Lake Elsinore 92530
GROSS LEASABLE AREA: 75,281 SF
VACANT SQUARE FEET: 22,975
VACANCY RATE: 26.5%