appendix m updated geotechnical report for the venice
TRANSCRIPT

Appendix M Updated Geotechnical Report for the Venice Auxiliary
Pumping Plant


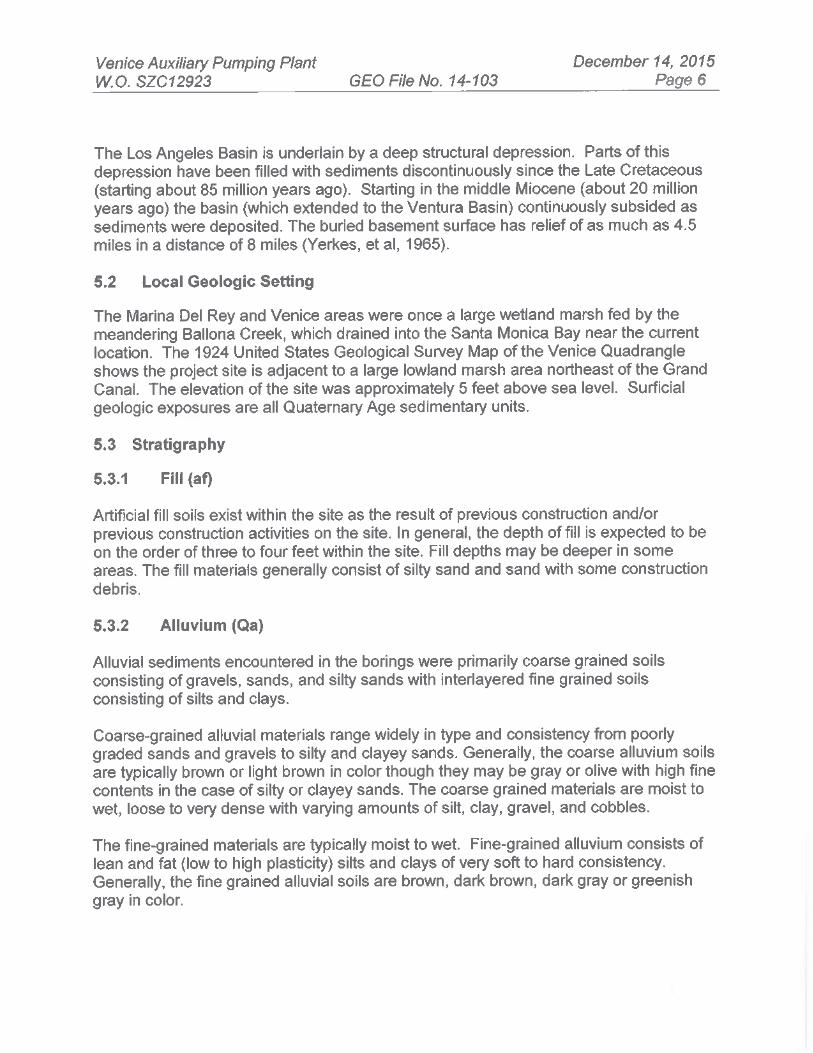


FIGURE1
BUREAU OF ENGINEERINGGEOTECHNICAL ENGINEERING GROUP (GEO)
FILE No.: 14-103 DATE: December 2015
Project Site
VICINITY MAP
N
VENICE AUXILIARY PUMPING PLANT
133 East Hurricane StreetVenice Area of Los Angeles, CA


PRO
POSE
D C
ON
STR
UC
TIO
NBU
REA
U O
F EN
GIN
EER
ING
GEO
TEC
HN
ICAL
EN
GIN
EER
ING
GR
OU
PFi
le N
o. 1
4-10
3
Dat
e D
ecem
ber
2015
FIG
UR
E N
O.
2
Ref
eren
ce: P
relim
inar
y D
esig
n D
raw
ing
No.
C-0
3A,
"Und
ergr
ound
Pip
ing
Pla
n, O
ptio
n 1,
Ven
ice
Aux
iliar
yP
umpi
ng
Pla
nt, 1
40 H
urric
ane
Stre
et, M
arin
a D
el R
ey, C
alifo
rnia
", pr
epar
d by
Arc
adis
, und
ated
.
VEN
ICE
AUXI
LIA
RY
PUM
PIN
G P
LAN
T
133
East
Hur
rican
e St
reet
Veni
ce A
rea
of L
os A
ngel
es, C
A


RW-339-1/2'
RW-149-1/2'
CPT-180'
CPT-360'
CPT-480'
CPT-260'CPT-5
40'RW-279-1/2'
FIGURE3
BUREAU OF ENGINEERINGGEOTECHNICAL ENGINEERING GROUP (GEO)
FILE No.: 14-103 DATE: December 2015
EXPLORATION LOCATIONS MAP
N
G-1B25-1/2'
89-305 B-241'
Hollowstem Auger Boring Number, Location, and Depth in feetB-2
G-1A71-1/2'
APPROXIMATESCALE
1 Inch = 20 Feet
VENICE AUXILIARY PUMPING PLANT
133 East Hurricane StreetVenice Area of Los Angeles, CA
LEGEND
94-072 B-831'
Cone Penetration Test Number, Location, and Depth in feet
Rotary Wash Boring Number, Location, and Depth in feetRW-2
CPT-2

FIGURE4
BUREAU OF ENGINEERINGGEOTECHNICAL ENGINEERING GROUP (GEO)
FILE No.: 14-103 DATE: December 2015
NSEISMIC HAZARD ZONES
Reference: "Official Map of Seismic Hazard Zones,"Venice", March 25, 1999, California, Department of Conservation, Division of Mines and Geology.
PROJECT SITE
VENICE AUXILIARY PUMPING PLANT
133 East Hurricane StreetVenice Area of Los Angeles, CA


Client: AMEC Geomatrix AP Lab No.: 28-0929Project Name: Venice Dual Force Main Date: 09/22/08Project Number: 14403.000
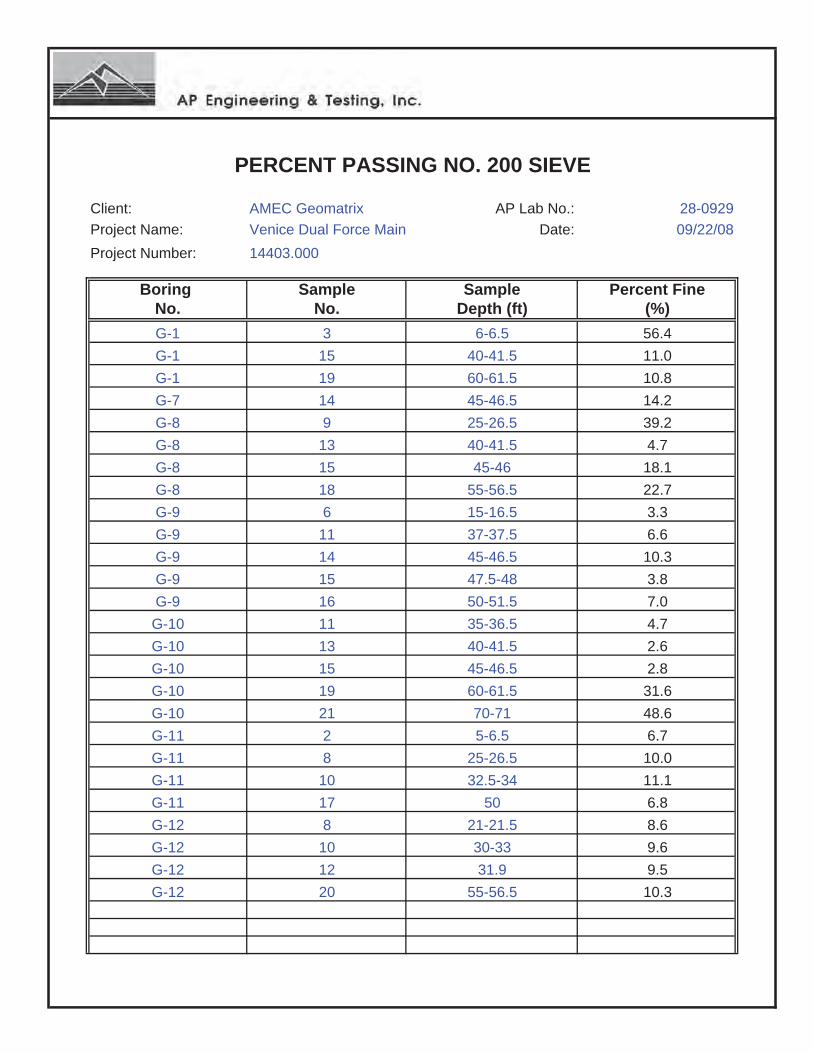
Boring Sample Percent FineNo. No. (%)G-1 3 6-6.5 56.4G-1 15 40-41.5 11.0G-1 19 60-61.5 10.8G-7 14 45-46.5 14.2G-8 9 25-26.5 39.2G-8 13 40-41.5 4.7G-8 15 45-46 18.1G-8 18 55-56.5 22.7G-9 6 15-16.5 3.3G-9 11 37-37.5 6.6G-9 14 45-46.5 10.3G-9 15 47.5-48 3.8G-9 16 50-51.5 7.0G-10 11 35-36.5 4.7G-10 13 40-41.5 2.6G-10 15 45-46.5 2.8G-10 19 60-61.5 31.6G-10 21 70-71 48.6G-11 2 5-6.5 6.7G-11 8 25-26.5 10.0G-11 10 32.5-34 11.1G-11 17 50 6.8G-12 8 21-21.5 8.6G-12 10 30-33 9.6G-12 12 31.9 9.5G-12 20 55-56.5 10.3
PERCENT PASSING NO. 200 SIEVE
SampleDepth (ft)

Project Name: : Venice Dual Force MainProject No. : 14403.000Boring No. : G-1Sample No. : 14Depth (ft) : 38.5-38.9Sample Type : Mod. Cal.Soil Type : Poorly Graded Sand with siltTest Condition : Saturated DrainedInitial Dry Density : 121.9 pcfMoisture Content (before) : 8.5 %Moisture Content (after) : 15.3 %
Peak UltimateCohesion (psf) : 500 250Friction Angle : 38 ° 31 °Normal Stress Shear Stress Shear Stress
(ksf) Peak (ksf) Ultimate (ksf) 0
1 0.8522 1.562 TEST RESULTS4 2.592
Mar-09 Figure No.
1.2842.5203.492
DIRECT SHEAR
(ASTM D 3080)
0
1
2
3
4
5
0 0.5 1 1.5 2 2.5 3 3.5 4 4.5 5
Normal Stress (ksf)
She
ar S
tress
(ksf
)

Project Name: : Venice Dual Force MainProject No. : 14403.000Boring No. : G-1Sample No. : 18Depth (ft) : 55-56Sample Type : Mod. Cal.Soil Type : Poorly Graded Sand with siltTest Condition : Saturated DrainedInitial Dry Density : 116.5 pcfMoisture Content (before) : 14.3 %Moisture Content (after) : 16.5 %
Peak UltimateCohesion (psf) : 200 100Friction Angle : 41 ° 30 °Normal Stress Shear Stress Shear Stress
(ksf) Peak (ksf) Ultimate (ksf) 0
1 0.6842 1.296 TEST RESULTS4 2.400
Mar-09 Figure No.
1.0802.1843.612
DIRECT SHEAR
(ASTM D 3080)
0
1
2
3
4
5
0 0.5 1 1.5 2 2.5 3 3.5 4 4.5 5
Normal Stress (ksf)
She
ar S
tress
(ksf
)

GEOTECHNICAL TESTING LABORATORY
UNCONSOLIDATED UNDRAINED TRIAXIAL TEST
Project Name: Venice Dual Force Main Sample Type: Shelby TubeWork Order: 14403.000 Soil Description Gray Silty ClayBoring No.: G-1 Dry Density (pcf): 77.0Sample No.: 10 Moisture Content (%) 43.4Depth (feet): 27.5-29.5 Test Date: 9/18/2008
Sample Diameter (inch): 2.875 Wt. Wet Soil+Container(gms) 733.54Sample Hieght (inch): 6.60 Wt. Dry Soil+Container(gms) 570.46Sample Weight (gms): 1242.28 Wt. Container (gms) 194.91
Confining Pressure : 1.20 ksf
Load(lbs)
Deformation(inch)
Area(sq.in)
Deviator Stress(ksf)
0 0.00 6.49 0.000.150.30
(%)Axial Strain
0.00
2.271.521.140.76
8313.64
9.099.8510.6111.3612.1212.88
86
29 0.0221 0.01
86 0.50 7.02 1.7688 0.55 7.08 1.79
0.60 7.14 1.7385 0.65 7.20 1.7084 0.70 7.26 1.6784 0.75 7.32 1.6582 0.80 7.39 1.6082 0.85 7.45 1.5883 0.90 7.52 1.59
45 0.05
1.7586 0.45 6.97 1.7884 0.40 6.91
0.35 6.8682 0.3083
56 0.075
80
65 0.10
0.2578 0.20
6.59 1.421.58
1.74
6.646.696.75
0.470.640.991.23
6.506.516.546.57
15.15
73
0.95 7.58 1.58
6.80
0.15
1.711.68
1.74
81 1.00 7.65 1.52
6.065.30
3.03
14.39
8.337.586.82
3.794.55
0
1
2
3
0 5 10 15 20Axial Strain (%)
Dev
iato
r Str
ess
(ksf
)

GRAIN SIZE DISTRIBUTION CURVEASTM D 422
Project Name: Venice Dual Force Main Tested by: DK Date: 09/17/08Project Number: 14403.000 Checked by: AP Date: 10/08/08
Gravel Sand Fines
G-1 9 25-26.5 0.00 15.57 84.43 CL
G-1 11 30-31.5 2.79 53.21 44.00 SM
G-1 12 33.5-33.9 0.00 49.65 50.35 ML
Soil Type U.S.C.S
Atterberg Limits LL:PL:PI
N/A
N/A
N/A
Symbol Boring No. Sample No.
Depth (feet)
Percent
0
10
20
30
40
50
60
70
80
90
100
0.0010.010.1110100
PARTICLE SIZE (mm)
PE
RC
EN
T P
AS
SIN
G B
Y W
EIG
HT
SAND SILT OR CLAY
HYDROMETERSIEVE NUMBER
#200#60#40#20#10#4⅜"
GRAVEL
COARSE FINE COARSE MEDIUM FINE
1" #140
SIEVE OPENING
3" 1½" ¾"

GRAIN SIZE DISTRIBUTION CURVEASTM D 422
Project Name: Venice Dual Force Main Tested by: DK Date: 09/17/08Project Number: 14403.000 Checked by: AP Date: 10/08/08
Gravel Sand Fines
G-1 13 35-36.5 1.84 82.54 15.62 SM
G-1 17 50-51.5 36.35 57.24 6.41 SW-SM
Symbol Boring No. Sample No.
Depth (feet)
Percent Soil Type U.S.C.S
Atterberg Limits LL:PL:PI
N/A
N/A
0
10
20
30
40
50
60
70
80
90
100
0.0010.010.1110100
PARTICLE SIZE (mm)
PE
RC
EN
T P
AS
SIN
G B
Y W
EIG
HT
SAND SILT OR CLAY
HYDROMETERSIEVE NUMBER
#200#60#40#20#10#4⅜"
GRAVEL
COARSE FINE COARSE MEDIUM FINE
1" #140
SIEVE OPENING
3" 1½" ¾"
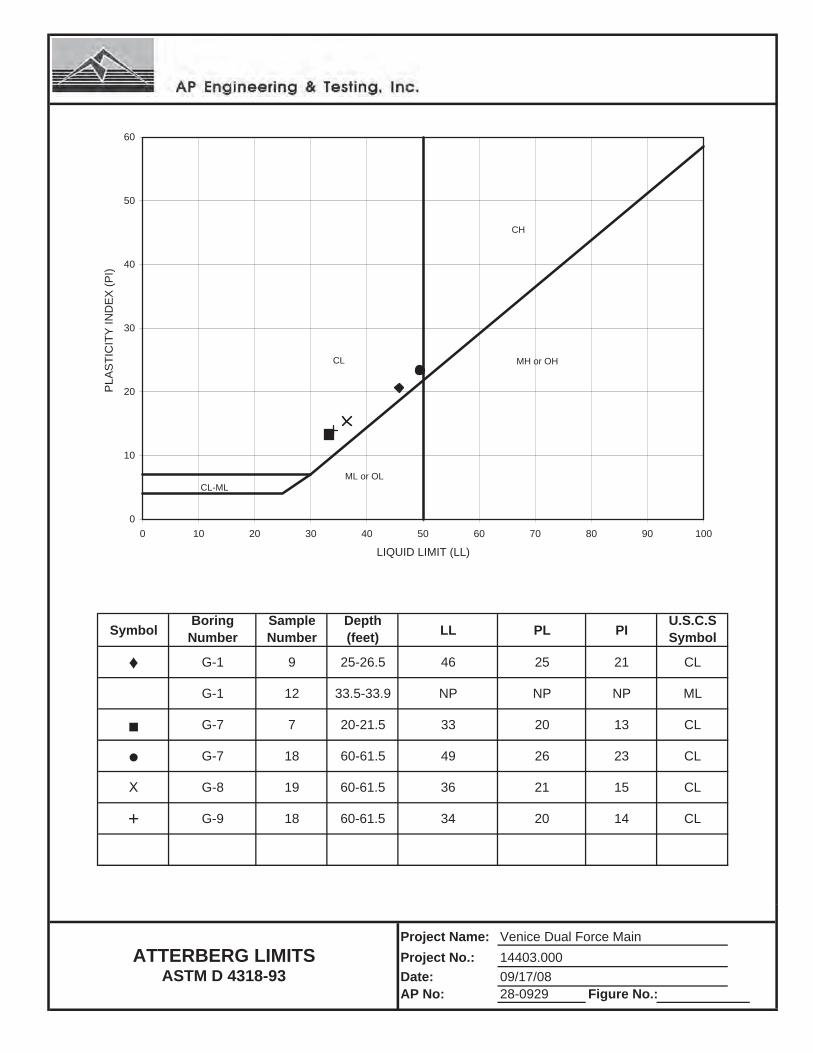
SymbolBoring Number
Sample Number
Depth (feet) LL PL PI
U.S.C.S Symbol
♦ G-1 9 25-26.5 46 25 21 CL
G-1 12 33.5-33.9 NP NP NP ML
G-7 7 20-21.5 33 20 13 CL
G-7 18 60-61.5 49 26 23 CL
Χ G-8 19 60-61.5 36 21 15 CL
+ G-9 18 60-61.5 34 20 14 CL
Project Name: Venice Dual Force MainProject No.: 14403.000Date: 09/17/08AP No: 28-0929 Figure No.:
ATTERBERG LIMITSASTM D 4318-93
0
10
20
30
40
50
60
0 10 20 30 40 50 60 70 80 90 100
LIQUID LIMIT (LL)
PLAS
TIC
ITY
IND
EX (P
I)
CL-MLML or OL
MH or OH
CH
CL

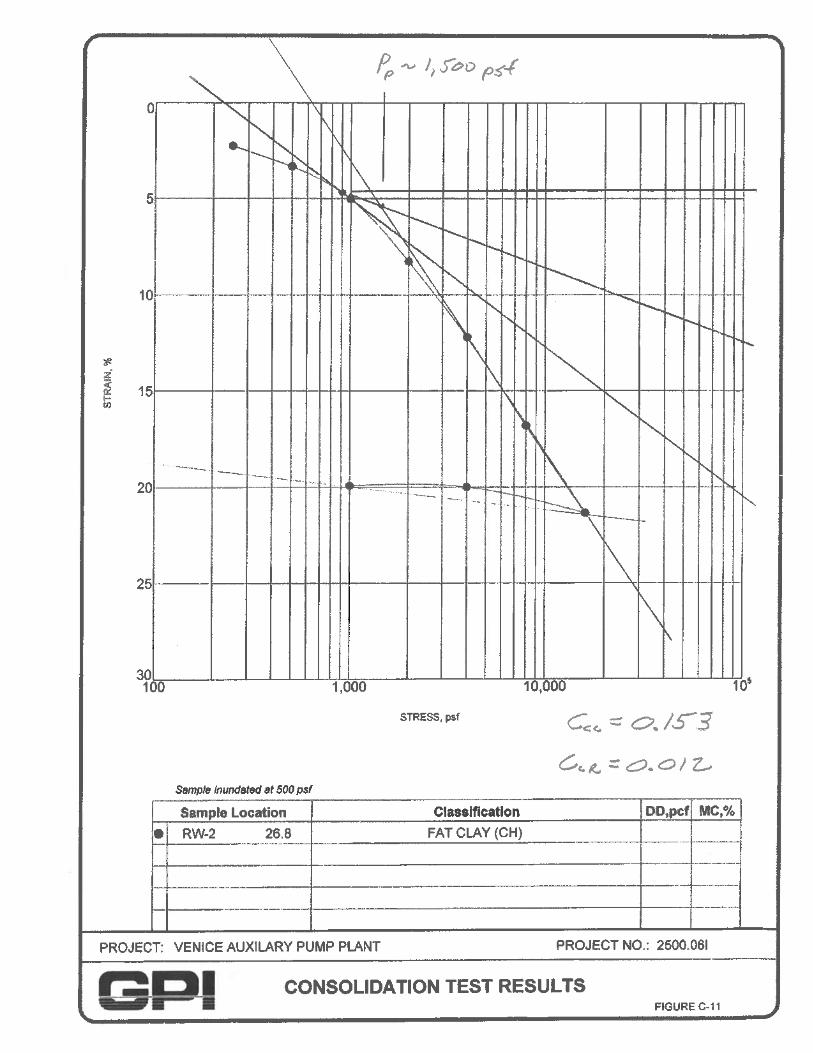
Boring No. : G-1 Initial Dry Unit Weight (pcf): 88.1
Sample No.: 10 Initial Moisture Content (%): 30.8
Depth (feet): 27.5-29.5 Final Moisture Content (%): 28.4
Sample Type: Mod. Cal Assumed Specific Gravity: 2.7
Soil Description: Gray Silty Clay Initial Void Ratio: 0.91
PROJECT NAME:
PROJECT NO.: 14403.000AP LAB NO.: 28-0929
Sep-08
Venice Dual Force Main
CONSOLIDATION TEST RESULTSASTM D 2435
0
1
2
3
4
5
6
7
8
9
10
11
12
13
14
15
0.1 1 10 100VERTICAL STRESS (ksf)
CO
NSO
LID
ATI
ON
(Per
cent
of S
ampl
e Th
ickn
ess)
At Field Moisture After Saturation

COMPACTION TEST
Client: AMEC Geomatrix AP Number: 28-0929Project Name: Venice Dual Force Main Tested By: JT Date: 09/26/08Project No. : 14403.000 Calculated By: KM Date: 10/09/08Location: G-1 Checked By: AP Date: 10/09/08Sample No. : 1 Depth (ft): 0-2Visual Sample Description: Brown Silty Sand w/gravel
Compaction Method X ASTM D1557 ASTM D698
METHOD C Preparation Method MoistMOLD VOLUME (CU.FT) 0.0752 X Dry
Trial No. 1 2 3 4 5 6
Wt. Comp. Soil + Mold (gm.) 7230 7042 7245 7322
Wt. of Mold (gm.) 2647 2647 2647 2647
Net Wt. of Soil (gm.) 4583 4395 4598 4675
Container No.
Wt. of Container (gm.) 154.50 196.30 193.50 154.10
Wet Wt. of Soil + Cont. (gm.) 939.90 912.70 1229.20 1135.10
Dry Wt. of Soil + Cont. (gm.) 854.75 871.68 1151.31 1043.93
Moisture Content (%) 12.16 6.07 8.13 10.25
Wet Density (pcf) 134.37 128.85 134.80 137.05
Dry Density (pcf) 119.80 121.47 124.66 124.32
Maximum Dry Density (pcf) 126.0 Optimum Moisture Content (%) 9.0
Assumed Specific Gravity = 2.7PROCEDURE USED
Soil Passing No. 4 (4.75 mm) Sieve Mold : 4 in. (101.6 mm) diameter Layers : 5 (Five) Blows per layer : 25 (twenty-five) May be used if No.4 retained < 20%
Soil Passing 3/8 in. (9.5 mm) Sieve Mold : 4 in. (101.6 mm) diameter Layers : 5 (Five) Blows per layer : 25 (twenty-five) Use if + No.4 > 20% and - 3/8 " < 20%
X Soil Passing 3/4 in. (19.0 mm) Sieve Mold : 6 in. (152.4 mm) diameter Layers : 5 (Five) Blows per layer : 56 (fifty-six) Use if + 3/8 in >20% and + 3/4 in <30%
100
110
120
130
140
0.00 10.00 20.00 30.00 40.00Moisture (%)
Dry
Den
sity
(pcf
)
100% sat. @ assumed Gs

CORROSION TEST RESULTS
Client Name: AMEC Geomatrix AP Job No.: 28-0929 Project Name: Venice Dual Force Main Date 09/17/08 Project No.: 14403.000
Boring Sample Depth Soil Type pH Sulfate Content Chloride Content No. No. (ft) (ppm) (ppm)
G-1 10 27.5-29.5 CL 7.2 190 1805
G-1 Mixed 25-40 SM/ML 7.1 88 1459
G-9 8 25-27.3 CL 9.4 37 1587
G-9 Mixed 35-50 SM 7.1 58 205
NOTES: Resistivity Test and pH: California Test Methods 532 and 643Sulfate Content : California Test Method 417Chloride Content : California Test Method 422ND = Not DetectableNA = Not Sufficient SampleNR = Not Requested
2607 Pomona Boulevard, Pomona, CA 91768Tel. (909) 869-6316 Fax. (909)869-6318
MinimumResistivity (ohm-cm)
92
200
230
1000


� � � � � � � � � � � �
� � � � � � � � � �
� � � � � � � � � � � � � � � � � � � � � � � � �
� � � � � � � � � � �� � � � � � � � � � � � � � � � � � � � � � � � � � � �
� � � � � � � � �
� ! � � � � �
" � � � � � � # � � � $ � % � &
' � � � $ ( $ ) � � ) � * � * � + � , � $ ( $ ) � � ) � * � (
� � � � � � � � - � �
� � � � � � � � �
� � � � � � � � � � � � � � � � � �
� � � � � � � � � � � � � � � � � � � � � � � �
� � � � � � � � � � � � � � � � � � � � �
� � � � � � � � � � � � �
� � � � � � � � � � � �
! " " � # � � � $ � � � � � � � � � � � � �
. � ) � # � � � � � � � � � � + ) � / � � � � � �
� � ( $ � 0 � � � � � ! � � � � 1 � �
2 � � � � � � � � � � � # � � � - � � � � � � $ � �

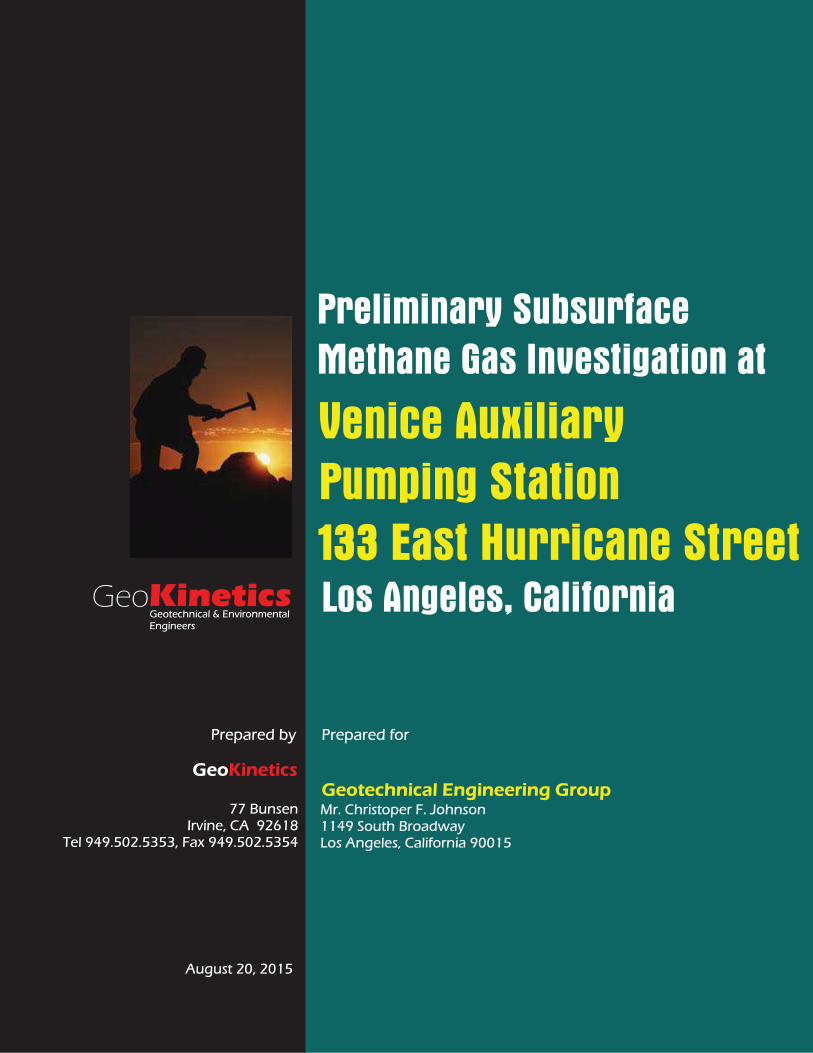
1.0 Introduction: GeoKinetics has completed a subsurface methane gas
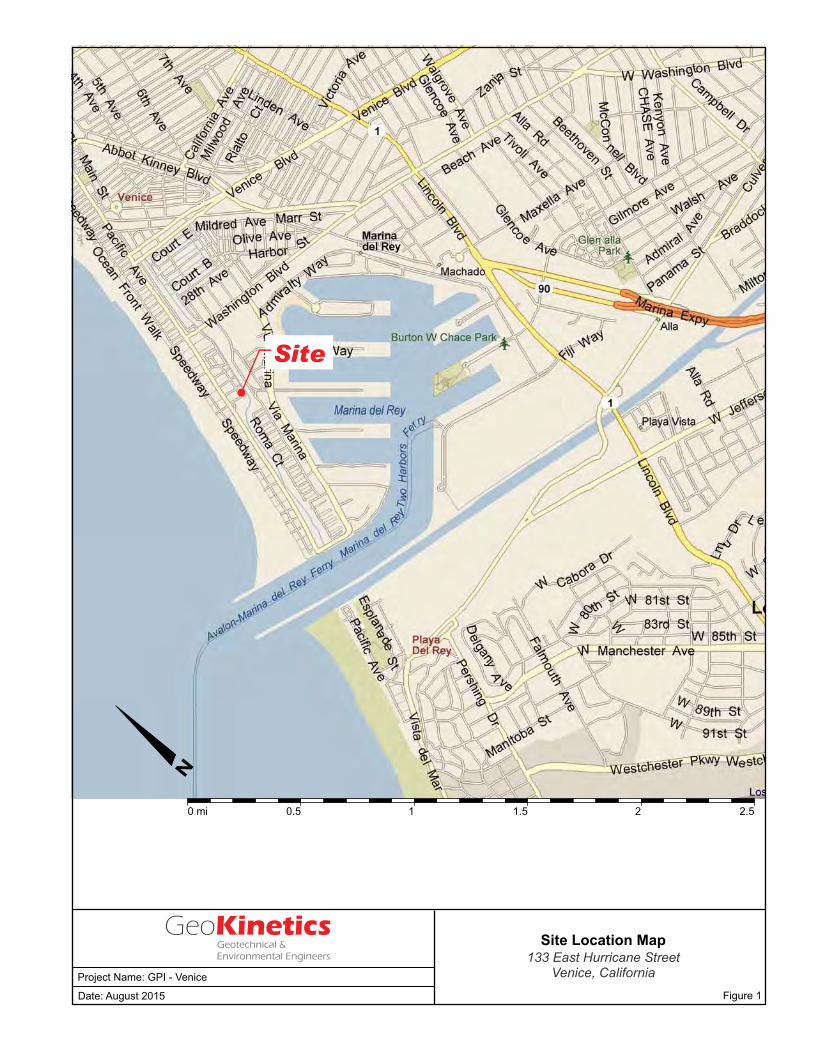
investigation at the proposed Venice Auxiliary Pumping Plant located at 133 Hurricane Street, in the City of Los Angeles. The location of the subject property is shown in Figure 1 while a recent aerial photograph of the site is provided as Figure 2. We understand that the proposed auxiliary pumping plant will consist of a wet well / valve vault, an electrical building and adiversion structure on the approximate 7,850 square foot property. The subject property is located in the Playa Del Rey Oil Field as it has been mapped by the California Department of Conservation, Division of Oil, Gas & Geothermal Resources (DOGGR). No oil wells are shown to exist at the property based upon our review of the DOGGR oil field map. The closest mapped oil well (Allied Petroleum Corp., “Rawco – Woodford”, #1) is located approximately 55 feet southwest of the subject property. As a result, it is within a Methane Zone designated by LADBS. It will therefore be necessary to incorporate methane gas mitigation measures into the design of the proposed structures in accordance with LADBS requirements
Under the current building code, the nature and extent of the required mitigation measures are partially dependent upon the concentration and pressure of any methane gas that may be present at the site. The current investigation has been performed for the purpose of documenting the concentration and pressure of methane gas in the subsurface of the subject property such that appropriate mitigative improvements can be specified. This report presents the results of the subsurface gas investigation as well as associated methane mitigation recommendations in accordance with typical LADBS requirements.
2.0 Background: The presence of methane gas in the subsurface is common within former oil production areas and other locations where organic material -such as grass, leaves, wood, manure, etc. - are present in the soil. Biogenic methane is generated by the bacteriological digestion, or biodegradation, of organic matter in the absence of oxygen. Methane of thermogenic or petrogenic origin may also be present in surficial soils as a result of its upward migration from deeper oil and gas bearing zones. Our experience indicates methane gas is common and can be found in the soil at a relatively high percentage of building sites in southern California. Methane is not toxic, however it is combustible and potentially explosive at concentrations above 55,000 ppm in the presence of oxygen. This concentration is referred to as its Lower Explosive Level or LEL. Methane is lighter than air and therefore has a natural tendency to rise to the ground surface where it typically dissipates into the atmosphere. The presence of non-pressurized methane at shallow depths beneath the ground surface is normally not problematic. The rates at which the methane is generated and/or migrates towards the ground surface are slow enough such that the gas dissipates naturally under normal circumstances. However, as methane migrates to the ground surface, the
Methane Gas Investigation Geotechnical Engineering GroupVenice Auxiliary Pumping Plant, Los Angeles August 20, 2015
page 2
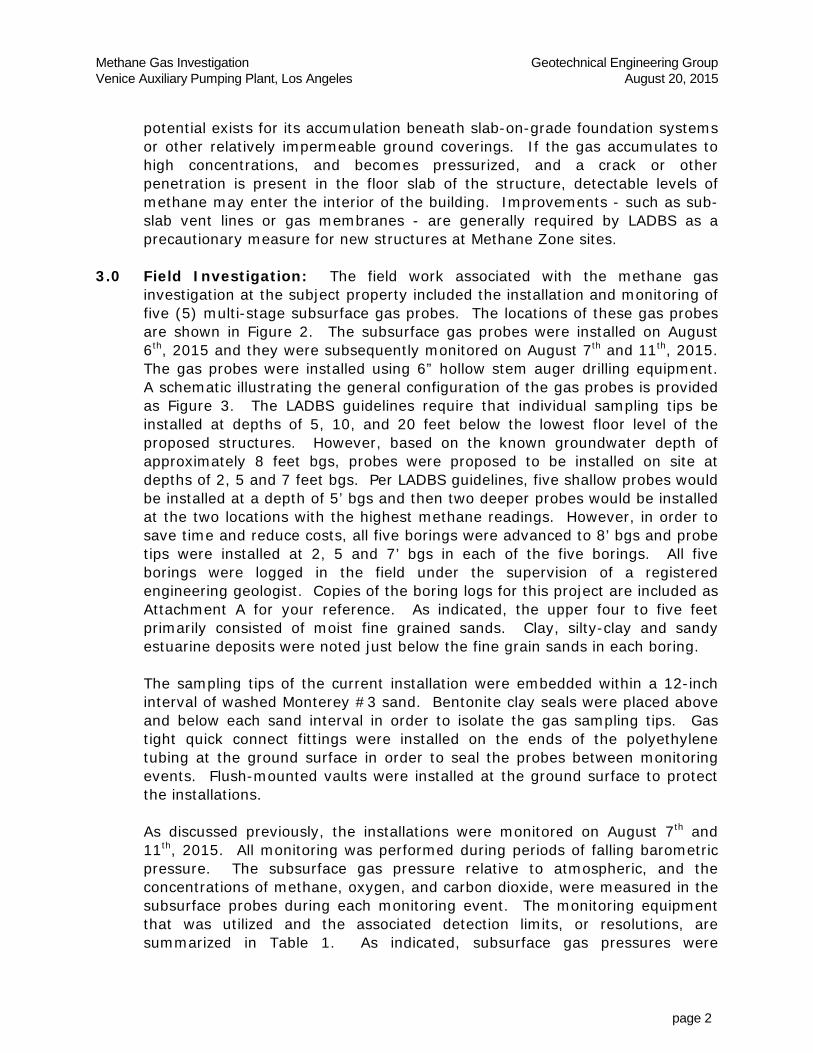
potential exists for its accumulation beneath slab-on-grade foundation systems or other relatively impermeable ground coverings. If the gas accumulates to high concentrations, and becomes pressurized, and a crack or other penetration is present in the floor slab of the structure, detectable levels of methane may enter the interior of the building. Improvements - such as sub-slab vent lines or gas membranes - are generally required by LADBS as a precautionary measure for new structures at Methane Zone sites.
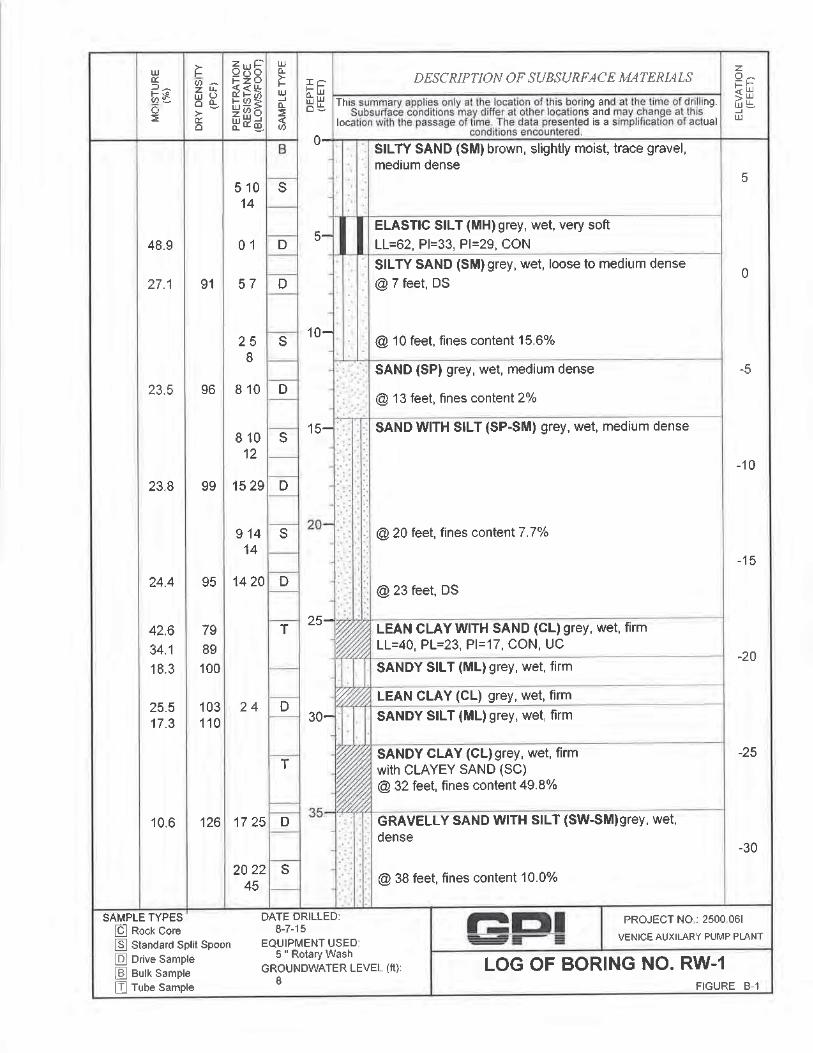
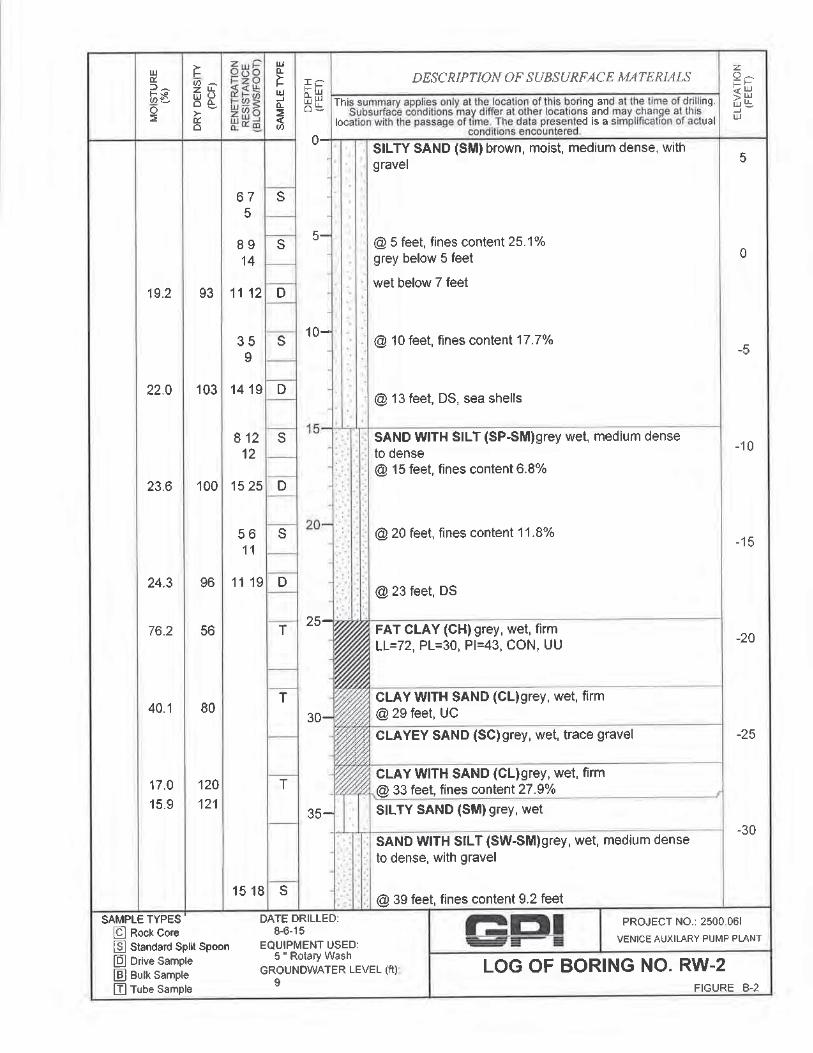
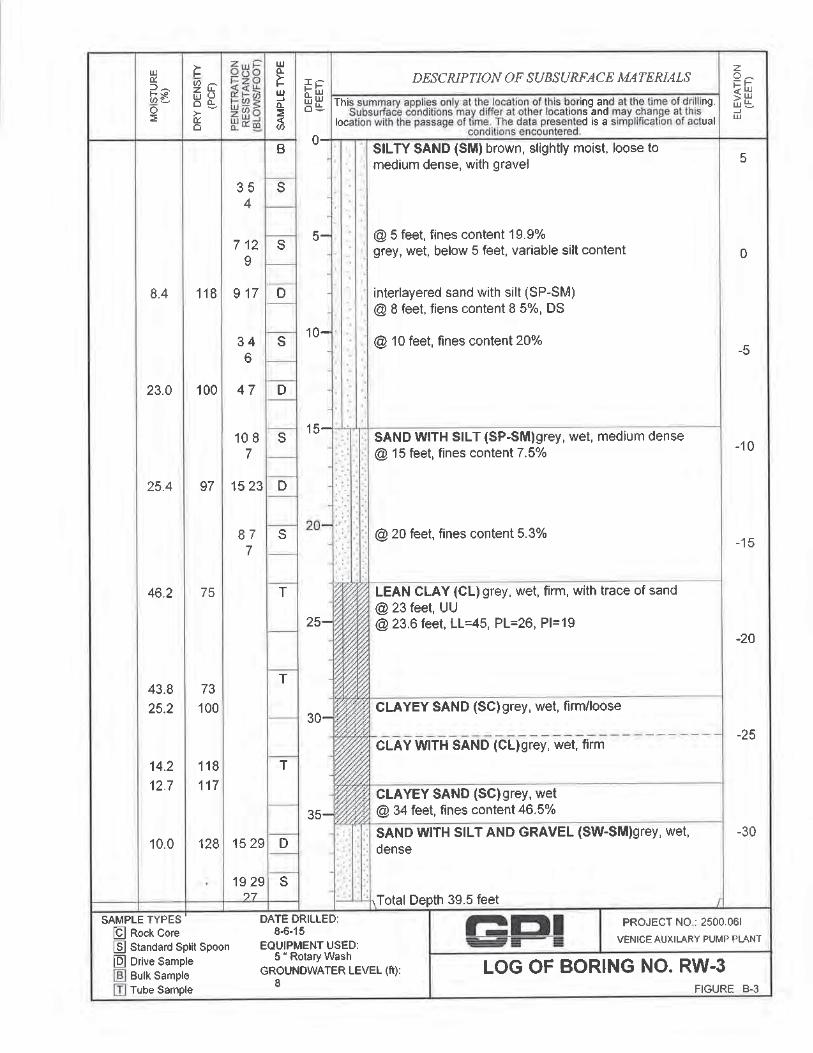
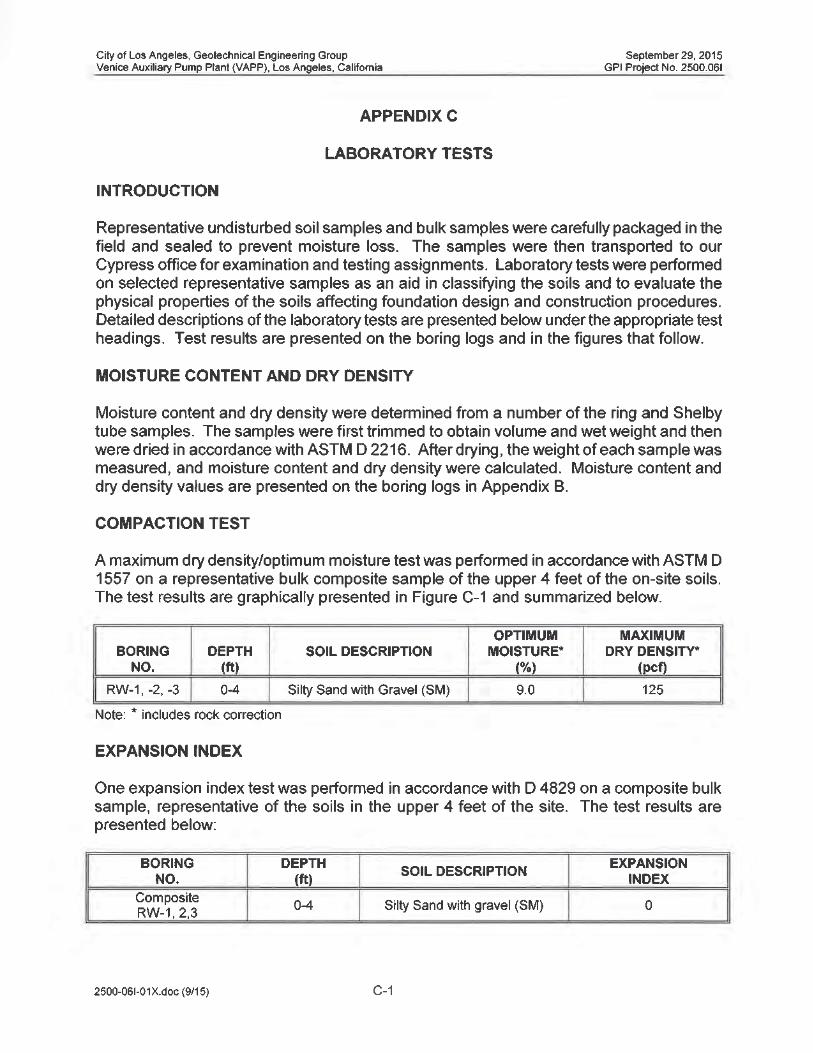
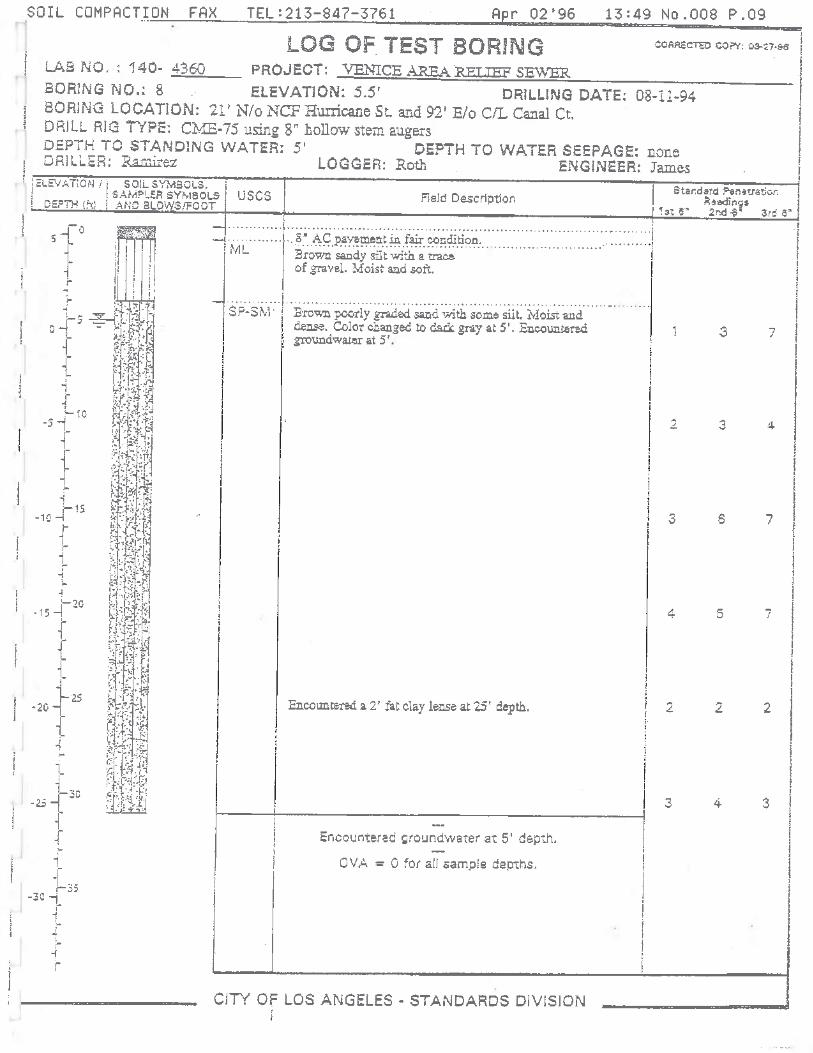
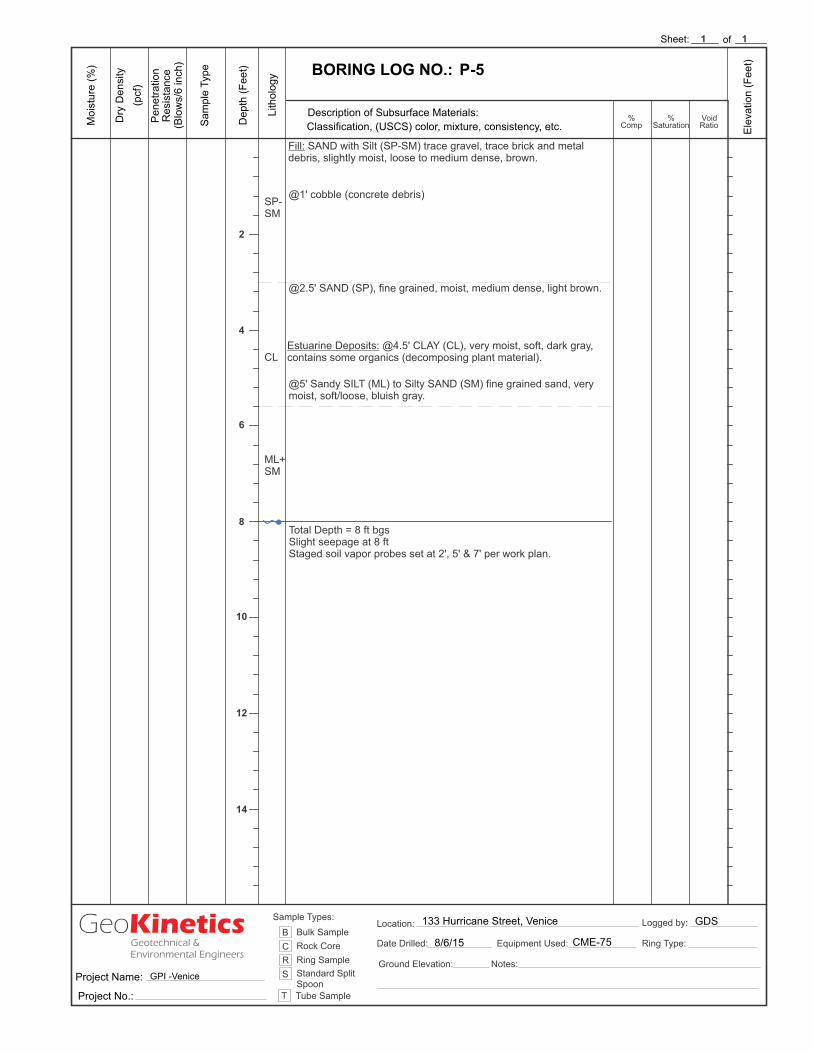
3.0 Field Investigation: The field work associated with the methane gas investigation at the subject property included the installation and monitoring of five (5) multi-stage subsurface gas probes. The locations of these gas probes are shown in Figure 2. The subsurface gas probes were installed on August 6th, 2015 and they were subsequently monitored on August 7th and 11th, 2015.The gas probes were installed using 6” hollow stem auger drilling equipment. A schematic illustrating the general configuration of the gas probes is provided as Figure 3. The LADBS guidelines require that individual sampling tips be installed at depths of 5, 10, and 20 feet below the lowest floor level of theproposed structures. However, based on the known groundwater depth of approximately 8 feet bgs, probes were proposed to be installed on site atdepths of 2, 5 and 7 feet bgs. Per LADBS guidelines, five shallow probes would be installed at a depth of 5’ bgs and then two deeper probes would be installed at the two locations with the highest methane readings. However, in order to save time and reduce costs, all five borings were advanced to 8’ bgs and probe tips were installed at 2, 5 and 7’ bgs in each of the five borings. All five borings were logged in the field under the supervision of a registered engineering geologist. Copies of the boring logs for this project are included as Attachment A for your reference. As indicated, the upper four to five feet primarily consisted of moist fine grained sands. Clay, silty-clay and sandy estuarine deposits were noted just below the fine grain sands in each boring.
The sampling tips of the current installation were embedded within a 12-inch interval of washed Monterey #3 sand. Bentonite clay seals were placed above and below each sand interval in order to isolate the gas sampling tips. Gas tight quick connect fittings were installed on the ends of the polyethylene tubing at the ground surface in order to seal the probes between monitoring events. Flush-mounted vaults were installed at the ground surface to protect the installations.
As discussed previously, the installations were monitored on August 7th and 11th, 2015. All monitoring was performed during periods of falling barometric pressure. The subsurface gas pressure relative to atmospheric, and the concentrations of methane, oxygen, and carbon dioxide, were measured in the subsurface probes during each monitoring event. The monitoring equipment that was utilized and the associated detection limits, or resolutions, are summarized in Table 1. As indicated, subsurface gas pressures were

Methane Gas Investigation Geotechnical Engineering GroupVenice Auxiliary Pumping Plant, Los Angeles August 20, 2015
page 3
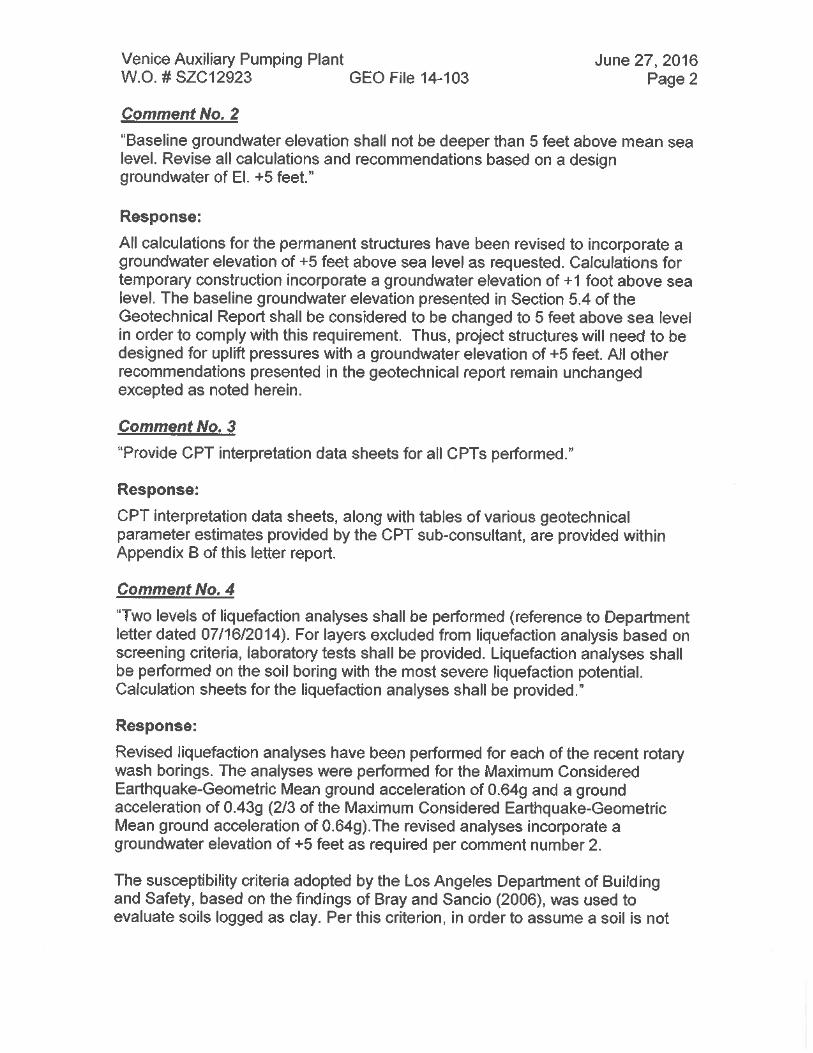
measured to the nearest 0.05 inches of water prior to each sampling event using a Magnahelic gauge while the barometric pressure was measured and recorded to the nearest 0.1 inches of mercury using a digital barometer. The gas probe methane, oxygen, and carbon dioxide concentrations were measured in the field using a portable, methane specific, LandTec GEM2000-Plus infra-red gas analyzer. A volume of gas equivalent to approximately ten times that of the ¼-inch diameter polyethylene gas probe tube was extracted through the LandTec GEM2000-Plus during the monitoring process. Steady state readings were generally obtained after approximately two tubing volumes of gas had been extracted. The highest methane reading displayed in each instance was recorded. The LandTec GEM2000-Plus was calibrated at the beginning and the end of each day of monitoring using a certified mixture of 15% methane, 15% carbon dioxide, and 70% nitrogen calibration gas (Note: all gas concentrations referred to in this report are on a volumetric basis). A Photovac Flame Ionization Detector (FID) was used to confirm combustible gas levels at selected probes where sufficient oxygen was present in the probe to operate the FID. The gas levels measured with both detectors were found to be consistent. Combustible gas concentrations in excess of 450 ppm were not detected with the FID.
Ambient gas levels in the air four feet above the ground surface were recorded at the site periodically during the monitoring. In each instance, the measured gas level fell within the following range:
Gas MeasuredRange
Methane <0.1%
Carbon Dioxide <0.1%
Oxygen 20.8% – 20.9%
4.0 Results: The pressures and concentrations measured in each of the subsurface gas probes during the monitoring events are summarized in Table 2. As indicated, three of the 7’ deep probe tips were flooded with water duringthe monitoring events. Also as indicated, the highest methane gas detection on site was 1,000 ppm (0.1%) at 5 feet bgs at probe P-5. Methane gas was not detected at any of the other gas probe installations. The site FID readings ranged from 0 to 449 ppm for the probes with enough oxygen to record a reading. This is consistent with the LandTec GEM2000-Plus readings.
The soil gas pressures measured in the gas probes range from 0.00 to 0.50inches of water. This pressure range is normal and consistent with normal

Methane Gas Investigation Geotechnical Engineering GroupVenice Auxiliary Pumping Plant, Los Angeles August 20, 2015
page 4
barometric variations. There was no indication of elevated soil gas pressures associated with methane generation or migration.
The concentration of oxygen in the atmosphere at sea level is approximately 21%. The subsurface oxygen levels were found to be slightly to moderately depressed below typical atmospheric levels at each of the gas probe installations. The lowest subsurface oxygen level recorded at the site was 2.5% while the average oxygen concentration measured in the gas probes was approximately 14.6%. The average concentration of carbon dioxide in the atmosphere at sea level is approximately 0.03%. Subsurface carbon dioxide levels were slightly to moderately elevated above typical atmospheric levels in each of the gas probes. The highest carbon dioxide concentration measured at the site was 3.2% while the average carbon dioxide concentration measured in the gas probes was approximately 1.3%. The slightly to moderately depressed subsurface oxygen levels and slightly to moderately elevated carbon dioxide levels suggest residual organic matter entrained within the near surface soils is being biodegraded under aerobic conditions.
Based upon the measured methane levels and the corresponding soil gas pressures, we conclude the property should be classified as a Level II site with a Design Methane Pressure of • 2" of water in accordance with LADBS guidelines. A copy of the LADBS methane testing compliance form for this project is included as Attachment B for your reference.
As discussed previously, the property is shown to be located within a Methane Zone. The following primary methane mitigation measures are typically required by LADBS for new Level II slab-on-grade structures within the methane zone:
1. Sub-Slab Vent System: A series of perforated vent lines and an associated 2" thick gravel blanket must be installed beneath the floor slab of the proposed structure. The perforated vent lines are connected to solid vent piping that extends through the walls or pipe chases of the building to outlets above the roof line. A dewatering system (sump and pump) must be installed if the design high groundwater level for the project is not at least one foot below the lowest vent piping elevation. A dewatering system is not necessary for on-grade structures for this project.However, structures that extend below approximately 5’ bgs will likely need either a dewatering system, or be constructed hydrostatically. If the hydrostatic option is selected, a modification from LADBS will likely be required in order to remove the sub-slab venting system requirement.

Methane Gas Investigation Geotechnical Engineering GroupVenice Auxiliary Pumping Plant, Los Angeles August 20, 2015
page 5
2. Impervious Membrane: A continuous gas membrane is required below the floor slab of the structures. This membrane must be sealed against footings, pilings, and utilities to form a gas-tight barrier beneath the buildings.
3. Utility Trench Dams: A section of impervious backfill consisting of compacted native soil or sand / cement slurry must be installed in utility trenches that extend beneath the perimeter of the buildings in order to prevent methane gas from migrating beneaththe structure through sand bedding or backfill.
4. Conduit Seals: Gas tight seals must be installed on all conduits (e.g. electrical, cable T.V., telephone, etc.) that extend to the interior of the structure. The purpose of these seals is to prevent methane gas from entering subsurface cracks or discontinuities in the conduits and subsequently migrating to the interior of the buildings.
There are exceptions in the City Methane Ordinance (Ordinance No. 175790) that allow some of the requirements outlined above to be omitted, or modified, under certain conditions. These possible exceptions should be considered as the building plans are developed in order to determine the specific mitigative measures that will be required for the project.
5.0 Closing: This investigation has been performed with the degree of skill and care ordinarily exercised by engineers practicing in this, and similar, localities. No other warranty, expressed or implied, is given regarding the conclusions or professional opinions presented in this report. The scope of this report is limited to the matters expressly covered herein. This report is presented for the sole use of the Geotechnical Engineering Group and may not be relied upon by any other party without written authorization from GeoKinetics. All recommendations, findings, and conclusions presented in this report are based upon facts and circumstances as they existed at the time this report was prepared. A change in any fact or circumstance upon which this report is based may necessitate re-evaluation and/or modification of the recommendations, findings, and conclusions presented herein. Due to the nature of this type of investigation, uncertainty exists with respect to the subsurface conditions that are present between boring / sampling locations. The subsurface methane concentrations at the site could vary over time and may change in response to site modifications. The methane levels identified in this report represent the concentrations that were measured at the time of the


Table 1. Gas Probe MonitoringEquipment & Parameters
Parameter EquipmentDetection Limit or
ResolutionRange
Barometric Pressure Digital Barometer 0.1" of Hg 25 to 36 in Hg
Gas Probe Pressure Pressure Gauge 0.1" of H2O -5 to +5 in H2O
Methane Concentration
LandTec GEM2000-Plus Infrared Gas
Analyzer
0.1% 0.1% to 100%
FID0.1 ppm 0.1 to 1,000 ppm
1 ppm 1 to 10,000 ppm
Carbon Dioxide Concentration
LandTec GEM2000-Plus Infrared Gas
Analyzer
0.1% 0.1% to 50%
Oxygen Concentrations
LandTec GEM2000-Plus Infrared Gas
Analyzer
0.1% 0.1% to 25%

CH4 CO2 O2
8/7/2015 0.00 1.4 18.7 0.00 29.9 0.08/11/2015 0.00 1.5 19.0 0.00 29.9 0.08/7/2015 0.00 1.6 17.7 0.00 29.9 6.68/11/2015 0.00 2.1 17.8 0.00 29.9 0.88/7/2015 0.00 0.1 15.9 0.00 29.9 200.08/11/2015 29.9 -8/7/2015 0.00 0.8 18.8 0.00 29.9 0.08/11/2015 0.00 1.1 18.7 0.00 29.9 0.28/7/2015 0.00 2.2 14.9 0.00 29.9 9.68/11/2015 0.00 3.2 14.8 0.00 29.9 4.68/7/2015 0.00 0.4 16.7 0.50 29.9 449.08/11/2015 0.00 1.6 6.9 0.00 29.9 flameout8/7/2015 0.00 0.8 17.6 0.00 29.9 0.98/11/2015 0.00 1.2 17.7 0.00 29.9 0.38/7/2015 0.00 3.7 9.2 0.00 29.9 flameout8/11/2015 0.00 3.9 10.0 0.00 29.9 flameout8/7/2015 0.00 0.2 9.9 0.00 29.9 flameout8/11/2015 0.00 0.6 2.5 0.00 29.9 flameout8/7/2015 0.00 0.6 19.9 0.00 29.9 0.08/11/2015 0.00 0.3 19.8 0.00 29.9 0.08/7/2015 0.00 0.5 7.7 0.00 29.9 flameout8/11/2015 0.00 0.8 8.2 0.00 29.9 flameout8/7/2015 29.9 -
8/11/2015 29.9 -8/7/2015 0.00 0.5 18.4 0.00 29.9 10.68/11/2015 0.00 0.9 18.1 0.00 29.9 0.78/7/2015 0.10 0.4 13.2 0.00 29.9 flameout8/11/2015 0.00 2.0 13.7 0.00 29.9 flameout8/7/2015 29.9 -
8/11/2015 29.9 -
8/7/2015 0.00 0.0 20.9 - 29.9 1.48/11/2015 0.00 0.0 20.8 - 29.9 0.08/7/2015 0.00 0.0 20.9 - 29.9 1.6
8/11/2015 0.00 0.0 20.8 - 29.9 1.3
133 Hurricane Street - Methane Investigation Los Angeles, California
Multi-Stage Gas Probe Monitoring Results
5
Background
P-5
7
7
5
Post-Monitoring
GASCONCENTRATION (%) GAS PROBE
PRESSURE(IN H20)
P-4
2
GAS PROBE # MONITORINGDATE
PROBE DEPTH(feet)
flooded
P-1
2
5
Level I: 0 - 100 ppm (0% to 0.01%)
Level V: Greater than 12,500 ppm (>1.25%)
Level III: 1,001 - 5,000 ppm (>01% to 0.5%)
Level IV: 5,001 to 12,500 ppm (>0.5% to 1.25%)
Level II: 101 - 1,000 ppm (>0.01% to 0.1%)
2
Pre-Monitoring
floodedflooded
P-2
2
5
7
P-3
2
5
7
7
FID (ppm)
flooded
flooded
BAROMETRIC PRESSURE
(IN Hg)
Page 1 of 1


Attachment ABoring Logs


Attachment BMethane Gas Investigation
Compliance Certificate


7.1-270