appendix - regents of the university of...
TRANSCRIPT

APPENDIX

A-2
Display A Res iden t U n dergradu at e S t u den t F ee Levels Com pared t o F ees
in Con s t an t 1971 D ol lars (Man dat ory S ys t em w ide F ees )
$ 0
$ 1 ,0 0 0
$ 2 ,0 0 0
$ 3 ,0 0 0
$ 4 ,0 0 0
$ 5 ,0 0 0
1 9 7 1 1 9 7 8 1 9 8 5 1 9 9 2 1 9 9 9
Actu a l Fe e s
Co n s t a n t Do lla rs
2 0 0 3
As Display A shows, historically fees were very low for a long period of time. This was
because adequate state support allowed fees to remain stable. With the decline in state support, fees rose sharply in the early 1990s. We have had periods
of no increases and periods of dramatic increases. Most recently, we had no increase in mandatory systemwide fees for seven consecutive years until the mid-year student fee increase was instituted for the Spring 2003 term. In fact, as a result of the state’s actions in the late 1990s, fees for California resident undergraduates were reduced by 10%; for California resident graduate academic students they were reduced 5%.
Display A also looks at the increases that have occurred in constant 1971 dollars.

A-3
Display B
Year
1995-96 $ 3,799 5.30% $ 4,000 1996-97 3,799 6.90% 4,276 1997-98 3,799 4.50% 4,469 1998-99 3,609 4.50% 4,670 1999-2000 3,429 4.15% 4,864 2000-01 3,429 4.50% 5,083 2001-02 3,429 4.90% 5,332 2002-03 3,564 7.82% 5,749
2002-03 UC Miscellaneous Fees $ 453 $ 453
2002-03 UC Total Fees $ 4,017 $ 6,202
2002-03 Average of Total Fees at Public Comparison Institutions $ 6,170
Undergraduate Student FeesAdjusted for Increases in Per Capita Personal Income
What Fees WouldHave Been Without
IncreasePCPI
FeesMandatory
Actual
FeesAdjusted
State Buyouts/Reductions
Display B shows what would have happened if, during the time between 1994-95 and 2002-03, the University had adjusted mandatory systemwide fees by the annual increase in California per capita personal income, consistent with the Partnership Agreement.
The average of student charges for UC undergraduate students in 2002-03 would have been
$6,202, an increase of $2,185 over the actual average of $4,017, which would have been on par with the average of total tuition and fees charged at the University’s public comparison institutions.
With the student fee increases proposed for 2003-04, we estimate this gap will lessen considerably (see Display C on the next page).
A-4
Display C
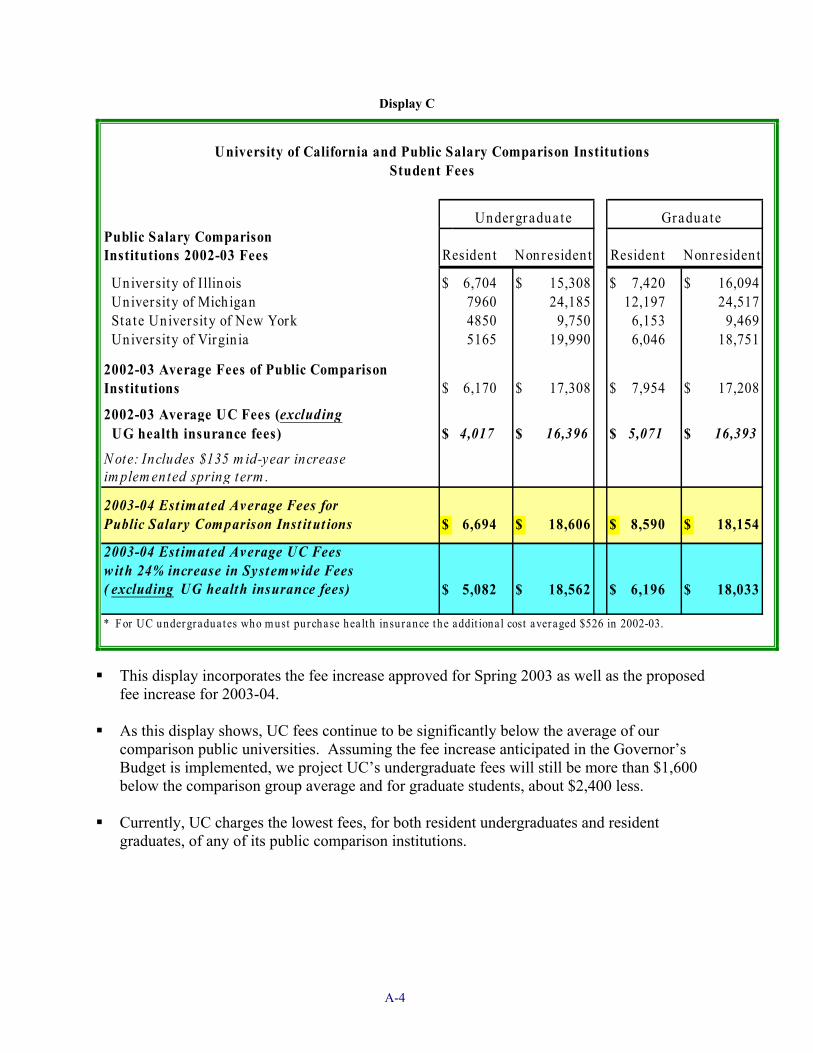
Public Salary ComparisonInstitutions 2002-03 Fees
University of Illinois $ 6,704 $ 15,308 $ 7,420 $ 16,094 University of Mich igan 7960 24,185 12,197 24,517 Sta te University of New York 4850 9,750 6,153 9,469 University of Virgin ia 5165 19,990 6,046 18,751
2002-03 Average Fees of Public Comparison Institutions $ 6,170 $ 17,308 $ 7,954 $ 17,208
2002-03 Average UC Fees (excluding UG health insurance fees) $ 4,017 $ 16,396 $ 5,071 $ 16,393N ote: Includes $135 m id-year increase im plem ented spring term .
2003-04 Est imated Average Fees for Public Salary Com parison Inst itut ions $ 6,694 $ 18,606 $ 8,590 $ 18,154
2003-04 Est imated Average UC Fees w ith 24% increase in Syst emw ide Fees( excluding UG health insurance fees) $ 5,082 $ 18,562 $ 6,196 $ 18,033
* For UC undergraduates who must purchase health insurance the addit ional cost averaged $526 in 2002-03.
Residen t Nonresiden t Residen t Nonresiden t
University of California and Public Salary Comparison InstitutionsStudent Fees
Undergradua te Graduate
This display incorporates the fee increase approved for Spring 2003 as well as the proposed fee increase for 2003-04.
As this display shows, UC fees continue to be significantly below the average of our
comparison public universities. Assuming the fee increase anticipated in the Governor’s Budget is implemented, we project UC’s undergraduate fees will still be more than $1,600 below the comparison group average and for graduate students, about $2,400 less.
Currently, UC charges the lowest fees, for both resident undergraduates and resident
graduates, of any of its public comparison institutions.
A-5
Display D
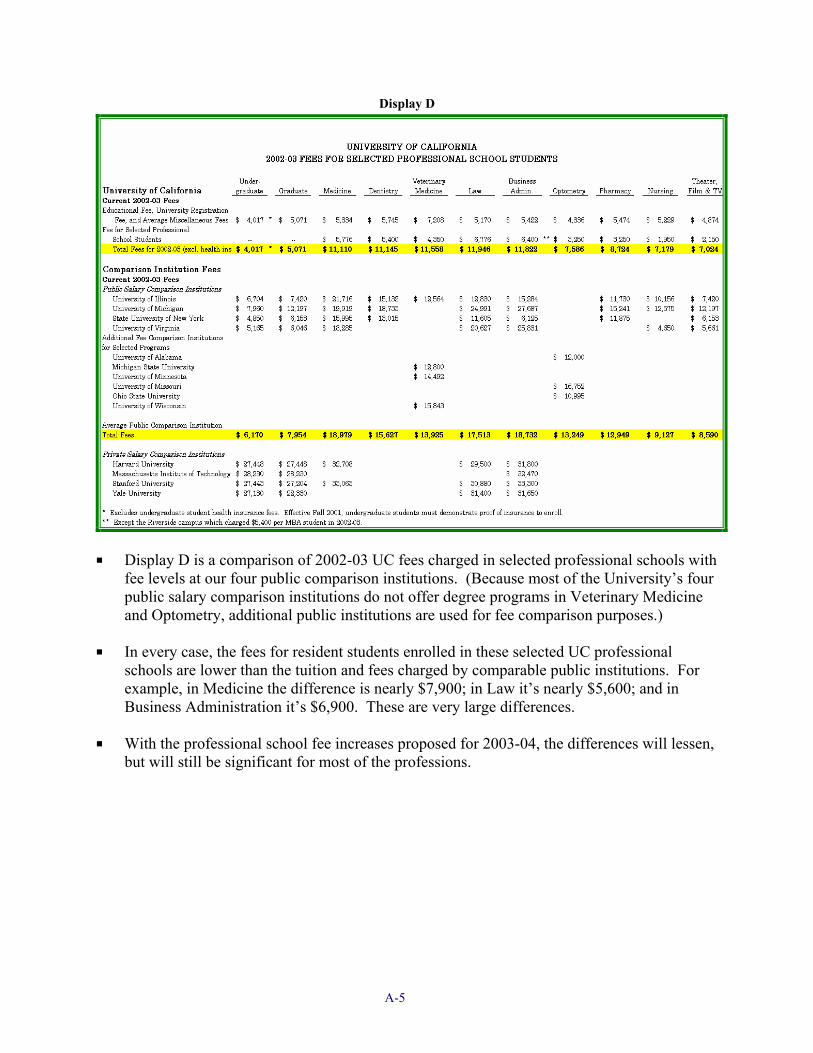
Display D is a comparison of 2002-03 UC fees charged in selected professional schools with fee levels at our four public comparison institutions. (Because most of the University’s four public salary comparison institutions do not offer degree programs in Veterinary Medicine and Optometry, additional public institutions are used for fee comparison purposes.)
In every case, the fees for resident students enrolled in these selected UC professional
schools are lower than the tuition and fees charged by comparable public institutions. For example, in Medicine the difference is nearly $7,900; in Law it’s nearly $5,600; and in Business Administration it’s $6,900. These are very large differences.
With the professional school fee increases proposed for 2003-04, the differences will lessen,
but will still be significant for most of the professions.

A-6
Display E
Pell Grants $ - $ 101.5 $ - $ - $ - $ 101.5 Ca l Gran t A 75.4 75.4 Ca l Gran t B 48.6 48.6 Other 2.4 54.1 229.3 99.7 36.8 422.3
126.3 155.6 229.3 99.7 36.8 647.7
Perkins Loans 29.3 29.3 FFELP/FDSLP 483.8 483.8 Other - 4.2 3.0 1.3 11.3 19.8
- 517.3 3.0 1.3 11.3 532.9
Federa l 19.0 19.0 Sta te 1.2 1.2 Un iversity - - - - - 0.1
Subtotal 1.2 19.0 -- -- -- 20.2
$ 127.5 $ 691.8 $ 232.4 $ 101.0 $ 48.1 $ 1,200.8
Tot als do not add due t o rounding
Total
Sta te Genera l Funds and
Studen t Fees
Other University
Funds
University Funds
Scholarships, Grants, Fellowships
Subtotal
Loans
Subtotal
Work-Study
2000-01 Student Financial Aidby Type of Award and Fund Source
($ in Millions)
Studen t Aid Commission Federa l
Pr iva te Funds Tota l
As consideration is given to raising student fees, it is important to also look at financial aid. Financial aid is a major component in our ability to maintain access for needy students. The
University is very proud of its financial aid programs. Display E shows that when all fund sources are included, UC students received
$1.2 billion in financial aid in 2000-01 (the most recent year for which actual data is available).
Nearly $650 million in financial aid was in the form of scholarships, grants, and fellowships,
which is about the same amount of revenue generated by student fee income in that year. State and University funds are primarily used for grants and scholarships; most federal
money is in the form of loans. Nearly 50% of UC undergraduates receive grant/scholarship aid and for graduate academic
students it’s about 66%. The average grant for undergraduates is about $6,400 and about $10,500 for graduates in academic degree programs.
The Cal Grant Entitlement program, newly implemented with the 2001-02 award cycle,
provides further guarantee of access for needy undergraduate students.

A-7
Display F
S t u den t F in an cia l Aid Expen dit u res Exclu din g Loan s ($ in Mil l ion s )
$ 0
$ 1 0 0
$ 2 0 0
$ 3 0 0
$ 4 0 0
$ 5 0 0
$ 6 0 0
$ 7 0 0
1 9 9 0 -9 1 1 9 9 2 -9 3 1 9 9 4 -9 5 1 9 9 6 -9 7 1 9 9 8 -9 9 2 0 0 0 -0 1
Fe de ra l F in a n ica l Aid
Ca lifo rn ia S tu de n tAid Co m m is s io n
U C S tu de n t Fe e s & G e n e ra l Fu n ds
O th e r U C Fu n ds
Priv a te
S ourc e : UCOP Off ic e of Ac a de mic Affa irs
This chart shows the growth in financial aid over time, excluding loans. It is very impressive
to see the dramatic growth over the years. For example, between 1990-91 and 2000-01, financial aid grants and other gift-funded aid
from University sources more than doubled. Remember that there was no increase in student fees between 1994-95 and 2002-03, and that
in 1998-99 and 1999-2000 there were fee reductions. The state could have chosen to reduce financial aid correspondingly with fee reductions. Instead, the state continued the level of funding for financial aid, thus allowing our financial aid dollars to be stretched further. However, this $17 million bonus was eliminated from our budget in 2002-03.
With the student fee increases proposed for 2003-04, the financial aid funded from UC
student fees and Cal Grants will show a steep increase for that year—UC financial aid will increase by nearly $90 million and Cal Grants for UC students will increase by over $30 million.

A-8
Display G
H ow N eed-Bas ed Aid Recipien t s H ave P aid for Cos t s , 1990-91t o P res en t * (2001-02 Con s t an t D ol lars )
0
2 ,0 0 0
4 ,0 0 0
6 ,0 0 0
8 ,0 0 0
1 0 ,0 0 0
1 2 ,0 0 0
1 4 ,0 0 0
1 6 ,0 0 0
1990 -91
1991 -92
1992 -93
1993 -94
1994 -95
1995 -96
1996 -97
1997 -98
1998 -99
1999 -00
2000 -01N
eed-
Bas
ed A
id R
ecip
ien
ts' A
vera
ge C
ost
of A
tten
dan
ce
Gift Aid Pa rent Cont ribut ion Loa n/workAid by type n ot yet available for 2001-02.
$
Undergraduate financial aid recipients are expected to make a contribution to their educational expenses from earnings and borrowing. The goal of the University’s Education Financing Model is to keep the expected contribution manageable so students are able to make steady progress toward completion of the baccalaureate degree and to meet loan repayment obligations after graduation.
In recent years, strong economic performance has resulted in growing levels of grant
assistance going to University financial aid recipients. As shown in this display, the amount students have had to contribute to their educational expenses from earnings and borrowing has declined in each of the last four years.
The University’s goal is to keep the loan/work expectation reasonable, as it was in 2000-01.
We believe the financial aid levels being proposed with the increases in student fees will achieve this.

A-9
Display H
U C F acu lt y S a laries as % of Com paris on In s t i t u t ion s
8 0 %
9 0 %
1 0 0 %
1 1 0 %
1 2 0 %
1988-89 1991-92 1994-95 1997-98 2000-01 2003-04
Source: Office of the President Salary Survey
Perhaps the most worrisome problem facing the University for the long term is an inability to
pay competitive salaries as a result of the budget shortfalls. Paying competitive salaries is absolutely critical to the University’s ability to accommodate students. The promise of accessibility is an empty one if the University can’t hire the high quality faculty needed to teach the students who are admitted and if students can’t complete their BA degrees within a reasonable length of time.
Funding for salary increases for UC employees in the 2001-02 and 2002-03 budgets fell short
of what was needed to stay competitive; for the 2003-04 budget, there is no funding provided for salary increases.
Display H shows the degree to which faculty salaries over time have compared to the average
salaries at the University’s faculty salary comparison institutions. It points out the gap that has occurred in recent years, as well as the degree to which this gap increases without funding for COLAs.
Based on the CPEC methodology for comparing UC salaries with faculty from comparison
institutions, it is estimated that University salaries are about 5% behind in the current year; that gap will grow to about 9% in the budget year and will be greater if faculty merits are not provided.
California is already a hard sell because of our cost of living; we will simply not be able to
hire the 7,000 new faculty we need over this decade if we can’t pay competitive salaries. The gap in competitive salary levels is of deep concern to the University. While there is no
single measure for quality of an institution, the excellence of its faculty is surely a primary indicator—and the key to attracting excellent faculty is offering competitive salaries.

A-10
In a survey conducted by the University spanning the last half of the 1990s, the reason most often cited by first-offer candidates for not accepting a UC appointment was that they had received a better salary offer elsewhere. Nothing is more certain to undermine quality than a persistent inability to offer competitive salaries. The University must be able to compete for the best faculty if its quality is to be maintained. This is particularly important during a time of unprecedented enrollment growth when campuses must hire thousands of new faculty over this decade.

A-11
Display I % In creas e/D ecreas e in S t at e F u n din g for S t aff S a laries
-4 %
-2 %
0 %
2 %
4 %
6 %
8 %
1 0 %
19 9 2 -9 3 19 9 4 -9 5 19 9 6 -9 7 19 9 8 -9 9 2 0 0 0 -0 1 2 0 0 2 -0 3
UC S ta f f S a la ry Inc re a s e F unding M a rke t - We s te rn R e g io n
Source: Wo rld at Wo rk, "Annual Salary Bud get Survey"
Of equal concern are staff salaries.
As with faculty salaries, funding for salary increases for UC staff employees in the 2001-02
and 2002-03 budgets fell short of what was needed to stay competitive; for the 2003-04 budget, there is no funding provided for salary increases.
Display I compares the annual salary increase funding for UC staff employees with market
data from over 800 employers of all sizes and industries, including the public sector, in the western United States. As the chart shows, market salaries have been increasing at approximately 4% per year, but UC staff salaries have not been keeping pace, especially in recent years when the state’s fiscal crisis has prevented full funding of the Partnership Agreement.

A-12
Display J
1990-91 1.5% 5.0%
1991-92 0.0% 0.0%
1992-93 1.5% 0.0%
1993-94 1.5% -3.5%
1994-95 1.5% 6.5% *
1995-96 1.5% 1.5%
1996-97 1.5% 2.0%
1997-98 1.5% 2.0%
1998-99 1.5% 2.0%
1999-00 1.5% 2.0%
2000-01 1.5% 3.7%
2001-02 1.5% 0.4%
2002-03 1.5% 0%
2003-04 (proposed) 0% 0%* Includes restora t ion of 3.5% sa lary decrease from 1993-94.
COLAMer it
Increase
Staff Salary Increases1990-91 through 2003-04
The lack of salary funding in the early 1990s combined with the last two years of insufficient
salary funding have put staff salaries behind where they otherwise would have been, on average, by about 7.5%. This gap could grow even larger if the Governor’s proposal to delay scheduled pay increases for state employees is not approved.
The University received $19 million in 2000-01 as the first part of a multi-year plan to make up for the lack of salary increases in the early 1990s and provide more competitive salaries in coming years.
Unfortunately, with several years of underfunding the Partnership, we have been unable to
close the gap. The University is deeply concerned about the widening gap between funds available to
support salary increases and the resources needed to fund more competitive salaries. It will be very difficult to recruit and retain the faculty and staff we need to accommodate student enrollment growth if we cannot offer competitive salaries. We believe it is not only critical that we lose no further ground with respect to competitive salaries, but also that we must close this gap as soon as possible.