appf: the australian plant phenomics facility · measuring systems and traits to be measured –...
TRANSCRIPT

EPSO: The European Plant Science OrganisationEPSO Workshop on Plant PhenotypingNovember 02-03, 2009Forschungszentrum Jülich, Germany
Forschungszentrum Jülich, GermanyICG-3: PhytosphereJülich Plant Phenotyping Centre (JPPC)Website: http://www.jppc.de
http://www.plantphenomics.com/phenotyping2009
Bob Furbank, Australian Plant Phenomics Facility, Canberra, Australia
APPF: The Australian Plant Phenomics Facility
AustralianPlant Phenomics Facility
http://www.plantphenomics.org.au/

Phenotyping - the new bottleneck in plant science
Genomics is accelerating gene discovery but how do we capitalise on these data sets to establish gene function and development of new genotypes?
High throughput and high resolution analysis capacity now the factor limiting discovery of new traits and varieties
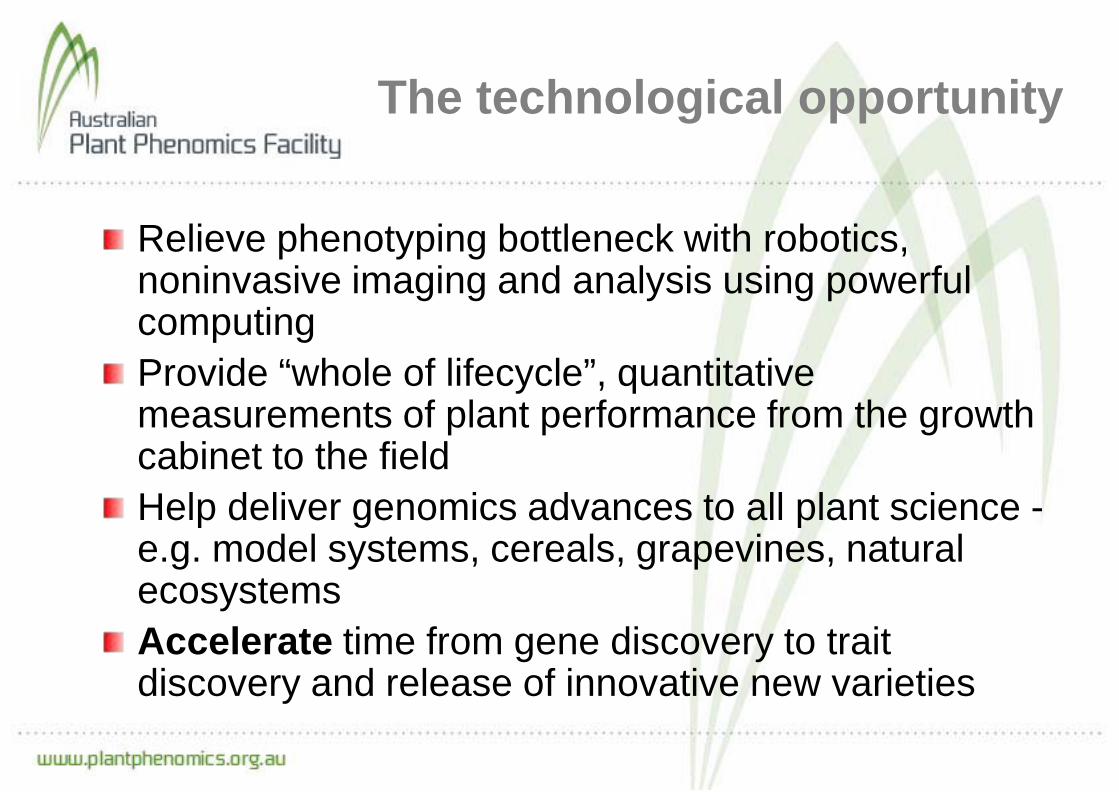
The technological opportunity
Relieve phenotyping bottleneck with robotics, noninvasive imaging and analysis using powerful computingProvide “whole of lifecycle”, quantitative measurements of plant performance from the growth cabinet to the fieldHelp deliver genomics advances to all plant science -e.g. model systems, cereals, grapevines, natural ecosystemsAccelerate time from gene discovery to trait discovery and release of innovative new varieties

Why high throughput phenotyping?
Phenotyping essential forfunctional analysis of specific genesforward and reverse genetic analysesproduction of new plants with beneficial characteristics
High throughput essential for phenotypingin different growth conditions (e.g. under biotic or abiotic stress)of many different lines (to discover the desirable line)
– mutant populations– mapping populations– breeding populations– germplasm collections

Measuring systems and traits to be measured – model plants to crops
–Colour imagesPlant area, volume, mass, structure, phenology Senescence, relative chlorophyll content, pathogenic lesionsSeed yield, agronomic traits
–Near IR imagingTissue water contentSoil water content
–Far IR imagingCanopy / leaf temperature / water use / salt tolerance
–Fluorescence imagingPhysiological state of photosynthetic
machinery–Hyperspectral imaging
Carbohydrates, pigments and protein–Carbon isotope ratio
Transpiration efficiency, photosynthetic pathway (TDL/MS)
–FTIR Imaging Spectroscopy Cellular localisation of metabolites
(sugars, protein, aromatics)
Key technologies

Australian Plant Phenomics Facility – two nodes
Plant Accelerator AdelaideMark Tester ([email protected])
High Resolution Plant Phenomics CentreCanberra
Bob Furbank ([email protected])
Australian Plant Phenomics Facility – two nodes
$26.56 m $15.89 m
Plus $10M in Stimulus Package

The Plant Accelerator
4,485 m2 building, 2,340 m2 of greenhouses, 250 m2 for growth chambersGrow >100,000 plants annually in a range of conditions4 x 140 m2 fully automated ‘Smarthouses’– plants delivered on 1.2 km of conveyors to five sets of cameras– high capacity image capture and analysis equipment– regular, non-destructive measurements of growth, development, physiology
First public sector facility of this type and scale in the world

High Resolution Plant Phenomics CentreFrom growth cabinet to the field
‘Deep phenotyping’ technology - development, validation and deployment
Model Plant Module (HTP)Crop Plant Shoot Module (MTP)Crop Plant Root Module (MTP)Crop Plant Field Module (HTP)
1500 m2 lab space and ‘research hotel’ Imaging modules interfaced with 245 m2 greenhouse,
260 m2 growth cabinets Large field site with distributed sensor networks portable ‘phenomobile’ and 15m imaging tower

Model plant module
• Growth and morphology• Photosynthetic performance (Chl Fluor) under defined environmental conditions
Fluorogro-scan TrayScan RGB / FIR in-Cabinet
•IR screening for leaf temperature• Automated destructive sampling for metabolites, protein, DNA and RNA, delta13C
Target plants : Arabidopsis, Tobacco, Brachypodiumand seedling screens
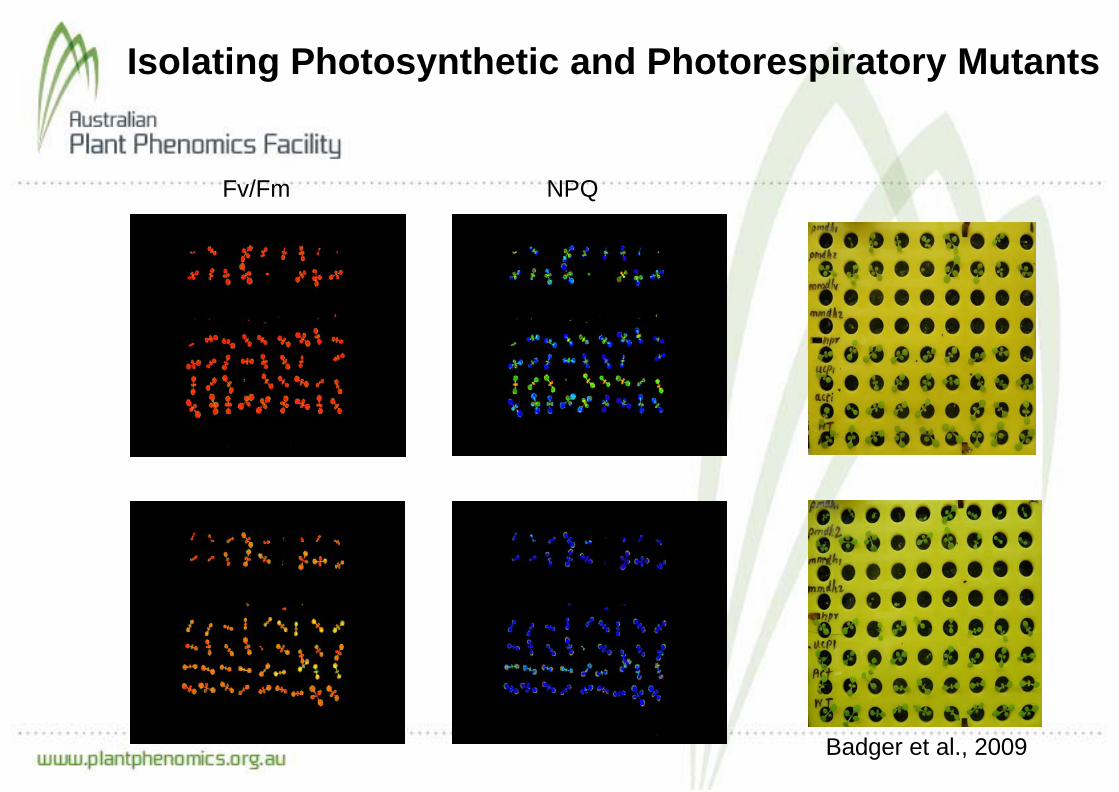
Isolating Photosynthetic and Photorespiratory Mutants
Fv/Fm NPQ
Badger et al., 2009

Quantification of Leaf Colors
PlantsColumbia alx8 C24 fry1-1
Area
(cm
2 )
0
2
4
6
8
10
12
14
16
18
20
Dark greenLight greenMedium green
Data Analysis: non-destructive Growth Analysis and morphological
clustering• Leaf area / growth analysis (eg heterosis and drought stress)• Photosynthetic mutants• Lesions / pathogen attack• Architecture / morphology• Morphological clustering• PODD phenotypic dBase
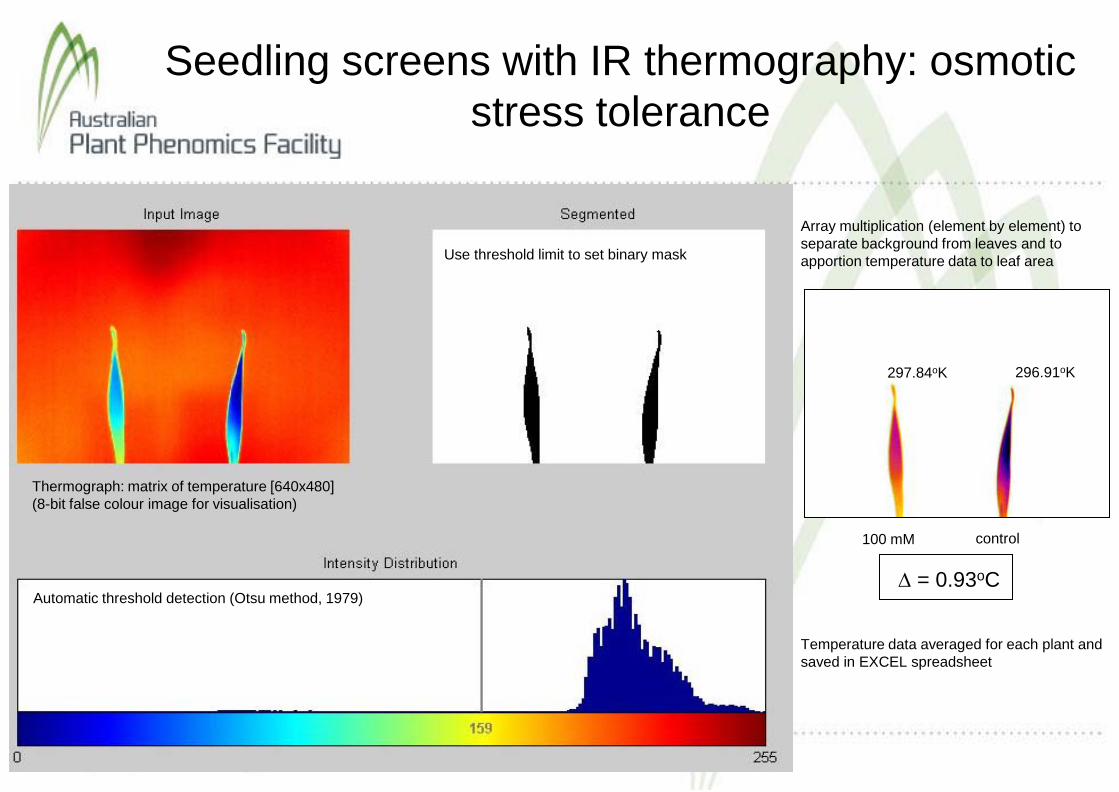
Array multiplication (element by element) to separate background from leaves and to apportion temperature data to leaf area
control
297.84oK 296.91oK
∆ = 0.93oC
100 mM
297.84oK 296.91oK
Temperature data averaged for each plant and saved in EXCEL spreadsheet
Seedling screens with IR thermography: osmotic stress tolerance
Thermograph: matrix of temperature [640x480](8-bit false colour image for visualisation)
Automatic threshold detection (Otsu method, 1979)
Use threshold limit to set binary mask

0
0.5
1
1.5
2
2.5
Coulter Seklavi Brkulja CandicansGenotype
Chan
ge in
leaf
tem
pera
ture
due
to sa
linity
(1
50m
M) (C
)
Physiological consequences of osmotic stress
Barley and wheat genotypes of knownosmotic tolerance screened by growth analysis and at 2 leaf stage by IR imaging.Rankings were identical
Osmotic sensitive
Osmotic tolerant
Sirault, James and Furbank Functional Plant Biology (2009)
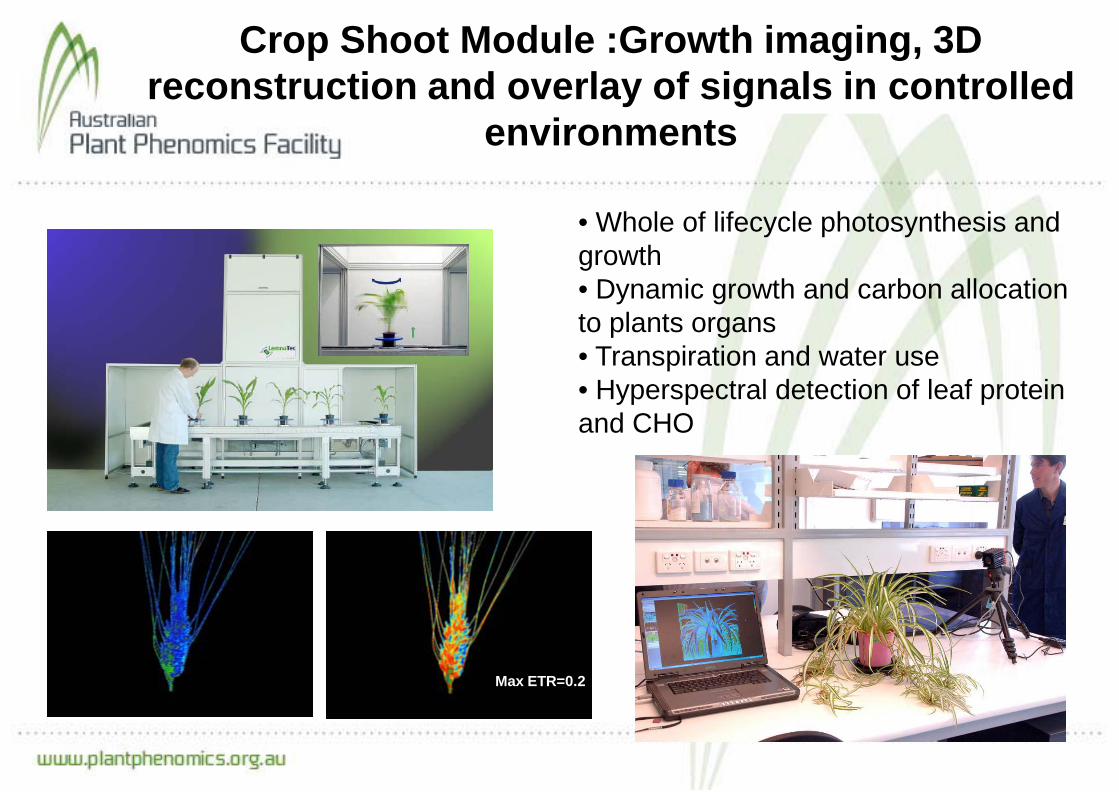
Crop Shoot Module :Growth imaging, 3D reconstruction and overlay of signals in controlled
environments
• Whole of lifecycle photosynthesis and growth • Dynamic growth and carbon allocation to plants organs• Transpiration and water use• Hyperspectral detection of leaf protein and CHO
Max ETR=0.2
Max NPQ=1.25
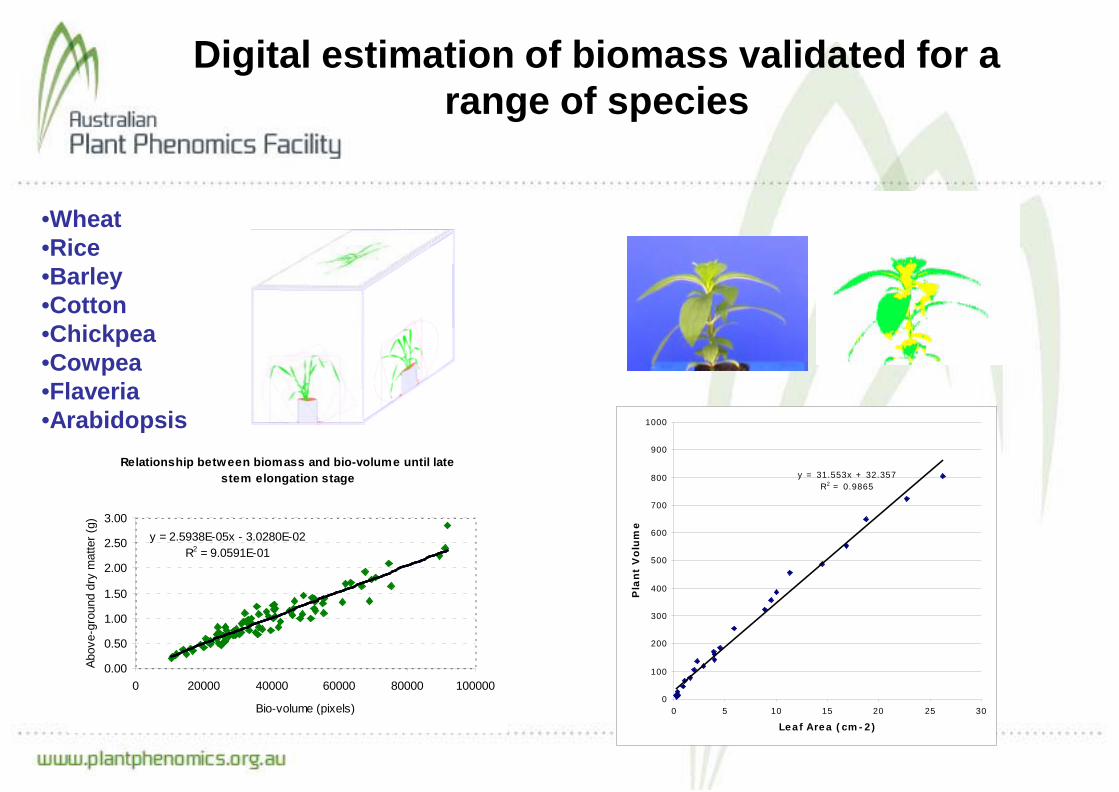
Relationship between biomass and bio-volume until late stem elongation stage
y = 2.5938E-05x - 3.0280E-02R2 = 9.0591E-01
0.00
0.50
1.00
1.50
2.00
2.50
3.00
0 20000 40000 60000 80000 100000
Bio-volume (pixels)
Abov
e-gr
ound
dry
mat
ter (
g)
y = 31.553x + 32.357R2 = 0.9865
0
100
200
300
400
500
600
700
800
900
1000
0 5 10 15 20 25 30
Leaf Area (cm-2)
Pla
nt
Vo
lum
e
Digital estimation of biomass validated for a range of species
•Wheat•Rice•Barley•Cotton•Chickpea•Cowpea•Flaveria•Arabidopsis

Clipper Vlamingh
Object properties
• minimum enclosing rectangle• minimum enclosing circle• convex hull• compactness
e.g. wilting:- Alters rectangle parameters- Increases area below top of pot- Increases the rotational moment
System can quantify morphometric parameters e.g. canopy density, wilting
Bettina Berger TPA

Application of Colour Classification:Boron Toxicity Screens
Classified image
Line Green area Necrosis area % Necrosis
Sahara 30739 4232 12%
Clipper 11640 15321 57%
Original image
Treated with 100 µM GeO2, 8 d
Julie Hayes, Margie Pallotta and Tim Sutton

B toxicity - leaf symptoms Ge toxicity - leaf symptomsJefferies et al. 1999. TAG 98, 1293-1303 Hayes et al., unpubl., using LemnaTec
QTL for Ge tolerance identified using LemnaTec similar to
QTL for B tolerance (1999)

Colour classification:Tissue tolerance index in monococcum
wheat
0%10%20%30%40%50%60%70%80%90%
100%
MDR 043 C
MDR 043 T
Proj
ecte
d sh
oot “
area
”
Accessions
Leaf colour classification
Necrosis
Chlorosis
Green area
Rajendran et al (2009) Plant Cell Environ 32, 237-249

Crop Plant Root Module : NIR imaging of soil moisture at TPA and HRPPC
Results of NIR monitoring allow measurement of spatial distribution water content in soil
0h 2h 4h 6h 8h
0
500
1000
1500
2000
0 h 2 h 4 h 6 h 8 h
area
cla
ssifi
catio
n pi
xel
total development of drying over time
Data courtesy of Lemnatec

Rhizotron Shoot and Root Growth Imaging System HRPPC
Camera: FLEA2 – 2448 x 2048 pixels- 2/3’’ CCD
Top view
2 side views
Roots
Camera 1
Camera 2
Camera 3
Mirror
FireWire Hub
Green LED bank
Rhizobox
Watt, Nagel, Sirault,Furbank

Field Module: High Throughput Phenotyping in the field
• Non-destructive estimate of biomass and crop structure pre and post-canopy closure
• Remote sensing of stress response, canopy water loss and photosynthetic response
• Remote sensing of chemical composition : CHO, protein N, pigments over entire lifecycle
• Application of distributed sensor networks for simultaneous continuous monitoring in the field (micromet plus low res versions of the above)
• Non-destructive detection of water and root biomass at depth in soil

Ground-based : Phenomobile and Imaging tower
• Variable span buggy 3M boom• IR Camera + Hyperspec Radiometer / camera•Stereo camera / Lidar• 2cm Hi Res GPS registers all data•Porometer / SPAD Licor 6400•Fits on a trailer
Gives 1m2 area coverage at 2M boom height
15m tow behind tower

55mm cube 640X480 Microbolometer weighs 300g
10m2 plots600 plots perimage
Acquisition time10 min
FIR plus RGB
UAV High Throughput Imaging
Scott Chapman CSIRO Brisbane
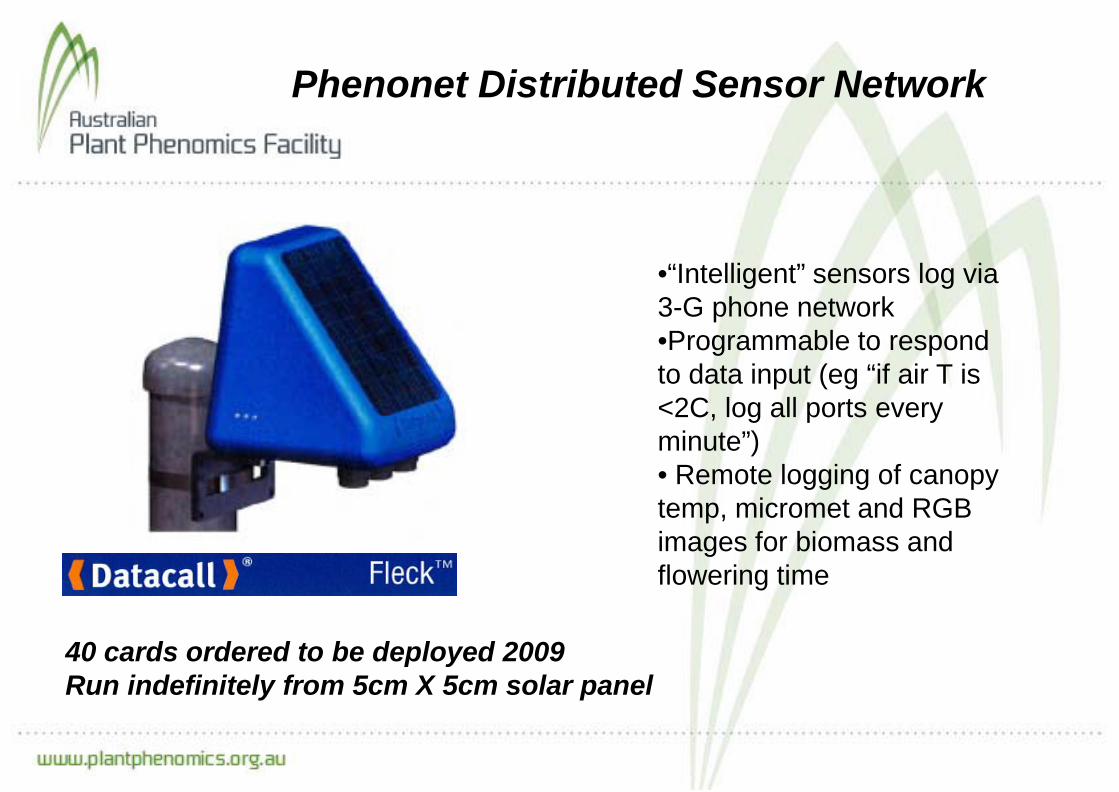
Phenonet Distributed Sensor Network
40 cards ordered to be deployed 2009Run indefinitely from 5cm X 5cm solar panel
•“Intelligent” sensors log via 3-G phone network•Programmable to respond to data input (eg “if air T is <2C, log all ports every minute”)• Remote logging of canopy temp, micromet and RGB images for biomass and flowering time

The Australian Plant Phenomics team
Adelaide Canberra
Mark Tester Bob FurbankGeoff Fincher Jeremy Burdon
Murray Badger
Helli Meinecke – manager Chris Buller – managerBettina Berger – postdoc Xavier Sirault – postdocsJames Eddes – bioinformatics Dave DeeryRichard Norrish – electronics Xueqin WangRobin Hosking – horticulturalist Scott Berry- TO