apple (aapl) valuation analysis naren chawla. 2 outline corporate overview financials competitive...
TRANSCRIPT
Apple (AAPL)Valuation Analysis
Naren Chawla
2
Outline
• Corporate Overview • Financials• Competitive Landscape• Trends, Forecast & Insights• Key Assumptions• DCF• Conclusion
© Copyright 2008 SAP AG. All rights reserved. SAP Internal — Confidential Only
3
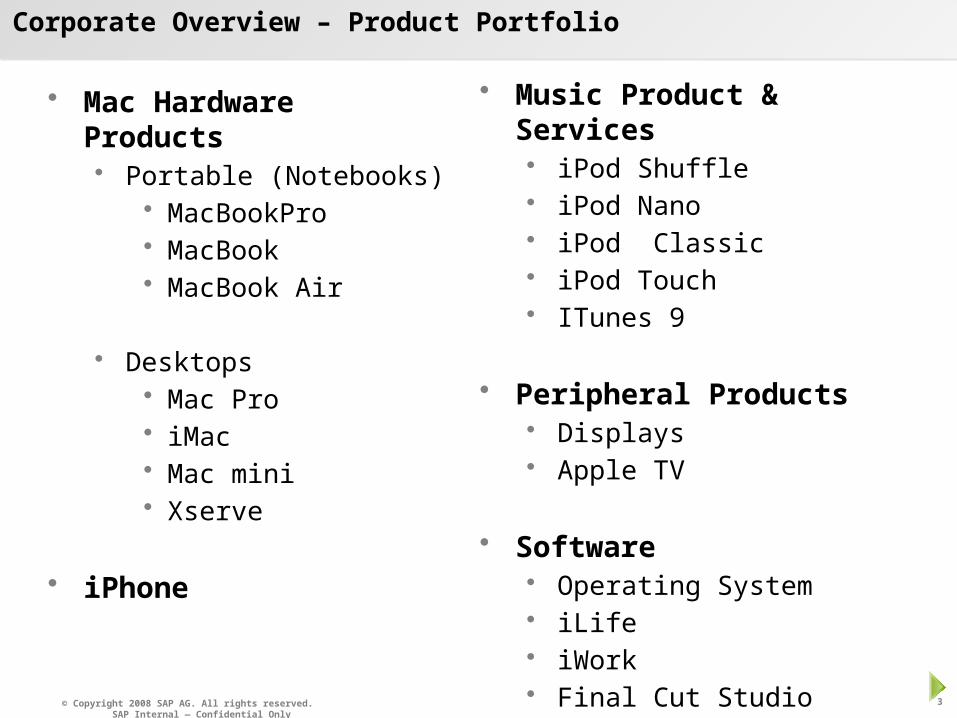
Corporate Overview – Product Portfolio
• Mac Hardware Products Portable (Notebooks)
• MacBookPro• MacBook • MacBook Air
Desktops• Mac Pro• iMac• Mac mini• Xserve
• iPhone
• Music Product & Services iPod Shuffle iPod Nano iPod Classic iPod Touch ITunes 9
• Peripheral Products Displays Apple TV
• Software Operating System iLife iWork Final Cut Studio
4
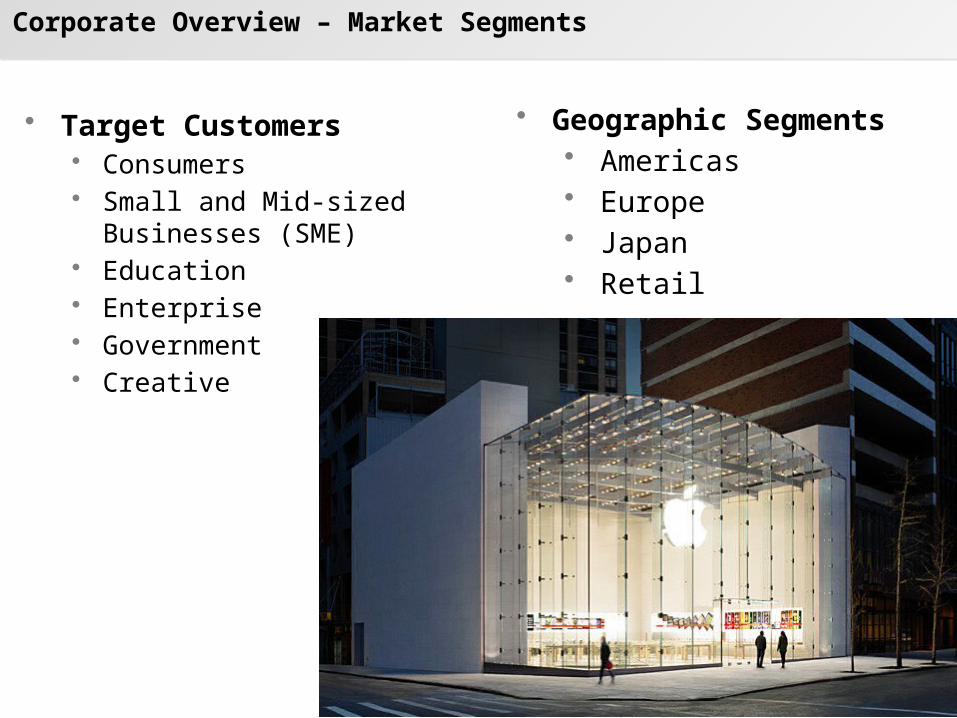
Corporate Overview – Market Segments
• Target Customers Consumers Small and Mid-sized
Businesses (SME) Education Enterprise Government Creative
• Geographic Segments• Americas• Europe• Japan• Retail
5
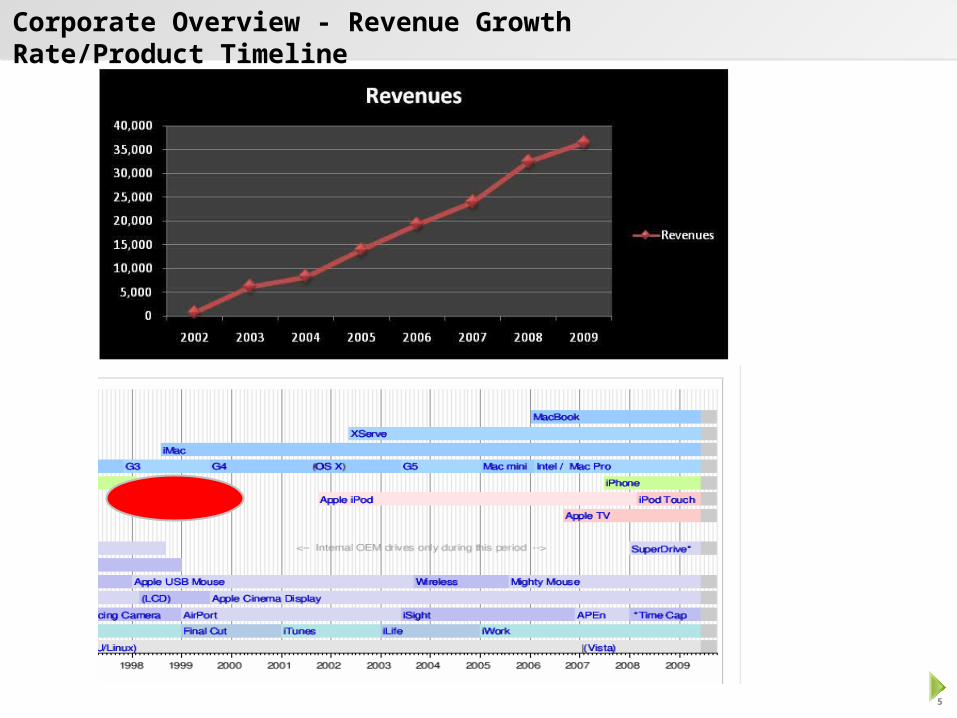
Corporate Overview - Revenue Growth Rate/Product Timeline
6
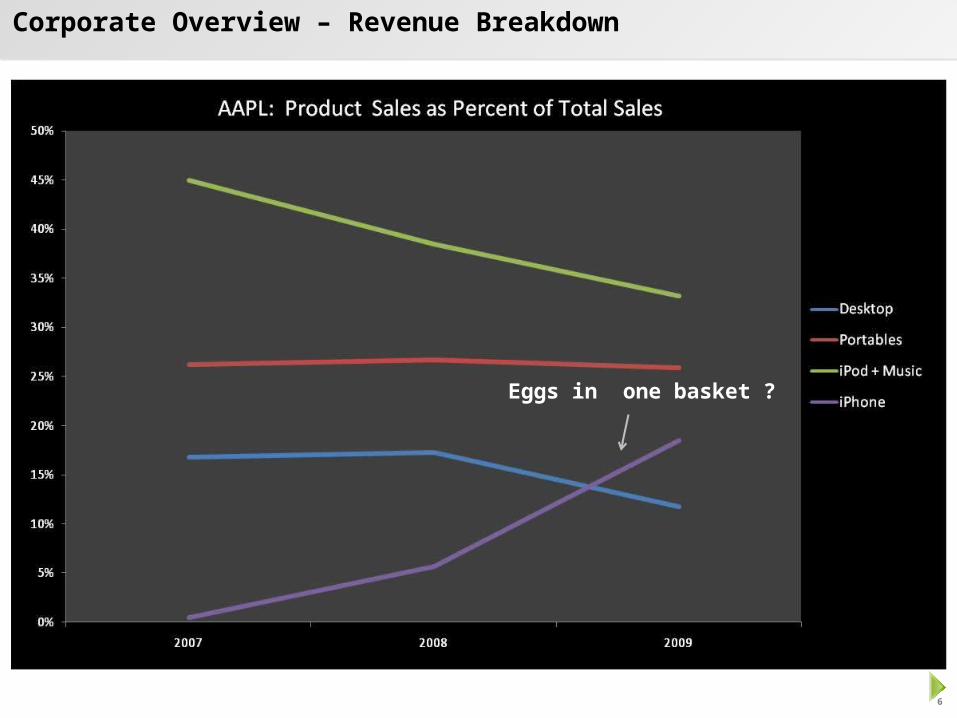
Corporate Overview – Revenue Breakdown
Eggs in one basket ?
7
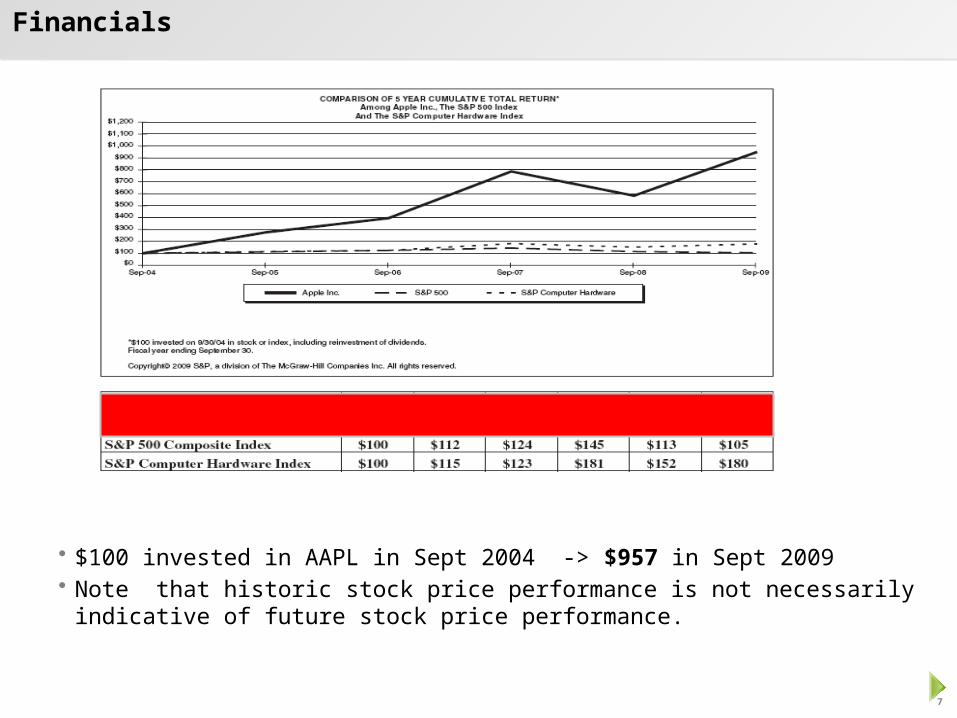
Financials
• $100 invested in AAPL in Sept 2004 -> $957 in Sept 2009• Note that historic stock price performance is not necessarily indicative of future
stock price performance.
8
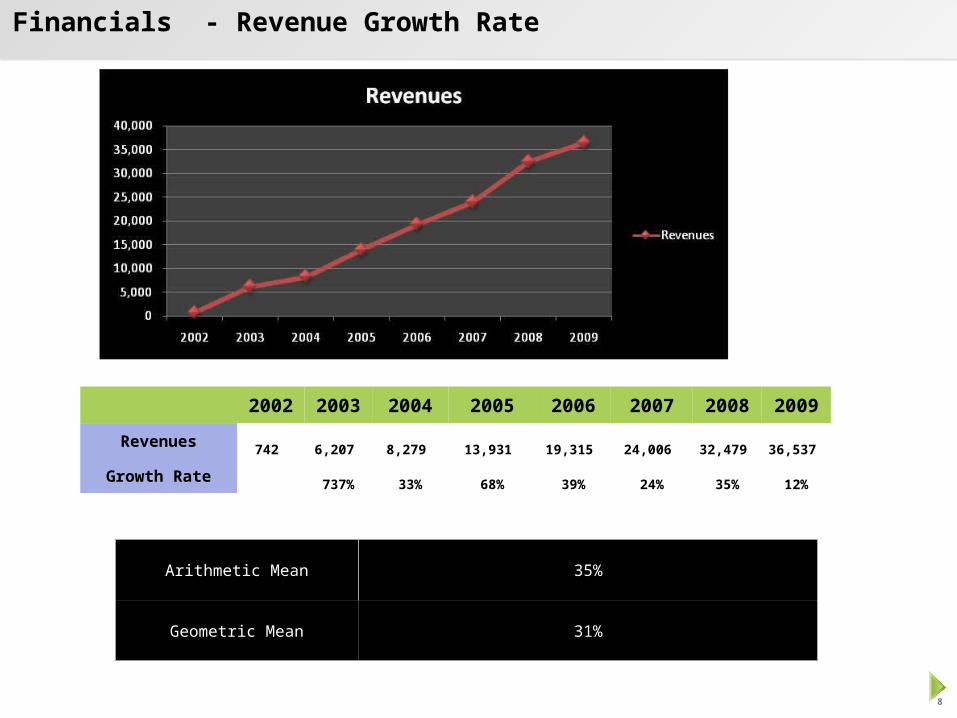
Financials - Revenue Growth Rate
2002 2003 2004 2005 2006 2007 2008 2009
Revenues742 6,207 8,279 13,931 19,315 24,006 32,479 36,537
Growth Rate737% 33% 68% 39% 24% 35% 12%
Arithmetic Mean 35%
Geometric Mean 31%
9
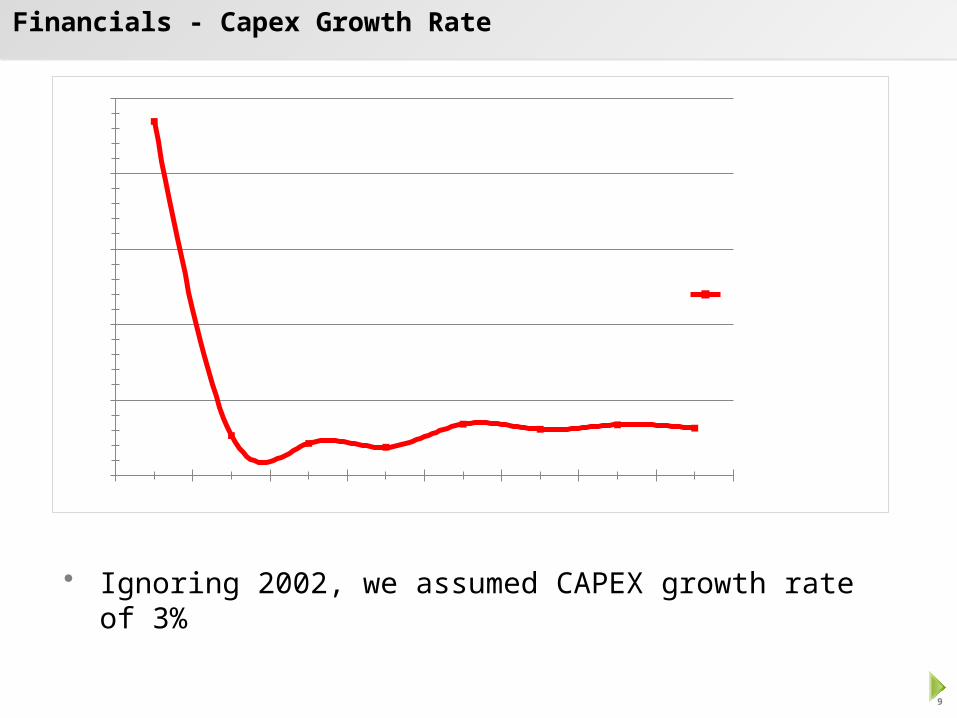
Financials - Capex Growth Rate
2002 2003 2004 2005 2006 2007 2008 20090%
5%
10%
15%
20%
25%
CAPEX as % of sales
• Ignoring 2002, we assumed CAPEX growth rate of 3%
10
Financials
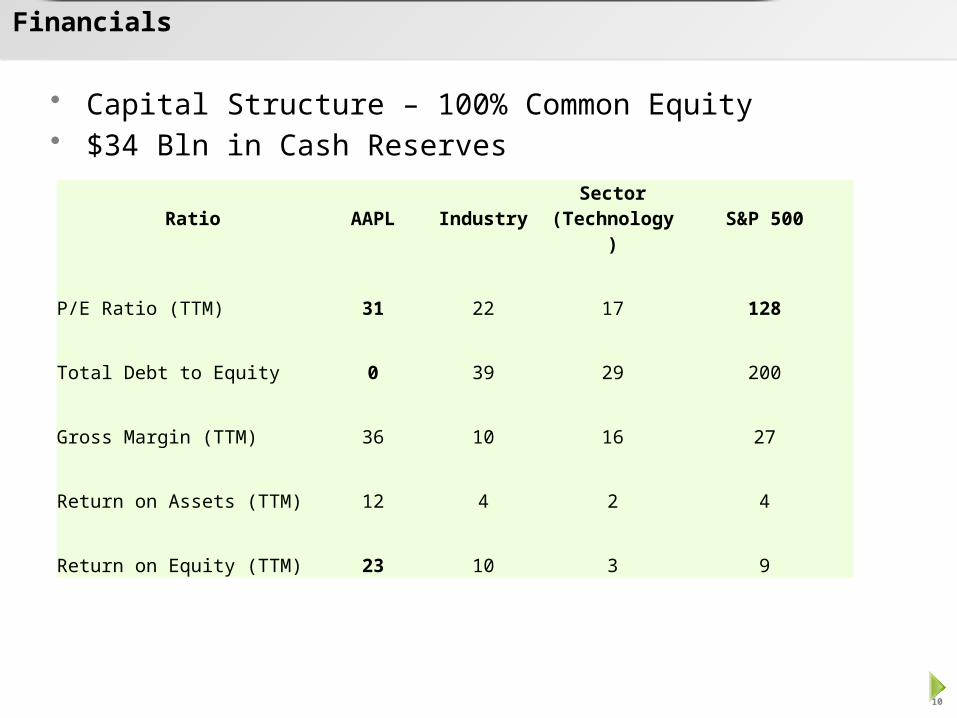
Ratio AAPL Industry Sector (Technology) S&P 500
P/E Ratio (TTM) 31 22 17 128
Total Debt to Equity 0 39 29 200
Gross Margin (TTM) 36 10 16 27
Return on Assets (TTM) 12 4 2 4
Return on Equity (TTM) 23 10 3 9
• Capital Structure – 100% Common Equity • $34 Bln in Cash Reserves
11
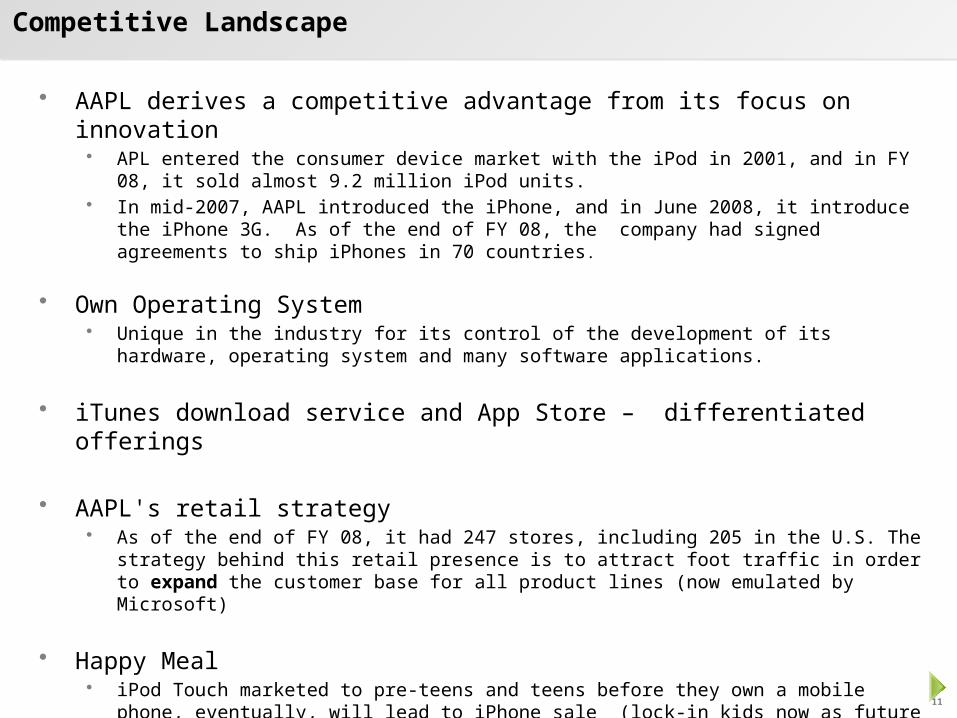
Competitive Landscape
• AAPL derives a competitive advantage from its focus on innovation APL entered the consumer device market with the iPod in 2001, and in FY 08, it sold almost 9.2 million iPod
units. In mid-2007, AAPL introduced the iPhone, and in June 2008, it introduce the iPhone 3G. As of the end of FY
08, the company had signed agreements to ship iPhones in 70 countries.
• Own Operating System Unique in the industry for its control of the development of its hardware, operating system and many
software applications.
• iTunes download service and App Store – differentiated offerings
• AAPL's retail strategy As of the end of FY 08, it had 247 stores, including 205 in the U.S. The strategy behind this retail presence is
to attract foot traffic in order to expand the customer base for all product lines (now emulated by Microsoft)
• Happy Meal iPod Touch marketed to pre-teens and teens before they own a mobile phone, eventually, will lead to iPhone
sale (lock-in kids now as future customers)

12
Competitive Landscape
• Happy Meal iPod Touch marketed to pre-teens and teens before they own a mobile phone, eventually, will lead to
iPhone sale (lock-in kids now as future customers) - SWITCHING COSTS
13
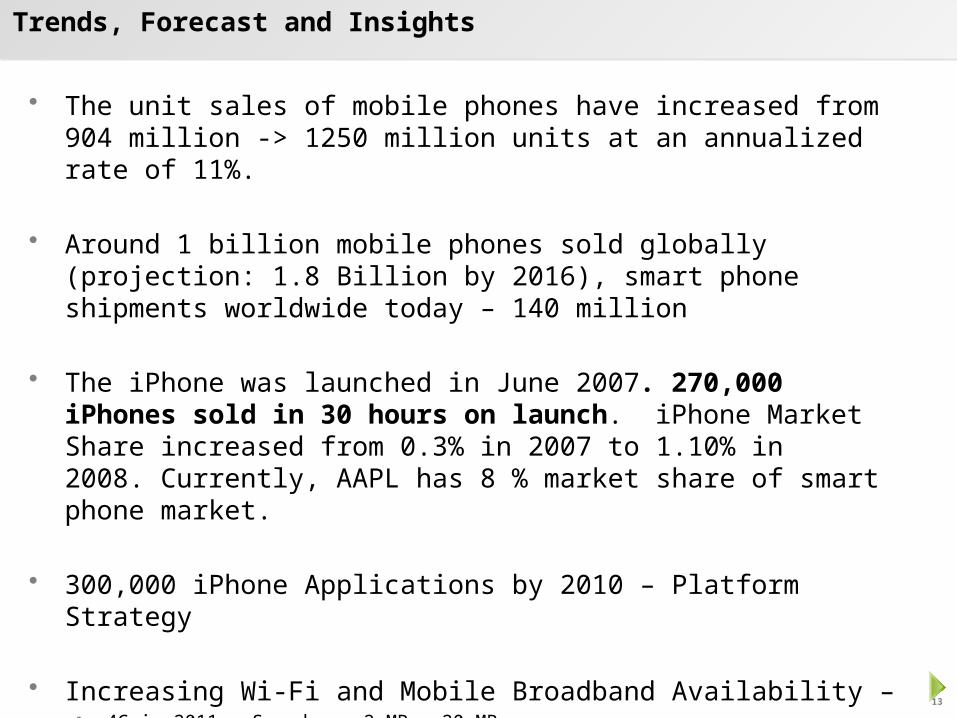
Trends, Forecast and Insights
• The unit sales of mobile phones have increased from 904 million -> 1250 million units at an annualized rate of 11%.
• Around 1 billion mobile phones sold globally (projection: 1.8 Billion by 2016), smart phone shipments worldwide today – 140 million
• The iPhone was launched in June 2007. 270,000 iPhones sold in 30 hours on launch. iPhone Market Share increased from 0.3% in 2007 to 1.10% in 2008. Currently, AAPL has 8 % market share of smart phone market.
• 300,000 iPhone Applications by 2010 – Platform Strategy
• Increasing Wi-Fi and Mobile Broadband Availability – 4G in 2011: Speeds - 2 MB – 20 MB Availability of mobile TV shows, films, games, photo sharing, software applications, and video
conferencing are potential points of differentiation among smart phone competitors.
14
Trends, Forecast and Insights
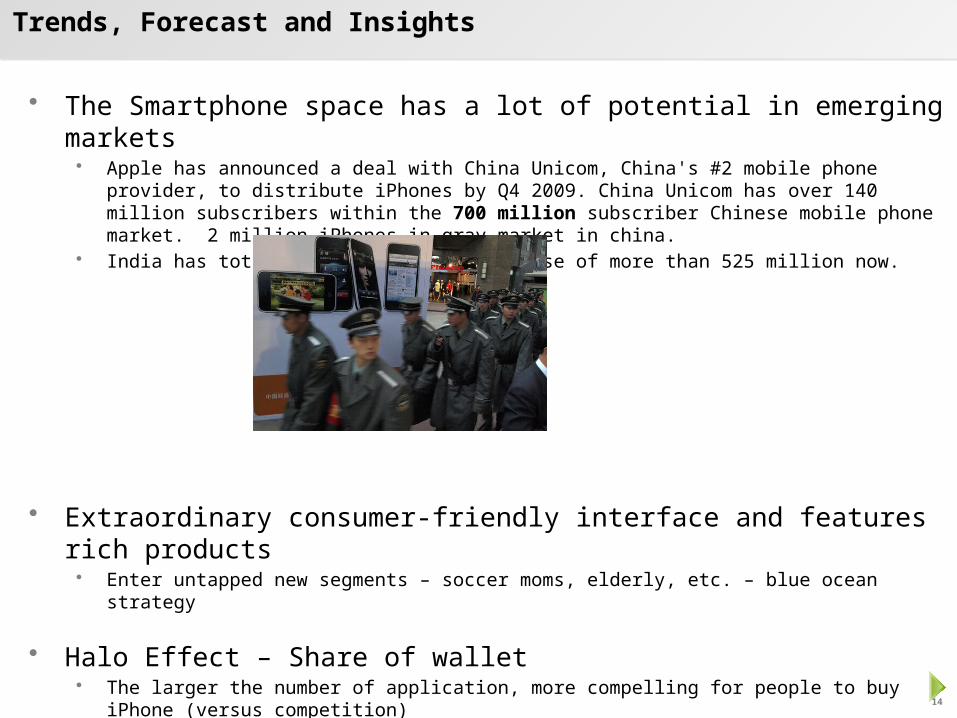
• The Smartphone space has a lot of potential in emerging markets Apple has announced a deal with China Unicom, China's #2 mobile phone provider, to distribute iPhones by Q4
2009. China Unicom has over 140 million subscribers within the 700 million subscriber Chinese mobile phone market. 2 million iPhones in gray market in china.
India has total wireless subscribers base of more than 525 million now.
• Extraordinary consumer-friendly interface and features rich products Enter untapped new segments – soccer moms, elderly, etc. – blue ocean strategy
• Halo Effect – Share of wallet The larger the number of application, more compelling for people to buy iPhone (versus competition) iPhone/iPod sales will lead to increase in iMac sales due to superior integration between the two Users who buy iMac desktop will be compelled to buy MacBook (notebooks) due to ease of integration iMac sales will lead to AppleTV sales (now you can watch your content on TV)
15
Trends, Forecast and Insights
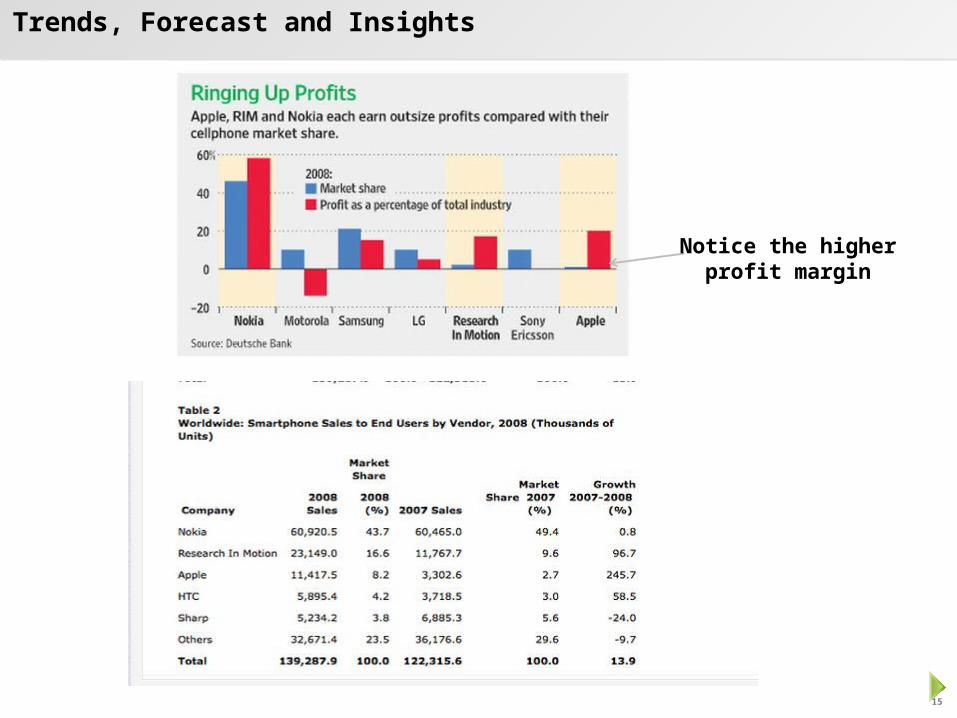
Source: IDC, Gartner, Strategy Analytics
Notice the higher profit margin
16
Trends, Forecast and Insights
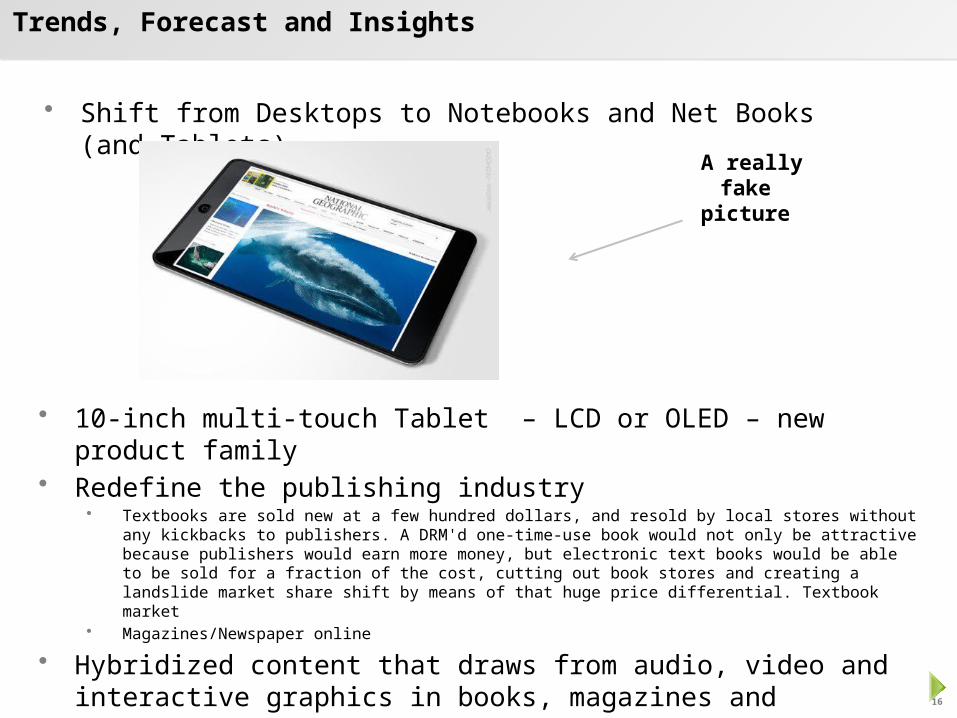
• Shift from Desktops to Notebooks and Net Books (and Tablets)
A really fake picture
• 10-inch multi-touch Tablet – LCD or OLED – new product family• Redefine the publishing industry
• Textbooks are sold new at a few hundred dollars, and resold by local stores without any kickbacks to publishers. A DRM'd one-time-use book would not only be attractive because publishers would earn more money, but electronic text books would be able to be sold for a fraction of the cost, cutting out book stores and creating a landslide market share shift by means of that huge price differential. Textbook market
• Magazines/Newspaper online
• Hybridized content that draws from audio, video and interactive graphics in books, magazines and newspapers
17
Trends, Forecast and Insights
• Bearish Factors Eggs in one basket – desktop, portables, ipod revenues are dropping
or flat, currently growth is only coming from iPhone RIM, GOOG, NOK – strong competitors in smartphone market Pricing - AAPL charges premium pricing compared to competition Steve Jobs is no longer there Black-Necked Swan type event
18
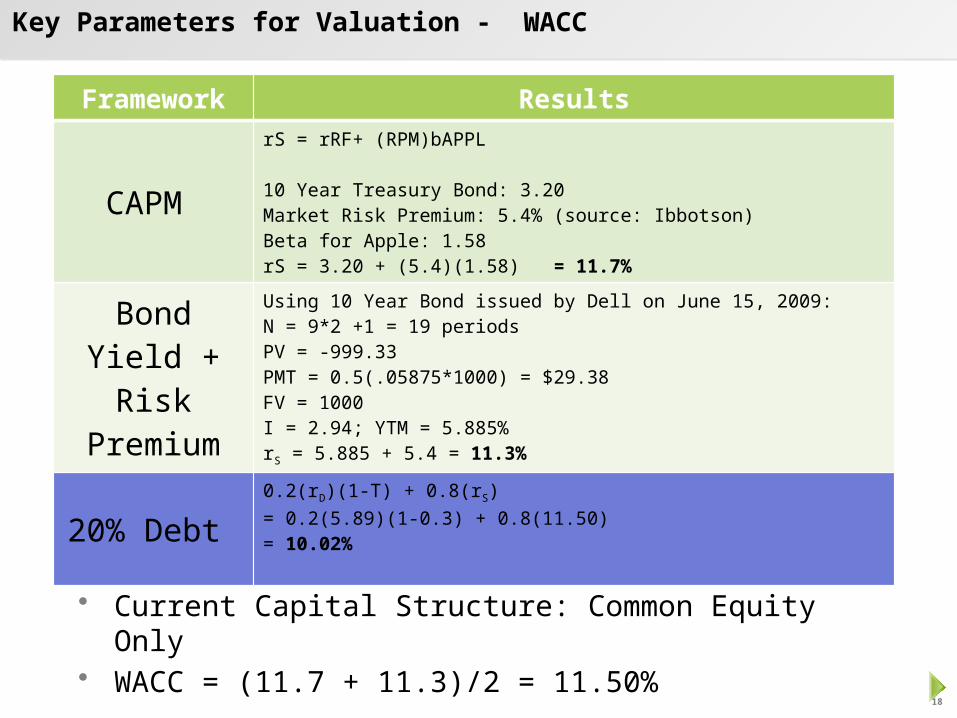
Key Parameters for Valuation - WACC
Framework Results
CAPM
rS = rRF+ (RPM)bAPPL
10 Year Treasury Bond: 3.20Market Risk Premium: 5.4% (source: Ibbotson)Beta for Apple: 1.58rS = 3.20 + (5.4)(1.58) = 11.7%
Bond Yield + Risk Premium
Using 10 Year Bond issued by Dell on June 15, 2009:N = 9*2 +1 = 19 periodsPV = -999.33PMT = 0.5(.05875*1000) = $29.38FV = 1000I = 2.94; YTM = 5.885%rS = 5.885 + 5.4 = 11.3%
20% Debt 0.2(rD)(1-T) + 0.8(rS)= 0.2(5.89)(1-0.3) + 0.8(11.50)= 10.02%
• Current Capital Structure: Common Equity Only• WACC = (11.7 + 11.3)/2 = 11.50%
19
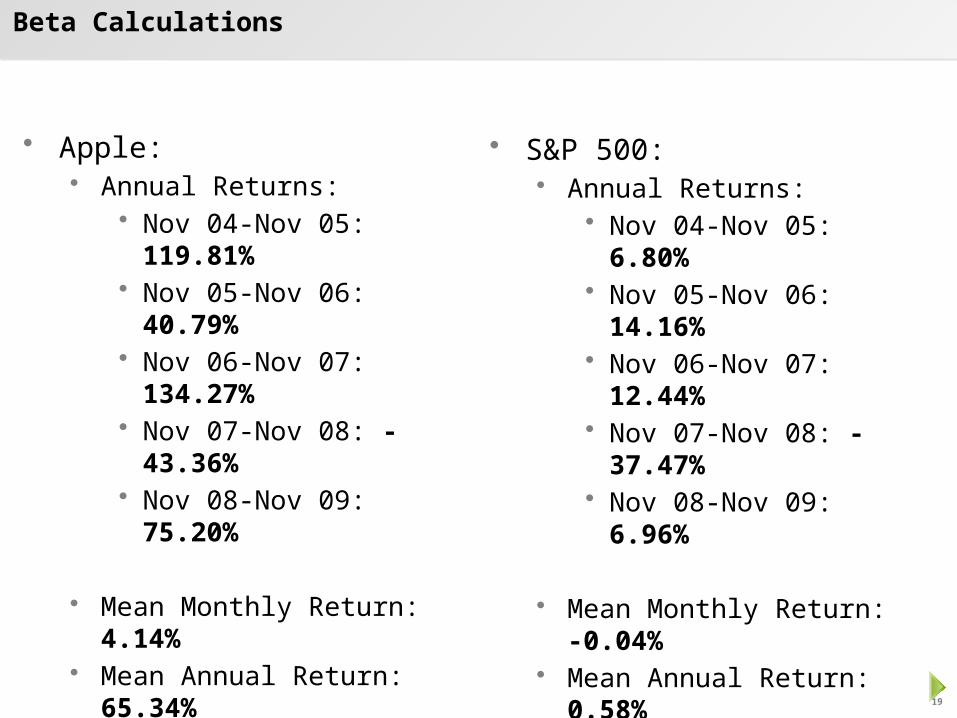
Beta Calculations
• Apple: Annual Returns:
• Nov 04-Nov 05: 119.81%• Nov 05-Nov 06: 40.79%• Nov 06-Nov 07: 134.27%• Nov 07-Nov 08: -43.36%• Nov 08-Nov 09: 75.20%
Mean Monthly Return: 4.14% Mean Annual Return: 65.34% Monthly Standard Deviation:
12.45% Annual Standard Deviation:
71.12%
• S&P 500: Annual Returns:
• Nov 04-Nov 05: 6.80%• Nov 05-Nov 06: 14.16%• Nov 06-Nov 07: 12.44%• Nov 07-Nov 08: -37.47%• Nov 08-Nov 09: 6.96%
Mean Monthly Return: -0.04% Mean Annual Return: 0.58% Monthly Standard Deviation:
4.61% Annual Standard Deviation:
21.52%
20
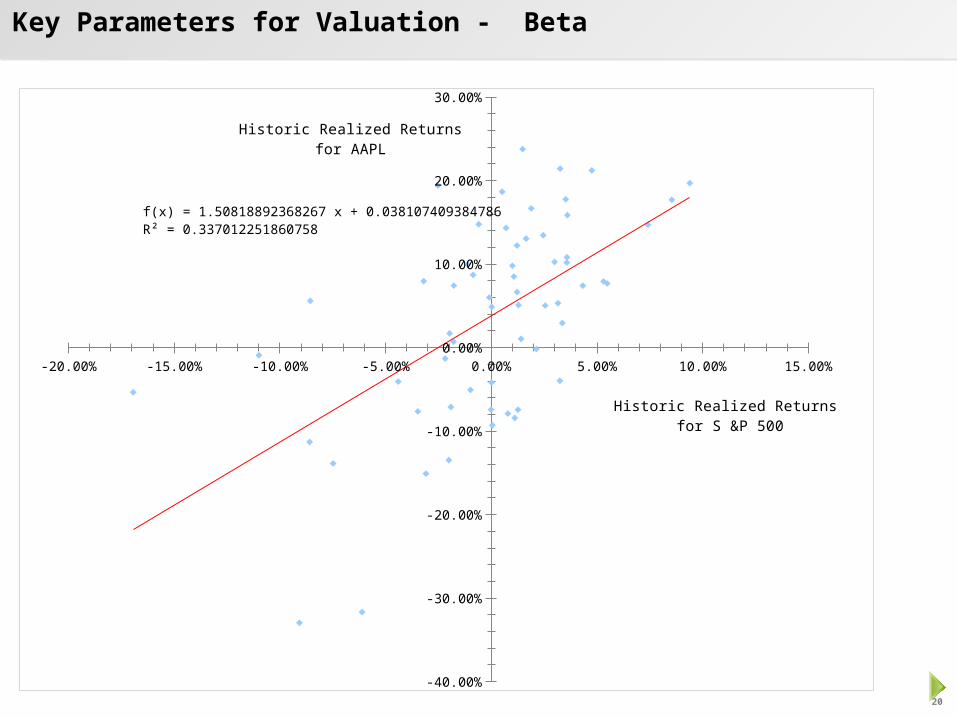
Key Parameters for Valuation - Beta
-20.00% -15.00% -10.00% -5.00% 0.00% 5.00% 10.00% 15.00%
-40.00%
-30.00%
-20.00%
-10.00%
0.00%
10.00%
20.00%
30.00%
f(x) = 1.50818892368267 x + 0.038107409384786R² = 0.337012251860758
Historic Realized Returnsfor AAPL
Historic Realized Returns for S &P 500
21
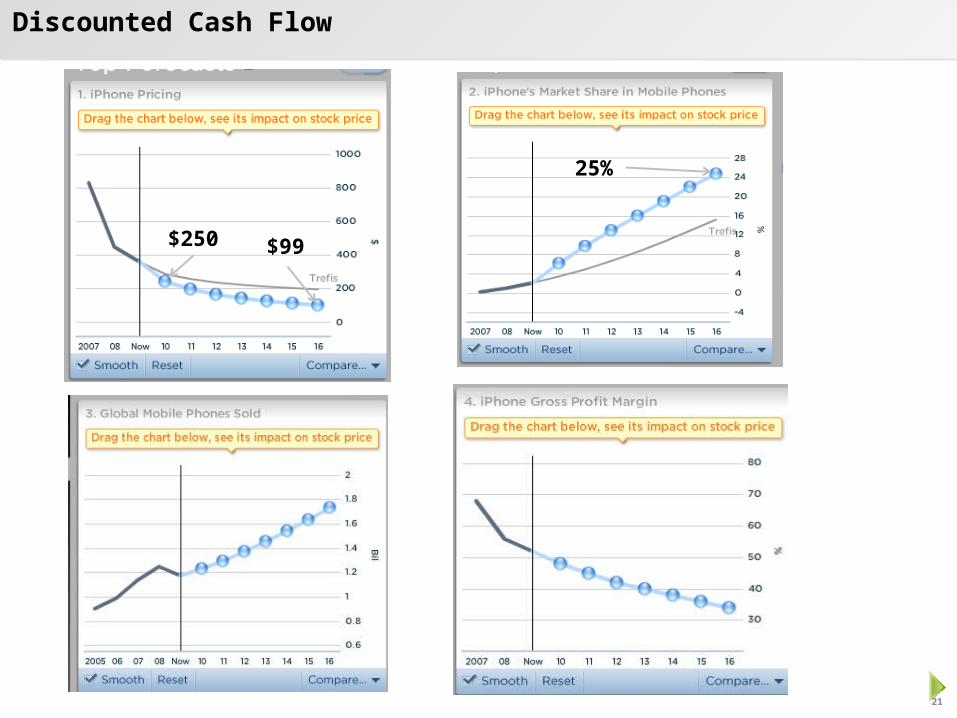
Discounted Cash Flow
$250 $99
25%
22
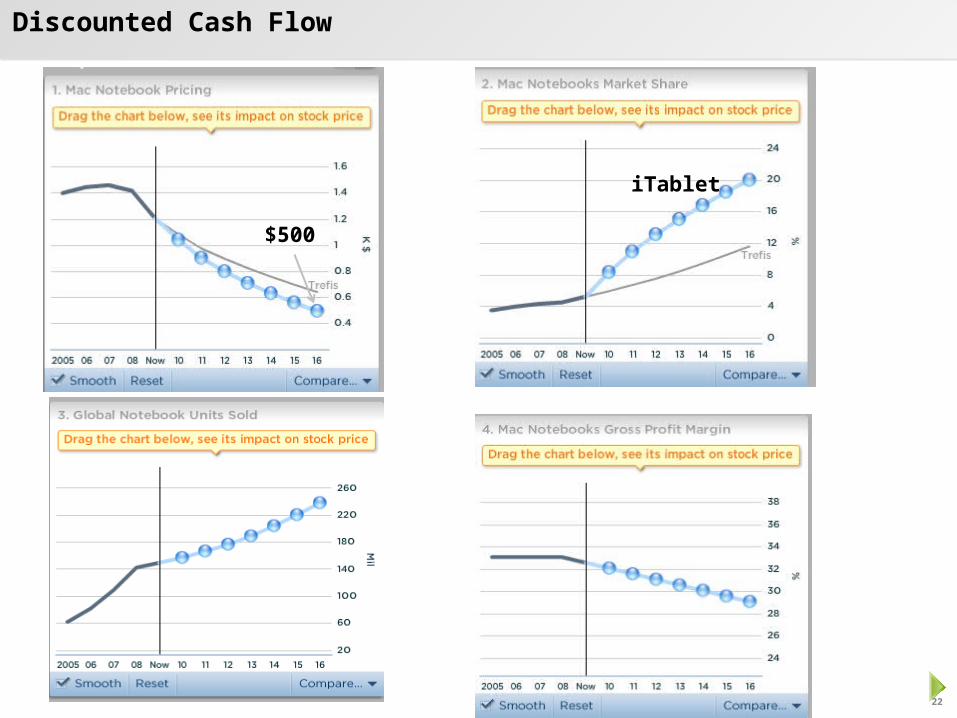
Discounted Cash Flow
$500
iTablet
23
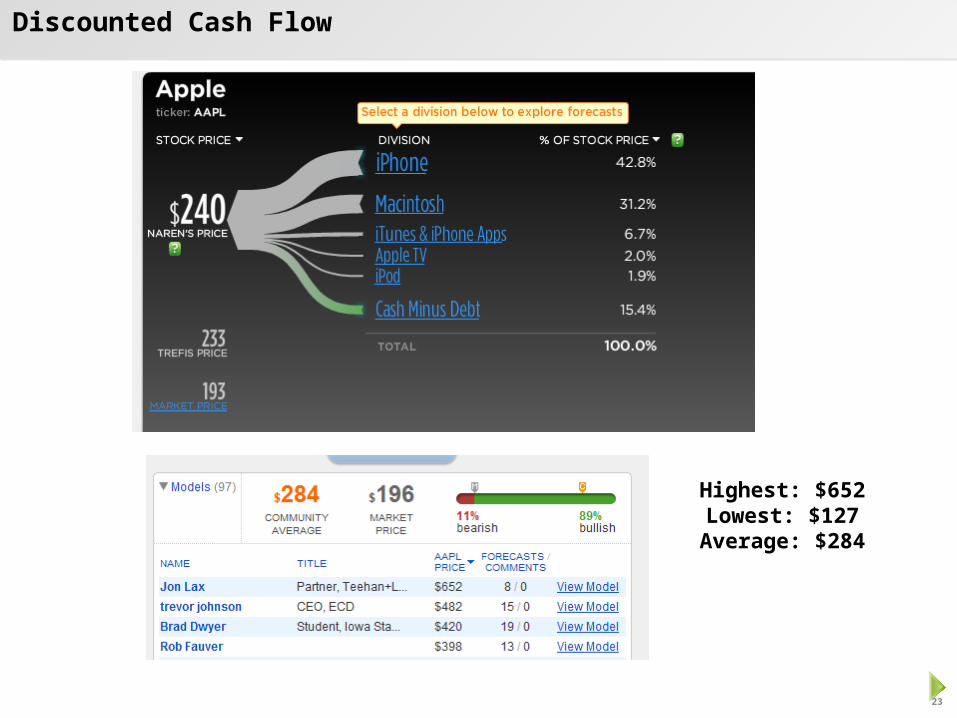
Discounted Cash Flow
Highest: $652Lowest: $127Average: $284
24
Conclusion
• Under-value or Over-valued : Blue Pill or Red Pill
• If we believe iPhone will keep up with innovation and grab market share from Nokia
and others GOOG will not change the game substantially with Android Company can function effectively without Steve Jobs in future iTablet (or whatever it gets named) will more than compensate for
drop in desktop and portables growth• Then, AAPL is currently undervalued. The value should be closer to
$240.

25
Resources for Valuation Analysis
Appendix
26
Resources for Valuation Analysis
• Apple 10-K for past 5 years • Analysts Reports – S & P, Reuters• Trefis• AppleInvestor, AppleInsider, IDC, Gartner, NYT, Google