apple iphone sales projections
TRANSCRIPT

MeanRegressors
XXX
■ Where will iPhone sales go?iPhone 6Sales Projection
October 2014
Who run the world?
Allen MillerPeter SvenssonJing HouleSlava DrukerConnor Wilson

2
MeanRegressors
• Overview & Background
• Full Model
• Best Model
• Predictions
• Conclusions
Agenda

3
MeanRegressors
Predicting Apple product demand:

4
MeanRegressors
Predicting Apple product demand:

5
MeanRegressors
Predicting Apple product demand:

6
MeanRegressors
But seriously...Who should care about Apple’s iPhone sales volumes?
■ Investors
■ Partners
• Wireless Carriers
• Suppliers
■ Competitors
• Hardware manufacturers
• Tech rivals
■ Politicians
■ Journalists
■ Economists
■ Tim Cook and Apple’s other 80k+ employees

7
MeanRegressors
• Overview & Background
• Full Model
• Best Model
• Predictions
• Conclusions
Agenda

8
MeanRegressors
To develop the full model we took into account macro, industry/competitive, and Apple specific factors
1. Text in boxes is centered if no bullet text follows2. Text in boxes is left aligned if bullet text follows below3. Second grey for stand-alone boxes – boxes not in direct combination with light-grey or other color shapes exclusive arrows
Model Factors
Full Model
Macro Industry Apple Specific
• U.S. GDP
• U.S. Retail Sales
• Total Smartphone Sales
• Stock Price
• iPhone Sales
• Existing iPhones
• Market Share
• Launch of iPhones

9
MeanRegressors
Some data was readily available, however, the Apple specific data required mining financial statements and news reports
1. Height of grey column heading with two lines is 0.55” (1.4 cm); Height of grey column head with one line is 0.39” (0,99 cm)2. See table toolbar for column resizing toolsSource: Any data presented in text or chart format should have a source identified; notes and sources are 8 point Arial, regular text
Sources
Input Source Rationale/Methodology
U.S. GDP• Commerce Dept.
• In lieu of global GDP figures we used U.S. GDP which represents the largest market for iPhones as a proxy economic health
U.S. Retail Sales
• Census Bureau
• We used U.S. retail sales as an indicator of strength or weakness in consumer spending and consumption
Total Smartphone Sales
• IDC• Total smartphone sales provides a proxy for the health of the smartphone market
Stock Price• Yahoo Finance
• Quarterly stock price growth indicates the health of Apple
iPhone Sales • 10k/News• Quarterly iPhone sales provide the existing trend and allow us to test our regression
Existing iPhones
• 10k/News • Provides existing penetration of iPhones
Market Share • IDC/Apple • Provides a proxy for iPhone penetration
Launch of iPhones
• 10k/News • Used to understand the impact of new phone releases on sales

10
MeanRegressors
The factors we selected then had to be manipulated to be able to draw conclusions
Manipulations
Original Variables Manipulations for Full Model
Sales
Sales Last Quarter
Log Sales
iPhones Already Sold
Time Dummy Values
2nd Quarter
3rd Quarter
4th Quarter
iPhone Launch
After early new phone
After late new phone
Before early new phone
Before late new phone
Early new phone
Late new phone
US GDP US GDP from Previous Quarter
US Retail Sales % Change in retail sales for quarter based on Quarter t-2 and Quarter t-1
Smartphone Sales iPhone sales based on Quarter t-1
Apple Market Share Apple market share pvs quarter
Stock Price% change in stock price based on average closing stock price in previous
quarters

11
MeanRegressors
The full model regression has a high R2, but this seems to be a case of over fitting somewhere in the modelRegression Statistics
Multiple R 0.99
R Square 0.98
Adjusted R Square 0.96
Standard Error 3.07
Observations 28
df SS MS F Significance F
Regression 16 6524.62 407.79 43.23 0.00
Residual 11 103.76 9.43
Total 27 6628.38
Coefficients Standard Error t Stat P-value Lower 95% Upper 95%Intercept -8.81 4.04 -2.18 0.05 -17.71 0.08iPhones already sold -0.14 0.06 -2.44 0.03 -0.27 -0.01Sales last quarter 0.18 0.24 0.77 0.46 -0.34 0.712nd Q -4.59 2.58 -1.78 0.10 -10.27 1.083rd Q -5.85 2.54 -2.31 0.04 -11.44 -0.274th Q -9.90 2.32 -4.27 0.00 -15.01 -4.79After early new phone -1.06 2.97 -0.36 0.73 -7.60 5.48After late new phone 11.95 2.57 4.66 0.00 6.31 17.60Before early new phone 4.54 3.42 1.33 0.21 -2.99 12.08Before late new phone 1.80 2.68 0.67 0.51 -4.10 7.70Early new phone 12.90 3.44 3.76 0.00 5.34 20.46Late new phone 7.21 2.91 2.48 0.03 0.80 13.61US GDP pvs quarter 29.53 34.29 0.86 0.41 -45.94 105.00% Change in US Retail Sales pvs quarter -4.96 51.43 -0.10 0.92 -118.15 108.24IDC smartphone sales pvs quarter 0.38 0.12 3.23 0.01 0.12 0.64Apple market share pvs quarter 18.61 27.79 0.67 0.52 -42.54 79.77% one quarter lagging stock price change based on
average closing stock price in previous quarters2.68 5.87 0.46 0.66 -10.24 15.60

12
MeanRegressors
Additionally, there is multi-colinearity between the various sales data which makes sense given Apples market share
iPhones
already
sold
Sales
last
quarter
2nd Q 3rd Q 4th Q
After
early
new
phone
After
late
new
phone
Before
early
new
phone
Before
late
new
phone
Early
new
phone
Late
new
phone
GDPRetail
Sales
Smartp
hone
Sales
Market
Share
Stock
price
iPhones already sold 1.000
Sales last quarter 0.927 1.000
2nd Q 0.038 0.205 1.000
3rd Q 0.116 0.107-0.333 1.000
4th Q -0.105 -0.196-0.333 -0.333 1.000
After early new phone -0.092 0.063 0.160 -0.160 -0.160 1.000
After late new phone 0.015 -0.106-0.269 -0.269 0.377 -0.129 1.000
Before early new phone -0.147 -0.133-0.160 0.160 0.160 -0.077 -0.129 1.000
Before late new phone 0.234 0.224 0.162 0.377 -0.269 -0.129 -0.217 -0.129 1.000
Early new phone -0.131 -0.171-0.160 -0.160 0.160 -0.077 -0.129 -0.077 -0.129 1.000
Late new phone 0.066 -0.026-0.236 0.236 0.236 -0.113 -0.190 -0.113 -0.190 -0.113 1.000
US GDP pvs quarter 0.355 0.387 0.020 -0.031 -0.008 0.001 -0.022 0.084 -0.128 0.043 -0.156 1.000
% Change in US Retail
Sales pvs quarter0.181 0.260-0.154 0.019 0.054 -0.034 0.111 -0.015 -0.328 0.025 -0.133 0.395 1.000
IDC smartphone sales
pvs quarter 0.992 0.955 0.097 0.078 -0.127 -0.052 -0.003 -0.147 0.201 -0.119 0.041 0.379 0.212 1.000
Apple market share pvs
quarter0.394 0.624 0.204 0.103 -0.338 0.388 -0.284 -0.084 0.179 -0.313 -0.021 0.048 0.248 0.458 1.000
Stock Price -0.207 -0.205-0.076 -0.275 0.305 -0.219 0.355 -0.337 -0.262 0.190 -0.123 0.022 0.538 -0.207 -0.207 1.000

13
MeanRegressors
• Overview & Background
• Full Model
• Best Model
• Predictions
• Conclusions
Agenda

14
MeanRegressors
Methodology: Going from the Full Model to the “Best” Model
Full Model
Best Subsets
9 Variable Model
8 Variable “Best”
Statistical Model
Multiplier Model (Most
Practical)
15
MeanRegressors
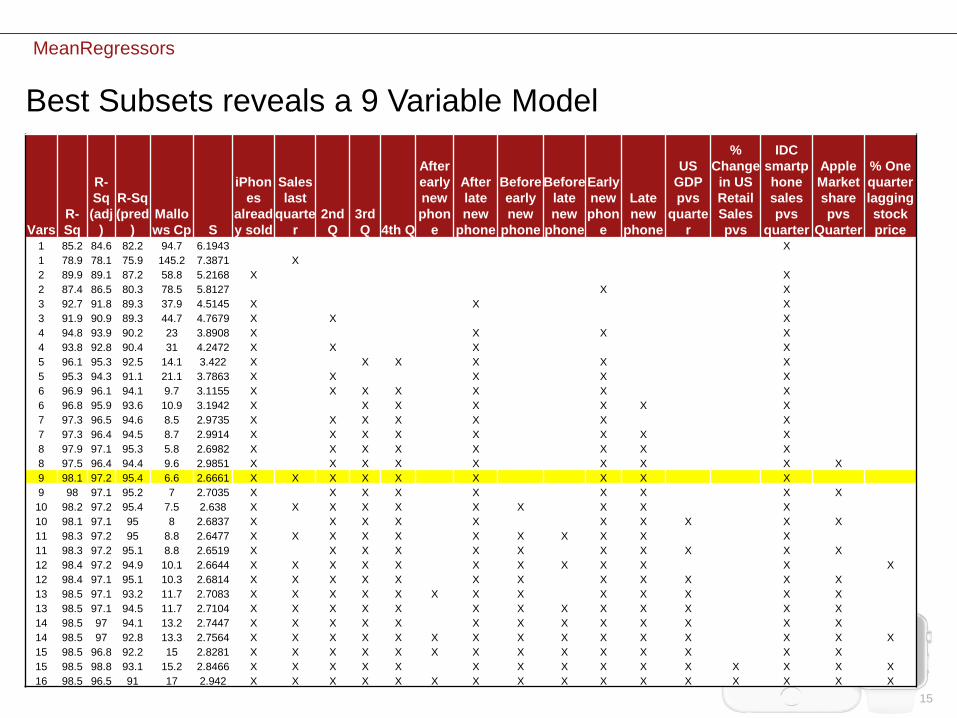
Best Subsets reveals a 9 Variable Model
Vars
R-
Sq
R-
Sq
(adj
)
R-Sq
(pred
)
Mallo
ws Cp S
iPhon
es
alread
y sold
Sales
last
quarte
r
2nd
Q
3rd
Q 4th Q
After
early
new
phon
e
After
late
new
phone
Before
early
new
phone
Before
late
new
phone
Early
new
phon
e
Late
new
phone
US
GDP
pvs
quarte
r
%
Change
in US
Retail
Sales
pvs
IDC
smartp
hone
sales
pvs
quarter
Apple
Market
share
pvs
Quarter
% One
quarter
lagging
stock
price1 85.2 84.6 82.2 94.7 6.1943 X
1 78.9 78.1 75.9 145.2 7.3871 X
2 89.9 89.1 87.2 58.8 5.2168 X X
2 87.4 86.5 80.3 78.5 5.8127 X X
3 92.7 91.8 89.3 37.9 4.5145 X X X
3 91.9 90.9 89.3 44.7 4.7679 X X X
4 94.8 93.9 90.2 23 3.8908 X X X X
4 93.8 92.8 90.4 31 4.2472 X X X X
5 96.1 95.3 92.5 14.1 3.422 X X X X X X
5 95.3 94.3 91.1 21.1 3.7863 X X X X X
6 96.9 96.1 94.1 9.7 3.1155 X X X X X X X
6 96.8 95.9 93.6 10.9 3.1942 X X X X X X X
7 97.3 96.5 94.6 8.5 2.9735 X X X X X X X
7 97.3 96.4 94.5 8.7 2.9914 X X X X X X X X
8 97.9 97.1 95.3 5.8 2.6982 X X X X X X X X
8 97.5 96.4 94.4 9.6 2.9851 X X X X X X X X X
9 98.1 97.2 95.4 6.6 2.6661 X X X X X X X X X
9 98 97.1 95.2 7 2.7035 X X X X X X X X X
10 98.2 97.2 95.4 7.5 2.638 X X X X X X X X X X
10 98.1 97.1 95 8 2.6837 X X X X X X X X X X
11 98.3 97.2 95 8.8 2.6477 X X X X X X X X X X X
11 98.3 97.2 95.1 8.8 2.6519 X X X X X X X X X X X
12 98.4 97.2 94.9 10.1 2.6644 X X X X X X X X X X X X
12 98.4 97.1 95.1 10.3 2.6814 X X X X X X X X X X X X
13 98.5 97.1 93.2 11.7 2.7083 X X X X X X X X X X X X X
13 98.5 97.1 94.5 11.7 2.7104 X X X X X X X X X X X X X
14 98.5 97 94.1 13.2 2.7447 X X X X X X X X X X X X X
14 98.5 97 92.8 13.3 2.7564 X X X X X X X X X X X X X X X
15 98.5 96.8 92.2 15 2.8281 X X X X X X X X X X X X X X
15 98.5 98.8 93.1 15.2 2.8466 X X X X X X X X X X X X X X X
16 98.5 96.5 91 17 2.942 X X X X X X X X X X X X X X X X

16
MeanRegressors
However, the 9 Variable Model had Significant Correlation issues
iPhones
already sold
Sales last
quarter 2nd Q 3rd Q 4th Q
After late
new phone
Early
new
phone
Late
new
phone
IDC
smartphone
sales pvs
quarter
iPhones already
sold 1
Sales last quarter 0.929198 1
2nd Q 0.056063 0.221983 1
3rd Q 0.055457 0.033303 -0.34816 1
4th Q -0.08441 -0.16728 -0.31818 -0.34816 1
After late new
phone 0.029775 -0.08426 -0.25746 -0.28172 0.382518 1
Early new phone -0.11978 -0.15539 -0.15352 -0.16798 0.164488 -0.12423 1
Late new phone -0.01342 -0.11225 -0.25746 0.331019 0.169191 -0.20833 -0.12423 1
IDC smartphone
sales pvs quarter 0.991943 0.956465 0.115687 0.011013 -0.1026 0.014815 -0.10558 -0.04701 1

17
MeanRegressors
So we moved to an 8 Variable “Best” Regression Model
Regression Statistics
Multiple R 0.989533
R Square 0.979175
Adjusted R Square 0.970845
Standard Error 2.698235
Observations 29
ANOVA
df SS MS F Significance F
Regression 8 6846.501 855.8126 117.5491 4.14E-15
Residual 20 145.6094 7.280469
Total 28 6992.111
Coefficients Standard Error t Stat P-value Lower 95% Upper 95%
Intercept -7.82482 2.098311 -3.7291 0.001324 -12.2018 -3.44782
iPhones already
sold -0.19082 0.029909 -6.38005 3.17E-06 -0.25321 -0.12843
2nd Q -5.12848 1.660849 -3.08787 0.005802 -8.59295 -1.66401
3rd Q -3.87366 1.607004 -2.41048 0.025676 -7.22581 -0.5215
4th Q -7.76355 1.561421 -4.9721 7.33E-05 -11.0206 -4.50648
After late new
phone 9.144095 1.694359 5.396786 2.78E-05 5.609724 12.67847
Early new phone 9.502097 2.243513 4.235365 0.000406 4.82221 14.18198
Late new phone 3.715057 1.583681 2.345837 0.029405 0.411557 7.018557
IDC smartphone
sales pvs quarter 1.177552 0.125415 9.389252 9.03E-09 0.915941 1.439163
SALES = 2.77 + 0.618 Sales last quarter + 0.0614 IDC smartphone sales pvs quarte
+ 0.0 2nd Q_0 - 4.07 2nd Q_1 + 0.0 3rd Q_0 - 7.28 3rd Q_1 + 0.0 4th Q_0
- 9.76 4th Q_1 + 0.0 After late new phone_0 + 11.25 After late new phone_1
+ 0.0 Early new phone_0 + 13.93 Early new phone_1 + 0.0 Late new phone_0
+ 5.62 Late new phone_1

18
MeanRegressors
The Residuals looked pretty good in the 8 Variable Model

19
MeanRegressors
And the fit of this model to the data is very strong
-10
0
10
20
30
40
50
60
0 5 10 15 20 25 30 35
Sale
s (
in m
illio
ns)
Time
Sales: Model Prediction vs. Actual
Model Predicted Sales Actual Sales

20
MeanRegressors
Does the model make sense?
-10
0
10
20
30
40
50
60
0 5 10 15 20 25 30 35
Sale
s (
in m
illio
ns)
Time
Sales: Model Prediction vs. Actual
Model Predicted Sales Actual Sales
Might be true at some points, but not generally
Examples
• If it’s the fourth quarter, subtract
7.7M iPhones
• If a new iPhone was launched late in
the last quarter, add 9.1M iPhones

21
MeanRegressors
• Exponential model
• Holt-Winters model
• Something else
Possible alternatives:

22
MeanRegressors
Additive Holt-Winters
Method we learned in class. Seasons add/subtract to sales
0.00
10.00
20.00
30.00
40.00
50.00
60.00
Q3 '0
7
Q4 '0
7
Q1 '0
8
Q2 '0
8
Q3 '0
8
Q4 '0
8
Q1 '0
9
Q2 '0
9
Q3 '0
9
Q4 '0
9
Q1 '1
0
Q2 '1
0
Q3 '1
0
Q4 '1
0
Q1 '1
1
Q2 '1
1
Q3 '1
1
Q4 '1
1
Q1 '1
2
Q2 '1
2
Q3 '1
2
Q4 '1
2
Q1 '1
3
Q2 '1
3
Q3 '1
3
Q4 '1
3
Q1 '1
4
Q2 '1
4
Q3' 1
4
Sales
Forecast

23
MeanRegressors
Seasons multiply sales instead of adding/subtracting from them
Multiplicative Holt-Winters
0
10
20
30
40
50
60Q
3 '0
7
Q4 '0
7
Q1 '0
8
Q2 '0
8
Q3 '0
8
Q4 '0
8
Q1 '0
9
Q2 '0
9
Q3 '0
9
Q4 '0
9
Q1 '1
0
Q2 '1
0
Q3 '1
0
Q4 '1
0
Q1 '1
1
Q2 '1
1
Q3 '1
1
Q4 '1
1
Q1 '1
2
Q2 '1
2
Q3 '1
2
Q4 '1
2
Q1 '1
3
Q2 '1
3
Q3 '1
3
Q4 '1
3
Q1 '1
4
Q2 '1
4
Q3' 1
4
Forecast
Sales

24
MeanRegressors
Uses Solver-derived multipliers for iPhone launch variables
Multiplicative Holt-Winters with iPhone cycle adjustment
0.00
10.00
20.00
30.00
40.00
50.00
60.00Q
3 '0
7
Q4 '0
7
Q1 '0
8
Q2 '0
8
Q3 '0
8
Q4 '0
8
Q1 '0
9
Q2 '0
9
Q3 '0
9
Q4 '0
9
Q1 '1
0
Q2 '1
0
Q3 '1
0
Q4 '1
0
Q1 '1
1
Q2 '1
1
Q3 '1
1
Q4 '1
1
Q1 '1
2
Q2 '1
2
Q3 '1
2
Q4 '1
2
Q1 '1
3
Q2 '1
3
Q3 '1
3
Q4 '1
3
Q1 '1
4
Q2 '1
4
Q3' 1
4
Q4' 1
4
Sales
Forecast

25
MeanRegressors
Weakness: poor predictions
If you don’t have access to full dataset, errors are big
Quarter Prediction Actual Error
Q3 '13 31.24 31.24 0%
Q4 '13 26.41 33.8 28%
Q1 '14 57.76 51.03 12%
Q2 '14 49.22 47.03 11%
Q3 '14 34.96 35.2 0.70%

26
MeanRegressors
Solution: Model that combines best features of Winters and regression
■ Replaces seasonal dummy variables with multiples of average sales for last year
■ Detail of dataset fed into regression:
1st Q 2nd Q 3rd Q 4th QAfter early
new phone
After late
new phone
Before late
new phone
Early new
phone
Multiplier =
average of
last year's
quarterly
sales
0 - - - - - - - 0.00
0 - - 0.27 - 0.27 - - 0.27
0.695 - - - - - - - 0.70
0 1.24 - - - - - - 1.24
0 - 1.35 - - - - - 1.35
0 - - 1.47 - - - 1.47 1.47
2.9075 - - - 2.91 - - - 2.91
0 3.42 - - - - 3.42 - 3.42
0 - 3.94 - - - - - 3.94
0 - - 5.06 - 5.06 - - 5.06

27
MeanRegressors
A good fit, and one that makes sense
■Adjusted R2 of 0.983
■Take the average sales for the last year. Multiply by seasonal factor to get A, multiply by iPhone cycle factor to get B. Predicted sales = A+B
0
10
20
30
40
50
60
1 3 5 7 9 11 13 15 17 19 21 23 25 27 29
Predicted SALES
Actual
28
MeanRegressors
• Overview & Background
• Full Model
• Best Model
• Predictions
• Conclusions
Agenda

29
MeanRegressors
Prediction quality
Quarter Regular
regression
Winters-Holt w/
iPhone cycle
Multiplier
regression
Prediction Error Prediction Error Prediction Error
4-2013 41.6 23.0% 26.41 28% 33.9 0.2%
1-2014 56.3 10.3% 57.76 12% 57.8 13.2%
2-2014 46.8 7.0% 49.22 11% 43.9 0.4%
3-2014 38.5 9.3% 34.96 0.70% 36.5 3.6%
Average error 12.4% 12.9% 4.4%4.4%

30
MeanRegressors
Prediction for the latest quarter
Regular
regression
Winters-Holt w/
iPhone cycle
Multiplier
regression
33.8 +/- 2.7M 34.9M 38.4 +/- 2.1M
■Sales for July to September to be reported Oct. 20 – in one week
38.4 +/- 2.1M
36.3-40.5 million iPhones sold

31
MeanRegressors
• Overview & Background
• Full Model
• Best Model
• Predictions
• Conclusions
Agenda

32
MeanRegressors
Our model turned out very strong, but not without some very notable limitations.
Use of past data
Potential over-fitting
(Adjusted R2: 0.982)
Lack of MECE in model

33
MeanRegressors
Our model will predict strong growth. However, we should be cognizant that technology performance runs on an S-curve.
Pro
du
ct
Pe
rfo
rma
nce
Time
Prediction
Reality

34
MeanRegressors
In summary, Apple has a competitive brand and loyal consumers. Also, use logic to supplement regression models.
■ iPhone demand is inelastic
■Apple has strong and surprisingly predictable growth (so far!)
■Regression models are great, but use with caution
<