applicability of set-based design on structural...
TRANSCRIPT

Applicability of Set-Based Design on
Structural Engineering Master’s Thesis in the Master’s Programme in Structural Engineering and Building
Technology and Master’s Programme in Infrastructures and Environmental
Engineering
SANTIAGO LUIS FERNÁNDEZ
DAVID TARAZONA RAMOS
Department of Civil and Environmental Engineering
Division of Structural Engineering
Concrete Structures
CHALMERS UNIVERSITY OF TECHNOLOGY
Göteborg, Sweden 2014
Master’s Thesis 2014:102


MASTER’S THESIS 2014:102
Applicability of Set-Based Design on Structural
Engineering
Master’s Thesis in the Master’s Programme in Structural Engineering and Building
Technology and Master’s Programme in Infrastructures and Environmental
Engineering
SANTIAGO LUIS FERNÁNDEZ
DAVID TARAZONA RAMOS
Department of Civil and Environmental Engineering
Division of Structural Engineering
Concrete Structures
CHALMERS UNIVERSITY OF TECHNOLOGY
Göteborg, Sweden 2014

Applicability of Set-Based Design on Structural Engineering
Master’s Thesis in the Master’s Programme in Structural Engineering and Building
Technology and Master’s Programme in Infrastructures and Environmental
Engineering
SANTIAGO LUIS FERNÁNDEZ
DAVID TARAZONA RAMOS
© SANTIAGO LUIS FERNÁNDEZ, DAVID TARAZONA RAMOS, 2014
Examensarbete 2014:102
Department of Civil and Environmental Engineering
Division of Division of Structural Engineering
Concrete Structures
Chalmers University of Technology
SE-412 96 Göteborg
Sweden
Telephone: + 46 (0)31-772 1000
Cover: NCC Montagebro FEM model, histogram of feasible alternatives over span for
NCC composite concept, optimal alternative of NCC Montagebro over span, FEA
deflection results for NCC composite concept.
Chalmers Reproservice / Department of Civil and Environmental Engineering
Göteborg, Sweden 2014


CHALMERS, Civil and Environmental Engineering, Master’s Thesis 2014:102 I
Applicability of Set-Based Design on Structural Engineering
Master’s Thesis in the Master’s Programme in Structural Engineering and Building
Technology and Master’s Programme in Infrastructures and Environmental
Engineering
SANTIAGO LUIS FERNÁNDEZ
DAVID TARAZONA RAMOS Department of Civil and Environmental Engineering
Division of Division of Structural Engineering
Concrete Structures
Chalmers University of Technology
ABSTRACT
Traditional design practice in engineering has been based for decades on Point-Based
Design, in which the design stage follows a stepwise process, going towards the next
chain step after some design parameters have been chosen. However, this practice can
reach a point, where a feasible solution cannot be found regarding some criteria
involved in the design process, and hence, backtracking and rework are required. In
order to solve the aforementioned drawbacks, in mid-1990s, a new design approach,
Set-Based Design (SBD), was developed. SBD is based on considering sets of
alternatives, which are narrowed according to the criteria of the design stakeholders,
until an optimal solution remains. In this study, an assessment of the suitability of
SBD in structural engineering is performed, motivated by the lack of application of
this design approach in a field, where avoiding rework can be particularly beneficial
due to its long and costly design process. This assessment is carried out by applying a
computational tool developed for this purpose, which allows performing preliminary
structural analysis on sets of bridge alternatives specified by the designer as ranges of
different design parameters. These sets are narrowed not only regarding technical
feasibility from the structural analysis, but also considering economic and
environmental issues for selecting the best alternative. Two different bridge concepts
are assessed as case studies in order to prove the potential of the methodology and for
its validation. First, it has been demonstrated by different means that the methodology
simulates properly the pre-design stage as performed by the traditional design
practice. Secondly, the implementation of the methodology on two different already
existing bridges has resulted in more optimal design alternatives than the ones were
built, reducing the cost significantly. Furthermore, the methodology can be used for
other purposes rather than direct design, such as suitability assessment of different
concepts depending on the span length or for performing parametric studies. In
summary, the methodology here developed adjusts very well to the principles of Set-
Based Design and show the great potential of this design approach on structural
engineering.
Key words: Set-Based Design, Robust Design, Integrated Design, Bridge Pre-Design,
Computational Engineering, FEM analysis, Python , Automation

CHALMERS, Civil and Environmental Engineering, Master’s Thesis 2014:102 II

CHALMERS, Civil and Environmental Engineering, Master’s Thesis 2014:102 III
Contents
ABSTRACT I
CONTENTS III
PREFACE VI
NOTATIONS VII
1 INTRODUCTION 1
1.1 Background 1
1.2 Purpose and Objectives 1
1.3 Limitations 2
1.4 Methodology 3
1.5 Structure of thesis 3
2 SET-BASED DESIGN 4
2.1 General Information 4
2.2 History of Set-Based Design 6
2.3 Robust and Integrated Design 7
2.4 Computational Optimisation 8
2.5 Set-Based Design in Structures 9
3 SET-BASED BRIDGE DESIGN 10
4 PREDESIGN OF BRIDGES ACCORDING TO EUROCODE 12
4.1 Concrete bridges 12 4.1.1 Dimensional compatibility 12
4.1.2 Deflection 12 4.1.3 Sectional Design 13 4.1.4 Slab design 14 4.1.5 Crack width 14
4.2 Composite bridges 15 4.2.1 Dimensional compatibility 15
4.2.2 Deflection 15 4.2.3 Stresses in steel 15 4.2.4 Buckling 16 4.2.5 Slab design 17
5 TOOL FOR ITERATIVE FINITE ELEMENT ANALYSIS 19
5.1 Motivation 19
5.2 Structure 20
5.3 Input Data 22
5.4 Type of analysis 23
5.5 Permanent loads 24
5.6 Traffic Load 24

CHALMERS, Civil and Environmental Engineering, Master’s Thesis 2014:102 IV
5.6.1 Load Model 1 from Eurocode 24 5.6.2 Implementation of the model 27
5.7 Load combination 34
5.8 Functioning of the script 35
5.8.1 Dimensional compatibility 35 5.8.2 Ultimate Limit State 35 5.8.3 Serviceability Limit State 41
5.9 Output data 42
5.10 Script Performance Optimisation 43
5.10.1 Convergence study 43
5.10.2 Parallelisation of the analysis 45
6 CASE STUDIES 48
6.1 NCC Montagebro 48 6.1.1 Geometry of the model 48 6.1.2 Parameterisation 49 6.1.3 Mesh properties 50
6.1.4 Boundary conditions 51
6.2 NCC Nynäshamn 52
6.2.1 Geometry of the model 52
6.2.2 Parameterisation 53 6.2.3 Mesh properties 56 6.2.4 Boundary conditions 57
7 OPTIMISATION 58
7.1 General Information 58
7.2 Optimisation Criteria 58 7.2.1 Material Cost 58 7.2.2 CO2 Equivalent 59
7.3 Optimisation Implementation 59
8 OTHER APPLICATIONS 60
8.1 Parametric study 60
8.2 Applications in other fields 60
9 RESULTS AND DISCUSSION 61
9.1 Comparison with real cases 61 9.1.1 NCC Montagebro 61 9.1.2 NCC Nynäshamn 64
9.2 Comparison of bridge performance 67
9.3 Correlation between optimisation criteria 69
9.4 Suitability of bridge concepts regarding span length 71
9.5 Failure types distribution 76
9.6 Applicability of set-based design on structural engineering 79
10 CONCLUSIONS 81

CHALMERS, Civil and Environmental Engineering, Master’s Thesis 2014:102 V
11 FURTHER INVESTIGATIONS 83
12 REFERENCES 84

CHALMERS, Civil and Environmental Engineering, Master’s Thesis 2014:102 VI
Preface
This Master’s Thesis has been carried out at the division of Structural Engineering of
the Department of Civil and Environmental Engineering at Chalmers University of
Technology and in collaboration with NCC Teknik.
The project would have not been possible without the help and supervision of Rasmus
Rempling at the division of Structural Engineering who has been willing to give us
support at any time and any day. Additionally, he has taught us how to organise the
work load and structure the thesis in a proper way throughout his personal advice and
organised workshops for thesis students.
Secondly, but not less important we would like to thank Alexandre Mathern from
NCC Teknik Göteborg, who supervised and gave valuable help not only from an
engineer perspective but from a company point of view, creating some new interesting
challenges that will help us in our future careers.
We cannot forget all those people that have shared this wonderful period at Chalmers
with us, including friends, flatmates, classmates, professors and our families. For your
love and support, thank you.
Finally, we would like to acknowledge Scanscot Technology for providing us with a
Brigade Plus license that has been really useful for the development of the project.

CHALMERS, Civil and Environmental Engineering, Master’s Thesis 2014:102 VII
Notations
In the notation table, all variables occurring in the report are listed alphabetically.
Abbreviations
CFD Computer Fluid Dynamics
CP Car Placement
EC Eurocode
FBC Free Body Cut
FE Finite Element
FEA Finite Element Analysis
FEM Finite Element Method
FRP Fibre Reinforced Polymer
HVAC Heat Ventilation and Air Conditioning
IPD Integrated Project Delivery
LHS Latin Hypercube Sampling
LM1 Load Model 1
MDO Multidisciplinary Design Optimisation
PBD Point-Based Design
SBD Set-Based Design
S-BIM Structural Building Information Modelling
SBPD Set-Based Parametric Design
SF Sectional Force
SLS Serviceability Limit State
SM Sectional Moment
TS Tandem System
UDL Uniformly Distributed Load
ULS Ultimate Limit State
WSM Weighted Sum Model
3D-CAD Three Dimensional Computer Assisted Design


CHALMERS, Civil and Environmental Engineering, Master’s Thesis 2014:102 1
1 INTRODUCTION
1.1 Background
Traditional engineering design is based on single solutions for each step of the
creation chain. When one of these intermediate decisions is not feasible anymore, the
process needs to step back and some modifications of the initial design have to be
performed. This principle is the most used design approach but some drawbacks such
as wasted time due to reworking, motivated the development of alternative design
approaches. Toyota was one of the first companies which started working and using a
new concept, based on a parallel and delayed decision making process called Set-
Based Design (Ward et al. 1995).
In Set-Based Design, the decisions involved in the design are not made over a single
alternative, instead a set of alternatives is decided by the stakeholders and
successively narrowed according to the limitations and decisions of those who are
implicated in the project. This approach allows a better understanding between the
different design stages, same level of implication of the different designers and the
likeliness of reworking is reduced. Although this methodology has not been applied to
many different fields yet, its suitability needs to be assessed in other areas such as
structural engineering.
The design of any sort of structure requires a series of assumptions that limits the
alternatives in the following design steps and can lead to unfeasible or suboptimal
designs. Therefore, the Set-Based Design approach might be a suitable solution in the
area of construction.
1.2 Purpose and Objectives
The Set-Based Design approach was developed in the 1990s in order to improve the
design process in car manufacturing by reducing rework, but eventually led also to a
better understanding of the procedure and wider collaboration between stakeholders.
This approach has been widely applied in different areas but still has not been deeper
assessed in structural engineering where it might be very useful due to the need of
several assumptions at early stages in the design process.
Hence, the purpose of this project was to investigate the applicability of Set-Based
Design on structural engineering, particularly in the field of bridge design. For
achieving this purpose, three main objectives were established as well as several
intermediate objectives related to them:
Develop a well-defined methodology that allows iterative preliminary design
of structures, by taking advantage of the principles of Set- Based Design.
o Set a State of the art of Set-Based Design, focused on civil and
structural engineering.
o Perform a parameterisation of a given bridge regarding design
variables and creation of a set of bridge alternatives according to
industrial practice.

CHALMERS, Civil and Environmental Engineering, Master’s Thesis 2014:102 2
o Develop a tool that allows iterative FEA based on the principles of
SBD for the assessment of the alternatives
Assess the applicability and potential of the methodology as well as its
reliability under different situations or cases.
o Present main advantages and disadvantages over the classic approach,
as well as justify the adoption of the new one.
o Study the possibilities that this new approach could provide regarding
additional studies or assessment of results.
o Assess the robustness of the results obtained with the developed
methodology
Present techniques showing how to apply said methodology in a feasible and
reasonable way.
o Propose strategies and techniques for the management of large
amounts of raw data generated by the developed SBD tool and process
these data in an efficient manner.
o Apply parallel processing and computing power for reducing
computational time and be able to expand further the design space.
1.3 Limitations
In order to assess the applicability of the tool developed according to the principles of
SBD, checks from the construction standards need to be included. However, due to
the limited time extension of this project, only the most common checks are
considered and implemented. The checks regarding buckling of steel girders are based
on simplified methods due to the difficulties of assessing buckling in non-prismatic
members.
The selection of the set of optimal alternatives among the structurally-feasible bridge
alternatives is performed according to a multi-criteria analysis which takes into
account only two criteria. Besides, these two criteria are highly related to each other
and little advantage of their combination can be taken.
Since this methodology is likely to be used as an aid in the design process but not in
the analysis or verification stage, balance between level of detail and time
consumption is needed. As intended for pre-design, only checks based on Linear
Elastic Analysis will be performed, e.g. bending capacity or deflection; and specific
analyses such as dynamic response, advanced cracking assessment, creep, aging, or
fatigue, are outside the scope of this project, although they will be required to perform
a detailed analysis of the selected alternative. The project is also focused only on one-
span bridges in order to avoid too complex support behaviours.

CHALMERS, Civil and Environmental Engineering, Master’s Thesis 2014:102 3
1.4 Methodology
First, in order to understand the principles and assess the previous applications of Set-
Based Design, a literature review was done. At this stage, a review of related theories
and tools such as Robust Design, Integrated Design and Computational Optimisation
was performed.
Once the approach of how to apply this methodology on bridge design was decided,
since an automatic and iterative Finite Element Analysis carried out in ABAQUS
requires a Python script; the ABAQUS scripting module was studied.
In order to be able to specify a set of bridge alternatives, the parameterisation of two
bridge concepts was done. Their modelling, loads and boundary conditions were
developed within the script. Furthermore, the implementation of the traffic Load
Model 1 from Eurocode was performed.
Parallel to this process, for including the required checks from standards that are
needed in the preliminary stage of bridge design, an investigation of the checks
themselves according to Eurocode and their implementation within the Python script
was carried out.
Since the tool for carrying out the iterative Finite Element Analysis required much
computational resources, the Chalmers Cluster Glenn was used for performing the
analyses.
The tool was then checked against the case studies in order to verify its reliability.
Finally, in order to reduce and narrow the sets of alternatives, a simple multi-criteria
optimisation was applied, and results were collected and discussed.
1.5 Structure of thesis
After this introductory chapter, the report includes different sections intended to cover
all the objectives set from the beginning of the project. It is structured in a way that it
is possible to go from the general principles of the Set-Based Design approach to the
case specific details that had to be included for the correct performance of the
methodology.
In Chapter 2 an introduction of the Set-Based Design methodology, together with a
literature study and an overview of other related theories are presented to establish the
theoretical solid foundation of the developed methodology. The application of Set-
Based Design to bridge design is carried out in Chapter 3.
Later in the report, the principles of bridge pre-design according to Eurocode are
presented in Chapter 4. Afterwards, the tool developed in the course of the project is
introduced and described in detail in Chapter 5 and applied to case studies later in
Chapter 6. Optimisation techniques used in the project are discussed in Chapter 7
followed by a compilation of possible usages that can be given to the tool in Chapter
8.
Finally, discussion, conclusions and recommendations for further research are
included in the last part of the report together with references.
CHALMERS, Civil and Environmental Engineering, Master’s Thesis 2014:102 4
2 SET-BASED DESIGN
2.1 General Information
The most widely used approach in structural design is known as Point-Based Design.
This approach involves selecting a single structurally-feasible design alternative at
each step of the design chain and then refining that single design, or point, while
developing more details during the design process (Parrish et al. 2007). This approach
may imply rework when at a certain stage of the design process there is not any
suitable alternative to move towards the next step. Then, the design must be
backtracked and modified in order to reach the final goal.
Moreover, the decision-making process is dependent on the judgement of the
engineers involved in the process, which is normally based on rules-of-thumb, trial-
and-error or experience of those designers, and does not take into account the opinion
of the rest of stakeholders involved in the project. This may lead to solutions which
are technically-feasible, but are not optimal in other aspects such as fabrication, cost
or supplying.
Wrong selection of an alternative in the design process and wrong communication
with the different stakeholders, might cause rework and therefore delay and extra-
costs. These issues contributed to the development of a new design concept, in which
these main drawbacks were meant to be solved. This new approach was called Set-
Based Design.
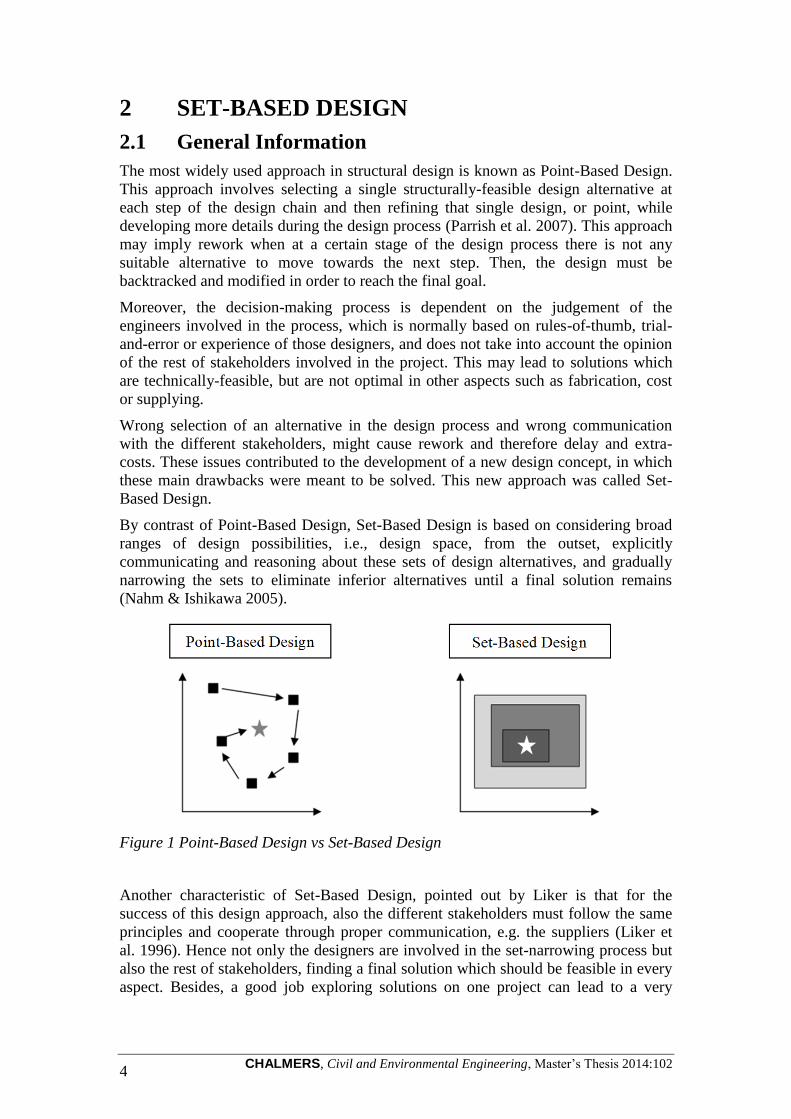
By contrast of Point-Based Design, Set-Based Design is based on considering broad
ranges of design possibilities, i.e., design space, from the outset, explicitly
communicating and reasoning about these sets of design alternatives, and gradually
narrowing the sets to eliminate inferior alternatives until a final solution remains
(Nahm & Ishikawa 2005).
Figure 1 Point-Based Design vs Set-Based Design
Another characteristic of Set-Based Design, pointed out by Liker is that for the
success of this design approach, also the different stakeholders must follow the same
principles and cooperate through proper communication, e.g. the suppliers (Liker et
al. 1996). Hence not only the designers are involved in the set-narrowing process but
also the rest of stakeholders, finding a final solution which should be feasible in every
aspect. Besides, a good job exploring solutions on one project can lead to a very

CHALMERS, Civil and Environmental Engineering, Master’s Thesis 2014:102 5
focused search and much more rapid convergence on a design in later projects (Sobek
II et al. 1999).
Set-Based Design assumes that reasoning and communicating about sets of ideas
leads to more robust, optimised systems and greater overall efficiency than working
with one idea at a time, even though the individual steps may look inefficient (Liker et
al. 1996). Theoretically, by applying this approach meticulously enough, all the
backtracking or reworking might be eliminated, although this could eventually
increase delays and cost.
The main principles of this approach are (Sobek II et al. 1999):
1. Map the Design Space
a. Define Feasible Regions: determine the primary design constraints on
each subsystem, based on past experience, analysis, experimentation
and testing, and outside information.
b. Explore Trade-offs by designing Multiple Alternatives: creating trade-
off curves about the relationship between two or more parameters. The
other stakeholders (e.g. suppliers) also present multiple alternatives for
each design alternative.
c. Communicate Sets of Possibilities: an excellent solution from one
perspective may be a poor solution from another. Use of design
matrices, see Figure 2.
Evaluation Criteria
Pote
nti
al
solu
tion
s
Structural Construction Cost CO2 Etc.
Bridge 1 O O Δ ♦
Bridge 2 O ♦ Δ Δ
Bridge 3 ♦ Δ O Δ
Bridge 4 Δ ♦ X X
Bridge 5 O Δ ♦ X
Bridge 6 Δ Δ ♦ X
O - Excellent ♦ - Acceptable Δ - Marginal X - Unacceptable
Figure 2 Example of a design matrix
2. Integrate by Intersection
a. Look for Intersections of Feasible Sets.
b. Impose Minimum Constraint: not only in the main design but also in
the sub-designs carried out by the suppliers, “let them choose as well”.
c. Seek Conceptual Robustness: Robustness = designs which are
functional regardless of physical, manufacturing, weather and market
variations. Conceptual robustness = create designs that work regardless

CHALMERS, Civil and Environmental Engineering, Master’s Thesis 2014:102 6
of physical, manufacturing, weather and market variations; but also of
what the rest of the team decides to do.
3. Establish Feasibility before Commitment
a. Narrow Sets gradually while increasing Detail: eliminate possibilities
rather than picking the best. Narrow in different steps. Keep some
back-up alternatives.
b. Stay within Sets once committed.
c. Control by Managing Uncertainty at Process Gates: design process as a
continuous flow, with information exchanged as needed.
These principles are not steps, prescriptions, or recipes and they can be applied to
each design project differently. Not only Toyota, from which it became known, has
been using this approach but also other companies such as the aircraft engine division
of General Electric. As a conclusion, any product development organisation that can
master these principles and their application may be able to radically improve design
and development processes (Sobek II et al. 1999).
2.2 History of Set-Based Design
Although it has not been established a specific date as starting point of this theory, the
first documented reference about the practice of Set-Based Design appeared in the
mid 1990s, when the description of this approach was included in a journal article by
Ward , in which the existing and successful design system of Toyota was evaluated
and discussed. This concept was developed to improve the car manufacturing process
of this firm, and it was called the Toyota’s Second Paradox by the authors, after the
success of Toyota’s production system (Ward et al. 1995). After this first introduction,
the same group of authors developed the theory and established the principles of Set-
Based Design as applied in Toyota (Sobek II et al. 1999). The principles of Set-based
Design have also been discussed in other papers such as (Stephenson & Callander
1974), (Finger & Dixon 1989a), (Finger & Dixon 1989b) or (Aganovic et al. 2004).
During the last decade, some analytical formulations based on this approach were
developed. These formulations dig deeper into the theory and try to connect its
principles with other existing methods in order to develop the design process. First,
(Wang & Terpenny 2003) described an interactive evolutionary approach to
synthesize component-based preliminary engineering design problems, by combining
Set-Based Design generation and fuzzy design trade-off strategy. Few years later,
(Nahm & Ishikawa 2005) proposed a novel space-based methodology for preliminary
engineering design, where the designer’s preference structure is included in both the
design space and the performance space by considering an aggregated preference and
a robustness index. That methodology was based on finding a ranged set of design
solutions that satisfied changing sets of performance requirements. By the late 2000s
(Madhavan et al. 2008) proposed a Set-Based multi-scale and multidisciplinary design
method in which distributed designers managed interdependencies by exchanging
targets and Pareto sets of solutions, showing higher efficiency than the traditional
design techniques. Two other formulations based on combination of existing theories
were born at the end of the decade when (Shahan & Seepersad 2009) described a Set-
Based approach to collaborative design, in which Bayesian networks are used to
represent promising regions of the design space; and (Malak et al. 2009) combined the
framework of multi-attribute utility theory, the perspective of Set-Based Design and
the explicit mathematical representation of uncertainties into a single approach to

CHALMERS, Civil and Environmental Engineering, Master’s Thesis 2014:102 7
conceptual design that handled inaccuracy. Finally, (Avigad & Moshaiov 2010)
introduced a computational approach to support concept selection in multi-objective
design with delayed decisions.
Regarding the area of application, the concept of Set-Based Design has been widely
applied and assessed in the field where it was first developed, i.e. manufacturing and
production development (Ulrich & Eppinger 2004) and (Ford & Sobek II 2005).
However, Set-based design has also been studied for its applicability in the field of
software engineering, by developing a new concept called Set-Based Parametric
Design (SBPD) which combines the Set-Based Design practice with the parametric
modelling technique widely used in most 3D-CAD systems (Nahm & Ishikawa 2006).
It has also been studied in structural and HVAC system design (Lottaz et al. 1999), by
suggesting the use of constraint solving to express possibly large families of
acceptable solutions in order to facilitate and abbreviate the negotiation process; or in
the field of ship design (Hannapel et al. 2012) where a novel multidisciplinary design
optimisation (MDO) algorithm was developed, which assesses the variables in terms
of sets.
Finally, there is need to mention that since this approach requires tools for narrowing
the sets and choosing the best alternatives, optimisation techniques have been
considered as suitable in order to evaluate those sets such as particle swarm
optimisation (Eberhart & Shi 2001) and (Eberhart & Kennedy 1995).
2.3 Robust and Integrated Design
Two design concepts have to be mentioned in this report due to their implications and
connections with Set-Based Design. On one hand, Robust Design is a widely used
concept in many different fields which means designs that stand variations. As
aforementioned, one of the principles of Set-Based is to seek for conceptual
robustness which includes creating designs optimised regardless of physical,
manufacturing, weather and market variations; but also of what the rest of the design
team decides to do (Sobek II et al. 1999). On the other hand, Integrated Design is a
more recent concept, applied to the construction industry, which looks for a better
integration of the different construction phases and stakeholders. Again highly related
with another characteristic of Set-Based Design, which is full collaboration between
design team members and other stakeholder for better results (Liker et al. 1996).
As a brief description, Robust design searches for solutions which are immune with
respect to production tolerances, parameter drifts during operation time, model
sensitivities and others (Beyer & Sendhoff 2007). The name and methods became
popular principally after Taguchi’s methods were released in the late 1990s (Taguchi
1986). Robust Design has almost as many denotations as fields of application, e.g.
Eurocode defines structural robustness as “the ability of a structure to withstand
events like fire, explosions, impact or the consequences of human error, without being
damaged to an extent disproportionate to the original cause”(SS - EN 1991-1-7:
2006). Nevertheless, when it comes to conceptual structural design, robustness can
also be described as the ability of a structural concept to fit within different
environments and situations, which is often referred to as flexibility. These
environmental or situational variations are referred to as Type I variations (Chen et al.
1998) and flexible designs should be able to require little modifications in order to be
applied to different contexts, i.e. a flexible bridge concept which can be used within a

CHALMERS, Civil and Environmental Engineering, Master’s Thesis 2014:102 8
range of span lengths by changing its dimensions a little. For more information, an
overview of Robust Design can be found in (Park et al. 2006).
Otherwise, Integrated Design is one of the phases of what is usually referred to as IPD
(Integrated Project Delivery) which was conceived as an alternative construction
project management approach to improve the known low profitability in the
construction industry (Egan 1998). IPD motivates collaboration throughout the design
and construction process and between stakeholders, tying stakeholder success to
project success (AIA 2007). The principles and methodologies related to IPD can be
extrapolated to the particular characteristics of the design phase. Successful use of
Integrated Design involves changes over the traditional design practice. Example of
these changes include: a team approach, support for innovation and tolerance of
failure or strong lateral linkages and decentralised decision making (Owen 2009). One
of the identified principles of integrated design of structures is a parametric design
approach. Being the parametric design approach the most advantageous approach
based on the theoretical frames of computer aided design, knowledge based
engineering and generative design (Rempling et al. 2014).
2.4 Computational Optimisation
Modern engineering cannot be conceived without the power of computing. Computers
are not only able to render immense amounts of calculations in short periods of time
but they also permit automatic calculations. The first characteristic is directly related
to computational structural analysis, e.g. Finite Element Analysis, and with
optimisation techniques both used in performing full analysis or in sorting results. The
latter, will be one of the pillars of the methodology developed in this project. A brief
survey of Computational Optimisation is presented in this chapter in order to present
tools and techniques which might be used in this or similar works.
According to (Shi 2007), optimisation is one of the most powerful tools to ensure
efficient use of scarce resources. The first widely used method was Linear
Optimisation in 1948 (Ben-Tal & Nemirovski 2013), and it is still very useful for the
modelling of practical problems. This initial strategy was followed by other different
new methods, such as convex quadratic optimisation and semi-definite optimisation
(Ben-Tal & Nemirovski 2013) and (Wolkowicz et al. 2000) to model both economic
and engineering problems.
However, new problems and applications showed the need to develop new techniques
allowing the researcher to optimise other situations like discrete problems or finding
explicit solution (Laier & Morales 2009).
When computers started to be available for research use, optimisation suffered some
kind of transformation or adaptation to the new possibilities and resources. This is
how Computational Optimisation was born. Additionally, since uncertainty is always
present in real world systems, it is desirable to find not only an optimal solution but
robust as well, in order to be able to overcome the existing uncertainty (Yang &
Koziel 2011). As the noble prize winner Kenneth G. Wilson predicted in 1982,
computational modelling (including Computational Optimisation) is becoming the
third paradigm of modern sciences, and it is being widely used since the raw
calculation power available is immense.

CHALMERS, Civil and Environmental Engineering, Master’s Thesis 2014:102 9
With the use of computing, new optimisation strategies suitable for these resources
were developed successfully. Evolutionary algorithms have been especially important
in this sense. The best known are evolutionary programming (Fogel et al. 1966),
genetic algorithms (Goldberg 1989) and evolution strategies (Rechenberg 1989).
Despite the fact that these techniques were initially developed to simulate the
behaviour of natural processes, they have been widely applied to other fields like
structural engineering. It can be used, for example, to assess the existing damage in
structures (Laier & Morales 2009).
Finally, over the last twenty years, artificial intelligence techniques have been
developed as a way to reduce the time consumption procedures of some scientific
methods, such as Finite Element Analysis. The latter is usually done by the
application of neural networks that are able to predict Finite Element outputs from
given inputs (Adeli & Park 1995), (Berke et al. 1993) and (Papadopoulos & Eds
2013). With this technique, by testing a reduced amount of samples and then
interpolating for intermediate values, a big amount of inputs can be evaluated in a
more effective way, reducing computational cost. It is important to note that this
technique is easily verifiable, since the only check that should be done is comparing
real Finite Element outputs to the outputs obtained from the neural network.
2.5 Set-Based Design in Structures
There has not been much development in evaluating or implementing Set-Based
Design in Structural Engineering until now. Only a few works such as a Set-Based
methodology for reinforcement design (Parrish et al. 2007) and (Parrish 2009), a
system to improve approval process for rebar estimation based on communication
between the different stakeholders (Castro-Lacouture et al. 2006), or the evaluation of
the capabilities of Set-Based Design using S-BIM (Structural- Building Information
Modelling) (Lee et al. 2012).
Nevertheless, other design approaches strongly related with Set-Based Design have
been developed in the field of structural engineering. A good example of this is
(Dalton et al. 2013) which describes an optimisation-based methodology for structural
design, considering safety, robustness and cost. In this approach, several designs are
evaluated through Finite Element Analysis, designs that are defined upon variability
of the design parameters. This methodology is described as based on Robust Design
and it requires optimisation techniques and pre-selection tools for the initial set of
alternatives, e.g. max-min Latin-Hypercube sampling (LHS), for reducing the
computational cost of the calculation of all combinations, (van Dam et al. 2007)
(Morris & Mitchell 1995).

CHALMERS, Civil and Environmental Engineering, Master’s Thesis 2014:102 10
3 SET-BASED BRIDGE DESIGN
This chapter aims to present the motivations and bases of the methodology which has
been developed within this project.
Some main issues that are related with the inefficiency of bridge design and were
intended to be solved, at least partially, by this methodology are the following:
Bridge design is based on Point-Based Design, which is prone to require
rework and hence extra cost. This issue is even more critical as some of the
assumptions at early stage of the design of bridges, which have high influence
in the overall design, are made based on rules-of-thumb or trial-and-error.
Bridge concepts are usually meant to meet specific requirements and fit within
a specific environment, and therefore big changes are necessary if the same
concept wants to be reused in a different but similar situation.
Miscommunication between different phases within the design process and
between stakeholders can lead to unfeasible solutions. Besides, there is scarce
collaboration between designers, contractors and suppliers.
The pre-design is normally made based on hand calculations which extremely
limit the number of design alternatives that are assessed. Hence, an optimal
solution is difficult to be found.
The impact of these four main issues can be avoided or reduced by applying some
techniques and methodologies derived from the theories aforementioned: Set-Based
Design, Robust Design, Integrated Design and Computational Optimisation.
First, in order to define the problem to be solved, some limitations have to be set. The
prime step in a bridge construction project is to determine the location of the structure,
depending mainly on traffic conditions. However, this stage is outside the scope of
this project and hence, the decision for the bridge situation is considered to already be
made.
Once the location of the bridge has been decided, there are some parameters which are
already predefined, like the bridge span or width and number of lanes. Nevertheless,
other parameters have to be selected by the designers such as the type of bridge,
dimensions or reinforcement in case of concrete structures.
Although this work aims to develop a systematic methodology to optimise bridges
and help in their design process, it does require some pre-decisions like the type and
shape of the bridge or the structural elements which will compose the whole structure.
For this reason, this thesis will start from the stage where the bridge has been defined
in type, material, general shape and structural components. However, this does not
mean that only one bridge model can be assessed at the time, but an evaluation of
different models can be performed in order to obtain the most suitable one out of
bridges of different materials, shapes or some other characteristics.
Another point that requires highlighting through this thesis is that the scope of this
project focus on the predesign stage and it does not apply to the final design stage,
where a full analysis as it normally performed or verified is always needed.
The Set-Based Design theory as it has been described before is based on considering
sets of alternatives, as long as they can be considered as feasible, including also the

CHALMERS, Civil and Environmental Engineering, Master’s Thesis 2014:102 11
different stakeholders in the decision-making process. However, the methodology of
applying this theory can widely vary, depending on the problem that needs to be
faced. The narrowing process from the Set-Based Design theory, wherein the different
stakeholders are meant to have direct influence, can be enhanced by including some
of the main features of Integrated Design, such as the collaboration between design
phases and members. In order to make flexible designs, Parameterisation, one of the
foundations of Robust Design, i.e. also referred as Parametric Robust Design, can be
applied, increasing the adaptability of the bridge to meet new requirements. Finally,
all this could not be applied without using the power of computing, and some of its
potential is used such as computational Finite Element Analysis or Computational
Optimisation techniques.
In this project, two different phases can be distinguished. The first phase is based on a
combination of the concept Set of Alternatives and Parameterisation. In this phase,
the parameters considered for characterising a bridge model are defined as wide
ranges, whose combinations will define a set of bridge alternatives.
These alternatives are then evaluated by FE analysis carried out in powerful multi-
node computers to reduce the computational time of the calculations. A first filter
might be considered at this stage in order to narrow the set of alternatives, rejecting
those which do not fulfil some criteria or thresholds. This method sorts out a set of
alternatives containing the viable bridges among a huge number of them, regarding
their structural behaviour and also some construction restrictions, e.g. structural
capacity, deflection limitation or number of reinforcing layers that can be feasibly
placed in a beam.
The second phase consists on the management of the outputs from the former phase in
order to find out the optimal alternative or set of alternatives out of the whole set of
bridges initially selected. This is carried out by multi-objective optimisation, where
not only the structural response is considered but also other aspects such as material
costs, time estimation of the construction process or supplying.

CHALMERS, Civil and Environmental Engineering, Master’s Thesis 2014:102 12
4 PREDESIGN OF BRIDGES ACCORDING TO
EUROCODE
The methodology developed in this project was focused on pre-design of structures,
specifically bridges, which would be further developed in later stages of the process
on its way to the final design. Therefore, it was important to establish beforehand how
accurate the structural checks should be in this early design phase.
Accuracy of the checks in this framework was an issue that had to be analysed very
carefully due to the direct consequences it has for both the results and the
performance of the process. Predesign should be complete enough to ensure correct
results that would later lead to solid final design stages, but not as complex as final
design since it would make the preliminary design stage too long and would probably
narrow down the solution space too early.
As a consequence, this phase was considered as a compromise between accuracy of
the results and conservation of the essence of Set-Based Design, where a lot of
different alternatives should be considered and assessed. In the next sections both
bridges considered will have its predesign phase checks described, referencing
Eurocode as the main standard used for the design.
In the following chapters different rules and methods for the assessment of structures
will be presented as general as possible, even though for the sake of precision they are
specifically selected for the case of study. For this purpose, it was taken into account
both characteristics of the study cases and the scope of the methodology. However, it
is still applicable to any other case by selecting the proper checks from the standards.
4.1 Concrete bridges
4.1.1 Dimensional compatibility
As a first check, dimensional compatibility of the alternatives was assessed in order to
ensure if the structure was feasible considering buildability aspects. As stated in
previous chapters, Set-Based Design implies the consideration of multiple
alternatives. If these alternatives are built by random combinations of dimensional
parameters within specified ranges, it might lead to non-buildable designs. The main
example of these incompatibilities might be considering a number of beams that
cannot fit within the slab width provided, and hence, this alternative should be
discarded before the analysis.
4.1.2 Deflection
Deflection is a limitation that should be taken into account even though it is not
usually critical in short-mid span concrete bridges. Eurocode itself does not limit the
overall maximum vertical deflection of bridges but refers to other issues such as
dynamic impact of traffic, cracking or gaps in expansion joints. Hence, this limitation
is normally up to the national road administrations. As an example, the Swedish
standard limitation from section B.3.4.2.2 (TRVK BRO 11 2011) was taken.
Consequently, L/400 was the limit value for the vertical deflection.
As a consequence of the designed methodology, the deflection was calculated by the
Finite Element Analysis of the bridge, which means before the reinforcement is
designed. Hence, the value obtained could not be considered as the final value, since

CHALMERS, Civil and Environmental Engineering, Master’s Thesis 2014:102 13
only the stiffness from the concrete was taken into account, neglecting the additional
stiffness provided by the reinforcement.
As a consequence, two approaches were considered to handle this issue. The first one
stated that since the stiffness taken into account for deflection calculations was always
lower than the real one, since reinforced concrete would always be stiffer than the
same concrete with any kind of reinforcement, the results were always on the safe
side. The second approach was the execution of a second analysis considering the
stiffness of the reinforcement once it was designed, but it was discarded due to the
amount of resources needed to perform the analysis.
Although oversizing of structural members might happen by considering the first
approach, the unlikeliness of the deflection as a limiting parameter in this case, as
well as the huge impact that the adoption of second approach would have, lead to the
decision of using the first one. The predesign phase stage together with the Set-Based
Design methodology supported this decision, since in case that this parameter could
be limiting in any alternative, it would be easily discarded in later phases of the
design.
4.1.3 Sectional Design
In concrete bridges with a high number of beams, as in the studied case, the quotient
between the separation of beams and the width of the deck is expected to be fairly
low. It was then considered that instead of designing the beams and the slab
separately, the deck should be designed as a set of consecutive T-sections. Eurocode
includes this approach and sets the limitations that must be fulfilled to be able to
consider this design strategy. Therefore, these limitations were checked before the
analysis in order to be able to ensure the integrity of the results.
According to EC2 the main requirement for the consideration of this approach is
having a spanning distance between beams so that the member between beams cannot
be considered as a slab according to (SS-EN 1992-1-1:2005, Section 5.3.1(4)), i.e.
separation of beams lower than five times the thickness of the deck.
For the design of T sections, the effective flange width was considered as stated in
(SS-EN 1992-1-1:2005, Eq. 5.7).
Figure 3 Effective flange width parameters (EN 1992-1-1:2005 5.3.2)

CHALMERS, Civil and Environmental Engineering, Master’s Thesis 2014:102 14
As previously discussed, the bridge was considered as a group of concrete T-beams
subjected to a bending moment and shear force. Hence, those beams would need steel
reinforcement in the cases where the capacity of the concrete is not enough to carry
those load effects.
Reinforcement design was divided in two main categories, bending and shear
reinforcement, following design procedures according to Eurocode 2.
4.1.3.1 Bending reinforcement
For the sectional design in ULS, linear elastic approach was used with no moment
redistribution considered. For the equilibrium equations, yielding in the
reinforcement bars was assumed. The value of the lever arm was approximated by:
Once the reinforcement was designed, ductility was checked in order to know if the
design fulfilled the Eurocode limitation.
4.1.3.2 Shear reinforcement
Shear capacity was calculated according to (SS-EN 1992-1-1:2005, Section 6.2),
checking the capacity of the concrete to shear and designing the reinforcement when
needed. Once reinforcement was designed, it was assumed that the shear force was
completely taken by the reinforcement, not taking into account concrete shear
resistance in that case.
Concrete resistance was defined as stated in (SS-EN 1992-1-1:2005, Section 6.2).
In case shear force exceeded the concrete shear resistance, reinforcement was required
and designed according to (SS-EN 1992-1-1:2005, Section 6.2.3). To keep
buildability of the structure, shear reinforcement was restricted to 100 mm minimum
spacing, and multiples of that value for other spacing values.
4.1.4 Slab design
Although the sectional design of the bridge is approached as described in the previous
section, this is only a design approach that cannot be taken as literal. It is still
necessary to reinforce the concrete slab to fulfil the code requirement. However,
provided that the whole section was considered for the beam reinforcement design,
the code allows reinforcing it according to the minimum value of reinforcement.
Therefore, area of steel needed in the slab was established according to (SS-EN 1992-
1-1:2005, Section 9.2.1.1.(9.1N)).
4.1.5 Crack width
Although it is not recommended to make an advanced cracking analysis in
preliminary design, it was necessary to consider this in some way in order to ensure
solid alternatives for subsequent stages of the design. As a result, the crack width was
limited to the threshold value that Eurocode sets as maximum acceptable crack width
wmax=0.3mm as stated in (SS-EN 1992-1-1:2005, Table 7.1N). By including crack
analysis, even with this simple approach, a lot of poor designs were discarded and
consequently a lot of calculations would be avoided in the next step of the design
process. The crack width was estimated according to (SS-EN 1992-1-1:2005, Section
7.3.4).

CHALMERS, Civil and Environmental Engineering, Master’s Thesis 2014:102 15
4.2 Composite bridges
The term composite when it refers to bridges can be ambiguous, and often it is
understood as Fibre Reinforced Polymer (FRP) bridges. In this project the term is the
one considered in Eurocode 4, which means steel and concrete bridges, specifically
bridges made as a concrete deck resting on steel girders.
4.2.1 Dimensional compatibility
As explained in the previous section, dimensional compatibility had to be checked, in
order to ensure the geometric feasibility of the structure before checking its structural
behaviour. As it happened with the concrete bridge, it was important to check if the
beams were overlapping. Only extreme configurations would lead to overlapping, but
it would be disastrous for the methodology if geometrically non-feasible bridges
would reach later stages of design. It was therefore checked whether the flanges of the
steel I-beams were overlapping.
Additionally, since the steel girders had variable section along the beam, it might
happen that the section becomes zero because of an extreme combination of
parameters. Since this issue turns the alternative into unfeasible, this was another
check that was introduced in the predesign phase.
4.2.2 Deflection
Deflection was checked in the composite bridge as well, in order to ensure it is under
the threshold set by the code. As stated previously for the concrete bridge, L/400 was
taken from the Swedish standard from the road administration as maximum vertical
deflection allowed. It is important to note that, while in the concrete bridge it was
generally not a critical parameter, it is much more important when steel girders are
present.
Additionally, in contrast with the concrete bridge case, deflection can be calculated
together with the other variables since the stiffness of the steel is considered from the
beginning of the process, avoiding one of the issues stated before for the other case,
i.e. the concrete slab has very little influence in the overall deflection.
4.2.3 Stresses in steel
In traditional design, capacity of the steel sections is calculated according to classic
mechanics by means of sectional forces or moments applied. In this case, since the
methodology was using a Finite Element Analysis (FEA), the approach was different.
In FEA deflections and stresses are calculated at the beginning, and by means of
integration moments and forces are obtained. It was considered unnecessary to
calculate steel capacity by using moments and forces obtained from stresses, since the
actual limitation of steel strength is the stress.
Consequently, the approach for the calculation of the capacity of steel was the
comparison of the stresses obtained from FEA (Von Mises criterion) with the design
yield stress of steel (SS-EN1993-1-1:2005, Annex C.8). According to EC3, the steel
element has to fulfil at every point the equation included in (SS-EN 1993-1-1:2005
Section 6.1).

CHALMERS, Civil and Environmental Engineering, Master’s Thesis 2014:102 16
4.2.4 Buckling
As in every steel structure subjected to transversal load, buckling was checked in the
bridge. Two different classes of buckling were considered, lateral torsional buckling
and shear buckling.
4.2.4.1 Buckling of members in bending. Lateral Torsional Buckling during
construction
Although the structural behaviour of the bridge is not prone to buckling in
compression, it is important to check the members subjected to bending and prone to
buckling, i.e. Lateral Torsional Buckling. This is important during the construction
phase, while the concrete slab is being casted on the beams. In this phase, rigidity
coming from concrete cannot be considered for the structure, but load coming from
the self-weight is, resulting in a limit case regarding Lateral Torsional Buckling. If
this limit case is not taken into account, it might happen that the bridge needs special
construction considerations even if it is structurally feasible once constructed. If
special measurements such as stiffeners or additional supports during constructions
phase are not considered, the bridge should be tagged as non-feasible and discarded.
The check needed for lateral torsional buckling was made according to (SN003a-EN-
EU).
The check needed for lateral torsional buckling was made according to (SN003a-EN-
EU), where a critical moment is defined, which represents the maximum bending
moment that a girder can carry without buckling.
4.2.4.2 Buckling of members in bending. Lateral Torsional Buckling under
traffic load
In simply supported composite bridges the lower flange of the girder is always in
tension, the upper flange is linked to the concrete slab and only a small length of the
web might be in compression, which makes a lateral torsional buckling under traffic
load a negligible check. Nevertheless, in bridges with fixed supports, a part of the
lower flange near the supports is subjected to compression, and therefore, not only
buckling during the construction phase is prone to happen but buckling under the
traffic load might occur. The interaction between the deck and the upper flange makes
not suitable the method proposed above and a different alternative has to be
considered.
Even if the most suitable alternative should be the general method from (SS-EN1993-
1-1:2005, Section 6.4.3), it implies a detailed analysis involving specific FEM
buckling assessment which makes it unsuitable for pre-design considerations.
Although several assumptions are not fulfilled, e.g. the lower flange is not a uniform
member or the moment distribution is highly variable; the simplified method (SS-
EN1993-1-1:2005, Section 6.3.2.4) which considers the part of the lower flange in
compression as a strut has been used in order to give a rough estimation of the
buckling resistance of the girder.
4.2.4.3 Shear buckling
Finally, shear buckling was checked to ensure the correct structural behaviour of the
structure. EC3 procedure was followed to compare the shear force in the web with the
shear buckling capacity of the girder. Additionally, some checks to know if shear
buckling occurs were included to avoid pointless calculations.

CHALMERS, Civil and Environmental Engineering, Master’s Thesis 2014:102 17
According to EC3, the checks needed for shear buckling should be done by following
(SS - EN 1993-1-5:2006, Sections 5.1,5.2,5.8).
4.2.5 Slab design
In contrast to the case study of the concrete bridge, where design approach using T-
beams was assumed, the composite bridge deck fulfil the requirements of EC to be
considered as a slab, and had therefore to be designed.
4.2.5.1 Bending reinforcement of the slab
Bending reinforcement of the slab was based on the recommendations found in
(Johansson et al. 2012) coming from (Eibl 1995),(CEB-FIP 2008) and
(Blaaunwendraad 2010). First assumption adopted was that longitudinal moment was
carried by the girders, considering it as a one way slab. Therefore, sectional design of
longitudinal and transversal reinforcement was performed in a different way.
As stated in (Johansson et al. 2012), transversal reinforcement of the slab had to be
performed considering sectional moments in the appropriate direction as well as
torsional moments by using
| |
Equation 1 Sectional moments for the transversal reinforcement of the slab
(Johansson et al. 2012).
where corresponds to transversal sectional moment and corresponds to
torsional moment.
For longitudinal reinforcement, moment was mainly taken by the girders but still
some reinforcement was needed near the supports of the bridge due to restraint
stresses in tension (both ends were fixed). Following (Johansson et al. 2012)
recommendations, membrane forces were used for the calculation of said
reinforcement as
| |
Equation 2 Membrane forces for the longitudinal reinforcement of the slab
(Johansson et al. 2012).
where corresponds to longitudinal membrane force and corresponds to the shear
membrane force, both at the mid-surface of the slab. In both cases, µ is a factor that
might be chosen due to practical considerations, but usually close to 1 as stated in
(Johansson et al. 2012).
Together with the minimum steel reinforcement established by Eurocode and
presented in the concrete bridge section, there was a maximum area of steel that set
the limit to discard the alternative due to excessive amount of reinforcement. This
limitation can be found in (SS-EN 1992-1-1:2005, Section 9.2.1.1(3)) and depends on
the National Annex.

CHALMERS, Civil and Environmental Engineering, Master’s Thesis 2014:102 18
4.2.5.2 Shear reinforcement the of slab
In opposition to the concrete bridge, since the concrete slab in the steel bridge was
heavily reinforced, shear capacity of the slab was checked to know if the
reinforcement design could be avoided. After performing some checks, it was tested
that shear capacity of the concrete is usually more than enough to withstand the shear
force in the slab, so no shear reinforcement design was included in this predesign
state. If a combination was assessed where shear reinforcement was needed, the
bridge would be discarded to avoid non feasible bridges to go pass in the design
process.

CHALMERS, Civil and Environmental Engineering, Master’s Thesis 2014:102 19
5 TOOL FOR ITERATIVE FINITE ELEMENT
ANALYSIS
5.1 Motivation
As it has been presented in Chapter 3, predesign of bridges has traditionally been a
process based on multiple assumptions which can lead to unfeasible designs.
However, although those assumptions are supported mainly on the designer’s
experience, the checks to verify a design alternative follow some sort of standard, e.g.
Eurocode. Regarding the assumptions, the fact of having to guess and may end up
selecting a suboptimal alternative could be avoided if a large amount of alternatives
could be taken into account by implementing an automatic analysis process, rather
than the few alternatives that are nowadays handled by manual calculations. In this
automatic analysis process, the checks aforementioned should be included in order to
simulate as close as possible the designer’s criteria, and be sure that the process is just
widening the number of alternatives considered in pre-design without skipping any
required verification considered in the traditional design process of bridges.
The checks from standards mentioned in Chapter 4 can be normally used without
having to introduce any sort of computational analysis, and hence can be performed
by hand calculations. However, new computational techniques, especially Finite
Element Analysis, have opened new possibilities in structural design, leading to faster
and more accurate analysis. These standards already approve in some extension the
use of this type of analysis and their combination is promising.
Hence, the basis of this methodology was to implement the required checks,
commonly used in traditional design practice of bridges, within an automatic process
able to analysed large numbers of bridge alternatives, supported when needed on the
results of a Finite Element Analysis. Throughout the process, the different checks and
standard requirements select only the structurally-feasible alternatives, leading to a
final set of possible alternatives.
Since the Finite Element Analysis engine that will be used, i.e. ABAQUS, is based on
the programming language Python, the most suitable way of automating the process
was the development of a Python script which controlled the Finite Element Analysis
and the checks from the specific standards. The structure and the different aspects
concerning this script and its functioning are presented in the following sections.

CHALMERS, Civil and Environmental Engineering, Master’s Thesis 2014:102 20
5.2 Structure
As the script was intended to be a tool for the designer, the structure follows a pattern
that can be easily isolated and identified with the different phases of the traditional
pre-design. A general idea about it can be obtained by checking Figure 4, where a
flow chart describing the script structure can be found.
Figure 4 Flow chart describing the script structure
First, a module that creates a list of bridges by combining dimensional parameter from
given ranges was implemented. It is important to notice that both variable parameters
(those which vary during the loop) and previously fixed parameters are used for this
purpose. More details about the parameterisation can be found in the case studies,
Chapter 6.

CHALMERS, Civil and Environmental Engineering, Master’s Thesis 2014:102 21
Secondly, the script performs the evaluation of each bridge of the list. This process
was carried out by a loop that performed the creation of the model of every bridge in
the set, prepared and launched the analysis in ABAQUS sequentially. Details
regarding the models can be found in Chapter 6, and details about the analysis can be
found in Subchapter 5.4.
Following, the required data from the analysis that will be used in the standards’
verifications was extracted from the model by means of three ABAQUS features:
directly from the output fields of the whole model or parts of it, from paths that
defined along which line the outputs were going to be extracted from, and from a
feature called Free Body Cut, which computes the sectional moments and forces over
an specified section of the model by means of the nodal forces in the section.
Next, some of these extracted data were used directly for checking some standards’
requirements, e.g. maximum deflection or maximum stress; others were checked
against resistances from the standards, e.g. lateral torsional buckling or shear
buckling; and others needed to be further transformed in order to be used for
verification, e.g. crack width.
In case there was need to design reinforcement of concrete members two methods
were used regarding the type of structural element, an internal loop determined the
reinforcement configuration for a range of bar diameters in concrete beams; and the
sectional moments and membrane forces determined the reinforcement in case of
concrete slabs.
Finally, once the bridge was modelled, analysed and verified, there were some
instructions implemented to carry out the data extraction from the model, prepare the
raw data for further analysis and clear the remaining information in the model. The
latter was necessary to prepare the script to perform a new iteration for another bridge
configuration, avoiding possible errors derived from old variables leftovers stored in
the memory and an excessive required storage capacity. During the data extraction,
the script checked if the bridge alternative fulfilled all the requirements. At this stage,
it is important to notice that some of these requirements were must criteria and
therefore they determined whether or not the alternative was considered within the
final set of possible alternatives, e.g. maxim stress or deflection; or want criteria
which did not discard the alternative but weighed the alternative negatively when the
final set was assessed, e.g. buckling, avoided by including stiffeners. More
information about the types of criteria can be found in Subchapter 5.7.
It is important to note that the whole process previously described was performed
automatically, which means that the designer does not have to interact or introduce
new information or parameters while the analysis is running. Therefore, the script was
oriented to be able to work for as long time as needed, being possible to cover as
many cases as desired.

CHALMERS, Civil and Environmental Engineering, Master’s Thesis 2014:102 22
5.3 Input Data
As it was presented earlier, the initial stage of the design process should be an
assessment of the construction site of the bridge, taking important information such as
total length of the bridge or required width, for example, according to the number of
traffic lanes.
Depending on the intended use of the bridge, it is necessary to introduce the
correspondent loads as stated in the codes. Typical loads are self-weight or traffic
loads. It is also necessary to decide the material class that will be used for every
structural element. This was done by introducing the mechanical properties of every
material in use, such as Young’s modulus, density or Poisson’s ratio.
It is important to note that everything described before were considered as fixed
parameters, so they were established at the beginning of the design process and were
not changed in the iterative process.
On the other hand, there are some parameters that were not considered as fixed
values, but included within ranges of variables established by the designer. The
suitability of the ranges would be decided and limited by the designer, according to
his own experience and standards’ recommendations. These parameters were the
dimensional parameters which defined each bridge alternative. In case of the design of
concrete members, diameters of reinforcement bars could be varied as well in order to
find the most suitable reinforcement configuration for every case.
Finally, there were some parameters included in the simulation that were not directly
related with structural behaviour but were important for the validity of the results as
well as for the general performance of the process. These parameters are mainly
related with the computational performance of the process, such as number of
computational threads used in the simulation (logical and physical cores) or mesh
density (size of elements). Additionally, it is also possible to decide the accuracy or
complexity of the analysis by selecting which sections of the bridge would be
individually analysed, e.g. sections where the sectional moment and forces are taken
from. The more sections included, the more detailed the analysis would be but
computational time might increase.
Therefore, it is interesting to select the right accuracy regarding the number of
sections analysed, since exploiting this possibility might lead to very complex
designs. For example, it could happen that the analysis of too many sections in a
concrete bridge would result in a too complex reinforcement design, with different
number of bars in each section that may difficult the construction of the bridge.
Since the aim of the script was assisting the engineer during the design process, it is
necessary that the designer uses his own knowledge in order to help the script work
better.

CHALMERS, Civil and Environmental Engineering, Master’s Thesis 2014:102 23
5.4 Type of analysis
Probably one of the most important features of the Finite Element simulation regards
the type of analysis needed for each situation. While performing complex analyses
may lead to more accurate results, it is important to take into account that these
analyses may require too much information from the model as well as computational
resources.
Since this methodology was intended for pre-design, advanced analyses are not
required. Moreover, the faster the analysis is, the wider the set of analysed alternatives
can be done. Therefore, linear elastic analysis was decided to be the most suitable, as
it provided acceptable results for early phases and it was light enough to be iteratively
performed.
However, it must not be forgotten that at least the selected alternative as final design
will require a more complete analysis, i.e. non-linear analysis; for taking into account
phenomena such as buckling or cracking.
Assuming this principle, it is possible to apply the methodology to the highest extent,
by broadening the design space as much as possible and progressively narrowing it
through the process. As a result, a lot of time and money would be saved by the
utilisation of the tool, since early phases of the project can be carried out with a bigger
number of estimations (by using a bigger design space) that would lead to better
designs in later phases, since more possibilities were covered from the beginning.

CHALMERS, Civil and Environmental Engineering, Master’s Thesis 2014:102 24
5.5 Permanent loads
Permanent loads in the model are self-weight and an edge beam load.
The self-weight of the model was introduced as a gravity load by taking advantage of
a previous definition of the materials’ densities. Just with these densities, the software
applies automatically the correspondent load to simulate gravity loading of the model.
The edge beam load was introduced in order to include in the model the additional
size of the edge beams of the bridge. These beams are bigger than the other ones but
its bigger size cannot be taken into account in the structural behaviour of the bridge.
Hence, modelling of these beams had to be done by modelling an edge beam of the
same size as the others, but applying an extra load on it to introduce extra weight that
was not included in the previous load. The magnitude of the load was proportional to
height and width of the beam depending on the case as well as concrete density. Load
coming from the barrier expected to be placed on the edge beam was also introduced.
As seen in Figure 5, this load was applied on a surface equivalent to the edge beam in
order to keep coherence between model and reality.
Figure 5 Edge beam load applied to a concrete bridge
5.6 Traffic Load
While performing the analysis and modelling of the bridges that were studied, it was
decided that loading conditions were not realistic enough to produce valuable results
and were not fulfilling Eurocode requirements. Consequently, an in-depth study was
performed to solve this issue. It was concluded that some traffic load model should be
integrated in the tool to ensure accurate results and consistent designs.
5.6.1 Load Model 1 from Eurocode
Once it was decided that a traffic loading model was necessary to be introduced in the
tool, since traffic load is something that has to be definitely taken into account in
bridge design, an in-depth study of the different Traffic Loading Models available in

CHALMERS, Civil and Environmental Engineering, Master’s Thesis 2014:102 25
Eurocode was carried out. As it was possible to introduce any available load model,
Load Model 1 (LM1) was chosen because of its versatility as well as its general
purpose that matched perfectly with the aim of the applied methodology, and more
specifically with the tool developed for it.
Load model 1 is defined in Eurocode 1 (SS-EN 1991-2) as “Concentrated and
uniformly distributed loads, which cover most of the effects of the traffic of lorries and
cars”. Additionally, it is stated afterwards that “this model should be used for general
and local verifications”.
The model consists in two partial loading systems that are intended to apply to the
bridge loading conditions similar to the worst case scenario expected in reality.
First system is called Tandem System (TS), which is a double-axle concentrated load
set with its specific loading stated in Eurocode. Values for the axle load can be found
in Table 1.
Figure 6 Tandem system from Load Model 1 (SS-EN 1991-2)
Second system is called Uniformly Distributed Loads System (UDL) and it is formed
by a set of uniform distributed loads with pressure values as stated in Eurocode. These
values can be found as well in Table 1.
The combination of both systems results in the loading model itself, as it can be seen
in Figure 7. By the only application of these two systems it is possible to simulate the
design conditions of a bridge subjected to heavy traffic conditions. However, to be
able to reach worst case scenarios, i.e. design cases, it is important to place the
different systems on the bridge deck in a correct way, by following Eurocode
carefully.

CHALMERS, Civil and Environmental Engineering, Master’s Thesis 2014:102 26
Every loading model in Eurocode is applied individually to different surfaces called
Notional lanes, whose width is perfectly established on beforehand.
Notional lanes are created to be able to impose different load conditions to different
parts of the deck in a standard way, in order to have the same procedure for every
case. They divide the carriageway part of the bridge deck in different surfaces with
different loads applied, depending on the position. The remaining area that does not
belong to any of the notional lanes is called Remaining area and it has its own loading
conditions.
Notional lanes are very important in the model since they govern the amount of load
placed in each part of the deck according to Table 1, by applying a different uniform
distributed load in every lane. Moreover, they also have a huge impact in the tandem
system since they define its location within the bridge deck.
Table 1 Load Model 1 Characteristic values (SS-EN 1992-1, Table 4.2)
Figure 7 Load Model 1 from (SS-EN 1991-2)

CHALMERS, Civil and Environmental Engineering, Master’s Thesis 2014:102 27
5.6.2 Implementation of the model
Once the loading model was decided to be LM1 and studied carefully, implementation
phase started. It was necessary to make decisions about the basic implementation of
the model as well as its performance and accuracy, trying to keep in mind the purpose
of the applied methodology.
5.6.2.1 Basic modelling of the traffic load
In its very basis, loading model implemented in ABAQUS consisted in a very thin
plate element with no modulus of elasticity and density, that would get applied the
traffic load coming from the loading model.
The main advantage of this strategy was its high grade of versatility. Once integrated
in the script, by adapting the dimensions of the plate it could be used in any
previously modelled bridge. The connection between the bridge deck and this
auxiliary element, referred as traffic plate, was solved with the Tie function from
ABAQUS. By doing this, all the deformations applied to the nodes located in the
traffic plate would be perfectly transferred to the bridge deck, giving the same results
as if it was directly applied to the deck, as happens in reality.
Some other advantages found in having and independent instance for the traffic
loading was the freedom to modify it with partitions, making easier the
implementation of notional lanes and both load systems previously described.
Figure 8 Traffic plate tied to the bridge geometry
5.6.2.2 Favourable loading
Another key aspect of the design was the management of favourable loads. According
to Eurocode, when doing a global analysis Tandem Systems can be considered both in
favourable and unfavourable cases for simplicity. On the other hand, it is stated in
Eurocode that Uniform Distributed Load should not be applied in favourable cases
(SS-EN 1991-2, Section 4.2), as this would produce more favourable results than
expected. Therefore, it was necessary to assess which situations would produce
favourable loading cases both in longitudinal and transversal direction.
In order to deal with favourable loads, it was decided to produce influence lines for
reaction forces over the beams. For this purpose, every beam was considered
separately, since one loading state might have favourable load areas when referring to
one beam and do not have it when designing another one. This is because for the
design of different beams, the influence line obtained comes from different reaction
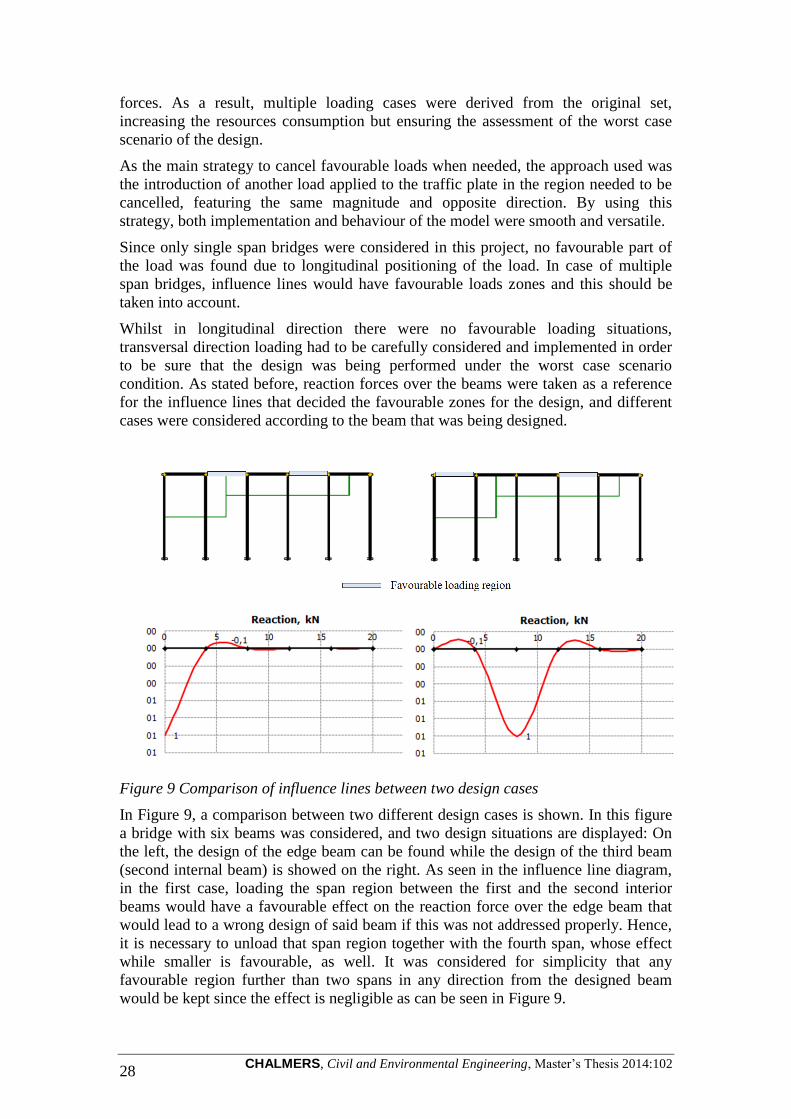
CHALMERS, Civil and Environmental Engineering, Master’s Thesis 2014:102 28
forces. As a result, multiple loading cases were derived from the original set,
increasing the resources consumption but ensuring the assessment of the worst case
scenario of the design.
As the main strategy to cancel favourable loads when needed, the approach used was
the introduction of another load applied to the traffic plate in the region needed to be
cancelled, featuring the same magnitude and opposite direction. By using this
strategy, both implementation and behaviour of the model were smooth and versatile.
Since only single span bridges were considered in this project, no favourable part of
the load was found due to longitudinal positioning of the load. In case of multiple
span bridges, influence lines would have favourable loads zones and this should be
taken into account.
Whilst in longitudinal direction there were no favourable loading situations,
transversal direction loading had to be carefully considered and implemented in order
to be sure that the design was being performed under the worst case scenario
condition. As stated before, reaction forces over the beams were taken as a reference
for the influence lines that decided the favourable zones for the design, and different
cases were considered according to the beam that was being designed.
Figure 9 Comparison of influence lines between two design cases
In Figure 9, a comparison between two different design cases is shown. In this figure
a bridge with six beams was considered, and two design situations are displayed: On
the left, the design of the edge beam can be found while the design of the third beam
(second internal beam) is showed on the right. As seen in the influence line diagram,
in the first case, loading the span region between the first and the second interior
beams would have a favourable effect on the reaction force over the edge beam that
would lead to a wrong design of said beam if this was not addressed properly. Hence,
it is necessary to unload that span region together with the fourth span, whose effect
while smaller is favourable, as well. It was considered for simplicity that any
favourable region further than two spans in any direction from the designed beam
would be kept since the effect is negligible as can be seen in Figure 9.

CHALMERS, Civil and Environmental Engineering, Master’s Thesis 2014:102 29
Regarding the additional resources necessary for the inclusion of favourable
unloading in the design, it is easily noticeable than one single tandem system position
would lead to more than one load case, since the design of each beam demands
unloading different favourable regions in each case. Therefore, the bigger number of
beams included in the design, the bigger number of loading cases that will have to be
taken into account. This will be derived later in this chapter, by showing the relation
between different factors and the total number of load cases to be considered.
5.6.2.3 Management of the different load cases
Once the modelling phase of the traffic load was concluded, the management of raw
data that this implementation generated was considered and optimised. Since the
purpose of having the traffic model implemented in the tool was being able to assess
the worst case scenario regarding traffic conditions, it was necessary to include
different cases that would simulate the different positions of the only element that can
be placed in different positions along the Notional lane: the Tandem system.
According to this, it would be necessary to have the possibility to simulate the bridge
response while it is subjected to different loading conditions, depending on the
positions of tandem systems. However, some limitations coming from Eurocode had
to be taken into account:
For global analysis, Tandem Systems should be assumed to travel centrally
within the notional lanes.
There is only one tandem system per notional lane.
Only complete tandem systems should be considered.
Consequently, the only variation that was considered according to global analysis was
the different positioning of the Tandem System along the lane. Moreover, taking into
account the symmetry of the bridge, only positions between support and middle span
were considered, in order to avoid pointless calculations of mirror cases from both
sides of the bridge.
5.6.2.4 Performance of the loading model
At this stage one limitation that had to be handled arose. By considering too many
different situations of the Tandem System the number of load cases might grow
exponentially, increasing the computational resources required and harming the speed
of the process. It was therefore decided to perform an in-depth study by considering
possible consequences of any assumption taken within this issue as well as keeping in
mind the scope of the methodology.
An important factor considered while implementing the traffic load was the
resolution, i.e. the number of tandem systems in a lane, used for the movement of the
loading combinations. However, it was decided to let the tool to have as much
resolution as possible, giving the designer the possibility to adjust the
accuracy/performance ratio by choosing the appropriate loading alternative for each
situation. Therefore, resolution was defined as a function of the total length of the
bridge, allowing as many tandem systems as possible while keeping a separation of

CHALMERS, Civil and Environmental Engineering, Master’s Thesis 2014:102 30
1.2m between them. This separation was set as threshold because it is the distance
between axles in the tandem system model. According to this, resolution is defined as:
Equation 3 Calculation of Resolution of Traffic Load Model
As stated before, while it was considered essential to be able to simulate and take as
reference the worst case scenario, this should not compromise the performance of the
whole process. It was therefore decided to implement three different sets of car
placements in order to have different alternatives to choose from. By doing this, it was
given to the designer the possibility to control how accurate the simulation should be
depending on the design situation and/or the resources available.
Those three different Tandem System positioning combinations were implemented
taking into account the expected behaviour of the model, in order not to have
combinations that do not give new possibilities to the tool. Every combination was
named as Car Placement followed by a number, from 0 to 2 in order to identify it.
Since these three alternatives were meant to assess the worst cases, some positions
were common for all of them such as parallel tandem systems at mid-span or support
regions. Car Placement 0 (CP0) included every load combination where Tandem
Systems travel parallel from support to mid-span. As can be seen in Figure 10, the
tandem System moves at the same time from the support zone to the span. Although
only six combinations are represented in the figure, this movement is done at its
maximum resolution.
Figure 10 Car placement 0 sketch, showing possible tandem positions travelling
parallel

CHALMERS, Civil and Environmental Engineering, Master’s Thesis 2014:102 31
Afterwards, in order to cover all the existing possibilities, Car Placement 1 (CP1) was
implemented. This alternative included all the possible combinations of the placement
of Tandem Systems, including the parallel ones covered by the first case. As can be
seen in
Figure 11, six random cases are represented to illustrate that there are no predefined
combinations and all of them are taken into account. Moreover, maximum resolution
is used in this case as well. As expected, this is the most accurate alternative but the
most time consuming as well.
Figure 11 Car placement 1 sketch, showing some of the combinations of the tandem
system.
In order to reduce the number of cases to only the most relevant ones, Car placement
2 (CP2) was implemented by only considering the positioning of the Tandem systems
on the regions over the support, the middle span and half way between them. As
illustrated in Figure 12, all the combinations are considered in this car placement, but
the resolution is reduced in order not to increase the time consumption as much as in
the previous case.
Figure 12 Car placement 2 sketch, showing the combinations of the reduced
resolution model.

CHALMERS, Civil and Environmental Engineering, Master’s Thesis 2014:102 32
5.6.2.5 Comparison of Car placement (Performance)
The performance of this module of the tool was a key aspect of the overall
performance of the methodology. The reason was that if the number of different
Tandem System positions considered, together with the number of loading cases
within the same Tandem position and the number of lanes, the total amount of
calculations that would be required for one bridge might be too high. Since this was
not acceptable due to the iterative character of the methodology, an in-depth study of
the different Car Placement options was performed in order to know how accurate
and efficient each strategy was. This is something very important since it is the only
parameter controlled by the designer when it comes to performance of the Traffic
model.
The total number of load cases would be:
Equation 4 - Number of load cases obtained from Traffic Load module
As the number of beams cannot be changed while assessing one alternative, the
correct selection of the Car Placement alternative is a key choice performance wise.
Note that the factor 2 at the beginning of the equation corresponds to the fact that each
case is calculated for ULS and SLS, needed for other implemented modules in the
tool.
In Table 2 the comparison of different deflections, maximum stresses, time and
number of load cases generated for each Car Placement mode is shown.
Table 2 Comparison of Car placement modes
Car placement Max. deflection (m) Max. stress (MPa) Time (s) Number of load cases
CP 0 0,026251657 223,41 433 34
CP 1 0,026251657 223,54 3422 578
CP 2 0,026251657 214,54 365 18
From these values it is easy to conclude that deflection is not affected at all for the Car
Placement choice, which means that maximum deflection will most likely happen
when all the Tandem Systems are placed in the middle span. Regarding Maximum
Stress, CP2 is slightly less accurate than CP0, considering CP1 as the reference since
every different Tandem system combination is taken into account in it. While the
error for taking CP0 is lower than 0.06%, taking CP2 would give around 4% of error.
If time consumption is compared, CP0 takes 18% more time than 2 with an 88% more
of load cases calculated. It was therefore concluded that CP2 was good enough for
preliminary design, while CP0 would be the best alternative for later phases of the
design, when detailed analyses are performed only in previously assessed and filtered

CHALMERS, Civil and Environmental Engineering, Master’s Thesis 2014:102 33
alternatives. CP1 was not considered as a good alternative since the cost of virtually
having no error is too high computationally wise and the other alternatives’ errors
were fairly low. In Figure 13 a very visual comparison of the different alternatives is
shown. As commented before, the huge impact in calculation time that CP1 has is not
worth at all if resources are limited. Even in the case of having a very high amount of
resources available, it would be more suitable to use them in the broadening of the
design space rather than increasing the number of combinations of the traffic load.
Figure 13 Comparison of different Car placement alternatives
Something that is important to consider from this study is that it was performed with a
very fine mesh (ensuring high convergence, so the results are not altered for this
reason). Other conditions pre-established were two notional lanes (the bridge deck
width was lower than 9m) and two beams. By increasing any of these two parameters,
number of load combinations would grow linearly in case of number of beams.
Regarding the number of notional lanes, increasing from two to three notional lanes
would have no impact in CP0, a huge impact in CP1 and a fairly high impact in CP2.
The explanation for this can be extracted from the derivation of nCarplacementcombinations
showed in Equation 5, with Res defined in Equation 3:
Equation 5 Calculation of Car placement combinations for every alternative
In conclusion, a variation in the number of lanes or in the length of the bridge might
vary significantly the ratio accuracy/resources of each alternative, being necessary to
study each case thoroughly. As an example, if it is necessary to analyse a bridge with
a deck wider that 9m (3 notional lanes at least), the number of combinations for CP0
223 433
263 224
3422
263 215 365 263
Maximum stress(MPa)
Time (s) Deflection(mm*10E4)
Car placement 0
Car placement 1
Car placement 2

CHALMERS, Civil and Environmental Engineering, Master’s Thesis 2014:102 34
would remain the same (assuming same length of the bridge), but the number of
combinations for CP2 would grow from 18 to 54, being in this situation more suitable
to use CP0.
5.6.2.6 Limitations
Limitations of the traffic model are mainly the ones included in the Load Model 1
from Eurocode. However, since this tool is meant to be used in pre-design phases,
when global analyses are performed and no local verifications are required, there are
no strong limitations of the traffic model that would restrain its applicability in this
methodology.
5.7 Load combination
Since some modules of the tool and checks were meant to assess the Ultimate Limit
State (ULS) of the bridge e.g. Ultimate Strength, while others were referred to
Serviceability Limit State e.g. Crack Width, all the calculations performed in the
model needed to be extended to both states in order to get proper results for all the
checks performed. Hence, as presented in the previous subchapter, load cases were
doubled and both ULS and SLS design load were obtained as stated in (SS-EN 1990),
with partial combination factors according to Table 3.
Table 3 Load combination partial factors according to (SS-EN 1990)
Design action
ULS SLS (Quasi-permanent)
Permanent
action (γG)
Variable
Action(γS)
Permanent
action(γG)
Variable
Action(γS)
Favourable 1 0 1 0
Unfavourable 1.35 1.5 1 0.3
These factors were introduced in Equation 6 to obtain design loads for both cases.
Equation 6 Load Combination equations according to (SS-EN 1990)
Regarding SLS, as recommended in (Beeby & Narayanan 1995) Quasi-permanent
load was more restrictive than rare load in all the cases for this application. Therefore,
crack width and maximum allowed deflection were checked with this load
combination.

CHALMERS, Civil and Environmental Engineering, Master’s Thesis 2014:102 35
5.8 Functioning of the script
In order to have a clear idea of how the script works and which outputs are taken from
the analysis to be included in the standards’ verifications, in this chapter all the checks
described in Chapter 4 will be linked to their implementation within the script. In case
the same check applies to both concepts, i.e. concrete and composite bridges; that
check will be explained only once. For better understanding of the narrowing process
of the set of alternatives carried out throughout the methodology, besides the
implementation of the different checks, a classification of the different design criteria
is presented according to the following definition:
Must criteria:
A criterion within this class has to be fulfilled for the alternative to be
considered as feasible and reach the set of possible alternatives.
Want criteria:
A criterion within this class does not exclude the bridge alternative of the set
of possible alternatives but weigh it negatively when the selection of the best
alternatives among them is performed.
5.8.1 Dimensional compatibility
For the concrete concept, this dimensional compatibility check meant to verify that
beams did not overlap, e.g. too many beams in a narrow deck. For the composite
bridge, this overlapping issue had to be checked but also that the girder section did not
become zero due to an extreme curvature defined at mid-span. These checks were
assessed at the very beginning of the script, based only on the parameters that had
been introduced for defining the different bridge alternatives, and carried out by
simple geometric and algebraic calculations.
Must criteria:
Overlapping of beams and extreme curvature leading to no web cross section
at mid-span cannot occur.
5.8.2 Ultimate Limit State
5.8.2.1 Sectional Design of concrete beams
According to the concrete bridge concept presented before, the first step in the
sectional design process was to define the effective width of each T-beam. This was
done by simple calculations with the dimensional parameters defining the bridge,
according to Subchapter 4.1.3.
As the bridge was considered a group of concrete T-beams subjected to bending
moment and shear force, the beams could need steel reinforcement in the cases where
the capacity of the concrete was not enough to carry those load effects. This design
was included in the script and it followed strictly the Eurocode rules for designing
concrete structures, Subchapters 4.1.3.1 and 4.1.3.2.
Since the beams are normally not homogeneously reinforced along the span, due to
the variations on shear force and bending moment distributions, they were divided in
the script into different regions, using defined positions as boundaries of these
regions. For each region, the reinforcement was designed according to the maximum

CHALMERS, Civil and Environmental Engineering, Master’s Thesis 2014:102 36
shear force and bending moment within the region, extracted from Free Body Cuts
performed at the section boundaries, no matters if they took place in different
positions along the region. Once the maximum load effects were determined, the
reinforcement of the region was designed in two steps.
First, the amount of reinforcing steel and the layout of the rebars necessary to bear the
maximum bending moment within the region were estimated. Due to the single-span
and simple-supported configuration of the bridge, the T-beams were considered to
carry only positive moments and consequently the rebars for bearing the bending
moment were only needed at the bottom of the beams. Three layers were set as the
maximum number of layers due to buildability limitations. Founded on the principles
of Set-Based Design, different possibilities had to be maintained along the design
process and therefore, different rebar diameters were considered. For each diameter
and for each region, the script estimated the number of rebars that were necessary to
reach enough bending moment capacity, according to the limitation of number of
layers but also by fulfilling spacing, concrete cover or ductility restrictions as stated in
Eurocode, Subchapter 4.1.3.1. If the number of bars for any diameter could not fit
within the width of the beam, the region was defined as not possible to be reinforced.
As a result of this design, for each beam region, the script reports the different suitable
rebar configuration in terms of:
Number of rebars
Rebar diameter
Number of layers
Check for yielding in the least stressed rebar (in order to verify equilibrium
calculations)
Bending moment resistance of the section
Utilisation ratio of the section
Secondly, the script proceeded to estimate, if needed, the separation of the stirrups
which prevents shear failure. In this case, since the diameter of the stirrups is not
widely varied in practice, this parameter was defined as a designer’s choice single
value, being simple to include different diameters though. If the self shear resistance
of the concrete was enough, the script suggested no reinforcement, Subchapter
4.1.3.2. Regarding feasibility reasons of stirrups placement, the minimum separation
of stirrups needed to be limited and also converted into realistic values (a separation
of 103.3mm is not realistic and must be turned to 100mm for instance).
For this case, the shear reinforcement design is defined by:
Stirrups diameter
Separation of stirrups
Shear force resistance of the section
Utilisation ratio of the section
Must criteria:
Every beam can be designed for bending with rebars of the same diameter
regardless the diameter of the other beams.
The separation of stirrups is not lower than 100mm.

CHALMERS, Civil and Environmental Engineering, Master’s Thesis 2014:102 37
Want criteria:
All beams in the bridge can be designed for bending with rebars of the same
diameter.
5.8.2.2 Slab design
In the case of the concrete bridge and as stated in the Subchapter 4.1.4, the deck was
reinforced only with the minimum area of steel required in Eurocode. However, the
composite concept required more attention.
For the transversal reinforcement, the moment to be resisted by the reinforcement and
the regions where the reinforcement is needed on top or bottom of the deck cross
section was determined by assessing the sectional moment diagram of the transversal
moment along a transversal path defined at mid-span of the bridge Figure 14. From
the moment diagram for all load cases in ULS, the maximum positive and maximum
negative moments were defined as design values, as well as the length of the regions
corresponding to positive and negative moments, i.e. region between girders and over
girders respectively. To elaborate, negative moment zones (over the girders) were
reinforced according to the maximum negative moment previously obtained (top
reinforcement), while positive moment regions were reinforced with the
correspondent maximum positive moment value at the bottom. These moment values
were combined with the corresponding torsional moment as stated in Subchapter
4.2.5.1, and the reinforcement area was estimated by means of sectional equilibrium
as for the design of the concrete beams. Remaining areas were designed with the
minimum reinforcement as stated in Eurocode.
Figure 14 Transversal moment (SM2) in MNm at mid-span

CHALMERS, Civil and Environmental Engineering, Master’s Thesis 2014:102 38
Since the composite bridge was fixed at both ends, negative moments were present
close to the support, and hence tensile stress were developed within the concrete slab.
This caused need for reinforcement in longitudinal direction which could have been
neglected in simply supported bridges. Assessing the effect of this negative moment
on the concrete slab was complicated due to the sectional moments in the deck
extracted from ABAQUS do not consider the effect of the girders in the neutral axis
of the cross section, and these girders are the elements carrying manly the bending
moment in longitudinal direction. Therefore the recommendations presented in
Subchapter 4.2.5.1 for longitudinal reinforcement were used. Similar to the design of
the transversal reinforcement, in this case load effects come from a path drawn along
the deck over the most loaded girder, where the membrane forces and their
distribution were taken from Figure 15. The distribution determines the extension of
the deck that has to be reinforced, i.e. the maximum length of the area next to the
support with tensile forces considering all load cases; and the maximum value of that
membrane force combined with the shear membrane force was considered as the force
to be resisted by the longitudinal reinforcement. The area of steel required was
estimated by equilibrium of forces. Zones on top corresponding to compressive
stresses were reinforced with the minimum area of steel from Eurocode. It is
important to note that, as a consequence of the assumption of considering the slab as a
one way slab, bottom reinforcement in the longitudinal direction have minimum area
of steel along its whole length.
Figure 15 Longitudinal membrane forces (SF1) in MN over the most loaded girder
Must criteria:
The area of steel required for carrying moment in transversal or longitudinal
direction cannot exceed the maximum area permitted by Eurocode, as stated in
Subchapter 4.2.5.1.

CHALMERS, Civil and Environmental Engineering, Master’s Thesis 2014:102 39
The slab thickness needs to be thick enough for allowing the development of
enough lever arm for the reinforcement to carry the bending moment or to
place the required reinforcement in height.
5.8.2.3 Stresses in steel
As stated in 4.2.3, the failure of the steel girders due to bending, shear or axial force
was performed by checking that the maximum stress in the girders did not exceed the
design yield stress. This maximum stress was taken as the maximum Von Mises stress
within the girders for all load cases, not considering areas very close to the supports to
avoid singularities due to discrete boundary conditions.
Must criteria:
The maximum stress in the steel girders cannot exceed the design yield stress
of the steel.
5.8.2.4 Buckling
5.8.2.4.1 Lateral torsional buckling during construction
Since the critical moment used in assessing the lateral torsional buckling of steel
girders presented in the Subchapter 4.2.4.1 is meant for prismatic girders, for variable
profiles as the one considered in the case study, the critical moment was estimated for
the most critical sections, i.e. support and mid-span. This was done due to the specific
cross section variability along the span of the case study, and therefore for other case
studies the critical cross sections might be placed in different locations.
This critical moment was calculated by considering the whole cross section of the
girder since during construction, the concrete is still fresh and carries no load.
However, the effect on the bending moment of the concrete self-weight needs to be
considered. This moment was taken as the maximum moment along the most loaded
girder considering the corresponding part of the deck carried by that girder, and was
estimated by using Free Body Cuts along the bridge length.
Want criteria:
The maximum bending moment in the most loaded girder cannot exceed the
critical moment for torsional buckling calculated in the most critical section of
that girder, otherwise stiffeners or additional support during construction
might be needed.
5.8.2.4.2 Lateral torsional buckling under traffic load
As described in Subchapter 4.2.4.2, for assessing the lateral torsional buckling under
traffic load, when the concrete deck restricts the upper flange, the simplified method
from Eurocode which considers only the lower flange in compression was used. Most
of the parameters required for the verification of this check came from Eurocode itself
or from geometrical properties of the cross section. Nevertheless, the maximum
moment within the part where the lower flange is in compression and the length of
that part were extracted from the Finite Element Analysis.
For the length of the lower flange in compression, the maximum length of the lower
flange in compression for all load cases was extracted by assessing the longitudinal
stress distribution along a path that followed the flange profile Figure 16. The

CHALMERS, Civil and Environmental Engineering, Master’s Thesis 2014:102 40
maximum moment was taken from the maximum bending moment along the specified
length by means of using Free Body Cuts.
Figure 16 Length of the lower flange prone to Lateral Torsional Buckling. Stress in
MPa.
Once both parameters were calculated, i.e. length of the lower flange in compression
and maximum bending moment within that length; the length obtained had to be
compared with the critical length estimated by following the Eurocode calculations.
It needs to be mentioned that for the sake of simplicity and for considering a scenario
close to the worst one, i.e. class 4, the cross section of the web was always considered
in class 3, and an approximate moment resistance was estimated based on the plastic
moment resistance of the section reduced by considering an effective web in the part
of the web in compression below the plastic neutral axis.
Want criteria:
The maximum length of the flange in compression cannot exceed the critical
length as stated in the simplified method for assessing lateral torsional
buckling in Eurocode, otherwise stiffeners might be needed.
5.8.2.4.3 Shear buckling
As described before for assessing the lateral torsional buckling capacity of the steel
girders during the construction phase, the shear buckling resistance of the girder was
also checked at the most critical sections of the girder due to the variable section of
the girder. Since the most critical parameter in shear buckling is the slenderness of the
web, the highest and thinnest sections were considered, i.e. support section and
section where the web becomes thinner due to the design criteria of the girder profile.

CHALMERS, Civil and Environmental Engineering, Master’s Thesis 2014:102 41
In these sections, the geometrical parameters were extracted directly, and the bending
moment and shear force were extracted from the analysis by Free Body Cuts. All
these parameters were then used to verify the shear buckling capacity of the girder
according to Subchapter 4.2.4.3.
Want criteria:
The maximum shear force in the girders cannot exceed the shear buckling
capacity of the most critical section otherwise stiffeners might be needed.
5.8.3 Serviceability Limit State
5.8.3.1 Deflection
In both bridge concepts the deflection was measured as the maximum vertical
displacement for all load cases in SLS searched within the whole model. This value
was then compared with the standard limitation and characterised the bridge as
feasible or not. Among the different load combination factors in SLS discussed in
Eurocode, the quasi-permanent combination of loads was selected in maximum
deflection verification for being the one often recommended (Beeby & Narayanan
1995).
Must criteria:
The deflection cannot exceed the standards’ limitation.
5.8.3.2 Crack width
For solving the equations presented in the Subchapter 4.1.5, two different variables
were needed from the analysis in order to estimate the maximum crack width. On one
hand the stress in the tension reinforcement assuming a cracked section which was
determined through the stress produced at reinforcement level by the maximum
bending moment in SLS, calculated by means of a Free Body Cut.
On the other hand, the area of longitudinal reinforcement was directly taken from the
previously performed reinforcement design.
Must criteria:
The crack width cannot exceed the standards’ limitation.
CHALMERS, Civil and Environmental Engineering, Master’s Thesis 2014:102 42
5.9 Output data
After all the verifications are done, in order to sort and seek for the optimal
alternative, the script has to be able to extract all necessary data. First, the script
generally discards all the alternatives with at least one Must Criterion not fulfilled and
it does not consider them in the set of possible alternatives. However in case the cause
of discarding alternatives wants to be assessed, the script can be set up for keeping the
discarded alternatives, indicating all the criteria were not met.
The type of data from the script that is stored can be classified into different
categories:
TAG of the bridge: this parameter defines a single alternative and can be used
for tracking all data related to it. It can be seen as an identification number of
the bridge.
Input data: these parameters describe the alternative dimensionally, e.g.
number of beams, deck thickness or length of the bridge. They are set
beforehand through parameter ranges and picked randomly to build up each
alternative. These parameters are important for estimating the material
amount or cost of an alternative.
Load effects: they include all the load effects considered in the design and
verification of every alternative and can be used for checking the results, e.g.
bending moments, shear forces, stresses or deflection.
Reinforcement design data: these data correspond to those parameters used in
the design of the reinforcement. Some of them are specified by the designer,
e.g. the regions where different reinforcement can be placed or the stirrups
diameter; and some others are the result of the reinforcement design itself,
e.g. number of layers of bending reinforcement or stirrups separation.
Checks data: in this group the parameters regarding the verification of some
of the standards’ requirements can be found. Most of them are numerical
values, e.g. crack width, ductility or lateral torsional buckling resistance;
whilst others describe whether the checks have been fulfilled or not.

CHALMERS, Civil and Environmental Engineering, Master’s Thesis 2014:102 43
5.10 Script Performance Optimisation
5.10.1 Convergence study
As every time that a Finite Element Analysis calculation is performed, a convergence
study of the mesh size needs to be carried out in order to define the lowest amount of
elements that led to acceptable results. For the assessment of the obtained results,
deflection and stresses were taken into account due to their different degree of
convergence. This is because convergence of displacements will always be one order
higher than convergence of stresses as they are proportional to strains (Ottosen &
Petersson 1992). Depending on the type of element chosen, convergence rates will be
higher or lower, but they will always keep the aforementioned relation.
As a consequence, both models were probed regarding stresses and displacements at
different element sizes, in order to estimate the optimal point where accuracy and
performance would meet. It is important to note that the objective of the convergence
study was both ensuring convergence of stresses and displacements and deciding a
mesh element size that would give good enough results without excessively harming
the performance.
As it can be seen in Figure 17, displacements converged fast enough for an acceptable
mesh density regarding time/resources consumption, and faster than stresses as
expected.
Figure 17 Convergence study of concrete bridge (Displacements)
As it can be seen in Figure 18, stresses presented a convergent behaviour as well, but
not as stable as displacements did. Convergence of both fields was a key aspect of the
-15,15
-15,1
-15,05
-15
-14,95
-14,9
-14,85
-14,8
0 10000 20000 30000 40000 50000 60000
Max
imu
m d
efl
ect
ion
(m
m)
Number of elements

CHALMERS, Civil and Environmental Engineering, Master’s Thesis 2014:102 44
project since performing large number of analyses requires much computational time
and hence the maximum element size that provides good estimations is desired.
Once both stresses and displacements were checked regarding their convergence, it
was time to decide how fine the mesh should be to keep both the smoothness of the
process and its accuracy. Taking as “exact” values those obtained with the highest
number of elements that the available resources allowed, the element size selected
gave as a result stresses with 3.88% of error and displacement with 0.2%. This was
considered acceptable for a predesign phase, and allowed to keep the process as
smooth as necessary for an iterative approach.
Figure 18 Convergence study of concrete bridge (Stresses)
Although the showed values correspond to the concrete model, the same procedure
was followed for the composite bridge and similar results were obtained.
8
8,2
8,4
8,6
8,8
9
9,2
9,4
0 10000 20000 30000 40000 50000 60000
Max
imu
m s
tre
ss-m
ise
s (M
Pa)
Number of elements

CHALMERS, Civil and Environmental Engineering, Master’s Thesis 2014:102 45
5.10.2 Parallelisation of the analysis
Parallelisation was an important aspect of the computational part of the project, since
the tool was intended to submit a huge amount of calculations that could not be
performed in a reasonable time span without any kind of parallelisation. Provided that
the computational power comes from Chalmers cluster, it was needed to prepare the
script for the use of its whole computational capacity.
Despite the fact that ABAQUS has some strategies implemented to parallelise
routines and perform analyses faster, they are more oriented to large single analyses
(usually very complex) that require huge amount of power. On the other hand, the tool
made for this project was based on a sequential queue of not so large analyses, so it
was not possible to take full advantage of the power available. Therefore, some
modifications were made in order to exploit the computational power provided by the
cluster. In Figure 19 and Figure 20 it is possible to see the difference between
sequential way of running the script, and the parallel way of doing the same.
Figure 19 Sequential running of the job
Since ABAQUS has some multithreading features available for its jobs, every
analysis included in the loop (rectangles in the figures) has some kind of
parallelisation capabilities (more than one core is used for every single analysis).
Anyway, it was necessary to finish the analysis in order to begin the next one. This
was the reason that made the process so slow so it was therefore decided to address
this issue in other different way.
Even if a whole computing cluster is available for use, it would be useless to spend its
resources in parallelising every analysis one by one, since the performance gain would
be marginal. It seemed more appropriate to find a way to submit parts of the original
job as separate jobs, in order to be able to use the computational power as efficiently
as possible.
By using the parallel running strategy, time consumption of the job was reduced
proportionally to the number of jobs submitted, resulting in a huge save of calculation
time.

CHALMERS, Civil and Environmental Engineering, Master’s Thesis 2014:102 46
Figure 20 Parallel running of the job
In order to be able to take advantage of this, it was needed to modify the input and
output flow of data. Instead of having a multiple nested loops that generated the
geometry and analysed the model for each variable combination, all of them were
considered, tagged and stored into a list. By doing this, it was possible to have a
variable containing every value of the parameters from each bridge and its
identification for further processes. This list could be divided afterwards in as many
parts as desired by the user (number of jobs) and an analysis file was automatically
created for each part.
By running every single analysis job, it was possible to get the same output as the
sequential alternative only by performing some minor modifications on the data
processing. This was achieved by putting all the outputs together so they were
available to be processed in the same way as if they were obtained from a sequential
job. It is easy to understand that merging a huge amount of data might be problematic
if it is not done carefully, and some problems might appear in later phases i.e.
optimisation phase. It is important to note that the output of the process is the same as
if it had been performed with the sequential approach, but much faster.
It was essential that every combination of parameters submitted, analysed and stored
was identified in order to point at it if necessary. This was done by means of the tag
attribute included both in the input and output phase. By using it, it was possible to
identify the exact characteristics of the bridge, a very important feature for the
optimisation process.

CHALMERS, Civil and Environmental Engineering, Master’s Thesis 2014:102 47
Figure 21 Overall process of the algorithm
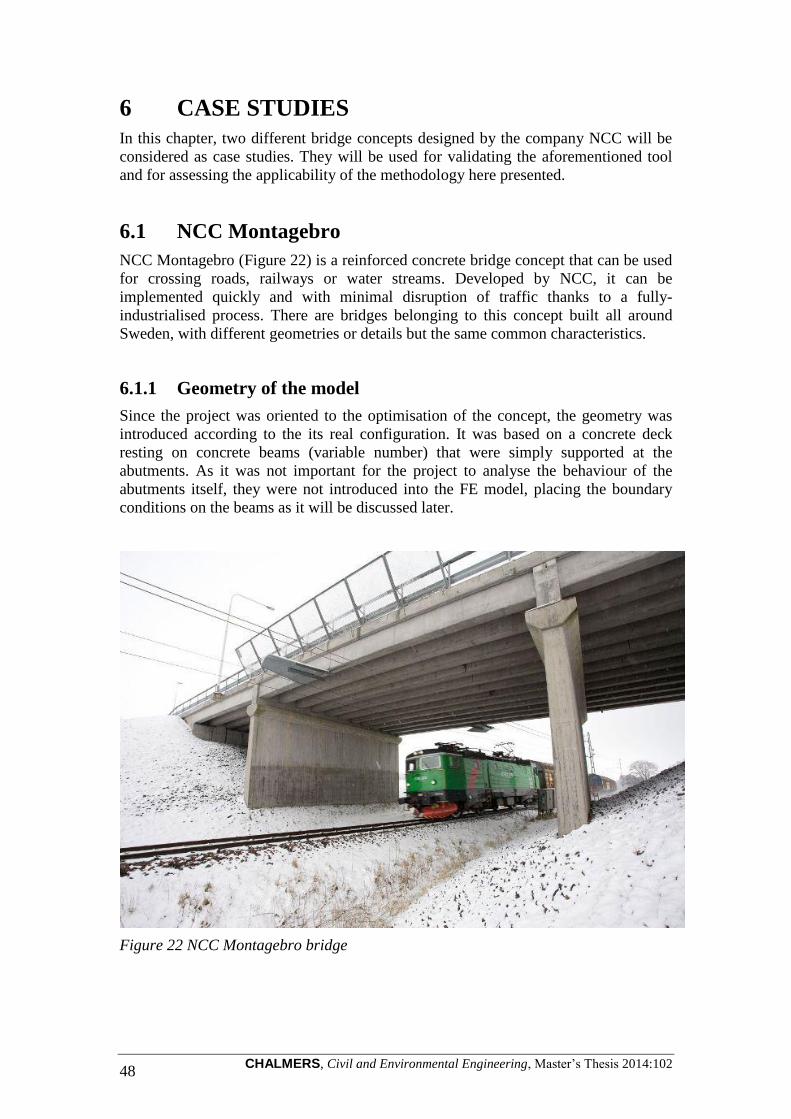
CHALMERS, Civil and Environmental Engineering, Master’s Thesis 2014:102 48
6 CASE STUDIES
In this chapter, two different bridge concepts designed by the company NCC will be
considered as case studies. They will be used for validating the aforementioned tool
and for assessing the applicability of the methodology here presented.
6.1 NCC Montagebro
NCC Montagebro (Figure 22) is a reinforced concrete bridge concept that can be used
for crossing roads, railways or water streams. Developed by NCC, it can be
implemented quickly and with minimal disruption of traffic thanks to a fully-
industrialised process. There are bridges belonging to this concept built all around
Sweden, with different geometries or details but the same common characteristics.
6.1.1 Geometry of the model
Since the project was oriented to the optimisation of the concept, the geometry was
introduced according to the its real configuration. It was based on a concrete deck
resting on concrete beams (variable number) that were simply supported at the
abutments. As it was not important for the project to analyse the behaviour of the
abutments itself, they were not introduced into the FE model, placing the boundary
conditions on the beams as it will be discussed later.
Figure 22 NCC Montagebro bridge

CHALMERS, Civil and Environmental Engineering, Master’s Thesis 2014:102 49
The modelling of the deck was decided to be carried out with shell elements since that
part of the structure is a slab, which can be very accurately represented by shell
elements just by establishing the thickness of the plate and the offset direction in
which the thickness of the plate is generated from the base element. The latter aspect
was very important, since the implementation of the regular offset from the middle
section created some distortion on the results due to material overlapping from beams
and deck.
For the modelling of the beams, shell elements were considered as well. Although
theoretically, it could have been possible to use beam elements due to obvious
similarities with the structural element, a good definition of a shell could also be used
to represent beam behaviour. Additionally, since full interaction between beams and
deck was considered due to the nature of the joint (casted concrete joint), it was more
suitable to model the whole bridge out of shell elements, for avoiding problems in
assembling different types of elements. The number of integration points along the
thickness of the shell elements was set to five according to the recommended value
for the integration method chosen, i.e. Simpson.
It might be argued whether solid elements should have been considered, but since the
purpose of the project was the assessment of the bridge as a structure, and not a
detailed study of some structural components, they were discarded. Using solid
elements would have dramatically increased the calculation time, without reporting
any significant advantage within the scope of this project. Since this model is
implemented in a loop that will repeat similar runs sequentially, the analysis time was
considered one important aspect for the modelling of the bridge, as increasing the
time for one single run would have a large impact in the total computational time.
6.1.2 Parameterisation
The parameterisation of the bridge was based on considering the possibility of
simulating a huge amount of different bridges with different dimensional parameters.
Figure 23 Definition of parameters affecting Separations of beams
While some of the parameters were common to the whole set of bridges, such as the
length or the width of the bridge, another group of them were iteratively changed to
generate new bridge alternatives to be assessed. This was the case of the number of

CHALMERS, Civil and Environmental Engineering, Master’s Thesis 2014:102 50
beams, cross-sectional properties of the beams (height and width), thickness of the
slab and cantilever distance. The latter was introduced to give more possibilities to the
design but the original concept does not include this possibility, having edge beams at
the end of the slab at both sides.
Some other important parameters were derived from the aforementioned ones. This
was the case of the separation of the beams, which was depending on the width of the
bridge, the width of the beams, the cantilevering distance and obviously the number of
beams. It is defined as:
Equation 7 Separation of beams derivation
6.1.3 Mesh properties
Meshing of the FE model resulted to be very important both for the accuracy and
validity of the results as well as for the proper functioning of the script itself.
As described in Subchapter 5.10.1, the mesh density was important to have not too
big elements that might compromise the integrity or accuracy of the obtained results.
At the same time it was not acceptable to use too small elements since the
computational time would be increased dramatically.
Figure 24 Mesh of the model with quadrilateral elements (S4R)
Regarding the element type, it was decided to use quadrilateral elements since it was a
suitable shape according to the bridge geometry. As it can be seen in Figure 24, the
different parts configuring the bridge have right angles that make quadrilateral

CHALMERS, Civil and Environmental Engineering, Master’s Thesis 2014:102 51
elements to fit perfectly along the model. Additionally, although it might lead to
slightly stiffer behaviour than reality, reduced integration was chosen to save
computational resources. As a result, S4R elements were used in the ABAQUS
model, which are known to be suitable for general purpose analyses.
6.1.4 Boundary conditions
One important aspect of every Finite Element simulation is the definition of proper
boundary conditions for the model. This will be essential to determine how close the
model is to reality for relying on its results.
Boundary conditions were carefully analysed and established as fixed points on the
beam supports. This was decided by paying attention to the configuration of the
concept bridge, where the beams are supported by the abutment on both sides. At the
beginning it was considered to introduce a beam element to represent the abutment,
but it was discarded in favour of a simpler way of restraining the geometry since the
structural behaviour resulted to provide no relevant additional information. Therefore,
the introduction of beam elements for this purpose would not improve the results
while it would increase slightly the computational load of the model, making this
modelling choice not optimal.
Figure 25 Comparison between the model with beam element and the simpler model
These boundary conditions simulate a simply supported condition of the bridge,
which is coherent while the number of spans is restricted to one. If more spans were
considered, continuous beam conditions might be introduced and boundary conditions
would change. However, this was outside the scope of the project.

CHALMERS, Civil and Environmental Engineering, Master’s Thesis 2014:102 52
6.2 NCC Nynäshamn
The case of study of the composite bridge was based on a bridge already built in
Nynäshamn, Sweden. Although it was the only one built according to this design (or
similar) by the date of writing, it might be the intention of the company to use the
design to develop a concept that could fit in other locations as happened with NCC
Montagebro.
6.2.1 Geometry of the model
The geometry of the second bridge assessed in this project was fairly different from
the previous one. Instead of having a high density of beams supporting a concrete
deck, in this case the bridge had a limited number of beams (two or three) supporting
a concrete slab. Another main difference was regarding materials. While NCC
Montagebro was completely built of concrete, this concept included stainless steel
girders, introducing an innovative construction material that allows having virtually
no maintenance. Both the geometrical and material differences gave as a consequence
a different structural response of the bridge that led to different design approaches and
assumptions as it can be read in Chapter 4. One example of this was the different
approach used for the design of the slab, as commented previously.
Figure 26 Nynäshamn Bridge
The modelling of the bridge was decided to be carried out with shell elements for
similar reasons discussed for the previous concept. Moreover, shell elements fitted
even better for the design of the I-profiled girders. Similar strategies as commented in
the previous concept bridge were used for the overlapping issues between the deck
and the top flange of the beams, i.e. offset of shell thickness.
In order to be able to solve the merging between the deck and the beams, it was
necessary this time to use a Tie function from ABAQUS because of the different
properties (material) of the girders and the slab. Anyway, full interaction was assumed
between concrete and steel for simplicity and building aspects of the joint.
It is important to point out that this model was significantly more complex
(geometrically speaking) that the previous one, mainly because of the girders
geometry. Its varying section over the length (provided by an arch shape of the lower

CHALMERS, Civil and Environmental Engineering, Master’s Thesis 2014:102 53
flange) required extra work both during the implementation of the geometry and the
data extraction of the curved surfaces of the beam.
Figure 27 FE model geometry of the Nynäshamn bridge
6.2.2 Parameterisation
Due to the complex design of the girders included in the concept, parameterisation of
this bridge was a major issue of this project. As it can be seen in Figure 28, the beams
have three different regions in the top flange, three different regions in the web and
five different regions in the lower flange. By different regions it is meant that there
are different parts of the girder with different thicknesses or widths, i.e. flanges and
web. The combination of all of these characteristics, together with thickness of the
slab, the height of the girders, their curvature, position and the number of girders
provided up to 18 parameters that were possible to be varied to get different
alternatives within the concept presented.
Figure 28 Different regions of the parameterisation of the girders
In order to be able to easily iterate over all the parameters described before, and reach
every combination possible within the concept, it was necessary to define very
carefully the different parameters that would describe the beam configuration.
By simple observation of the documentation provided by NCC, it was observed that
the distribution of the different zones was arranged symmetrically over the length of

CHALMERS, Civil and Environmental Engineering, Master’s Thesis 2014:102 54
the bridge, as it would be expected. This meant that, for example, first and third upper
flange regions had exactly the same length, width and thickness, reducing the number
of necessary variables for the parameterization. Moreover, the lower flange was
designed with its three central regions having the same characteristics. As a
consequence, a parameterization based on central entities and side entities was
performed.
Central entities were the regions of the upper flange, the lower flange and the web that
were not in contact with any end of the girder. Therefore, there was one central region
in the upper flange, three central regions in the lower flange and one central web
region. Side regions were defined as the opposite, completing all the regions
constituting the beam.
Once this parameterisation was done, it was simple to effectively assign width and
thickness to all the entities in the beam giving the possibility of design fairly complex
girder geometries. On the other hand, a big limitation arose at this point: length of the
different regions described in Figure 28.
The main issue about the length was that, while it was something that should be
possible to be changed when creating new bridge alternatives, it had to be changed
according to the limitations explained before (same size of some regions).
Additionally, the length of the regions had to be derived in some way from the length
of the bridge, keeping its symmetric definition. Therefore, the parameter controlling
that issue was decided to be a factor between 0 and 1 that would establish the portion
of the length defining the side region of the girder (one different factor for each flange
and the web). The definition of these parameters l can be checked in Figure 29. It is
important to note that by using the symmetric design of the girder, it is possible to
derive the length of every region only with the l factor of the entity and the total
length of the beam, as shown in Figure 29.
Figure 29 Definition of the length of the entity regions

CHALMERS, Civil and Environmental Engineering, Master’s Thesis 2014:102 55
Figure 30 Examples of the definition of three different entities
Parameterisation of the girder was therefore performed in a way that only by using
three different parameters (excluding the total length) it was possible to define the
properties of each entity included in the beam. These properties were the thickness of
the entity (t), the width (w) and the length of the region (defined by a factor l). Some
examples are shown in Figure 30, where the properties of the side region of the upper
flange, the side region of the lower flange and the central region of the web are
derived from the available parameters.
Once the distributions of the different regions of the girders and their properties were
established, the only remaining parameters to define the whole beam were the height
of the girder and the curvature. The latter was defined by the circumference built from
three different points, being two of them the end points of the girder and the central
one the lower part of the girder in the central section (where the beam cross section is
smaller, as seen in Figure 31). The purpose of adding the variable hcurv, was giving the
tool the possibility of varying the curvature of the beam only by changing the value of
that distance. It is easy to understand that changing hcurv as defined in Figure 31, one
of three points defining the arch will change (as the other two are fixed) and therefore
the curvature will change proportionally.
Figure 31 Beam curvature definition
To finish with the parameterisation, at this point the full parameterisation of the beam
was performed. The only remaining parameters that characterised the whole bridge
were the number of girders, the width of the slab and the position of the girders,
defined by the cantilevering distance (as seen in Figure 32).

CHALMERS, Civil and Environmental Engineering, Master’s Thesis 2014:102 56
Figure 32 - Definition of cantilevering distance and separation beams
It is important to note that cantilevering distance is measured from the end of the slab
to the widest top flange, while separation of beams will be defined as the distance
from web to web. Anyway, separation of beams is not necessary to be introduced
since it can be derived from other parameters as seen in Equation 8, taking advantage
of the symmetry conditions that were previously used in the longitudinal definition of
the beam parameters.
Equation 8 Separation of beams derivation for composite bridge
It is important to note in Equation 8 that the term named is
defined as the largest flange width of the beam, considering that width as the width of
the whole beam.
6.2.3 Mesh properties
As described in the previous concept, meshing of the model was a key aspect to
ensure both valid results and a good ratio between accuracy and resources
consumption. A similar convergence study to the one shown in Subchapter 5.10.1 was
carried out to confirm that convergence of results was happening and determining the
optimal mesh density for the process.
As in the concrete concept bridge, the element type was decided to be quadrilateral
elements for the same reasons. Moreover, reduced integration was also chosen to save
computational resources, as happened previously for the concrete model. Same
general purpose elements were used for the analysis, as said in the previous
subchapter, S4R elements.

CHALMERS, Civil and Environmental Engineering, Master’s Thesis 2014:102 57
6.2.4 Boundary conditions
As stated before, boundary conditions were a really important aspect of the model to
be able to reproduce in the FEM the real behaviour of the bridge.
In this case, the real bridge had its girders anchored with a connection as shown in
Figure 33, and concrete was afterwards casted around the connection to ensure no
movement of the fixed end. Therefore, the FEM boundary conditions that were
imposed were fixed conditions in both sides.
Figure 33 Anchorage of the steel beams (NCC Construction, Brodag 2011)
In order to establish the fixed conditions in the model, the whole web was fixed in
both ends. It was investigated the effect of fixing the flanges as well, but similar
results were obtained. The detail of the connection in the FE model is shown in Figure
34.
Figure 34 Fixed boundary conditions in FEM composite bridge model

CHALMERS, Civil and Environmental Engineering, Master’s Thesis 2014:102 58
7 OPTIMISATION
7.1 General Information
As presented in Subchapter 5.9, Output data, as a result of the iterative analysis
process, large amounts of data are extracted, regarding among others the parameters
defining the dimensions of every bridge alternative and its reinforcement design.
These two categories are indispensable for estimating the material amount required
for building an alternative, and hence, most of the main characteristics defining the
performance of a bridge, i.e. material cost, environmental impact, construction cost
and expected maintenance.
The methodology described in this thesis could take advantage of advanced
optimisation techniques for developing its full potential. Nevertheless, it is outside the
scope of this project the assessment and use of these advanced techniques and a
simple multi-objective optimisation was carried out in order to find optimal solutions
within the set of possible alternatives.
Two main reasons motivated the selection of a set of optimal alternatives rather than a
single alternative in this specific methodology, besides its relation with the Set-Based
Design approach. First, as the tool was developed for pre-design, it might happen that
the optimal alternative does not fulfil one of the requirements checked during the
performance of the final full analysis, and therefore the alternative chosen in pre-
design would not be optimal and rework would be needed. On the other hand,
optimising regarding multiple criteria needs the opinion of multiple stakeholders and
therefore, letting the persons in charge of taking the final decision choosing between a
set of optimal alternatives makes the process more transparent.
7.2 Optimisation Criteria
Due to the lack of more information regarding bridge performance estimation, only
two criteria were used in order to select the set of optimal alternatives, i.e. material
cost and CO2 equivalent of the required material amount. These two parameters are
only based on material amount and follow similar proportions regarding different
materials, and hence, their combination gives no much more information than only
considering one of them. However, they were used in order to show a hint of the
potential of combining multi-criteria optimisation with the methodology here
presented.
7.2.1 Material Cost
Due to manufacturing issues related with the benefits of design homogeneity, in the
composite bridge all girders were equal. The material cost was defined as the sum of
the individual cost of the different elements, i.e. stainless steel girders, concrete deck
and reinforcing steel.
On the other hand, manufacturing prefabricated concrete beams is more adaptable for
considering different reinforcement configuration within the beam itself but also
between different beams. The former leads to the possibility of designing different
regions of a beam to adapt to the bending moment and shear force distributions, which
was implemented within the script by selecting these regions boundaries, and the
latter was considered by adding no restriction of the number of different beams that
could be used in a bridge in order to adjust the capacity of the individual beams to

CHALMERS, Civil and Environmental Engineering, Master’s Thesis 2014:102 59
their needs. In the present work, neither limitation about the maximum number of
different beams nor more than three regions were considered, although it could be
modified by the designer. Another aspect to consider when designing reinforcement is
the rebars diameter, which in this occasion was forced to not be changed within the
bridge as it was considered an important factor for reducing secondary costs. Due to
the reinforcing of the different regions, the estimation of the material cost of a
concrete bridge alternative can be better explained as follow:
The different regions of the different beams for different diameters are
analysed and tagged as feasible or unfeasible regions.
If all the regions of a bridge are considered feasible for a certain rebar
diameter, the bridge is considered as feasible, and its material cost estimated
as the sum of the individual costs of concrete, reinforcement of the beams
and reinforcement of the deck.
Otherwise, if there is at least one region missing for completing the whole
bridge by using the same diameter in all the beams, the bridge is discarded.
7.2.2 CO2 Equivalent
One way of estimating the environmental impact of a certain structure is through its
CO2 equivalent. This concept is difficulty assessed due to the large amount of
different parameters involved in the environmental impact of a construction, e.g.
energy consumption for extracting the raw material, energy consumption for
producing the material, energy consumption for transporting the goods and so on. In
this project, a simplified CO2 equivalent considering only extraction, production and
manufacturing issues of the different materials was used, and the total CO2 equivalent
of a bridge was simply estimated as the sum of the CO2 equivalent of the different
material amounts.
7.3 Optimisation Implementation
Different ways of implementing multi-criteria analysis of results are available,
although for the sake of simplicity, the Weighted Sum Model (WSM)(Fishburn 1967)
was used as first approach. This method consists on assigning different degrees of
importance to the different criteria by applying weights, and defining the equivalent
importance of an alternative as the sum of the criteria multiplied by these weights.
The main drawback of this method is the selection of the weights, which is
recommended to be made by consensus of the different stakeholders and by means of
ranking techniques such as direct weighting method, swing weighting method or the
hierarchy method.
In order to consider cases where the stakeholders have very different priorities
regarding bridge performance, three different scenarios were presented an assessed
according to the direct weighting method:
90% Material Cost – 10% C02 equivalent. Even if extreme, it can be seen as
the classical approach from industry.
10% Material Cost – 90% C02 equivalent. Since the concept environmentally-
friendly is getting continuously more importance in practice, this could show
the tendency.
50% Material Cost – 50% C02 equivalent. This situation corresponds to a
balanced criteria importance.

CHALMERS, Civil and Environmental Engineering, Master’s Thesis 2014:102 60
8 OTHER APPLICATIONS
Besides the main application of this tool discussed in this project, i.e. bridge selection
and suitability assessment, other possible applications for this tool, both in the field of
Civil Engineering and others, can be identified.
8.1 Parametric study
One possible application of the tool would be the easy and automatic performance of
parametric studies. As the development of a concept bridge in the tool includes the
complete parameterisation of the concept, all of these parameters could be easily
adjusted to create a loop that iterates throughout a whole set of values for a parameter
or group of parameters. For example, it is easy to set up an automatic simulation that
could analyse and assess the same bridge for different number of beams, getting as a
result the structural response of all the alternatives included. By doing this type of
study, it is easier for the designer to make decisions about a specific parameters or
characteristics of the structure even before having the preliminary design.
This possibility could be also used for the refurbishment or reparation of old
structures, trying different parameter combinations at the same time and being able to
make a decision of how to repair the structure. This would give more possibilities to
the engineer, having other possibilities different from just restoring the structure to its
initial characteristics.
8.2 Applications in other fields
As it was commented at the beginning of this report, Set-Based Design methodology
was initially developed completely out of the Civil Engineering industry, and it was
first commercially applied by Toyota, working in the automotive industry. Since the
purpose of this project was finding the way to introduce principles of Set-Based
Design into Civil and Structural Engineering field, it is possible to be applied in some
other industries as well. In this project, bridges were the study cases, but while
keeping the principles of the methodology, including the FEA part and major modules
of the tool, it should be possible to be easily ported to any kind of mechanical design.
As long as there is something to optimise, some criteria to do it (Price, time, etc.) and
a way to analyse the behaviour of the study case (FEM, CFD, etc.), Set-Based Design
would be possible to be introduced.
It would important to remember that this methodology is useful mainly for the
predesign phase, so it would be more beneficial to be applied in cases or fields where
this phase is not necessary to be extremely detailed. Otherwise, performing an
iterative analysis of alternatives would take too long and would make the approach
less suitable.

CHALMERS, Civil and Environmental Engineering, Master’s Thesis 2014:102 61
9 RESULTS AND DISCUSSION
In this chapter the results are presented together with their discussion for a better
understanding of the methodology outputs.
9.1 Comparison with real cases
Generally speaking, this methodology should produce valid results because it is not in
any case trying to replace or substitute the detailed analysis performed to get final
results. The aim is narrowing down the solution space by applying different criteria
and doing a detailed evaluation of the final set. It is therefore not probable to get
worse results than the ones obtained from traditional design, since the last step of the
process i.e. detailed analysis, is exactly the same. Moreover, same requirements and
quality controls are applied there. It is then only a better way to reach the same point,
and very suitable for concepts that are built several times. Additionally, since this
methodology introduces the preference and requirements of all the stakeholders, it is
very probable that the final solution would be more satisfying for them than the one
obtained from the classic approach.
9.1.1 NCC Montagebro
In order to assess how accurate were the results produced by the tool, dimensions of a
real bridge already built were introduced and results were compared with the bridge
documentation.
The comparison of the model with a real case was done in two different steps. First, it
was expected that the tool would consider as valid the introduced alternative, since it
was known to be feasible because it was already built. Nevertheless, although this was
considered a promising result, it was considered not to be enough for a successful
comparison.
It was then decided to use the reinforcement design implemented in the tool to try to
check the validity of the results produced by the script, according to the regions where
different reinforcements were designed.
Two real bridges were used for the comparison between the results from the model
and real cases. Both bridges were initially designed according to NCC Montagebro
bridge concept, so their predesign was supposed to be successfully compared with the
designed tool. In order to get more realistic results, only the design of one internal
beam and one edge beam was allowed, to match the real construction requirement.
This is done because while conceptual optimisation would lead to one specific design
for each beam of the bridge, it is afterwards more expensive to build that design in
reality than designing only one or two types of beams.
After checking the documentation of the bridges, and introducing their geometrical
values in the tool, the reinforcement designs that were obtained were the ones shown
in Table 4 and Table 5.

CHALMERS, Civil and Environmental Engineering, Master’s Thesis 2014:102 62
Table 4 Comparison of the model with Örebro bridge

CHALMERS, Civil and Environmental Engineering, Master’s Thesis 2014:102 63
Table 5 Comparison of the model with Väg 50 bridge
As it can be seen in Table 4 and Table 5, the comparison is good enough to consider
the model suitable to be used for preliminary design. Bearing in mind that the results
estimated by the tool, preliminary design values, were compared directly with the real
bridge final design, figures can be considered close enough. This is because the final
design was expected to have some important influences from issues considered in the
final (and detailed) analysis but not in pre-design. Anyway, there are no remarkable
disagreements that could suggest that the pre-design results are unreliable. The
biggest deviation from the predesign and the final model was two rebars, while
stirrups separation was usually the same or very close.
It is important to explain here that the script was allowed only to use spacing of the
shear reinforcement in multiples of 100 millimetres. Therefore, 150 millimetres
separation was not an expected value from the predesign algorithm. Moreover, the
tool was prepared to avoid shear reinforcement if concrete capacity was estimated to
be enough, displaying “NO STIRRUPS” as a result in mid-span region in Table 4,
where shear force is prone to be low due to its distance to the supports.

CHALMERS, Civil and Environmental Engineering, Master’s Thesis 2014:102 64
9.1.2 NCC Nynäshamn
As described in Subchapter 9.1.1, comparison of the concrete bridge model was based
on two different sources. Firstly, it was checked that the bridge was considered as
feasible according to the criteria considered. Secondly, the reinforcement design
produced by the tool was compared with the real reinforcement design of the bridge,
extracted from the actual bridge documentation.
In the case of this concept, the first comparison was possible to be performed, since a
similar strategy to discard possible bridges is followed. On the other hand, the second
verification was impossible to be done, since there is no beam reinforcement design in
this bridge concept.
While seeking for other ways to show some comparisons of the models with reality,
some interesting results were discovered in the parametric study of the bridge. Some
of the parameters showed stabilization after a critical value was reached. That means
that some parameters were increasing the bridge capacity up to a certain value, and
oversizing the parameter further gave almost no benefit for the structural capacity.
This behaviour was found in some parts of the bridge, such as the flanges (both upper
and lower).
Figure 35 Parametric study of the thickness of the lower central flange (Maximum
stress)
180
230
280
330
380
430
0 0,02 0,04 0,06 0,08
Max
imu
m s
tre
ss (
MP
a)
Thickness of lower central flange (m)
NCC Nynäshamn

CHALMERS, Civil and Environmental Engineering, Master’s Thesis 2014:102 65
Figure 36 Parametric study of the thickness of the lower side flange (Maximum
stress)
Figure 37 Parametric study of the width of the lower central flange (Maximum stress)
180
230
280
330
380
0 0,02 0,04 0,06 0,08
Max
imu
m s
tre
ss (
MP
a)
Thickness of lower side flange (m)
NCC Nynäshamn
180
230
280
330
380
430
0,3 0,35 0,4 0,45 0,5 0,55 0,6 0,65 0,7 0,75
Max
imu
m s
tre
ss (
MP
a)
Width of lower central flange (m)
NCC Nynäshamn

CHALMERS, Civil and Environmental Engineering, Master’s Thesis 2014:102 66
Figure 38- Parametric study of the width of the lower sideflange (Maximum stress)
As the composite bridge didn’t have any beam reinforcement design to compare with,
as they were made of stainless steel, other approaches were considered to perform the
comparison with reality.
After an in-depth parametric study of the concept, it was discovered that some of the
parameters used in the real bridge were very near to the optimal values showed in the
study. As it can be seen in Figure 35 to Figure 38, the real bridge was designed on the
verge of the limiting values, showing clear intentions of performing a design as
optimal as possible, avoiding waste of material. This fact was considered as a good
symptom for the comparison of the model in the predesign phase, since the structural
response of the whole FE model seemed to be very similar to the design targets of the
original designers that presumably used the traditional approach.
Although the results obtained were considered fair enough for a successful
comparison of the composite bridge with reality, one of the checks included could not
be considered accurate enough. Lateral torsional buckling under traffic load
conditions could not be correctly assessed with the tool. Eurocode models suitable for
the geometry of the bridge were limited (beams are not uniform and their section
varies along the length), so the capacity regarding lateral torsional buckling was
heavily underestimated. It is worth to comment that the tool even considered that
lateral torsional buckling would happen in the already built bridge, which has no
stiffeners in reality. This was one of the reasons that suggested the consideration of
buckling as a want criterion, since further FE buckling analysis should be performed
to assess buckling capacity of the alternatives.
190
200
210
220
230
240
250
260
270
0,3 0,35 0,4 0,45 0,5 0,55 0,6 0,65 0,7 0,75
Max
imu
m s
tre
ss (
MP
a)
Width of lower side flange (m)
NCC Nynäshamn

CHALMERS, Civil and Environmental Engineering, Master’s Thesis 2014:102 67
9.2 Comparison of bridge performance
In order to get some interesting results from the developed tool, comparison with real
cases was used for assessing the its performance in selecting better alternatives than
the ones built by traditional design approaches.
Figure 39 and Figure 40 show the normalised material cost and CO2 equivalent of the
alternatives selected by the tool as structurally-feasible, and those from the real cases.
The normalisation of the results has been performed by dividing the material costs and
CO2 equivalents by the minimum values. As first glance, it can be seen that, if still
being considered as feasible after the required full analysis, there are alternatives
suggested by the tool which are more optimal in terms of material cost and CO2
equivalent than those built in reality. However, a full analysis of the most optimal
alternatives needs to be done in order to verify whether the methodology really
provides better designs than the ones made traditionally.
Figure 39 Distribution of analysed alternatives regarding normalised material cost
and CO2 equivalent for the concrete bridge concept Montagebro
It needs to be mentioned that the parameters for the concrete bridge were chosen in
broader ranges due to there were less parameters defining the bridge concept, and
therefore this can explain the higher performance of the optimal alternative compared
to the real case. On the other hand, the parameter ranges of the composite bridge were
taken by using as the reference the built bridge parameters, and hence they are a less
representative sample. In both cases more alternatives can be considered by
incrementing the number of parameters in the ranges, which can lead to more
computational time, although for these tests, not even a day was required. However,
all the parameters of the composite bridge cannot be varied at the time, because so
many combinations lead to unmanageable time consumptions and the ones with more
influence have to be pre-selected.
1
1,2
1,4
1,6
1,8
2
2,2
2,4
2,6
2,8
1
1,2
1,4
1,6
1,8
2
2,2
2,4
2,6
2,8
0 200 400 600 800 1000
No
rmal
ise
d C
O2 e
qu
ival
en
t (k
g/kg
)
No
rmal
ise
d m
ate
rial
co
st (
SEK
/SEK
)
Bridge ID
Material Cost
NCC Montagebro Örebro
CO2 Equivalent

CHALMERS, Civil and Environmental Engineering, Master’s Thesis 2014:102 68
Based on the aforementioned, if a bridge wants to be placed within a completely new
scenario and there are no reference parameters for defining the ranges, the composite
bridge might become unsuitable since it is defined by too many parameters. Referred
to this issue, a more compact parameterisation of the composite bridge based on less
tailor-made girders could solve the problem.
Figure 40 Distribution of analysed alternatives regarding normalised material cost
and CO2 equivalent for the composite bridge concept
The shape of the figures is similar in both cases which first presents a slightly higher
performance reduction ratio, then a linear zone and ends with a very high performance
reduction ratio. The former can be explained by considering that only few parameters
provide the best performance when combined to each other, then the combination of
parameters stabilise the rate because the parameters compensate each other and at the
end the combination of the larger parameters in term of dimensions give too big
bridges which are much more expensive in relation.
Table 6 Cost reductions between the real case and the optimal alternative given by
the tool for different optimisation scenarios for the concrete bridge concept
Montagebro
90% Material Cost – 10%
C02 equivalent 10% Material Cost –
90% C02 equivalent 50% Material Cost –
50% C02 equivalent 35% 35% 35%
1
1,2
1,4
1,6
1,8
2
2,2
2,4
2,6
2,8
1
1,2
1,4
1,6
1,8
2
2,2
2,4
2,6
2,8
0 50 100 150 200 250 300 350
No
rmal
ise
d C
O2
eq
uiv
ale
nt
(kg/
kg)
No
rmal
ise
d m
ate
rial
co
st (
SEK
/SEK
)
Bridge ID
Material Cost
NCC Nynäshamn
CO2 Equivalent

CHALMERS, Civil and Environmental Engineering, Master’s Thesis 2014:102 69
Table 7 Cost reductions between the real case and the optimal alternative given by
the tool for different optimisation scenarios for the composite bridge concept
90% Material Cost – 10%
C02 equivalent 10% Material Cost –
90% C02 equivalent 50% Material Cost –
50% C02 equivalent 18% 17% 17%
Table 6 and Table 7 show the cost reduction of the most optimal alternative
considered in the three different optimisation scenarios presented in Subchapter 7.3.
As it will be discussed in next chapter, and as it happened in the figures previously
mentioned, the differences between material cost and CO2 equivalent are very small,
and almost the same optimal alternative is selected in all scenarios.
9.3 Correlation between optimisation criteria
Figure 41 and Figure 42 show the relation of material cost and CO2 equivalent for all
assessed alternatives, normalised according to the same procedure as before. As it was
commented in Subchapter 7.2, material cost and CO2 equivalent regarding only
extraction and production are highly related and therefore little advantage is gotten
when performing a multi-criteria optimisation with only these two criteria rather than
considering only one. First, they are both estimated through the material amount and
secondly, high extraction and production work-time consuming materials are
commonly more expensive in terms of material cost, and therefore both are relatively
similar in order of magnitude for different materials, i.e. costly materials are expected
to have high CO2 equivalent.
Figure 41 Correlation between normalised material cost and CO2 equivalent for the
concrete bridge concept Montagebro
1
1,5
2
2,5
3
3,5
4
4,5
1 1,5 2 2,5 3
No
rmal
ise
d b
rid
ge C
02
eq
uiv
ale
nt
(kg/
kg)
Normalised bridge material cost (SEK/SEK)
NCC Montagebro Örebro

CHALMERS, Civil and Environmental Engineering, Master’s Thesis 2014:102 70
Figure 42 Correlation between normalised material cost and CO2 equivalent for the
composite bridge concept
It can be seen that the concrete bridge chart is more scattered due to the compensation
between materials, e.g. less concrete beams implies more reinforcement and vice
versa, and because of the higher variation of the number of beams considered in the
analysis. On the other hand, the composite bridge chart shows that the girders have
the highest influence in both parameters, and hence they follow two parallel lines
corresponding to bridges with two and three girders respectively.
1
1,2
1,4
1,6
1,8
2
2,2
2,4
1 1,2 1,4 1,6 1,8 2 2,2 2,4 2,6 2,8
No
rmal
ise
d b
rid
ge C
O2 e
qu
ival
en
t (k
g/kg
)
Normalised bridge material cost (SEK/SEK)
NCC Nynäshamn

CHALMERS, Civil and Environmental Engineering, Master’s Thesis 2014:102 71
9.4 Suitability of bridge concepts regarding span length
Figure 43 and 44 show the most optimal alternative regarding material cost and CO2
equivalent for both concepts over the span. It is important to note that the cost has
been normalised so that the most optimal alternative for the shortest span is defined as
value 1, and all other alternatives are weighted according to that value.
Figure 43 Cheapest alternatives regarding normalised material cost and CO2
equivalent for different spans of the concrete bridge concept Montagebro
Regarding the shape of the curves, in Figure 43, i.e. Concrete Bridge, the increasing
slope is due to the nature of the bridge. The longer the bridge is built, the more
concrete is needed to extend it, but more reinforcement is needed per unit length as a
consequence of the increasing stresses. This means than the increasing demand of
material is not linear when increasing the span, but it is growing faster at longer spans.
As an example, the price of increasing a concrete bridge from 30m to 35m long is
higher than the investment that would be needed to increase it from 20m to 25m,
although the increment of length is 5m in both cases. This is due to the higher amount
of reinforcement per unit length that would be required in the first case.
1
1,5
2
2,5
3
3,5
4
4,5
5
1
1,5
2
2,5
3
3,5
4
4,5
5
20 25 30 35 40
No
rmal
ise
d C
O2
eq
uiv
ale
nt
(kg/
kg)
No
rmal
ise
d m
ate
rial
co
st (
SEK
/SEK
)
Bridge Span (m)
Material Cost
CO2 Equivalent

CHALMERS, Civil and Environmental Engineering, Master’s Thesis 2014:102 72
Figure 44 Cheapest alternatives regarding normalised material cost and CO2
equivalent for different spans of the composite bridge concept
In case of the composite bridge in Figure 44, this tendency is almost linear because
the longer the bridge is the bigger amount of material is needed, and in this case
beams are not made out of reinforced concrete. If it is considered the high cost of
stainless steel in comparison with concrete or regular reinforcing steel, together with
the low increase of reinforcement rate that would happen in the slab, the tendency is
almost linear. In this case increasing 5m of the bridge would be almost the same for
every span because of the low increase of the slab reinforcement ratio as well as its
low impact on then cost compared with the extra length of the stainless steel beams.
It would have been interesting to be able to assess in some way the best option
between two concepts for a given situation i.e. span, but the different materials used in
the concepts made it impossible to do it. At any span, if both options were compared
stainless steel bridge would be much more expensive because life cycle cost is not
performed in the methodology. If it had included maintenance in any way, life cycle
cost comparison could be done. Therefore, prices are normalised according to the
cheapest bridge of each concept and are not comparable from one concept to the
other.
Figure 45 to 47 are histograms showing the number of alternatives considered as
feasible for each span after the analysis phase. These histograms show the increasing
mechanical demand of the bridges that the designer has to face when increasing the
span while keeping the initial ranges of parameters.
As it can be seen in Figure 45, for the initial sets introduced as input data, concrete
bridges had a feasible solution up to 40m span. Any longer bridge alternative for those
values was not considered feasible by the tool. The reasoning for the different failures
of the bridges will be discussed in the next section.
1
1,5
2
2,5
3
3,5
4
4,5
5
1
1,5
2
2,5
3
3,5
4
4,5
5
20 30 40 50 60 70 80
No
rmal
ise
d C
O2
eq
uiv
ale
nt
(kg/
kg)
No
rmal
ise
d m
ate
rial
co
st (
SEK
/SEK
)
Bridge Span (m)
Material Cost
CO2 Equivalent

CHALMERS, Civil and Environmental Engineering, Master’s Thesis 2014:102 73
Figure 45 Number of possible alternatives after the analysis depending on the bridge
span for an initial set of 2100 bridges per span. Concrete bridge concept Montagebro
Regarding the composite bridge, it is necessary to remember the two different
selection criteria introduced in section 5.8, must criterion and want criterion. Hence,
two different figures are showed according to the span length comparison of the
composite bridge, one considering want and must criteria Figure 46 and another one
only considering must criteria Figure 47. These two alternative histograms were
included as well due to the underestimated Lateral Torsional Buckling discussed in
Subchapter 5.8.2.4. If both figures are compared, it is easily noticeable that buckling
is limiting the maximum span to 50m and reducing dramatically the number of
feasible possibilities. On the other hand, if it is not considered as discarding criteria, it
was possible to design bridges up to 80m, reaching the span limitations that the
company claims for the concept.
0%
10%
20%
30%
40%
50%
60%
20 25 30 35 40 40+
Feas
ible
alt
ern
ativ
es
ove
r an
alys
ed
alt
ern
ativ
es
Bridge span (m)

CHALMERS, Civil and Environmental Engineering, Master’s Thesis 2014:102 74
Figure 46 Number of possible alternatives after the analysis depending on the bridge
span for an initial set of 360 bridges per span. Want and must criteria considered for
discarding alternatives. Composite bridge concept
Figure 47 Number of possible alternatives after the analysis depending on the bridge
span for an initial set of 360 bridges per span. Only must criteria considered for
discarding alternatives. Composite bridge concept
0%
10%
20%
30%
40%
50%
60%
70%
80%
90%
100%
20 30 40 50 50+
Feas
ible
alt
ern
ativ
es
ove
r an
alys
ed
alt
ern
ativ
es
Bridge span (m)
0%
10%
20%
30%
40%
50%
60%
70%
80%
90%
100%
20 30 40 50 60 70 80
Feas
ible
alt
ern
ativ
es
ove
r an
alys
ed
alt
ern
ativ
es
Bridge span (m)

CHALMERS, Civil and Environmental Engineering, Master’s Thesis 2014:102 75
It is worth to comment that if the figures discussed in this section are examined
thoroughly, the number of different alternatives is much higher for the concrete
concept than the composite concept. This is due to the different possibilities of design
in both concepts. While the concrete bridge considers different reinforcement
diameters for the beams, reinforcement design is calculated once for each diameter
value, and up to 7 alternatives are obtained from the same geometry, due to 7 different
rebar diameters. Reinforcement design is computationally fast because it is an
analytical method, and it does not require any FE calculation. However, input data for
the design are extracted from the FE analysis of the geometry of the bridge.
On the other hand, the generation of a single alternative in the composite bridge
requires a FE analysis, because there is no possible alternative generated with
analytical design within the same geometry. Therefore, it is much more
computationally expensive to generate a similar number of alternatives with this
concept if it is compared with the concrete bridge. Besides, it can be seen from the
total acceptance of alternatives up to 40 metres, than the selected parameters were not
representative enough.

CHALMERS, Civil and Environmental Engineering, Master’s Thesis 2014:102 76
9.5 Failure types distribution
The following pie charts show the distribution of the different failures identified when
considering the alternatives as unfeasible.
Figure 48 Failure types distribution for the concrete bridge concept Montagebro.
As it can be seen in Figure 48, three main failure types influence the discard of
regions for the concrete concept, which corresponds to around 25% of the total
amount of analysed regions. This figure does not show the number of bridges
discarded when checking if all regions of a bridge are feasible which might be
interesting to analyse in further studies. The figure reveals that the most restrictive
criterion is the fact of limiting the possible number of reinforcement layers up to three
followed by not fulfilling the ductility requirement and then by too low separation of
stirrups needed. All these aspects correspond to the higher bending moment and shear
force that needs to be carried when the length of the bridge is increasing, specially
excess of bending moment due to the configuration of the bridge and characteristics of
the loads.
No Failure
Fitting of bars
Ductility
Stirrups separation

CHALMERS, Civil and Environmental Engineering, Master’s Thesis 2014:102 77
Figure 49 Failure types distribution for the composite bridge concept. Want and must
criteria considered as failure types.
Figure 50 Failure types distribution for the composite bridge concept. Only must
criteria considered as failure types.
Stresses
Deflection
As long excesive
Buckling
Deflection + Stresses
Stresses + As long excesive
Deflection + As long excesive
Deflection + Stresses + As longexcesive
Deflection + Stresses + As longexcesive + Shear reinforcementneededNo Failure
Stresses
Deflection
As long excesive
Deflection + Stresses
Stresses + As long excesive
Deflection + As longexcesive
Deflection + Stresses + Aslong excesive
Deflection + Stresses + Aslong excesive + Shearreinforcement neededNo Failure

CHALMERS, Civil and Environmental Engineering, Master’s Thesis 2014:102 78
Figure 49 and Figure 50 show the failure types according to the discarding process for
the composite bridge. Both charts showing considering want and must criteria and
only must criteria have been shown in order to verify that the buckling analysis as
performed in the tool is too restrictive and a better approximation needs to be done. If
buckling is not considered as failure, the most common unfulfilled criteria are the
combination of too high deflection and stresses, and these two combined also with too
high longitudinal reinforcement amount over the supports. This allows verifying that
all three criteria are strongly related and become all a restriction when the span is
increased too far. This is due to the increase of the span length leads to a higher
amount of material and hence higher loads due to self-weight. It can be seen that shear
reinforcement is not required often for this kind of bridges.

CHALMERS, Civil and Environmental Engineering, Master’s Thesis 2014:102 79
9.6 Applicability of set-based design on structural
engineering
As presented in Chapter 2, the Set-Based Design approach seems to present many
advantages over the traditional Point-Based Design approach, e.g. rework reduction,
deeper knowledge of the design or better cooperation between stakeholders. However
it had not been widely applied specifically into structural design where it could
improve the design process and lead to more optimal designs. The following
discussion intends to justify the potential of this approach within bridge design, as an
example of structural design.
Since the bridge pre-design stage usually implies simple checks from the standards,
they are suitable for being implemented into a computer script when the required data
from the bridge behaviour is available. All these data related with the structural
behaviour of the bridge, can be obtained by means of a Finite Element Analysis, and
hence, the combination of both leads to the possibility of setting an automatic process.
This automatic process facilitates the application of these pre-design checks to many
bridge alternatives, and therefore the principles of Set-Based Design for finding a set
of optimal alternatives can be implemented into the design of bridges.
First, for selecting the initial set of alternatives which will be analysed, the different
alternatives are built as random combination of parameters from ranges defined by the
designer, which requires a previous parameterisation of the analysed bridge concept.
Secondly, the stakeholders can determine those criteria that need or are preferred to be
fulfilled by these alternatives and hence the initial set of alternatives can be narrowed
down. These criteria will mainly correspond to two different phases of the narrowing
process; the determination of the structurally-feasible alternatives, and the
optimisation of those possible alternatives regarding cost or environmental issues.
This methodology, supported by the development of a computer script which controls
and manages the outcomes from a Finite Element Analysis, presents several direct and
indirect advantages in the design process of structures, although some limitations are
also presented.
This tool is not intended for replacing the bridge designer but for helping him in the
pre-design phase. As discussed in Chapter 9, this tool has shown good fitting with
some concepts that were designed by traditional means, which proves that the checks
commonly used in practice have been correctly introduced in the script, and that the
script is just doing what a designer normally does, but automatically. This possibility
facilitates the analysis of huge amounts of alternatives unlike the traditional
methodology of assessing only few alternatives by hand calculations, and in
consequence, to find more optimal alternatives.
The tool also allows considering the opinion of the different stakeholders from the
very beginning of the design process, by including the checks required by the
administration or the criteria preferred by the client to optimise the bridge against.
Even if a computer script seems not very clear in terms of verification of the
implementation of the standards, the methodology incorporates easy-to-read
calculations sheets that can be easily verified of producing the same results as the
script. These sheets can also be provided by the administration as specific required
standards to be implemented into the script.

CHALMERS, Civil and Environmental Engineering, Master’s Thesis 2014:102 80
As mentioned in Chapter 7, is it essential to allow the person in charge of the project
the possibility of making the last decision, and the tool can provide a set of optimal
alternatives regarding different optimisation criteria, for this person to be able to
select the most suitable alternative according to his criteria. This set also gives the
possibility to have alternative designs in case the final analysis considers the chosen
design as unfeasible, regarding one of the analysis that are not performed in pre-
design.
Besides direct design applications, the tool can also be used for performing parametric
studies or assessing suitability of alternatives regarding different situations, e.g.
whether a concrete bridge or a composite bridge is more suitable for a specific
purpose or location.
On the other hand, some limitations need to be considered. First, this methodology
requires a bridge concept which can be parameterised by a reasonable amount of
parameters, or at least, that can be proved that some of the parameters have little
influence in the structural behaviour and can be estimated beforehand. This tool does
not give the best bridge for a certain purpose or location but selects an optimal design
according to a bridge concept, and therefore is intended for industrialised bridges and
not for unique designs.
Furthermore, the methodology fits well with early stages of the design process, where
the required checks and analyses are not very complex or time consuming. If the time
consumption for designing an alternative is too high, the possibility of considering
large amounts of alternatives becomes unfeasible. To find the equilibrium between
accuracy degree and computational time of the analysis is fundamental for this
methodology. The use of a computer cluster as did in this project is highly
recommended for performing high number of analyses, which can limit the
applicability of this tool.
Regarding the aspect aforementioned, in this project, the assessment of the lateral
torsional buckling capacity of the steel girders in the composite bridge concept has
been a difficult task to overcome due to the curved profile of those elements. After
considering suitable methods for an iterative process, it was found that none of them
gave a good estimation of the real capacity of the girder, and that the general method
needs to be used. This general method implies a specific buckling Finite Element
Analysis of each alternative, and it has not been included. Nevertheless, as mentioned
in Chapter 5, this criterion is described as a want criterion because it can be solved by
relatively low cost increment through stiffeners.

CHALMERS, Civil and Environmental Engineering, Master’s Thesis 2014:102 81
10 CONCLUSIONS
In this project the applicability of Set-Based Design in structural engineering has been
studied and it can be concluded that this design approach suits well the needs of this
field.
The methodology here presented follows properly the principles of Set-Based
Design and allows an iterative preliminary design of large amounts of design
alternatives.
o A literature review of the principles of Set-Based Design has been
performed, concluding that even though it shows high potential in
structural engineering, it has not been widely applied in this field.
o In order to be able to carry out an iterative design process, a
parameterisation of the structure, i.e. a bridge; is necessary for defining
a set of different alternatives, which has been successfully done.
o The methodology requires a computer script for controlling and
evaluating the outcomes from a Finite Element Analysis, which has
been developed showing multiple applications and great potential.
The methodology has been successfully compared with two different study
cases and applied for estimating better alternatives than the ones based on the
traditional design practice, which has led to more optimal designs.
Furthermore, the possibility of pre-design a large amount of bridges suitable
for different situations increases the competitiveness.
o Since traditional design practice begins with a pre-design stage where
simple checks are performed by hand calculations over a limited
number of design alternatives, the possibility of simulating this process
automatically and being able to analyse large amount of alternatives in
order to find a more optimal solutions is very advantageous.
Furthermore this methodology leads to a better understanding of the
design. However, it is mainly suitable for bridge concepts that are
intended to be built several times.
o The methodology that has been developed, not only permits direct
design application but other sort of studies such as suitability
assessment of different bridge concepts or parametric studies.
o Different techniques for the comparison of the analysis performed by
the computer script have been used. In the case of a concrete bridge,
the script suggests a very similar reinforcement design than the one of
the study cases. On the other hand, in the composite bridge, through an
assessment of different parameters, it has been proved that the analysis
of the script considers a similar behaviour than the one considered by
the designers in the case study.

CHALMERS, Civil and Environmental Engineering, Master’s Thesis 2014:102 82
The methodology has been developed and described in a structured way,
which shows the different modules, explains how it is done and how it works,
and it allows the designer to apply it for different purposes. Its limitations have
been also presented and some techniques for overcoming these constraints
have been presented, e.g. a parametric study to reduce the number of
parameters for a given design.
o By using computational tools, the management of the raw data from
the analyses has been successfully performed. Even though the amount
of data is huge, by using a script the size of this data is not an issue,
and an automatic management carried out by the script itself allows
presenting only the very necessary data to the designer in a user
friendly way. A basic multi-criteria optimisation has been performed in
order to show the high potential of this tool together with this
methodology.
o A computer cluster has been used for reducing the time consumption
required by the methodology, when big amounts of alternatives are
analysed. The methodology has been developed for being performed
either in this type of clusters or in a network of desktop computers,
which provides more flexibility.

CHALMERS, Civil and Environmental Engineering, Master’s Thesis 2014:102 83
11 FURTHER INVESTIGATIONS
After the initial development of the methodology carried out in this project, some
further development and investigations might be performed in order to improve both
its applicability and results.
Considering some improvements that might be investigated regarding the
enhancement of the applicability of the methodology, some new features could be
implemented. One of the limitations of the current tool is the only compatibility with
single span bridges, reducing the situations where it can be applied. A very good
boost for applicability would be overcoming this limitation, by adapting the existing
tool for continuous beam conditions and other characteristics included in multiple
span bridges.
Regarding parametric issues, it would be beneficial for the methodology to improve
the parameter management, providing the possibility of wider ranges i.e. bigger
design space, as well as develop some relations between them that could allow a more
effective parameterisation. Although it is now possible to enlarge the design space as
far as desired, time consumption becomes huge, so this could be optimised and
improved.
Another applicability enhancement that could be introduced is the improvement of the
optimisation process, by including more advanced methods and new criteria e.g.
construction time, labour cost, traffic issues… It is important to note that the more
criteria included there, the better alternatives will be obtained since the tool would
take into account everything it has been provided.
As a final thought regarding applicability, lifecycle cost assessment has arisen as a
very important feature that should be investigated in order to be able to compare
different concepts of very different nature in a global framework, assisting the
decision of the designer in the concept bridge selection.
Regarding the improvement of the results, more checks could be implemented in the
tool, providing more Eurocode limitations to the assessment of the structures. It is
important to highlight here the necessity of further investigation regarding to
buckling, since the approach used in this project was not reliable enough to be trusted.
Additionally, some other important phenomena might be studied and included in the
tool, such as long term effects of concrete or fatigue assessment of steel. The more of
this features included, the closer the predesigned bridge will be to the final design
reducing the time needed for the whole design process.
Finally, it would be interesting to investigate the feasibility of including the automatic
final analysis of the best alternatives aiming to create a global tool going from blank
paper to the final design. Although it might look like a greedy objective, at least some
research on this topic would be much of interest.

CHALMERS, Civil and Environmental Engineering, Master’s Thesis 2014:102 84
12 REFERENCES
Adeli, H. & Park, H.S., 1995. A Neural Dynamics Model for Structural Optimization
- Theory. Computers & Structures, 57(3), pp.383–390.
Aganovic, D., Bjelkemyr, M. & Lindberg, B., 2004. Applicability Of Engineering
Design Theories On Manufacturing System Design In The Context Of
Concurrent Engineering. Methods and Tools for Co-operative and Integrated
Design, pp.145–158.
AIA, 2007. Integrated Project Delivery: A Guide.
Avigad, G. & Moshaiov, A., 2010. Set-based concept selection in multi-objective
problems involving delayed decisions. Journal of Engineering Design, 21(6),
pp.619–646. Available at:
http://www.tandfonline.com/doi/abs/10.1080/09544820802459243 [Accessed
February 14, 2014].
Beeby, A.W. & Narayanan, R.S., 1995. Designers’ Handbook to Eurocode 2: Part
1.1. Design of concrete structures
Ben-Tal, A. & Nemirovski, A., 2013. Lectures on Modern Convex Optimization.
Berke, L., Patnaik, S.N. & Murthy, P.L.N., 1993. Optimum Design of Aerospace
Structural Components using Neural Networks. Computers & Structures, 48(6),
pp.1001–1010.
Beyer, H.-G. & Sendhoff, B., 2007. Robust optimization – A comprehensive survey.
Computer Methods in Applied Mechanics and Engineering, 196(33-34),
pp.3190–3218. Available at:
http://linkinghub.elsevier.com/retrieve/pii/S0045782507001259 [Accessed
January 29, 2014].
Blaaunwendraad, J., 2010. Plates and FEM, Surprises and Pitfalls
Castro-Lacouture, D. et al., 2006. Implementing a B2B e-Work System to the
Approval Process of Rebar Design and Estimation. Journal of computing in civil
engineering ASCE, (February), pp.28–37.
CEB-FIP, 2008. Practitioners’ guide to finite element modeling of reinforced concrete
structures, State of the art report.
Chen, W. et al., 1998. A Procedure for Robus Design: Minimizing Variations Caused
by Noise Factors and Control Factors.
Dalton, S.K. et al., 2013. An optimization based approach for structural design
considering safety, robustness, and cost. Engineering Structures, 57, pp.356–363.
Available at: http://linkinghub.elsevier.com/retrieve/pii/S0141029613004525
[Accessed January 22, 2014].

CHALMERS, Civil and Environmental Engineering, Master’s Thesis 2014:102 85
Van Dam, E.R. et al., 2007. Maximin Latin Hypercube Designs in Two Dimensions.
Operations Research, 55(1), pp.158–169. Available at:
http://pubsonline.informs.org/doi/abs/10.1287/opre.1060.0317 [Accessed
February 4, 2014].
Eberhart, R. & Kennedy, J., 1995. A New Optimizer using Particle Swarm Theory. In
MHS’95. Proceedings of the Sixth International Symposium on Micro Machine
and Human Science. Ieee, pp. 39–43. Available at:
http://ieeexplore.ieee.org/lpdocs/epic03/wrapper.htm?arnumber=494215.
Eberhart, R.C. & Shi, Y., 2001. Particle Swarm Optimization : Developments ,
Applications and Resources. IEEE, pp.81–86.
Egan, J., 1998. Rethinking Construction: The Report of the Construction Task Force
Eibl, J., 1995. Concrete Structures: Euro-Design Handnook 1994/96, Ernst & Sohn.
Finger, S. & Dixon, J.R., 1989a. A Review of Research in Mechanical Engineering
Design. Part I: Descriptive, Prescriptive, and Computer-Based Models of Design
Processes. Research in Engineering Design, 1(1), pp.51–67.
Finger, S. & Dixon, J.R., 1989b. A Review of Research in Mechanical Engineering
Design. Part II: Representations, Analysis, and Design for the Life Cycle.
Research in Engineering Design, 1(2), pp.121–137.
Fishburn, P.C., 1967. Additive Utilities with Incomplete Product Sets : Application to
Priorities and Assignments. , (May 2014).
Fogel, L.J., Owens, A.J. & Walsh, M.J., 1966. Artificial Intelligence Through
Simulated Evolution
Ford, D.N. & Sobek II, D.., 2005. Adapting Real Options to New Product
Development by Modelling the Second Toyota Paradox. IEEE Transactions on
Engineering Management, 52(2), pp.175–185.
Goldberg, D.E., 1989. Genetic Algorithms in Search, Optimization, and Machine
Learning
Hannapel, S.E. et al., 2012. Including Principles of Set-Based Design in
Multidisciplinary Design Optimization. In 12th AIAA Aviation Technology,
Integration and Operations. Indianapolis.
Johansson, M., Plos, M. & Pacoste, C., 2012. Recommendations for finite element
analysis for the design of reinforced concrete slabs.
Laier, J.E. & Morales, J.D. V, 2009. Improved Genetic Algorithm for Structural
Damage Detection. Computational Structural Engineering, pp.833–839.

CHALMERS, Civil and Environmental Engineering, Master’s Thesis 2014:102 86
Lee, S.-I., Bae, J.-S. & Cho, Y.S., 2012. Efficiency analysis of Set-based Design with
structural building information modeling (S-BIM) on high-rise building
structures. Automation in Construction, 23, pp.20–32. Available at:
http://linkinghub.elsevier.com/retrieve/pii/S0926580511002330 [Accessed
January 24, 2014].
Liker, J.K. et al., 1996. Involving suppliers in product development in the United
States and Japan: evidence for set-based concurrent engineering. IEEE
Transactions on Engineering Management, 43(2), pp.165–178. Available at:
http://ieeexplore.ieee.org/lpdocs/epic03/wrapper.htm?arnumber=509982.
Lottaz, C. et al., 1999. Constraint-Based support for collaboration in Design and
Construction. Journal of computing in civil engineering ASCE, (January), pp.23–
35.
Madhavan, K. et al., 2008. An Industrial Trial of a Set-Based Approach to
Collaborative Design. In ASME 2008 International Design Engineering
Technical Concferences & Computers and Information in Engineering
Conference. New York, pp. 1–11.
Malak, R.J.J., Aughenbaugh, J.M. & Paredis, C.J.J., 2009. Multi-attribute utility
analysis in set-based conceptual design. Computer-Aided Design, pp.214–227.
Morris, M.D. & Mitchell, T.J., 1995. Exploratory designs for computational
experiments. Journal of statistical planning and inference, 43, pp.381–402.
Nahm, Y.-E. & Ishikawa, H., 2006. A new 3D-CAD system for set-based parametric
design. The International Journal of Advanced Manufacturing Technology, 29(1-
2), pp.137–150. Available at: http://link.springer.com/10.1007/s00170-004-2213-
5 [Accessed February 4, 2014].
Nahm, Y.-E. & Ishikawa, H., 2005. Novel space-based design methodology for
preliminary engineering design. The International Journal of Advanced
Manufacturing Technology, 28(11-12), pp.1056–1070. Available at:
http://link.springer.com/10.1007/s00170-004-2463-2 [Accessed February 14,
2014].
Ottosen, N.S. & Petersson, H., 1992. Introduction to the Finite Element Method, New
York: Prentice Hall.
Owen, R., 2009. Integrated Design & Delivery Solutions
Papadopoulos, H. & Eds, C.J., 2013. Engineering Applications of Neural Networks,
Park, G.-J. et al., 2006. Robust Design: An Overview. AIAA Journal, 44(1), pp.181–
191. Available at: http://arc.aiaa.org/doi/abs/10.2514/1.13639.
Parrish, K. et al., 2007. Exploration of Set-Based Design for Reinforced Concrete
Structures. In IGLC-15. Michigan, USA, pp. 213–222.

CHALMERS, Civil and Environmental Engineering, Master’s Thesis 2014:102 87
Parrish, K.D., 2009. Applying a Set-Based Design Approach to Reinforcing Steel
Design. Univerisity of California, Berkeley.
Rechenberg, I., 1989. Evolution Strategy: Nature’s Way of Optimization. In
Optimization: Methods and Applications, Possibilities and Limitations. Springer.
Rempling, R., Fall, D. & Lundgren, K., 2014. Principles of integrated design of
structures : parametric models , creative space and linking knowledge.
Shahan, D. & Seepersad, C.C., 2009. Bayesian Networks for Set-Based Collaborative
Design. In ASME 2009 International Design Technical Conferences &
Computers and Information in Engineering Conference. San Diego, pp. 1–11.
Shi, L., 2007. A Two-Step Algorithm For Layout Optimization Of Structures With
Discrete Variables. Journal of Indstrual and Management Optimization, 3(3),
pp.543–552.
Sobek II, D.., Ward, A.C. & Liker, J.K., 1999. Toyota´s Principles of Set-Based
Concurrent Engineering. Sloan Management Review.
SS - EN 1991-1-7: 2006, 2006. Eurocode 1: Actions on structures. General actions.
Accidental actions
SS - EN 1993-1-5:2006, 2006. Eurocode 3: Design of steel structures - Plated
structural elements
SS-EN 1990, 1990. Eurocode 0 – Basis of structural design.
SS-EN 1991-2, 1991. Eurocode 1: Actions on structures – Part 2: Traffic loads on
bridges.
SS-EN 1992-1-1:2005, 2005. Eurocode 2: Design of concrete structures - Part 1-1:
General rules and rules for buildings, Brussels: CEN.
SS-EN1993-1-1:2005, 2005. Eurocode 3: Design of steel structures – Part 1-1:
General rules and rules for buildings.
Stephenson, J. & Callander, R.A., 1974. Engineering Design Wiley&Sons, ed.,
Taguchi, G., 1986. Introduction to quality engineering
TRVK BRO 11, 2011. Trafikverkets tekniska krav Bro, Traffikverket.
Ulrich, K.T. & Eppinger, S.D., 2004. Product Design and Development, New York:
Tata McGraw-Hill Education.
Wang, J. & Terpenny, J., 2003. Interactive evolutionary solution synthesis in fuzzy
set-based preliminary engineering design. Intelligent Manufacturing, 14, pp.153–
167.

CHALMERS, Civil and Environmental Engineering, Master’s Thesis 2014:102 88
Ward, A.C. et al., 1995. The Second Toyota Paradox: How Delaying Decisions Can
Make Better Cars Faster. Sloan Management Review, pp.43–61.
Wolkowicz, H., Saigal, R. & Vandenberghe, L., 2000. Handbook of Semidefinite
Programming, Kluwer Academic Publishers.
Yang, X.-S. & Koziel, S., 2011. Computational Optimization, Methods and
Algorthms, Berlin: Springer.