application of afcm method on lap joint using low energy ... · according to iso 5817 which is the...
TRANSCRIPT
Proceedings of Mechanical Engineering Research Day 2019, pp. 1-2, August 2019
__________
© Centre for Advanced Research on Energy
Application of AFCM method on lap joint using low energy arc welding technologies
Saiful Din Sabdin1,*, Nur Izan Syahriah Hussein1, Mohammad Kamil Sued1, Rashdan Awang2
1) Fakulti Kejuruteraan Pembuatan, Universiti Teknikal Malaysia Melaka,
Hang Tuah Jaya, 76100 Durian Tunggal, Melaka, Malaysia 2) TWI Technology (S.E. Asia) Sdn Bhd, No.1 Jalan Utarid U5/13 Section U5,
40150 Shah Alam , Selangor Darul Ehsan, Malaysia
*Corresponding e-mail: [email protected]
Keywords: Thin plate; arc welding; steel; heat input
ABSTRACT – Low energy arc welding is one of the
modern technologies joining of GMAW process.
Commonly inspections technique is used in
manufacturing and industrial which the processes
involved meett those requirements especially in welding
technology field. The main objective from this
experiment is to identify the defect from thin plate sheet
joining lap joint in relation to heat input on high strength
steel plate joint. The study of this paper covers only the
inspection effects using ACFM (Application of
Alternating Current Field Measurement) method on the
weldment low arc technology after cooling down to room
temperature.
1. INTRODUCTION
Nowadays the ACFM technique mostly used at
manufacturing industries such as automotive, maritime,
oil & gas, aerospace and other applications. Significantly,
the ACFM is from conventional eddy currents and locally
used unidirectional and constant electric field in the
sample. This method provides a number of benefits
including the ability to mathematically model the
perturbations produced by a simple defect. The technique
therefore allows crack and depth sizing is needed to be
carried out by comparing measured field disturbances to
predict disturbances around pre-defined defects. The
technique was originally developed for the detection and
sizing of fatigue cracks, which tend to be single planar
defects compatible with the model [1-2].
Low energy arc technology was a short circuit
which sends a signal that retracts the welding filler
material, giving the weld time to cool before each drop is
placed. This leaves a smooth weld that is stronger than
that of a hotter weld. This works well on thin metal that
is prone to warping and the weld burning through the
material. This type of welding is more efficient than
other GMAW methods when the metal is thinner than
10mm, anything greater than the expense begins to
overcome traditional welding.
2. METHODOLOGY
The Alternating Current Field Measurement
(ACFM) technique is an electromagnetic technique that
is capable of both detecting and sizing (length and depth)
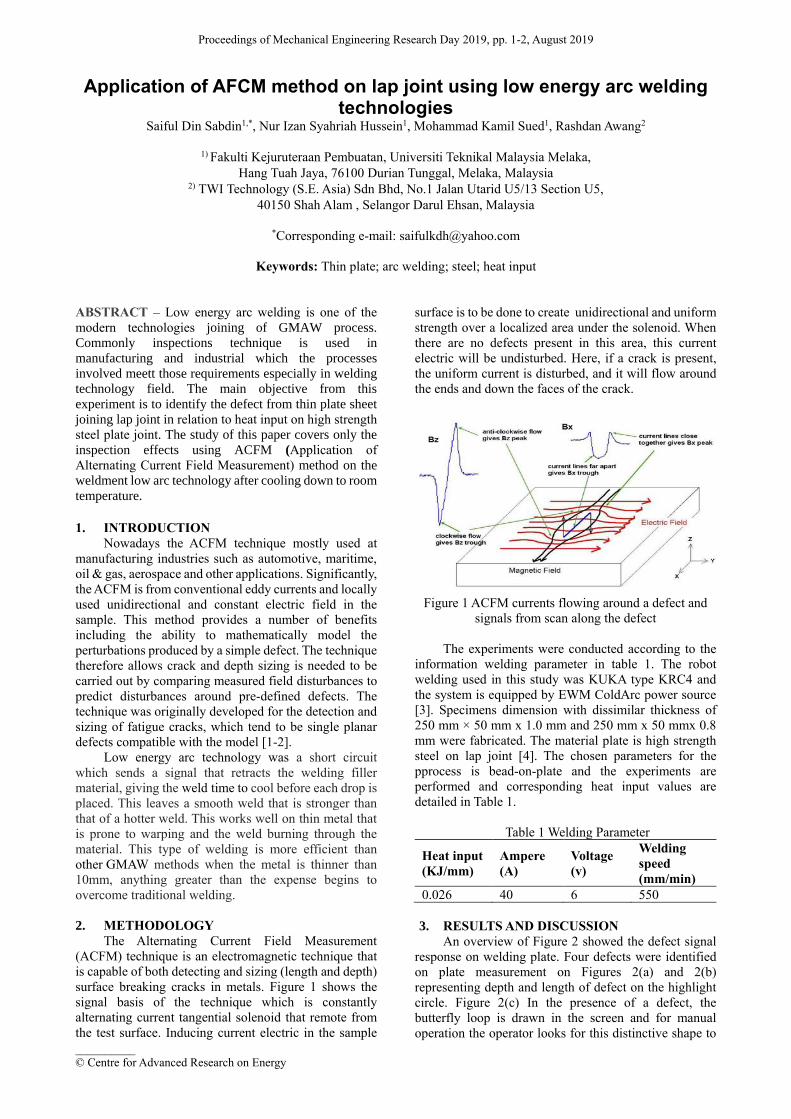
surface breaking cracks in metals. Figure 1 shows the
signal basis of the technique which is constantly
alternating current tangential solenoid that remote from
the test surface. Inducing current electric in the sample
surface is to be done to create unidirectional and uniform
strength over a localized area under the solenoid. When
there are no defects present in this area, this current
electric will be undisturbed. Here, if a crack is present,
the uniform current is disturbed, and it will flow around
the ends and down the faces of the crack.
Figure 1 ACFM currents flowing around a defect and
signals from scan along the defect
The experiments were conducted according to the
information welding parameter in table 1. The robot
welding used in this study was KUKA type KRC4 and
the system is equipped by EWM ColdArc power source
[3]. Specimens dimension with dissimilar thickness of
250 mm × 50 mm x 1.0 mm and 250 mm x 50 mmx 0.8
mm were fabricated. The material plate is high strength
steel on lap joint [4]. The chosen parameters for the
pprocess is bead-on-plate and the experiments are
performed and corresponding heat input values are
detailed in Table 1.
Table 1 Welding Parameter
Heat input
(KJ/mm)
Ampere
(A)
Voltage
(v)
Welding
speed
(mm/min)
0.026 40 6 550
3. RESULTS AND DISCUSSION
An overview of Figure 2 showed the defect signal
response on welding plate. Four defects were identified
on plate measurement on Figures 2(a) and 2(b)
representing depth and length of defect on the highlight
circle. Figure 2(c) In the presence of a defect, the
butterfly loop is drawn in the screen and for manual
operation the operator looks for this distinctive shape to

Sabdin et al., 2019
2
decide whether a crack is present or not. The biggest
defect was on zone 3 the center of welding joint plate.
Figure 3 shows the measurement length and depth
on signal in weld zone. The most defect on area zone 3 is
the length of 148 mm and the depth of 29 mm. The lowest
defect on area zone 1 is the length of 60 mm and the depth
of 7 mm. The results indicate that the heat input is
affected from the weldment size. Interestingly, there were
also differences correlated with the results obtained by
previous researchers [5].
Table 2 shows the visual defect by zone. Visual
examination showed that unequal cladding of the
welding joints occurred. According to ISO 5817 which is
the standard quality for the welding, welded joints can be
classified according to uniform and regular joint EN ISO
5817. The results obtained was actual throat is more than
design throat of fillet weld lap joint.
Figure 2 Signal response to defect
a) Bx signal of depth plate 200 mm, b) Bz signal of
length plate 200 mm and c) signal butterfly plot.
Figure 3 Graph measurement zone area.
From the experiment results there are four defects
on the join using ACFM equipment more easily and
accurately. The defect on weldment join is incomplete
fusion and the underfill was noted. The AFCM method
process proves to be suitable for inspection welding thin
sheet metal. It is essential to determine the right
parameter to minimize defect in the product.
4. CONCLUSION
The most significant findings from this study is that
The AFCM method is relevant to experiment and
investigate thin plate defect. After completing this work,
several conclusions are made from the results shown
above.
(a) ACFM has been shown to be effective for
inspection of simulated surface breaking
geometrical defects and electromagnetic
discontinuities in high strength steel plates.
(b) The technique has also obtained good results in thin
skin application with higher accuracy.
(c) The technique has also inspected through coatings,
making it a useful and adaptable inspection
technique for the new millennium.
Table 2 Visual defect zone area.
Defect area Zone
1
2
3
4
ACKNOWLEDGEMENT
The authors would like to thank the Faculty of
Manufacturing Engineering, Universiti Teknikal
Malaysia Melaka (UTeM) and TWI Technology (S.E.
Asia) Sdn Bhd for educational and technical support
throughout this research.
REFERENCES
[1] Ge, J., Li, W., Chen, G., Yin, X., Wu, Y., Yuan, X.,
& Zhao, M. (2016). New parameters for the ACFM
inspection of different materials. Insight-Non-
Destructive Testing and Condition
Monitoring, 58(6), 313-317.
[2] Farrell, S. P., Lugg, M., & Avery, K. (2015, March).
Application of Alternating Current Field
Measurement for Determination of Surface Cracks
and Welds in Steel Structures at Lift-off. In ASNT
24th Research Symposium 2015 (pp. 24-28).
[3] Sabdin, S. D., Hussein, N. I. S., Sued, M. K., & Ayof,
M. N. (2018). Joining of Thin Plates Using Various
Arc Welding Heat Sources–A Review. Journal of
Advanced Manufacturing Technology (JAMT), 12(1
(1)), 357-370.
[4] Sabdin, S. D., Hussein, N. I. S., Sued, M. K., Ayof,
M. N., Ayob, M. S., & Rahim, M. A. S. A. (2018).
Weld bead reinforcement on cold rolled carbon steel
sheet joint using ColdArc technology. Proceedings
of Mechanical Engineering Research Day
2018, 197-198.
[5] Ge, J., Li, W., Chen, G., Yin, X., Wu, Y., Yuan, X.,
& Zhao, M. (2016). New parameters for the ACFM
inspection of different materials. Insight-Non-
Destructive Testing and Condition
Monitoring, 58(6), 313-317.
Proceedings of Mechanical Engineering Research Day 2019, pp. 3-4, August 2019
__________
© Centre for Advanced Research on Energy
Thermal degradation study of acrylonitrile butadiene styrene (ABS) composites for FFF
Syaza Najwa Mohd Farhan Han1, Mastura Mohammad Taha2,3,*, Muhd Ridzuan Mansor1,3,
Muhammad Mufqi Aminallah2
1) Fakulti Kejuruteraan Mekanikal, Universiti Teknikal Malaysia Melaka,
Hang Tuah Jaya, 76100 Durian Tunggal, Melaka, Malaysia 2) Fakulti Teknologi Kejuruteraan Mekanikal dan Pembuatan, Universiti Teknikal Malaysia Melaka,
Hang Tuah Jaya, 76100 Durian Tunggal, Melaka, Malaysia
3) Centre for Advanced Research on Energy, Universiti Teknikal Malaysia Melaka,
Hang Tuah Jaya, 76100 Durian Tunggal, Melaka, Malaysia
*Corresponding e-mail: [email protected]
Keywords: ABS composites; thermal degradation; fused filament fabrication
ABSTRACT – Thermal stability of material is the main
concern in producing filament for FFF. Hence, this paper
investigates thermal stability of commercialized ABS
filament, neat ABS, kenaf fiber, 2.5% and 5% of kenaf
fiber reinforced ABS composites. TGA test was
performed to measure the degradation temperature.
Results indicate that the degradation temperature for
commercialized ABS filament, neat ABS and kenaf fiber
are 345.16°C 326.83°C and 240.53°C respectively.
Meanwhile, addition of kenaf fiber into ABS polymer
decreased the thermal stability of composites. Therefore,
kenaf fiber reinforced ABS composites is suitable for
FFF since extrude temperature used at FFF is less than
250°C.
1. INTRODUCTION
Fused Filament Fabrication (FFF) is the most
significant technique for Additive Manufacturing (AM)
and has been used widely based on the capability of FFF
to print three-dimensional objects. Besides, FFF can
fabricate geometrically complex shape [1] and cost-
effectiveness [2] in producing 3D objects with good
resolution output.
Thermoplastic is the mainly used material for FFF
such as Acrylonitrile Butadiene Styrene (ABS) and
Polylactic Acid (PLA). Currently, wide range of material
have been introduced from neat bio(polymer) to
(bio)composites [3]. However, the suitability of
composites material is one of the disadvantages as the
compatibility between the matrix and reinforcement
requires intensive research based on the temperature of
materials which the melting point is not too high or not
to low since the heating element of commercially
available FFF can operate around 300°celsius [4].
Natural fiber reinforced polymer composites
(NFRC) has been used nowadays in many applications
such as automotive, aerospace and medical due to its
lightweight and environmentally friendly material [5].
The disadvantage of natural fiber such as low thermal
stability limits the usage of NFRC for FFF. Torrado et al.
[6] investigate effect of jute fiber reinforced ABS
composites on FFF and found that the high temperature
of extrusion process can cause decomposition of jute
fiber. Montalvo et al. [7] study on wood plastic
composites (WPC) and found that the decomposition of
WPC is between 300°C and 500°C. So, it is vital to study
the thermal stability of NFRC before the NFRC filament
is produced and extruded on FFF.
Thus, the aim of this study is to investigate the
thermal degradation of commercialized ABS filament,
kenaf fiber, neat ABS and different loadings of NFRC by
using thermogravimetric analysis (TGA) to identify the
decomposition temperature (°C).
2. METHODOLOGY
There are five types of test samples which are
commercialized ABS filament, kenaf fiber, neat ABS,
2.5% kenaf fiber reinforced ABS composites and 5%
kenaf fiber reinforced ABS composites.
Commercialized ABS filament was cut into 3mm
length and the weight is between 5-15mg. Neat ABS and
kenaf fiber is weighed to obtain 5-15mg since the
material is already in a pellets and powder form
respectively. Then, an internal mixture model HAAKE
Rheomix OS was used to mix 2.5 wt.% kenaf powder
reinforced ABS composites and 5 wt.% kenaf powder
reinforced ABS composites. The mixture was mixed at
180°C with the speed 50 rpm for 12 minutes for each
mixing. After the mixing of two specimens is completed.
The material was crushed by a crusher machine to obtain
specimens in form of granules. Then, the granules for 2.5
wt.% and 5 wt.% percent of kenaf fiber reinforced ABS
composites was weighed between 5-15mg.
The model used for TGA is TGA 1
(Thermogravimetric Analyzer) of Mettler Toledo. The
temperature used for all samples is 25°c to 550°c with
heating rate 10°c min-1 and the atmosphere used is
nitrogen gas. TGA is conducted to measure the change in
mass of the sample as a function of increasing
temperature and the final residue yield on set of
degradation temperature were recorded.
3. RESULTS AND DISCUSSION
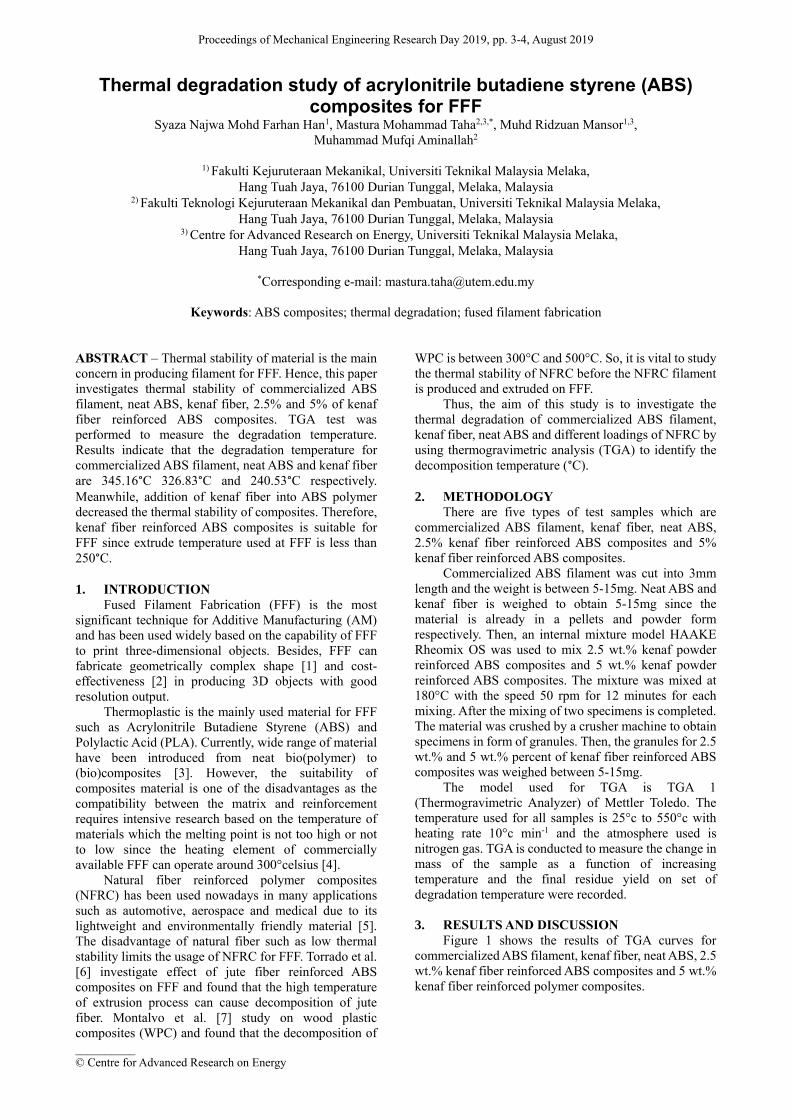
Figure 1 shows the results of TGA curves for
commercialized ABS filament, kenaf fiber, neat ABS, 2.5
wt.% kenaf fiber reinforced ABS composites and 5 wt.%
kenaf fiber reinforced polymer composites.

Mohd Farhan Han et al., 2019
4
Figure 1 TGA curves for all specimen.
Table 1 Decomposition temperature and final weigh
after decomposition of all specimen.
Materials
Decomposition
temperature
(°C)
Final weight
after
decomposition
(%)
Kenaf powder 240.53 8.36
Commercialized
ABS filament
345.16 4.6
Neat ABS 326.83 2.65
2.5% kenaf
fiber
320.94 3.34
5% kenaf fiber 312.39 3.46
The data from curves were extracted and presented
in Table 1. The commercialized ABS filament
decomposition temperature and remaining weight is
slightly higher compare to neat ABS with 5.6% and 38%
respectively. Then, neat ABS have the higher
decomposition temperature compare to 2.5% and 5% of
kenaf fiber reinforced ABS composites.
Meanwhile, it is found that the thermal stability of
kenaf fiber is the lowest with 240.53°C respectively for
decomposition temperature. The overall weight loss of
kenaf fiber could be divided into three different steps. For
the first step, weight loss occurs at below 100°C about
6% from initial weight. Then, the second weight loss
occurred around 260°C with 12.5% where this is the
initial stage of thermal degradation. The last step is
referred to the major thermal degradation occur with
maximum weight loss at 325°C. The weight loss occurs
due to the vaporization from fiber and decomposition of
cellulose [8].
As the content of kenaf fiber is increased, the
decomposition temperature of composites is decreased
since kenaf fiber has low thermal stability compare to
ABS polymer. This result is supported by Azwa and
Yousif [9] where the addition of natural fiber in
composites cause the thermal stability to reduce due to
the less stable fibers. The increasing percentage of fiber
lower the thermal stability due to weaken hydrogen
bonding and the decreases of mobility cellulose chains in
cellulose [10].
4. CONCLUSION
In conclusion, the degradation temperature of
commercialized ABS filament is higher than neat ABS.
Besides, the thermal stability of kenaf fiber was
significantly lower than commercialized ABS filament
and neat ABS, so the increasing content of kenaf fiber in
reinforced ABS composites can reduced the thermal
stability of the composites. Therefore, 2.5% and 5% of
kenaf fiber reinforced ABS composites can be used as
filament in FFF since the extrude temperature use at 3D
printer is less than 250°C.
ACKNOWLEDGEMENT
The authors would like to acknowledge Faculty of
Mechanical Engineering, Faculty of Mechanical and
Manufacturing Engineering Technology of Universiti
Teknikal Malaysia Melaka and the financial supports
provided through grant no (PJP/2018/FTK(4A)/S01594).
REFERENCES
[1] MacDonald, E., & Wicker, R. (2016). Multiprocess
3D printing for increasing component functionality.
Science, 353(6307).
[2] Noorani, R. (2006). Rapid prototyping: principles
and applications. John Wiley & Sons Incorporated.
[3] Le Duigou, A., Castro, M., Bevan R., & Martin, N.
(2016). 3D printing of wood fibre biocomposites:
From mechanical to actuation functionality.
Materials & Design, 96, 106-114.
[4] Salem Bala, A., & bin Wahab, S. (2016). Elements
and materials improve the FDM products: A review.
In Advaced Engineering Forum, 16, 33-51.
[5] Ramamoorthy, S. K., Skrifvars, M., & Persson, A.
(2015). A review of natural fibers used in
biocomposites: plant, animal and regenerated
cellulose fibers. Polymer reviews, 55(1), 107-162.
[6] Torrado, A. R., Shemelya, C. M., English, J. D., Lin,
Y., Wicker, R. B., & Roberson, D. A. (2015).
Characterizing the effect of additives to ABS on the
mechanical property anisotropy of specimens
fabricated by material extrusion 3D printing.
Additive Manufacturing, 6, 16-29.
[7] Montalvo, J. I., & Hidalgo, M. A. 3D printing with
natural reinforced filaments. In Solid Freeform
Fabrication (SFF) Symposium, 922-934.
[8] Fauzi, F. A., Ghazalli, Z., Siregar, J. P., & Tezara, C.
(2016). Investigation of thermal behaviour for
natural fibers reinforced epoxy using
thermogravimetric and differential scanning
calorimetric analysis. In MATEC Web of
Conferences, 78.
[9] Azwa, Z. N., & Yousif, B. F. (2013). Thermal
degradation study of kenaf fiber/epoxy composites
using thermo gravimetric analysis. In Proceeding of
the 3rd Malaysian Postgraduate Conference (MPC
2013), 256-264.
[10] Aji, I. S., Zainudin, E. S., Khalina, A., Sapuan, S.
M., & Khairul, M. D. (2011). Thermal property
determination of hybridized kenaf/PALF reinforced
HDPE composite by thermogravimetric analysis.
Journal of thermal analysis and calorimetry,
109(2), 893-900.

Proceedings of Mechanical Engineering Research Day 2019, pp. 5-6, August 2019
__________
© Centre for Advanced Research on Energy
Pinless friction stir welding for weld thin plate cold rolled steel sheet Muhammad Aizat Mohd Abd Wahab1, Mohammad Khairul Azmi Mohd Kassim2, Mohammad Kamil Sued2,3,*,
Shikh Ismail Fairus Shikh Zakaria1, Siti Noor Najihah Mohd Nasir2
1) Fakulti Teknologi Kejuruteraan Mekanikal Pembuatan, Universiti Teknikal Malaysia Melaka,
Hang Tuah Jaya, 76100 Durian Tunggal, Melaka, Malaysia 2) Fakulti Kejuruteraan Pembuatan, Universiti Teknikal Malaysia Melaka,
Hang Tuah Jaya, 76100 Durian Tunggal, Melaka, Malaysia
3) Advance Manufacturing Centre, Universiti Teknikal Malaysia Melaka,
Hang Tuah Jaya, 76100 Durian Tunggal, Melaka, Malaysia
*Corresponding e-mail: [email protected]
Keywords: Pinless friction stir welding; process Parameter; SPCC
ABSTRACT – Pinless Friction Stir Welding provides
various advantages in designing tool compared to the
traditional Friction Stir Welding such as simple fixtures
and simpler tool. The relationship of parameters is
investigated by conducting a mechanical testing at the
welded workpieces. Temperature distribution and current
consumption during welding are recorded. Two set of
parameters used which are 900rpm and 1050rpm for
rotational speed; 45mm/min and 75mm/min for welding
speed. It shows that lower rotational speed with higher
welding speed is producing a higher strength weld which
132.34 MPa for tensile and around 150 HV for
microhardness. This technique are highly recommended
for aerospace application since having higher strength.
1. INTRODUCTION
Welding is a permanent process that joining two or
more parts by application of heat and pressure [1]. New
solid-state welding has been derived from Conventional
Friction Stir Welding (CFSW) which are Pinless Friction
Stir Welding (PFSW) [2]. In PFSW, tool design was an
important characteristic since it produces a uniformity of
welding joint. Furthermore, PFSW let the tool design to
be in various type of design since different type of tool
design produced a different heat during welding [3]. If
the metal flow is inconsistent or inadequate heat during
process, it leaded to the defects produce in welding
structure [4]. Basically, the application of pin in FSW are
resulting undesirable keyhole at welded area. The existed
of keyhole are inviting the corrosion at the welded part
[5]. Once the corrosion occurred at the welded area, it
reduced the weld strength.
2. METHODOLOGY
Type of material used in this study was Cold Rolled
Carbon Steel Sheet (SPCC) with 1mm thickness. The
SPCC sheet are 174mm in length with 140mm for width.
While for pinless tool, it was fabricate using tool steel,
H13. The dimension of the tool just consists of shoulder
and tool holder which are 10mm for shoulder diameter
and 20mm for tool holder diameter. To make sure all the
experiments are run smoothly, 3-axis Haas CNC Milling
machine has been applied as the FSW machine. During
this study, various of parameter are applied. However,
there is certain parameter from preliminary test that give
an acceptable weld product. Table 1 shows the parameter
that selected for this study.
Table 1 Parameter setup based on preliminary test.
Experiment Rotational
speed (rpm)
Welding speed
(mm/min)
Run 1 900 45
75
Run 2 1050 45
75
During PFSW process, data of temperature and
current are recorded. For the mechanical testing, tensile
and microhardness test were conducted. Testing are
running following ASTM E8 for tensile and ASTM E384
for microhardness. Maximum loaded used was 2kg with
10s of dwell time.
3. RESULTS AND DISCUSSION
Figure 1 and 2 shows the surface appearance after
running PFSW process. It shows the excessive of flash at
weld area. This happened due to the outflow of the
plasticized material that are underneath of the shoulder.
Furthermore, an insufficient heat during welding making
the process occur below the required temperature. By
looking at the welded area, there is a dark colour due to
the heat during welding process. However, the dark
colour is ununiform since thin plate are use in this study.
Therefore, the contact between pinless tool and
workpiece are not uniform. Moreover, by applying thin
material for this study, it was hard to get a smooth weld
result since thin material are easily to distort once having
higher temperature.
Figure 1 Visual inspection of this study; 900rpm with
75mm/min and 45mm/min.

Mohd Abd Wahab et al., 2019
6
Figure 2 Visual inspection of this study; 1050rpm with
75mm/min and 45mm/min.
Table 2 represent the result of tensile test for this
study. Based on the result recorded, it shows that
parameter applied give a huge influence for this study.
Moreover, higher welding speed are resulting to the
higher tensile strength. It was stated that the tensile
strength is improve by increasing of welding speed.
However, the result recorded are still below from the base
material resulted. It believed that stirring effect affected
the arrangement of particle inside the material. It was
stated that the stirring of particle that including heat are
changes the arrangement of the particle inside the
material.
Table 2 Results of tensile strength.
Experiment
Rotational
speed
(rpm)
Welding
speed
(mm/min)
Tensile
strength
(MPa)
Base
Material - - 194.04
Run 1 900 45 93.85
75 132.34
Run 2 1050 45 34.04
75 118.24
Figure 3 and 4 showing a similar pattern which are
the welded area having higher hardness value. The
hardness value decreased when the data recorded far
from welded area. This are because of the heat that
produced during process that make the welded area more
solid. Once the heat and force are focus on one spot, it
will improve the hardness.
Figure 3 Micro-hardness result; 900 rpm with
45mm/min and 75mm/min.
Figure 4 Micro-hardness result; 1050rpm with
45mm/min and 75mm/min.
However, there is flash at the welded part. This are
because of the outflow of material underneath the
shoulder due to the high plunging tool depth. Next, the
surface groove produced because of the abnormal stirring
since there is only flat surface at the shoulder.
4. CONCLUSION
Based on the result achieved, it shows that lower
rotational speed with a higher welding speed are giving
higher welding strength based on the tensile and micro-
hardness test. There is still some defects showing in the
welded product such as flash surface groove. Next, a
good heat generated during process will produced a good
quality of welding product.
ACKNOWLEDGEMENT
The author would like to thank the Universiti
Teknikal Malaysia Melaka (UTeM) and both faculty
which are Fakulti Teknologi Kejuruteraan Mekanikal
Pembuatan and Fakulti Kejuruteraan Pembuatan for
accepting this study.
REFERENCES
[1] Leitao, C., Emílio, B., Chaparro, B. M., &
Rodrigues, D. M. (2009). Formability of similar and
dissimilar friction stir welded AA 5182-H111 and
AA 6016-T4 tailored blanks. Materials &
Design, 30(8), 3235-3242.
[2] Liu, Z., Cui, H., Ji, S., Xu, M., & Meng, X. (2016).
Improving joint features and mechanical properties
of pinless fiction stir welding of alcald 2A12-T4
aluminum alloy. Journal of Materials Science &
Technology, 32(12), 1372-1377.
[3] Godiganur, V. S., & Biradar, S. (2014). Comparison
of friction stirs welding technique with
conventional welding methods. International
Journal of Research in Engineering and
Technology, 3, 572-6.
[4] Tan, C. W., Jiang, Z. G., Li, L. Q., Chen, Y. B., &
Chen, X. Y. (2013). Microstructural evolution and
mechanical properties of dissimilar Al–Cu joints
produced by friction stir welding. Materials &
Design, 51, 466-473.
[5] Kuang, B., Shen, Y., Chen, W., Yao, X., Xu, H.,
Gao, J., & Zhang, J. (2015). The dissimilar friction
stir lap welding of 1A99 Al to pure Cu using Zn as
filler metal with “pinless” tool
configuration. Materials & Design, 68, 54-62.
Proceedings of Mechanical Engineering Research Day 2019, pp. 7-9, August 2019
__________
© Centre for Advanced Research on Energy
Influence of process parameters on dimensional accuracy in GMAW based additive manufacturing
Nor Ana Rosli1, Mohd Rizal Alkahari1,2,*, Faiz Redza Ramli1,3, Shafizal Mat1,3, Ahmad Anas Yusof1,3
1) Fakulti Kejuruteraan Mekanikal, Universiti Teknikal Malaysia Melaka,
Hang Tuah Jaya, 76100 Durian Tunggal, Melaka, Malaysia 2) Advanced Manufacturing Centre, Universiti Teknikal Malaysia Melaka,
Hang Tuah Jaya, 76100 Durian Tunggal, Melaka, Malaysia 3) Centre for Advanced Research on Energy, Universiti Teknikal Malaysia Melaka,
Hang Tuah Jaya, 76100 Durian Tunggal, Melaka, Malaysia
*Corresponding e-mail: [email protected]
Keywords: 3D printing; additive manufacturing; wire arc additive manufacturing (WAAM)
ABSTRACT – Additive manufacturing (AM) or 3D
printing began to emerge as important manufacturing
technology. Wire and arc additive manufacturing
(WAAM) is one of the most promising among AM
technologies for metallic components. Their applicability
to produce fully dense metal parts and large near net
shape has attracted more attention from industries.
However, the most important barrier is the quality of the
printed parts which prevent its wider adoption. Currently,
only a few studies dedicated to the optimization of the
process parameters. Thus, the presented paper studies the
effect of welding voltage, travel speed and heat input on
percentage difference of height.
1. INTRODUCTION
The growth of 3D printing technology is
tremendously are in the extreme level. The technology
offers a promising way to produce any parts with
complex geometries directly from computer aided digital
designs. Clearly the advantage of AM it allows the
creation of internal feature that impossible to be produced
using conventional processing. WAAM systems require
and energy source, automatic wire feed system, computer
numerical controlled gantries or robotic system [1]. The
energy source used to melt the metal wire and deposition
of the metal.
However, WAAM process received less attention
than others AM technique. This due to unacceptable
surface finish of fabricated parts and resultant poor
geometrical accuracy always keep WAAM from an
industrial application such as aerospace and structural
industry [2]. Usually, in other to remove unwanted
geometry post-processing processes such as machining
are required for any components that are built by
depositing a series of overlapping beads using arc
welding. Upon selecting of geometrical parts, arc
welding and wire feed material contributes significantly
on process parameters. Therefore, wider commercial
uptake with WAAM is limited by the inability to work
with acceptable surface finish and geometry. Besides
that, determine the parameter setting is important for the
improvement of welding quality and reduction of cost.
Thus, this present study explores the effect of WAAM
process parameters on the geometrical characteristics of
metal deposited beads. The models in view of rectangular
metal deposited with size 50 mm x 10 mm x 40 mm.
2. EXPERIMENTAL SETUP
The test was performed using in house developed
3D printing system [3] which is integrated with Gas
Metal Arc Welding (GMAW) as shown in Figure 1. The
experiment has been carried out on a substrate of a mild
steel plate of 6 mm thickness, 300 mm long and 300 mm
wide. An ER 70S-6 server as a filler wire with 0.8 mm
diameter coaxial along GMAW. This work used the zig-
zag tool path pattern.
Figure 1 Experimental setup.
The process parameters involved as shown in Table
1. In order to ensure the depositing process steady, the 3D
printing speed was kept in the range from 20 to 80 mm/s.
The wire feed speed was set at 2800 mm/min. Welding
voltage was varied from 18.5 to 22.5 V. Meanwhile,
constant nozzle to plate distance, layer height and
welding current were used for deposition sample, which
was 5 mm, 2 mm and 100 A respectively. It should be
noted that the range of parameters is designed just seldom
used in practical application. A total of 9 samples were
printed using varying process parameters. The first five
samples with the varying voltage between 18.5 to 22.5 V
were printed. Next four samples were printed by varying
speed between 20 to 80 mm/s.
Table 1 Process parameters.
Parameter Range
Travel speed, v (mm/s) 20 – 80
Wire feed speed (mm/min) 2800.
Nozzle to plate distance (mm) 5
Layer height (mm) 2
Welding current, I (A) 100
Welding voltage, V (volt) 18.5 - 22.5
Rosli et al., 2019
8
3. RESULTS AND DISCUSSION
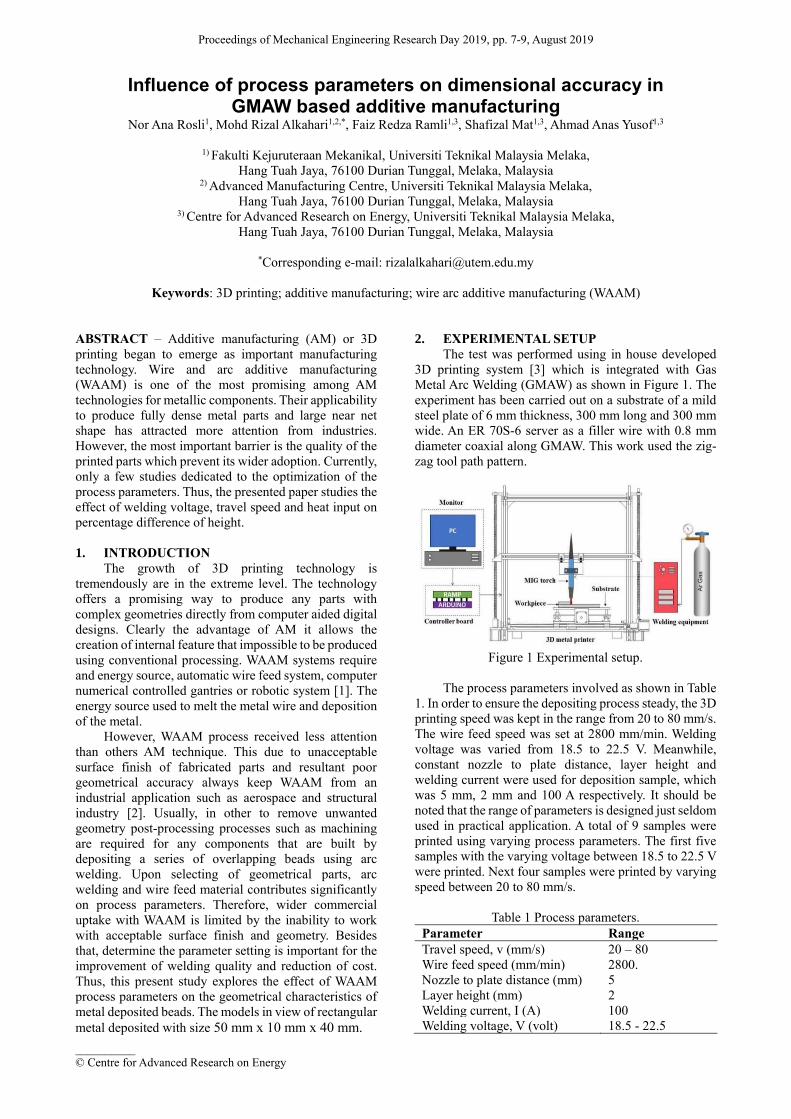
The result presented the effect of heat input on the
dimensional accuracy of height weld bead deposition.
The combination of welding voltage and travel speed
produce significance impact on accuracy due to
inappropriate heat input distribution. Figure 2 shows a
graphical way of illustration the percentage of
dimensional change in height due to heat input
distribution at a different voltage.
Figure 2 Relationship between the voltage, heat input
and percentage of dimensional change.
It can be observed form these graphs a clear direct
relation between heat input and voltage was identified.
The most striking result emerges from the less heat input
which produces the less dimensional change in height.
The minimum percentage difference was 6.75% at 18.5V
and heat input 1.776 kJ/s. These findings seem consistent
with other researcher perspectives with the influence of
heat input in acquired the acceptable geometrical
accuracy. Suryakumar concludes the great importance for
better geometric resolution is less heat input and better
heat distribution [4]. Due to continued deposition with
excessive heat input in the local area result in poor
dimensional tolerance and surface finish. The
relationship of speed, heat input, and dimensional change
is indicated in Figure 3. The graph shows gradually
decreasing of heat input while the travel speed is
increasing.
Figure 3 Relationship between the speed, heat input and
percentage of dimensional change.
The minimum percentage of dimensional change is
1% and slightly decrease than former experiments. The
greatest percentage difference of height about 21% at
travel speed 60 mm/s to 80 mm/s. It is noticeable that,
low heat input can be achieved by using higher speed.
However, unacceptable geometries were found if less
heat input and fast moving speed. It can be seen the
height of the deposited layers decrease with an increase
in travel speed. Higher speed is preferred to achieve high
productivity, but it should be appropriate with the
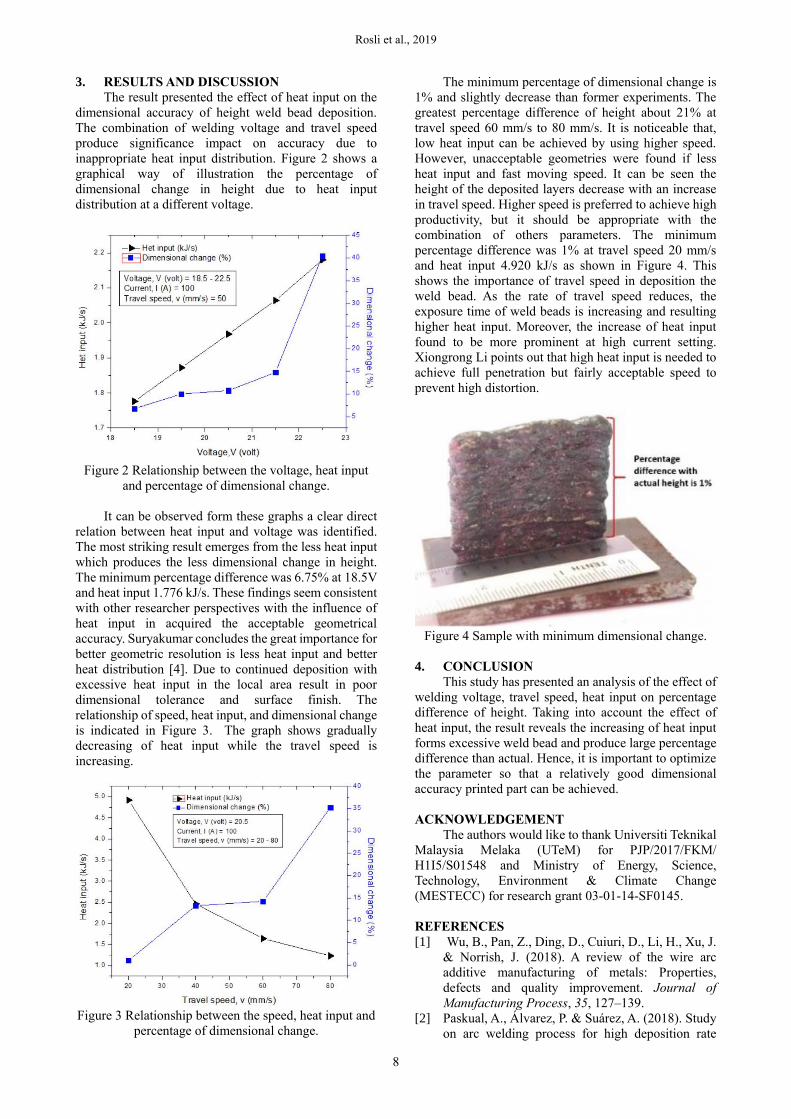
combination of others parameters. The minimum
percentage difference was 1% at travel speed 20 mm/s
and heat input 4.920 kJ/s as shown in Figure 4. This
shows the importance of travel speed in deposition the
weld bead. As the rate of travel speed reduces, the
exposure time of weld beads is increasing and resulting
higher heat input. Moreover, the increase of heat input
found to be more prominent at high current setting.
Xiongrong Li points out that high heat input is needed to
achieve full penetration but fairly acceptable speed to
prevent high distortion.
Figure 4 Sample with minimum dimensional change.
4. CONCLUSION
This study has presented an analysis of the effect of
welding voltage, travel speed, heat input on percentage
difference of height. Taking into account the effect of
heat input, the result reveals the increasing of heat input
forms excessive weld bead and produce large percentage
difference than actual. Hence, it is important to optimize
the parameter so that a relatively good dimensional
accuracy printed part can be achieved.
ACKNOWLEDGEMENT
The authors would like to thank Universiti Teknikal
Malaysia Melaka (UTeM) for PJP/2017/FKM/
H1I5/S01548 and Ministry of Energy, Science,
Technology, Environment & Climate Change
(MESTECC) for research grant 03-01-14-SF0145.
REFERENCES
[1] Wu, B., Pan, Z., Ding, D., Cuiuri, D., Li, H., Xu, J.
& Norrish, J. (2018). A review of the wire arc
additive manufacturing of metals: Properties,
defects and quality improvement. Journal of
Manufacturing Process, 35, 127–139.
[2] Paskual, A., Álvarez, P. & Suárez, A. (2018). Study
on arc welding process for high deposition rate

Rosli et al., 2019
9
additive manufacturing. Procedia CIRP, 68, 358-
362.
[3] Rosli, N.A., Alkahari, M.R., Ramli, F.R., Maidin,
S., Sudin, M.N., Subramoniam, S. & Furumoto, T.
(2018). Design and Development of a low cost 3D
metal printer. Journal of Mechanical Engineering
Research & Development, 41(3), 47-54.
[4] Suryakumar, S., Karunakaran, K.P., Bernard, A.,
Chandrasekhar, U., Raghavender, N. & Sharma, D.
(2011). Weld bead modeling and process
optimization in hybrid layered manufacturing.
Computer-Aided Design, 43(4), 331-344.

Proceedings of Mechanical Engineering Research Day 2019, pp. 10-11, August 2019
__________
© Centre for Advanced Research on Energy
Total volatile organic compound (TVOC) exposure from recycle polyamide nylon powder during selective laser sintering process
Amir Abdullah Muhamad Damanhuri1,*, A.Shamsul Rahimi A.Subki2, Azian Hariri3,
Muhammad Hafidz Fazli Md Fauadi4, Mohammad Rafi Omar1, Abdul Munir Hidayat Shah Lubis1
1) Fakulti Teknologi Kejuruteraan Mekanikal dan Pembuatan, Universiti Teknikal Malaysia Melaka,
Hang Tuah Jaya, 76100 Durian Tunggal, Melaka, Malaysia
2) Fakulti Teknologi Kejuteraan Elektrik dan Elektronik, Universiti Teknikal Malaysia Melaka,
Hang Tuah Jaya, 76100 Durian Tunggal, Melaka, Malaysia 3) Fakulti Kejuteraan Mekanikal dan Pembuatan, Universiti Tun Hussein Onn Malaysia,
86400, Parit Raja, Bt Pahat, Johor, Malaysia 4) Fakulti Kejuteraan Pembuatan, Universiti Teknikal Malaysia Melaka,
Hang Tuah Jaya, 76100 Durian Tunggal, Melaka, Malaysia
*Corresponding e-mail: [email protected]
Keywords: Total volatile organic compound; selective laser sintering; exposure
ABSTRACT – Polyamide nylon (PA12) is semi
crystalline polymers that are common materials use in
selective laser sintering (SLS) process. Usually,
unsintered powder will be recycled to used back for SLS
printing. Therefore, this study investigates the exposure
of total volatile organic compound (TVOC) from recycle
polyamide nylon during SLS printing process. Prior to
the investigation, the recycle powder was sent for
thermogravimetric analysis (TGA). Calibration block
was set to be print SLS machine, filled with 30kg of
powder. Real time sampling was accordingly to Industry
Code of Practice by DOSH Malaysia for 8 hours indoor
sampling. TGA revealed that no composition loss during
normal sintered temperature. The highest TVOC
emission present at post printing process (powder cake
breakout) of 1.7ppm. Mitigation strategies are suggested
to reduced occupational exposure of TVOC emission to
the SLS operators.
1. INTRODUCTION
Nowadays, 3D printer is now a common machine to
general public due to its rapid prototyping. Military,
medical devices, aerospace and automotive are fields that
use additive manufacturing (AM) of 3D printer to print
their prototype and products. There are several type of
AM categories such as photo polymerization, material
extrusion, powder bed fusion, direct energy deposition,
sheet lamination, material jetting, and binder jetting.
Selective laser sintering meanwhile includes in the
category of powder bed fusion [1]. Polymers powder
especially polyamide nylon are common material used in
SLS. During SLS printing process, only powder which
heated by the scanning action will crystallize to become
the final product, and others remain and turn to recycled
powder. However, the use of these powder in
nontraditional manufacturing environments may pose
health risks to group of people that are handling SLS
printing process. AM machine can release volatile
organic compounds chemical and particles into air while
printing processes [2]. They are not built with air
cleaning system; the situation could be worst if use in an
enclosed space without proper air flow or ventilation.
Studies show that VOC have negative impacts on human
and environmental health [3]. Therefore, this study aims
to investigates the exposure of total volatile organic
compound (TVOC) during 3D printing of SLS process
from recycle powder of polyamide nylon (PA12).
2. METHODOLOGY
The recycle polyamide nylon powder were
collected from SLS Laboratory Fakulti Teknologi
Kejuteraan Mekanikal dan Pembuatan, FTKMP of
Universiti Teknikal Malaysia Melaka (2°16'40.4"N
102°16'32.4"E).The powder has been heated 172 °C laser
temperature during 3D printing previously. Prior to the
exposure analysis, the recycle powder were sent for
Thermogravimetric Analysis (TGA) using Thermal
Gravimetric Analyzer Linseis Model. Thermal analysis
was conducted at room temperature until 600 °C with
heating rate of 10 °C/min. The SLS 3D printer use for this
project is Farsoon SS402P that operated with scanner of
dynamic focusing, high accuracy galvo scanning system.
The machine has external dimension size of 2660mm x
1540mm x 2150mm with weight of 3000 kg. The
maximum printing prototype are 350 mm x 350 mm x
350 mm with capacity of 60kg powder. The type of laser
is carbon dioxide (CO2) with 100W power, and laser
wave length is 0.3 mm with scanning speed of 12.7 m/s.
The thickness of powder layer for every rotating roller
pass through was set to be 0.2mm. The sintered
temperature of powder chamber was set to 190℃.
Calibration block with dimension of 56 mm X 56 mm and
9 mm thickness was set to be print with 30kg of recycle
powder [4]. The TVOC emission monitoring from SLS
printing process divided into four phases [5], where: a)
pre-printing, b) powder preparation (mixing powder), c)
printing, and d) post printing.
Indoor sampling was perform in SLS Laboratory of
FTKMP accordingly to DOSH Malaysia Indoor Air
Quality Code of Practice (ICOP DOSH 2010) [6]. The
laboratory was divided into two rooms as depicted at
Figure 1. To measure the TVOCs, a ppbRAE monitor
(ppbRAE 3000, USA, RAE System Inc) was used for real
time sampling of 8 hours printing process. The
instrument set to be 1 meter from floor, at 5 minutes

Damanhuri et al., 2019
11
interval sampling.
Figure 1 SLS Laboratory and sampling locations.
3. RESULT AND DISCUSSION
Thermogravimetry analysis (TGA) and Difference
Thermo Gravimetry (DTG) are plotted in Figure 2. TGA
present several step of mass loss from recycle polyamide
nylon namely (i) at temperature around 300ºC, a low
level of water absorption which is about 10% was
observed, (ii) at around 300ºC to 400ºC with another 10%
loss, (iii) at around 400ºC to 480ºC, corresponds to the
most important mass loss during thermal decomposition
and (iv) final mass loss at 550ºC [7].
0 100 200 300 400 500 600
0
20
40
60
80
100
Deriv weight
Weight (%)
Temperature (C)
Wei
ght (
%)
-4
-2
0
2
4
6
8
10
12
14
16
18
20
Der
iv w
eigh
t (%
/min
)
Figure 2 TGA and DTG analysis.
0 30 60 90 120 150 180 210 240 270 300 330 360 390 420 450 4800.0
0.1
0.2
0.3
0.4
0.5
0.6
0.7
0.8
0.9
1.0
1.1
1.2
1.3
1.4
1.5
1.6
1.7
1.8
TV
OC
avg
(p
pm
)
Time (minutes)
TVOC avg
Pre printing
Powder preparation
(mixing powder)SLS printing
Post printing
(powder cake breakout)
1.7 ppm
TVOC significantly
increases
Figure 3 TVOC exposure during SLS printing process.
The emission of TVOC from SLS printing process
were depicted at Figure 3. The TVOC slowly increase
during preparation powder phase and maintain at a
constant amount during SLS printing prototype.
However, the emission gradually increases and at 360
minutes, where powder cake was taken out from SLS
chamber for powder cake breakout phase and same
agreement with Preez S.D. et al,.[5]. The TVOC shows
highest value of emission at 410 minutes (1.7ppm). The
influence of powder cake temperature significantly
increase the emission of TVOC [3].
4. CONCLUSION
In this study, the TVOC emission from recycle
polyamide nylon (PA12) was present. The TGA analysis
shows there was no significant amount of thermal
composition lost at normal sintered temperature (200 °C).
Meanwhile, the TVOC emission hit the highest value
during post printing process. The emission increases
slowly at the beginning of process, and stable during SLS
printing phase. The present of TVOC emission during
SLS printing process shows potential health hazard to the
operators. Mitigation strategies such ventilation and
suitable personal protective equipment are necessary to
make sure operators works in safe environment.
ACKNOWLEDGEMENT
The author would like to gratitude and acknowledge
Universiti Teknikal Malaysia Melaka for the funding
under short term grant, UTeM/PJP/2018/FTK
(11A)/S01612.
REFERENCE
[1] Prakash, K. S., Nancharaih, T., & Rao, V. S. (2018).
Additive Manufacturing Techniques in
Manufacturing-An Overview. Materials Today:
Proceedings, 5(2), 3873-3882.
[2] Azimi, P., Zhao, D., Pouzet, C., Crain, N. E., &
Stephens, B. (2016). Emissions of ultrafine particles
and volatile organic compounds from commercially
available desktop three-dimensional printers with
multiple filaments. Environmental Science &
Technology, 50(3), 1260-1268.
[3] Damanhuri, A. A. M., Leman, A. M., Abdullah, A.
H., & Hariri, A. (2015). Effect of toner coverage
percentage and speed of laser printer on total
volatile organic compound (TVOC). Chemical
Engineering Transactions, 45, 1381-1386.
[4] Afshar-Mohajer, N., Wu, C. Y., Ladun, T., Rajon, D.
A., & Huang, Y. (2015). Characterization of
particulate matters and total VOC emissions from a
binder jetting 3D printer. Building and
Environment, 93, 293-301.
[5] Du Preez, S., Johnson, A., LeBouf, R. F., Linde, S.
J., Stefaniak, A. B., & Du Plessis, J. (2018).
Exposures during industrial 3-D printing and post-
processing tasks. Rapid Prototyping Journal, 24(5),
865-871.
[6] [6] DOSH Malaysia. (2010). Industry code of
practice on indoor air quality 2010, JKKP DP (S)
127/379/4-39. 1-50.
[7] Chen, P., Wu, H., Zhu, W., Yang, L., Li, Z., Yan,
C., ... & Shi, Y. (2018). Investigation into the
processability, recyclability and crystalline
structure of selective laser sintered Polyamide 6 in
comparison with Polyamide 12. Polymer
Testing, 69, 366-374.
Equipment
A SLS 3D Printer
B Exhaust Fan (SLS
coolant)
C Powder Cleaning
Device
D Powder Mixing
Machine
E Sand Blasting
Machin
S1 Sampling Point 1
S1 Sampling Point 2
Legends

Proceedings of Mechanical Engineering Research Day 2019, pp. 12-13, August 2019
__________
© Centre for Advanced Research on Energy
Factors for increasing additive manufacturing (3D printing) Ai Nurhayati*, Ahmad Rivai, Rina Indrayani
Faculty of Industrial Engineering, Sekolah Tinggi Teknologi Bandung, Soekarno-Hatta, 378 Bandung, Indonesia
*Corresponding e-mail: [email protected]
Keywords: 3D printing; analysis factors; SPSS
ABSTRACT – 3D printing is needed in the industrial
world, especially for prototyping. The problem found is
that the product results are not as expected by consumers.
The purpose of this research is to find out what factors
can improve 3D printing products to meet user
expectations. This research uses factor analysis method
with SPSS version 25 software to find out factors that can
improve 3D printing products. The results of the analysis
show that the output material factor of 3D printing is the
main factor for the improvement of 3D printing products.
1. INTRODUCTION
Additive manufacturing is often referred to as 3D
printing. There are several general steps in the 3D
printing process. The generic Additive Manufacturing
(AM) process is [1]:
(a) Step 1: CAD
(b) Step 2: Conversion to STL
(c) Step 3: Transfer to AM machine and STL File
Manipulation
(d) Step 4: Machine Setup
(e) Step 5: Build
(f) Step 6: Removal
(g) Step 7: Post-processing
(h) Step 8: Application
The consumption growth rate of 3D printing is
increasing year by year as shown in Figure 1. The level
of 3D printing needs is predicted to continue to rise to
reach $ 21 billion by 2020 in the international world. This
is a good opportunity for Indonesia to be able to increase
3D printing manufacturers in the country of Indonesia.
Figure 1 The growth rate of 3D printing [2].
The majority of the use of 3D printing in the world
is to make prototypes by 55% as shown in Figure 2. The
department that most often uses 3D printing is the
research and development department as shown in Figure
3.
Figure 2 3D printing applications [3].
Figure 3 3D printing users by the department [3].
3D printing is very attractive to the Indonesian
people, especially for the purpose of making prototypes.
The problem found is that the product results are not as
expected. The problem is to find out what factors can
improve 3D printing products in order to meet the
expectations of the Indonesian people. 3D printing
manufacturers need to know what factors need to be
improved in developing 3D printing products to be useful
in accordance with customer expectations. The purpose
of this research is to find out what factors can improve
3D printing products to meet user expectations. Several
factors were considered in focus group discussions that
could affect the performance improvement of 3D printing
products. There are 8 factors as follows: time, cost,
quality, material, effect, simple, easy to use, and color. In
this study using the factor analysis method through the
SPSS version 25 software program.
2. METHODOLOGY
Factor analysis is a statistical method used to
describe variability among observed, correlated variables
in terms of a potentially lower number of unobserved
variables called factors. Factor analysis is a multivariate
Nurhayati et al., 2019
13
analysis method used to group large numbers of variables
into a small group of variables. The aim of all factor
analytic techniques is to explain patterns of covariation
among observed variables using unobserved constructs
[4]. Factor analysis is one method that is useful for
establishing evidence for validity [5]. Factor analysis
method allows us to describe many variables using a few
factors. This method helps us to select a small group of
variables of representative variables from a larger set. In
factor analysis we represent the variables y1, y2,.., yp as
linear combinations of a few random variables f1, f2,... ,
fm (m < p) called factors [6]. Factor analysis decision
process [7]:
(a) The objective of factor analysis
(b) Designing a factor analysis
(c) Assumptions in factor analysis
(d) Deriving factors and assessing the overall fit
(e) Interpreting the factors
(f) Validation of factor analysis
(g) Additional uses of factor analysis results.
The use of factor analysis is widespread; examples
can be found in highly ranked journals in many
disciplines, including industrial engineering, economics,
and manufacture [8]. The method used in this study is
factor analysis using SPSS version 25 software.
3. RESULTS AND DISCUSSION
Based on the results of interviews and field surveys
that are discussed and considered in focus group
discussions, there were 8 variables that influenced the
improvement of 3D printing tools. These variables are
time, cost, quality, material, effect, simple, easy to use,
and color. From the eight variables then processed by
factor analysis method use SPSS version 25 software.
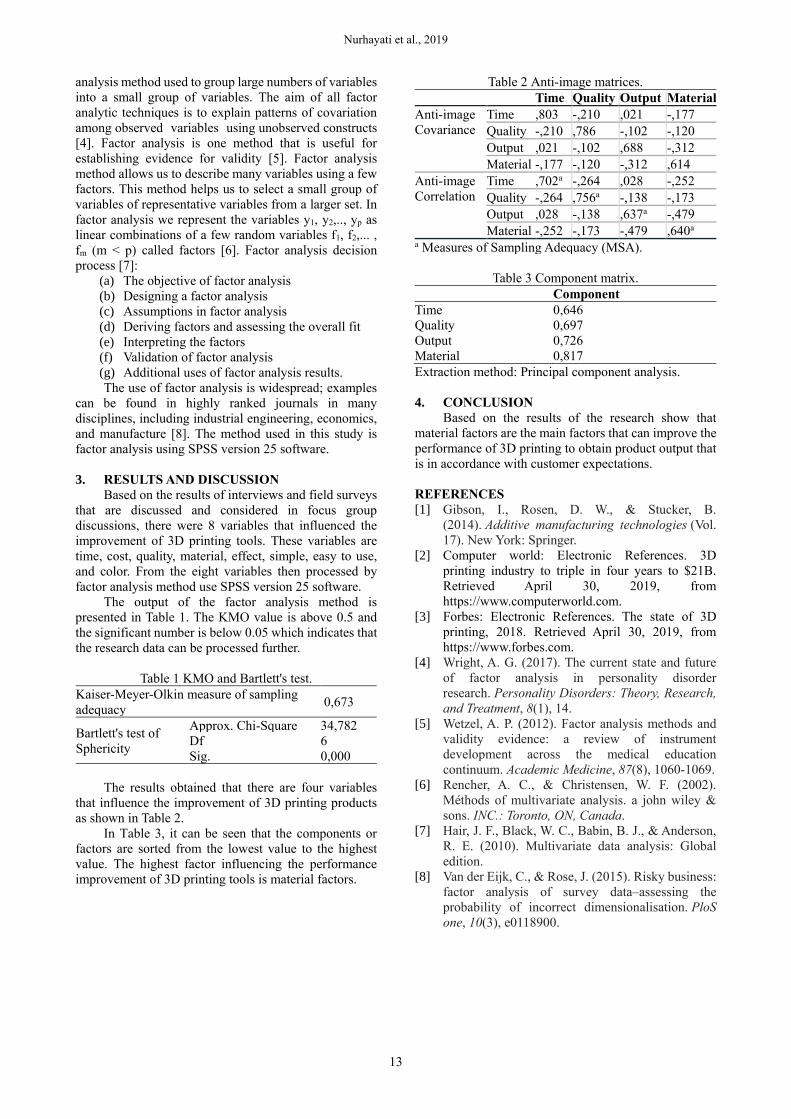
The output of the factor analysis method is
presented in Table 1. The KMO value is above 0.5 and
the significant number is below 0.05 which indicates that
the research data can be processed further.
Table 1 KMO and Bartlett's test.
Kaiser-Meyer-Olkin measure of sampling
adequacy 0,673
Bartlett's test of
Sphericity
Approx. Chi-Square 34,782
Df 6
Sig. 0,000
The results obtained that there are four variables
that influence the improvement of 3D printing products
as shown in Table 2.
In Table 3, it can be seen that the components or
factors are sorted from the lowest value to the highest
value. The highest factor influencing the performance
improvement of 3D printing tools is material factors.
Table 2 Anti-image matrices.
Time Quality Output Material
Anti-image
Covariance
Time ,803 -,210 ,021 -,177
Quality -,210 ,786 -,102 -,120
Output ,021 -,102 ,688 -,312
Material -,177 -,120 -,312 ,614
Anti-image
Correlation
Time ,702a -,264 ,028 -,252
Quality -,264 ,756a -,138 -,173
Output ,028 -,138 ,637a -,479
Material -,252 -,173 -,479 ,640a a Measures of Sampling Adequacy (MSA).
Table 3 Component matrix.
Component
Time 0,646
Quality 0,697
Output 0,726
Material 0,817
Extraction method: Principal component analysis.
4. CONCLUSION
Based on the results of the research show that
material factors are the main factors that can improve the
performance of 3D printing to obtain product output that
is in accordance with customer expectations.
REFERENCES
[1] Gibson, I., Rosen, D. W., & Stucker, B.
(2014). Additive manufacturing technologies (Vol.
17). New York: Springer.
[2] Computer world: Electronic References. 3D
printing industry to triple in four years to $21B.
Retrieved April 30, 2019, from
https://www.computerworld.com.
[3] Forbes: Electronic References. The state of 3D
printing, 2018. Retrieved April 30, 2019, from
https://www.forbes.com.
[4] Wright, A. G. (2017). The current state and future
of factor analysis in personality disorder
research. Personality Disorders: Theory, Research,
and Treatment, 8(1), 14.
[5] Wetzel, A. P. (2012). Factor analysis methods and
validity evidence: a review of instrument
development across the medical education
continuum. Academic Medicine, 87(8), 1060-1069.
[6] Rencher, A. C., & Christensen, W. F. (2002).
Méthods of multivariate analysis. a john wiley &
sons. INC.: Toronto, ON, Canada.
[7] Hair, J. F., Black, W. C., Babin, B. J., & Anderson,
R. E. (2010). Multivariate data analysis: Global
edition.
[8] Van der Eijk, C., & Rose, J. (2015). Risky business:
factor analysis of survey data–assessing the
probability of incorrect dimensionalisation. PloS
one, 10(3), e0118900.

Proceedings of Mechanical Engineering Research Day 2019, pp. 14-15, August 2019
__________
© Centre for Advanced Research on Energy
Effects of current and wire feed direction in WAAM-TIG Johnnie Liew Zhong Li1, Mohd Rizal Alkahari1,2,*, Nor Ana Rosli1, Faiz Redza Ramli1,3, Rafidah Hasan1,3
1) Fakulti Kejuruteraan Mekanikal, Universiti Teknikal Malaysia Melaka,
Hang Tuah Jaya, 76100 Durian Tunggal, Melaka, Malaysia 2) Advanced Manufacturing Centre, Universiti Teknikal Malaysia Melaka,
Hang Tuah Jaya, 76100 Durian Tunggal, Melaka, Malaysia 3) Centre for Advanced Research on Energy, Universiti Teknikal Malaysia Melaka,
Hang Tuah Jaya, 76100 Durian Tunggal, Melaka, Malaysia
*Corresponding e-mail: [email protected]
Keywords: 3D printing; additive manufacturing; wire arc additive manufacturing (WAAM)
ABSTRACT – WAAM-TIG has many parameters
affecting the fabricated structure. This paper reports the
effect of current and wire feed direction on the weld bead
of TIG. Detail design and experimental set up are
provided. Different current values and wire speed
direction are tested. The structure of specimens is
tabulated, compared and analyzed. The current and wire
feed direction can significantly affect the fabricated metal
part. The optimal current range for this open sources TIG
3D metal printer is 75A to 85A. Front wire feedstock
direction is recommended in WAAM-TIG.
1. INTRODUCTION
Wire arc additive manufacturing (WAAM) is
increasingly being used worldwide due to its capabilities
of reducing the cost and time. Generally, AM technology
was invented to remove the limitation of traditional
subtractive manufacturing (SM) [1]. There are three
types commonly used heat sources used in WAAM which
are metal inert gas welding (MIG), tungsten inert gas
welding (TIG) and plasma arc welding (PAW) [2].
WAAM-MIG process is easier and more convenient
compared to WAAM-TIG and WAAM-PAW due to its
continuous wire spool with the welding torch which does
not have wire feed direction problem. MIG uses a direct
feeding spool system which is the MIG wire feed is
coaxially with the welding torch and does not encounter
the problem of wire feed angle and orientation. Unlike
MIG, tungsten inert gas welding (TIG) and plasma arc
welding (PAW) need an external wire feed machine to
supply the additive materials. Angles and positions of
the external wire feed can affect the quality and
appearance of the weld bead. TIG deposition rate is around 1kg/h [3]. TIG
welding process is normally used to consolidate thin and
middle-sized metal by melting it with an arc that created
between non- consumable electrode and the workpiece
with the existence of inert gas such as argon and helium
gas. Shielding gases play a role to shelter the weld pool
from being oxidized and contaminated. In this research,
the effect of current and wire feed direction in TIG are
studied.
2. METHODOLOGY
A 20mm×20mm of a square single line is drawn by
using CATIA. The experiment was carried out on an
aluminum plate. An open source 3D printing is used with
CEA MATRIX 400 AC/DC TIG welder is used as the
heat source. ER5356 aluminum rod is used as the
feedstock. The schematic diagram of the machine setup
is shown in Figure 1.
Figure 1 Schematic diagram of machine setup.
Table 1 Parameters setting.
Parameter Unit Values
Current A 65 - 85
Wire feed angle degree 45
Wire feed rate mm/min 1200
Travel speed mm/s 1.5
Stand-off distance mm 5
Voltage V 65
The machine and welding parameter are shown in
Table 1. 20mm×20mm square line was printed with
different current. The wire feed stock was placed on three
different directions as shown in Figure 2. The sample is
print from the starting point to point 1 in -ve x-direction
which the wire feed is placed in front of the torch.
Direction B is print from point 1 to point 2 in -ve y-
direction which the wire feed is in the side position
whereas direction C prints from point 2 to point 3 in +ve
x-direction as the wire feed position is behind the torch.
Direction D is print from point 3 to ending point which is
the wire feed position is same as direction B.
3. RESULTS AND DISCUSSION
All samples were successfully fabricated. Figure 3
shows the comparison of weld bead width with different
current values and directions. The molten pool size is
getting larger as the current value increases and affecting
weld bead width. The sample 65A and 70A produce a
little droplets deposition and discontinuous deposition
respectively. It was shown that the range 65A to 70A

Li et al, 2019
15
could not melt the aluminum rod as shown in Figure 3(a)
and 3(b). The continuous deposition was achieved when
the current set to 75A. Unfortunately, the weld bead is
overlapped in direction C in which the wire feedstock is
placed behind the torch. For sample 80A, the single layer
was fabricated better than sample 75A as the deposition
is smooth and no defects or overlap occur in all
directions. Deposition of sample 80A and sample 85A are
alike but the weld bead width of the sample 85A is wider.
It is because of the heat affected zone (HAZ) for sample
85A is higher than 80A. The range of HAZ is depending
on the rate of heat input and the heat input increases as
the current increases [4]. Thus, the width of sample 85A
is wider than sample 80A. Wire feeding direction can
affect the waveform and width of the single weld bead
layer. The width of direction A, B, C and D for sample
80A are 6.60mm, 6.15mm, 7.61mm, and 7.98mm
respectively. Direction A and B ‘s weld bead is more
constant than direction C and D. The conditions of the
welding process can be indicated through the weld bead
appearance. The welding process and deposition looks
stable at current 80A. However, things changed in
different wire feed directions. It was obviously shown
that the direction A which is the wire feed placed in front
of the torch has the best weld bead appearance compares
to other wire feed directions [5]. The overlap commonly
occurred in the direction C which the wire feed is placed
behind the torch as shown in Figure 3(c), (d) and (e).
Figure 2 Wire feed direction.
Based on the results, 80A has the most satisfied
weld bead appearance in direction A where the wire feed
is placed in front of the torch. Thus, five layers specimen
was fabricated using 80A in direction A as shown in
Figure. The specimen was fabricated layer upon layer and
form into a rectangular wall. The height 11mm which is
2mm taller than the CAD dimension. Inclusion and
depression were found in the fabricated rectangular wall.
This phenomenon occurs are generally due to the
imperfection in wire especially the wire rod is twisted.
4. CONCLUSION
The current and wire feed direction can
significantly affect the fabricated metal part. The optimal
current range for this open sources TIG 3D metal printer
is 75A to 85A. Front wire feedstock direction is
recommended in WAAM-TIG. Multiple layers are
possible to be fabricated with suitable parameter and it
can be explored detailly in future. However, the
application of TIG in WAAM requires modification on
the wire feeding system as the WAAM-TIG very much
dependent on the wire position which affects its
dimension accuracy.
Figure 3 Deposition of sample at (a) 65A, (b) 70A, (c)
75A, (d) 80A & (e) 85A.
Figure 4 Inclusion and depression occurred on five
layers specimen using WAAM-TIG at 80A and
Direction A (front wire feed).
ACKNOWLEDGEMENT
The authors would like to thank Universiti Teknikal
Malaysia Melaka (UTeM) and Ministry of Energy,
Science, Technology, Environment & Climate change
(MESTECC) for research grant 03-01-14-SF0145.
REFERENCES
[1] Rosli, N. A., Alkahari, M. R., Ramli, F. R., Maidin,
S., Sudin, M. N., Subramoniam, S., & Furumoto, T.
(2018). Design and development of a low-cost 3D
metal printer. Journal of Mechanical Engineering
Research and Developments, 41(3), 47-54.
[2] Xiong, J., Lei, Y. Y., Chen, H., & Zhang, G. J.
(2017). Fabrication of inclined thin-walled parts in
multi-layer-single-pass GMAW-based additive
manufacturing with a flat position deposition.
Journal of Materials Processing Technology, 240,
397-410.
[3] Almeida, P. S., & Williams, S. (2010). Innovatie
process model of Ti-6Al-4V additive layer
manufacturing using cold metal transfer (CMT).
Proceeding of the 21st Annual International Solid
Freeform, Unvinersity of Texas Austin.
[4] Mamat, S., & Jamlan, S. (2015). Effect of welding
heat input on microstructure and mechanical
properties at coarse grain heat affected zone ABS
grade a steel. ARPN Journal of Engineering and
Applied Sciences. 10(20), 9487-9495.
[5] Ding, D. H., Pan, Z. X., Cuiuri, D., & Li, H. J.
(2015). Wire-feed additive manufacturing of metal
components: technologies, develpoments and future
interests. International Journal of Advanced
Manufacturing Technology. 81(1-4), 465-481.

Proceedings of Mechanical Engineering Research Day 2019, pp. 16-18, August 2019
__________
© Centre for Advanced Research on Energy
Electromyography sensing on tibialis and peroneus muscle against improvised flat feet orthotic insole
Umi Hayati Ahmad*, Nuratifah Abdul Kudus, Mohd Hidayat Ab Rahman, Nurul Syifaa’ Jamaluddin
Fakulti Teknologi Kejuruteraan Mekanikal dan Pembuatan, Universiti Teknikal Malaysia Melaka,
Hang Tuah Jaya, 76100 Durian Tunggal, Melaka, Malaysia
*Corresponding e-mail: [email protected]
Keywords: Orthotic; flatfeet; tibialis peroneus
ABSTRACT – The objectives of this paper are to
investigate the muscle activity against improvised flat
feet orthotics insole using electromyography. Length,
width and thickness of orthotics insole are based on
average size of flat feet respondents. Flexifoam X were
filled up in the fabricated wood mould. The comparison
between fabricated and existing orthotics insole shows
different result during evaluation using
electromyography on tibialis anterior and peroneus
longus generated by muscle strength responsible for
lower limb movement. The different material for each
insole contributes to vary result on average median
frequency and root mean square that produce by the
muscle from each respondent.
1. INTRODUCTION
Walking is when only one foot at a time leaves
contact with the ground. According to research, the
average human walks a day is about three thousand steps.
Running is when both feet are off the ground with each
step. Running is a method of terrestrial locomotion
allowing humans to move rapidly on foot that is related
to the movement of the lower limb. Brown, C. [1] stated
that in 1865, Everett H. Dunbar makes a breakthrough by
inventing an arch support orthotic Arch orthotics is a shoe
insole that is design like the shape of an arch and it is a
function to provide support or cushion to feet and help to
curb pain on feet. Everett H. Dunbar inserts a layer of
leather between the insole and outsole of the shoe that is
shaped like an arch which resembles the shape of feet.
While in 1905, Whitman Brace invents the first full foot
orthotic that is made of heavy metal.
According to Bateni, H. [2] the orthotics insole can
provide postural stability and reduce foot pain for the
sports usage. Mercer and Horsch [3] stated that orthotic
insoles can support the feet controlling abnormal for
motion in order to prevent it from moving inward or
outward. This study aims to improve the efficiency of the
orthotic insole for flat feet focus on sports usage and
measure the muscle fatigue using electromyography on
tibialis and peroneus muscles.
2. METHODOLOGY
Questionnaire has been distributed among students
in UTeM in order to know the population of flat feet in
UTeM (N=40), the flat feet respondents amongst them
are only (N=8). Morphological chart as shown in Figure
1 and concept screening were used in this study to
generate suitable design for flat feet correspondent based
on their requirement during survey.
Figure 1 Morphological chart of orthotic insole
characteristic.
There are main characteristics of orthotics insole
that help a person with flat feet to reduce the pain during
sports activities, they are deep heel cup, heel pad,
metatarsal pad, and sufficient arch support. This
improvised orthotic insole is designed with standard
dimensions from both male and female.
Figure 2 Characteristic of fabricated orthotic insole.

Ahmad et al., 2019
17
Figure 3 Fabrication of orthotic insole.
Figure 4 Fabricated insole with existing insole.
3. RESULTS AND DISCUSSION
Wireless sensors are set on lower limb muscles of
tibialis anterior and peroneus longus muscles. EMG
signal is recorded and collected via the wireless
connections between the Trigno EMG sensors from
Delsys and Trigno Wireless Foundation System. The
Trigno EMG sensors are transmitted and gathered signals
in the Trigno Wireless Foundation System. The collected
data are filtered and been analysis by using time domain
analysis which is the root mean square (RMS).
The RMS amplitude obtain for tibialis anterior
muscle and peroneus muscle for fabricating and existing
insole, each respondent portrays different value of
muscle fatigue for left and right side of tibialis anterior
and peroneus longus muscles. Many factors influence the
muscle fatigue of the people. According to Mehta and
Shortz [4], obesity may influence the alteration of muscle
fiber type composition.
Figure 5 Average RMS amplitude on tibialis anterior
muscle.
Figure 5 Average RMS amplitude on peroneus longus
muscle.
Figure 6 Average median frequency on tibialis anterior
muscle.
Figure 7 Average median frequency on peroneus longus
muscle.
4. CONCLUSION
The comparison of the measured data of
electromyography (EMG) on time domain analysis with
RMS amplitude and median frequency (MDF) for the
fabricating insole and the existing insole showed that the
fabricating insole is suitable and give slightly better
performance compared to the existing insole, thus the
objective of the study is achieved.
ACKNOWLEDGEMENT
The authors gratefully acknowledge the support of
Universiti Teknikal Malaysia Melaka through Short Term
Grant PJP/2018/FTK (14D)/S01640.
REFERENCES
[1] Brown, C. (2013). Clinical Advantage: Making
Your Own Temporary Foot Orthosis. Orthopaedic
Practice, (26;3:14), 204-205. Retrieved from
https://www.orthopt.org/uploads/content_
files/files/FASIG26.3.pdf
[2] Bateni, H. (2013). Changes of postural steadiness
following use of prefabricated orthotic

Ahmad et al., 2019
18
insoles. Journal of Applied Biomechanics, 29(2),
174-179.
[3] Mercer, J. A., & Horsch, S. (2015). Heel–toe
running: A new look at the influence of foot strike
pattern on impact force. Journal of Exercise Science
& Fitness, 13(1), 29-34.
[4] Mehta, R. K., & Shortz, A. E. (2014). Obesity-
related differences in neural correlates of force
control. European Journal of Applied
Physiology, 114(1), 197-204.

Proceedings of Mechanical Engineering Research Day 2019, pp. 19-20, August 2019
__________
© Centre for Advanced Research on Energy
Topological optimized engine bracket for additive manufacturing Faiz Redza Ramli1,2,*, Zaitul Akma Said1, Mohd Rizal Alkahari1,3, Shafizal Mat1,2, Mohd Nizam Sudin1,2
1) Fakulti Kejuruteraan Mekanikal, Universiti Teknikal Malaysia Melaka,
Hang Tuah Jaya, 76100 Durian Tunggal, Melaka, Malaysia 2) Centre for Advanced Research on Energy, Universiti Teknikal Malaysia Melaka,
Hang Tuah Jaya, 76100 Durian Tunggal, Melaka, Malaysia 3) Advance Manufacturing Centre, Universiti Teknikal Malaysia Melaka,
Hang Tuah Jaya, 76100 Durian Tunggal, Melaka, Malaysia
*Corresponding e-mail: [email protected]
Keywords: Topology optimization; 3D Printing; additive manufacturing
ABSTRACT – Engine bracket plays a crucial role in
the design of an aircraft where the bracket mass directly
influences the performance of aircraft. The objective of
this paper is to obtain a fully optimized lightweight of
engine bracket design with capability to withstand the
load of the engine by using topology optimization
technique and to identify the target specification
baseline in terms of raw material mass, support material
mass and printing time of additive manufacturing. Two
topology optimization engine designs were studied by
using SolidThinking Inspire. Afterwards the optimize
design was compared with 300 existing topology
optimized. The mass of engine bracket has been
successfully reduced by 49% from original design
without sacrificing the performance. Based on the
baseline, the design is acceptable with range of 75%
from all the 300 existing topological design.
1. INTRODUCTION
An engine bracket is commonly fabricated by
conventional manufacturing process which in general is
not fully optimized either for the performance or for the
mass reduction. The role of this bracket is to hold and
support the weight of the aircraft engine during handling
on the engine throughout the operation time. The
bracket offered an opportunity for weight reduction
which is directly may reduce the cost of material.
Topology optimization (TO) is a method where
material is removed by response to a given sets of loads,
boundary condition and constraint. Design space is
important in TO where removal of material will take
place. Krishna et al. [1] found that when two beams are
analyzed by using TO with different design region
setting, a designer can achieve both requirements of
high mass reduction while maintaining the stiffness of
the part. The reduction of mass by TO might affected
the performance of the product as in [2], where the
stiffness of the topology optimized part reduced without
sacrificing its performance requirement.
TO often produced complex geometry which is not
feasible to be manufactured by conventional
manufacturing but maybe produced by Additive
Manufacturing (AM). However, AM suffered in printing
overhanging parts and AM need support material to
print the design [3]. In AM, when there is an overhang
part, support structure is generated when the angle
between the boundary normal and the build direction
exceeds a certain threshold. Furthermore, Leary et al.[4]
have studied on optimal topology for AM which is a
method for enabling AM of support-free optimal
structures for FDM and found that part manufacture
with support-free design and no support design have
lesser printing time compare to part with support. Thus,
it is important to obtain a fully optimized lightweight of
engine bracket design by TO technique and to propose a
design based on these AM limitations.
2. METHODOLOGY
2.1 Topology Optimization
The TO process began with the GE engine bracket
design and was optimized by using Solid Thinking
Inspire software. The load conditions by a design space
are shown in Figure 1. The original mass of the bracket
is 2.1912 kg. The design spaces were divided into two
which are Topology Optimization I (TO I) and Topology
Optimization II (TO II). TO I design space is located at
clevis arm while TO II is located at the hole.
(a)
(b)
Figure 1 Design space for TO process in grey colour (a)
TO I and (b) TO II.
There are four different load conditions which are
for load condition 1 which is the 35,586 N maximum
static linear of vertical load, load condition 2 which is
37,810 N maximum static linear of horizontal load, load
condition 3 for maximum static linear of 42,258 N of 42
degrees from vertical and torsional load of 564 Nm at
the intersection of centreline of pin and midpoint
between clevis arms. In addition, supports at the bolt
location are added as the rotation is allowed. The

Ramlil et al., 2019
20
element size and thickness constraints are auto
generated which are 0.0026162 m and 0.00762 m
respectively. Analysis on the stiffness was conducted on
the topology optimized design in order to ensure that the
von Mises stress do not violate the 903 MPa of material
yield strength used which is Ti-6Al-4V by using the
same load conditions.
2.2 Analysis on Target Specification Baseline
300 existing topology optimized designs of engine
backet were analyzed by using FDM software in term of
raw material mass, support material mass and printing
time needed to be manufactured by AM.
3. RESULTS AND DISCUSSION
3.1 Topology Optimization Results
Figure 2 shows the result of TO process on engine
bracket for both design spaces applied. It is shown that a
lot material has been removed from the original design.
(a)
(b)
Figure 2 Topology optimized design of engine bracket
(a) TO I and (b) TO II.
Table 1 shows the comparison for von Mises stress
and mass for original design, topology optimized design
from TO I and topology optimized design from TO II of
engine bracket. As a result, TO I was accepted since the
von Mises stresses for all load conditions did not exceed
903 MPa of material yield strength.
Table 1 Comparison for von Mises stress and mass for
original design, TO I and TO II.
Design of
engine
bracket
Von Mises Stress (MPa) Mass
(kg) Load condition
1 2 3 4
Original 677.6 477.3 530.4 771.0 2.191
TO I 819.3 510.3 579.4 886.6 1.041
TO II 824.6 537.7 589.2 916.0 1.015
3.2 Analysis on Target Specification Baseline
Topology optimized design from TO I was
analyzed by FDM software for the AM output and
plotted on the graph for baseline target specification.
From the graph of support material mass against raw
material mass as shown in Figure 3 and Figure 4, TO I
showed 49% reduction of raw material mass needed to
be manufactured by AM from the original design.
However, there was support material mass needed for
TO I. A modification was performed in order to achieve
both constraints for TO and AM.
4. CONCLUSION
Topology optimization on engine bracket has
reduced the mass by 49% from original design without
sacrificing the performance. Based on the baseline, TO I
is acceptable with range of 75%.
Figure 3 Support material vs raw material mass.
Figure 4 Printing time vs raw material mass.
ACKNOWLEDGMENT
The authors gratefully acknowledge use of the
services and facilities of the Fakulti Kejuruteraan
Mekanikal, Universiti Teknikal Malaysia Melaka
(UTeM). This research has been supported by the grant
from Universiti Teknikal Malaysia Melaka (Grant no.:
PJP/2019/FKM(6A)).
REFERENCES
[1] Krishna, L. S. R., Mahesh, N., & Sateesh, N.
(2017). Topology optimization using solid
isotropic material with penalization technique for
additive manufacturing. Materials today:
proceedings, 4(2), 1414-1422.
[2] Sudin, M. N., Tahir, M. M., Ramli, F. R., &
Shamsuddin, S. A. (2014). Topology optimization
in automotive brake pedal redesign. International
Journal of Engineering and Technology
(IJET), 6(1), 398-402.
[3] Nazan, M. A., Ramli, F. R., Alkahari, M. R., Sudin,
M. N., & Abdullah, M. A. (2017). Process
parameter optimization of 3D printer using
response surface method. ARPN Journal of
Engineering and Applied Sciences, 12(7), 2291-
2296.
[4] Leary, M., Merli, L., Torti, F., Mazur, M., &
Brandt, M. (2014). Optimal topology for additive
manufacture: A method for enabling additive
manufacture of support-free optimal
structures. Materials & Design, 63, 678-690.

Proceedings of Mechanical Engineering Research Day 2019, pp. 21-22, August 2019
__________
© Centre for Advanced Research on Energy
Modeling and fabrication of protective mask with high complexity pattern using low-cost additive manufacturing design tool and systems
Syahibudil Ikhwan Abdul Kudus1,3,*, Ahmad Afiq Baharuddin1, Mastura Mohammad Taha1,3,
Mohammad Rafi Omar1,3, Mohd Idain Fahmy Rosley1,3, Shafizal Mat2,3
1) Fakulti Teknologi Kejuruteraan Mekanikal & Pembuatan, Universiti Teknikal Malaysia Melaka,
Hang Tuah Jaya, 76100 Durian Tunggal, Melaka, Malaysia 2) Fakulti Kejuruteraan Mekanikal, Universiti Teknikal Malaysia Melaka,
Hang Tuah Jaya, 76100 Durian Tunggal, Melaka, Malaysia 3) Centre for Advanced Research on Energy, Universiti Teknikal Malaysia Melaka,
Hang Tuah Jaya, 76100 Durian Tunggal, Melaka, Malaysia
*Corresponding e-mail: [email protected]
Keywords: Additive manufacturing; CAD modeling; high complexity pattern
ABSTRACT – This study explores the capability to
produce a complex 3-dimensional (3D) modeling using
Computer Aided Design (CAD) software in combination
with Additive Manufacturing (AM) systems to design
and manufacture a protective mask. This study aims to
produce a high complexity design pattern on the
customised protective mask. The 3D modeling of the
protective mask was made using AM-enabled CAD
software. The protective mask was manufactured using
three types of AM printers, and the 3D printed products
were compared. The comparative study indicated that the
presented approach offers a feasible alternative to the
current practices.
1. INTRODUCTION
The application of Additive Manufacturing (AM) in
wearables and assistive device has been widely
recognised. AM has been used to manufacture custom-
fitting medical devices such as facial prosthetics and
implants directly from 3D CAD data. AM is a process of
joining materials layer-by-layer to make parts from 3D
CAD data [1]. The main benefit of AM in product designs
is that it allows geometrical freedom, thus, create
possibilities for customisation, increased product
functionality, and greater complexity in manufacturing
objects.
A protective mask is an item designed to protect
portions of the wearer's face, including nose and eyes
area from contact with objects. It must comply specific
requirements that are comfort, light, and easy to use.
Most protective mask were manufactured using solid
polymeric materials, such as polycarbonate. There are
several problems arise from the existing design of the
protective mask. The solid design of existing mask lacks
ventilation causing users to feel uncomfortable, thus
contributes to perspiration and odour issues [4,5].
Moreover, the weight of the protective mask also have
implication on the user as it provide loads on the users’
face.
The unique capabilities of AM and the existence of
AM-enabled CAD software (e.g., Autodesk Meshmixer)
provide opportunities to improve product performance
and lowering overall manufacturing cost. By adapting
high complexity pattern in the product such as Voronoi,
the protective mask would not only look attractive, but
also improve skin ventilation and reduce weight [3].
2. METHODOLOGY
Two tasks have been carried out to develop the
protective mask: (i) modeling of the protective mask –
aimed to obtain the 3D data of the protective mask, and
(ii) fabrication process – experimented use of AM
printing system.
For the first task, the 3D modelling data of the
protective mask design was obtained from the standard
mannequin face and has been manipulated using
Autodesk Meshmixer CAD software. For the second
task, three types of 3D printing machine were used to
fabricate the design. They are Up! Plus, Flashforge
Creator Pro, and Projet 1000.
Up! Plus and Flashforge Creator Pro are Fused
Deposition Modeling (FDM) types of machines that used
material extrusion technology to fabricate the part.
Acrylonitrile butadiene styrene (ABS) and polylactic
acid (PLA) thermoplastic filament were used for those
machines respectively. On the other hand, Projet 1000 is
a Digital Light Processing (DLP) type of machine that
used vat-photopolymerisation technology. Photopolymer
resin was used to build the part. The process workflow of
the protective mask is shown in Figure 1 below.
Figure 1 The process workflow [3].
During data acquisition, the measurement of the
mannequin head is not precise, but rather general in
length, width and height. Therefore, it needs to be
dimensioned according to the real measurement of the
human head. The face model wireframe was re-meshed
so that the mesh triangle become smaller and denser. This
step was taken in order to enable the selection process of
face area that subjected to make the protective mask
easier. The face is then being selected, and the size and
shape of the protective mask design were determined.
This step was crucial in order to establish the base of the
protective mask 3D modeling. The selected mesh triangle
is shown in Figure 2.
Data
acquisition Data manipulation
in CAD Build object on
AM machines

Abdul Kudus et al., 2019
22
Figure 2 Selected mesh triangle on the face model.
The selected area of the protective mask then were
offsets so that it provides a gap between the inner surface
of the protective mask and the face. This provides airflow
and space between the protective mask and the face. The
selected area then was extruded to produce solid part. The
thickness of the part is essential since it affects the overall
condition of part weight, time taken to fabricate, and the
minimum thickness requirement of the AM machines.
The extruded part of the selected area also produces slight
sharp edges. Therefore, smoothing those edges was
performed (see Figure 3),
Figure 3 Smoothened mask area
The final step was applying a pattern on the
protective mask design. The Voronoi pattern has been
chosen to be applied to the design (see Figure 4).
Nevertheless, the durability of the mask needs to be
considered during this process. The 3D model data then
were exported to *.STL file and printed using 3D printing
machines stated above.
Figure 4 The protective mask with Voronoi pattern
3. RESULTS AND DISCUSSION
Table 1 shows the finished protective mask with
Voronoi pattern on it and was compared based on printing
time, weight, dimension and part cost. As in Table 1, it
can be seen that all types of machines used in the study
are capable of producing a part with high complexity
pattern. All machines fabricate exact size according to
original dimensions as produced in Meshmixer.
Part fabricated using Flashforge Creator Pro takes
the longest time of 31 hours to produce. This was due to
slow printing time, but it provides superior in detail and
finishing. It produces the lightest weight and the cheapest
cost amongst all. On the other hand, part fabricated using
Projet 1000 has the greatest weight of 89 grams. The
result also clearly shows that part produced by Projet
1000 has the highest part cost of RM176.95. Projet 1000
also is the best machine to fabricate the protective mask
in terms of finishings, but the user need to adapt with the
heavier part. Part printed from Up! Plus, has almost equal
printing time with Projet 1000, but observation shows
that it has the worst surface finish. It also heavier and
costlier compared to Flashforge Creator Pro.
Table 1 Printed protective mask.
Pri
nte
r
typ
e
Part
Ma
teri
al
Pri
nti
ng
tim
e
Wei
gh
t (g
)
Dim
ensi
on
(mm
)
Co
st (
RM
)
Up
! P
lus
AB
S
10 h
ours
73
159.8
x 9
0.7
x 9
0.9
4.2
0
Fla
shfo
rge
Cre
ato
r P
ro
PL
A
31 h
ours
60
159.8
x 9
0.7
x 9
0.9
3.2
7
Pro
jet
10
00
Res
in
9 h
ours
89
159.8
x 9
0.7
x 9
0.9
176.9
5
4. CONCLUSION
In conclusion, designing and fabricating the
protective mask from AM-enabled tool and system is
fairly a straightforward process. The concept of using
AM to fabricate such product is not new, but the ability
to utilise the tool and systems is crucially important.
Various techniques on handling CAD software has been
learned in order to produce the CAD model that meets
the requirements. The use of Meshmixer as a design tool
to create high complexity pattern have made a significant
contribution to the design and fabrication process. The
selection of printing machine is also crucial because
different machine produces different characteristics (e.g.,
visual), process capabilities (e.g., accuracy) and product
costs.
REFERENCES
[1] ISO/ASTM International (2016). ISO/ASTM
52900: Standard Terminology for Additive
Manufacturing Technologies. Retrieved from
https://www.sis.se/api/document/preview/919975/
[2] [2] Baronio, G., Volonghi, P., & Signoroni, A.
(2017). Concept and Design of a 3D Printed
Support to Assist Hand Scanning for the Realization
of Customized Orthosis. Applied Bionics and
Biomechanics, 2017, 8 pages.
[3] [3] Paterson, A. M., Donnison, E., Bibb, R. J., &
Campbell, R. I. (2014). Computer-aided design to
support fabrication of wrist splints using 3D
printing: A feasibility study. Hand Therapy, 19(4),
102–113.
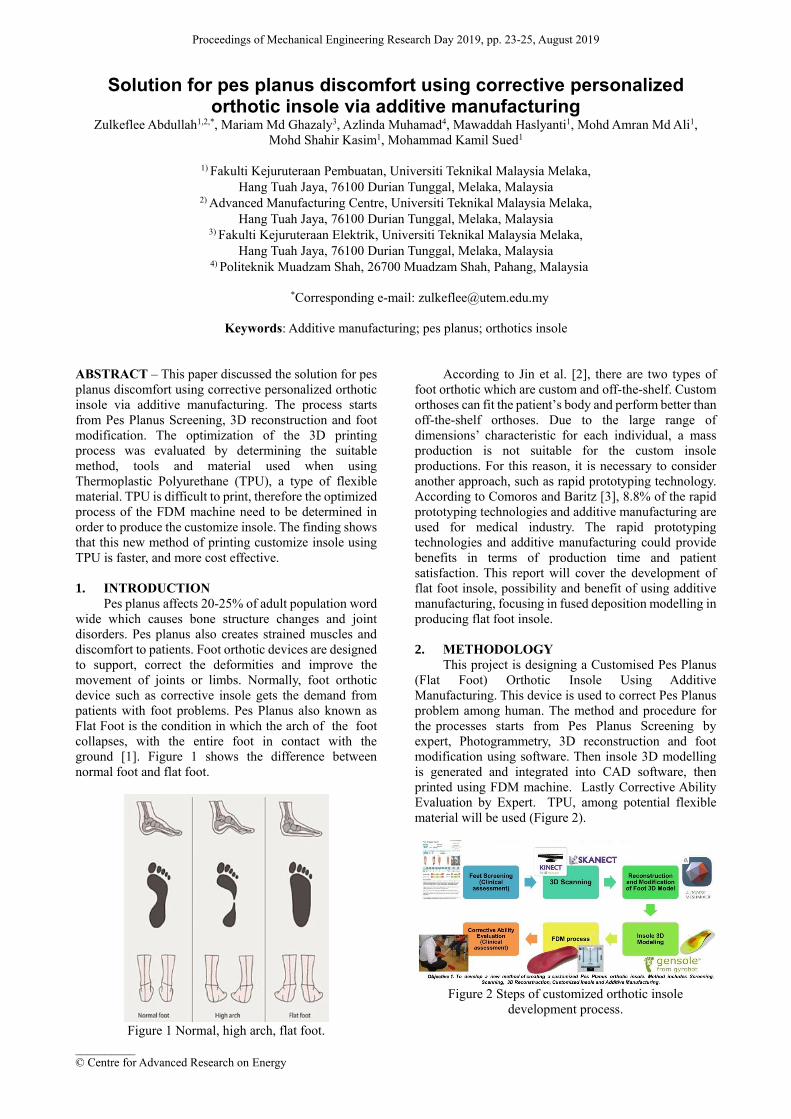
Proceedings of Mechanical Engineering Research Day 2019, pp. 23-25, August 2019
__________
© Centre for Advanced Research on Energy
Solution for pes planus discomfort using corrective personalized orthotic insole via additive manufacturing
Zulkeflee Abdullah1,2,*, Mariam Md Ghazaly3, Azlinda Muhamad4, Mawaddah Haslyanti1, Mohd Amran Md Ali1,
Mohd Shahir Kasim1, Mohammad Kamil Sued1
1) Fakulti Kejuruteraan Pembuatan, Universiti Teknikal Malaysia Melaka,
Hang Tuah Jaya, 76100 Durian Tunggal, Melaka, Malaysia 2) Advanced Manufacturing Centre, Universiti Teknikal Malaysia Melaka,
Hang Tuah Jaya, 76100 Durian Tunggal, Melaka, Malaysia 3) Fakulti Kejuruteraan Elektrik, Universiti Teknikal Malaysia Melaka,
Hang Tuah Jaya, 76100 Durian Tunggal, Melaka, Malaysia
4) Politeknik Muadzam Shah, 26700 Muadzam Shah, Pahang, Malaysia
*Corresponding e-mail: [email protected]
Keywords: Additive manufacturing; pes planus; orthotics insole
ABSTRACT – This paper discussed the solution for pes
planus discomfort using corrective personalized orthotic
insole via additive manufacturing. The process starts
from Pes Planus Screening, 3D reconstruction and foot
modification. The optimization of the 3D printing
process was evaluated by determining the suitable
method, tools and material used when using
Thermoplastic Polyurethane (TPU), a type of flexible
material. TPU is difficult to print, therefore the optimized
process of the FDM machine need to be determined in
order to produce the customize insole. The finding shows
that this new method of printing customize insole using
TPU is faster, and more cost effective.
1. INTRODUCTION
Pes planus affects 20-25% of adult population word
wide which causes bone structure changes and joint
disorders. Pes planus also creates strained muscles and
discomfort to patients. Foot orthotic devices are designed
to support, correct the deformities and improve the
movement of joints or limbs. Normally, foot orthotic
device such as corrective insole gets the demand from
patients with foot problems. Pes Planus also known as
Flat Foot is the condition in which the arch of the foot
collapses, with the entire foot in contact with the
ground [1]. Figure 1 shows the difference between
normal foot and flat foot.
Figure 1 Normal, high arch, flat foot.
According to Jin et al. [2], there are two types of
foot orthotic which are custom and off-the-shelf. Custom
orthoses can fit the patient’s body and perform better than
off-the-shelf orthoses. Due to the large range of
dimensions’ characteristic for each individual, a mass
production is not suitable for the custom insole
productions. For this reason, it is necessary to consider
another approach, such as rapid prototyping technology.
According to Comoros and Baritz [3], 8.8% of the rapid
prototyping technologies and additive manufacturing are
used for medical industry. The rapid prototyping
technologies and additive manufacturing could provide
benefits in terms of production time and patient
satisfaction. This report will cover the development of
flat foot insole, possibility and benefit of using additive
manufacturing, focusing in fused deposition modelling in
producing flat foot insole.
2. METHODOLOGY
This project is designing a Customised Pes Planus
(Flat Foot) Orthotic Insole Using Additive
Manufacturing. This device is used to correct Pes Planus
problem among human. The method and procedure for
the processes starts from Pes Planus Screening by
expert, Photogrammetry, 3D reconstruction and foot
modification using software. Then insole 3D modelling
is generated and integrated into CAD software, then
printed using FDM machine. Lastly Corrective Ability
Evaluation by Expert. TPU, among potential flexible
material will be used (Figure 2).
Figure 2 Steps of customized orthotic insole
development process.

Abdullah et al., 2019
24
2.1 Feet screening
Pes Planus problem on feet and then screening by
orthotics expert. Expert confirmation on the patient's feet
condition of Pes Planus. Foot sensor insole was used
here. Then the process of Insole sensor validation was
done.
2.2 3D scanning – customized insole design
Low-cost 3D scanning solution: Microsoft®
Kinect™ for XBOX 360 (gaming sensor) and our Faro
Arm high end scanner at the Rapid Prototyping Lab was
used to get the images. Occipital Skanect software was
used to process the images.
2.3 3D reconstruction & foot modification –
customized insole design
Autodesk Meshmixer software was used here.
Firstly, 3D models imported from Skanect mesh, (.stl) &
remove the unwanted geometry. Secondly, the details
were smoothed out. Lastly, the foot alignment corrected
to normal conditions. In here all problematic foot will be
corrected to be a normal heathy foot according to the
parameters recommended by orthotics expert.
2.4 Insole 3D Modeling – customized insole design
Gensole browser-based tool was used here. Gensole
will generate insoles for 3D Printing from Gyrobot. The
3D model in .AMF files then exported into slicer for 3D
printer toolpath creation.
2.5 FDM process (TPU)
FDM process parameters will be used in the study.
Determination of parameters to be used in the FDM
process is based on the optimum value obtained from the
literature reviews.
2.5 Corrective ability evaluation
Expert confirmation on the patient's feet condition
of Pes Planus. Patient has been asked to position their
foot so that the plantar surface takes the normal
disposition. The corrective ability of the orthotic insole
has been assessed by experts to ensure the reliability of
the results obtained. Experts are positive on the resulted
insole provide optimal foot correction effects.
3. RESULTS AND DISCUSSION
The solution for pes planus (flat-foot) discomfort
using corrective personalized orthotic insole using
additive manufacturing process was verified in the
previous section and has given good results. For
validation of the customize insole, each patient has been
certified to have a pes planus problem by an orthopaedist
practitioner. At the 3D scanning stage, the 3D scanning
was performed using Kinect™ for XBOX 360
(Microsoft®) paired with Skanect software as a low-cost
solution. The results show comparable images with the Faro
Arm Scanner but with less images quality. At the 3D
Reconstruction & Foot Modification stage, there are two
phases of works conducted by using Autodesk Meshmixer
ver. 3.5. First phase is reconstruction of foot model. The
second phase is modification of Pes Planus foot model.
The foot alignment was then corrected to normal foot
conditions. Then at the Pes Planus Orthotic Insole 3D
modeling using Gensole stage, the aim is correct the Pes
Planus condition in Figure 3(a) to a perfect feet condition
shown in Figure 3(b). Figure 4 shows the successful
customize insole 3D printed using TPU flexible material.
Figure 3 Pes planus vs optimal feet. (a) Feet with pes
planus problem and (b) optimal foot.
Figure 4 successful customize insole 3D printed using
TPU flexible material tested on patient by the orthotics
expert (Dr Ahmad Tajuddin Abdullah, an Orthopedic &
Traumotology Surgeon from Mahkota Orthotics and
Prosthetic). Without and with personalize insole.
4. CONCLUSIONS
In conclusion, the customized pes planus (flat foot)
orthotic insole using additive manufacturing was
successfully verified. This study was devoted to
developing customized Pes Planus orthotic insole using
FDM and has the potentially contribution to the orthotic
industry. The optimization was evaluated by determining
the suitable method, tools and material used when using
TPU flexible material. The process parameters of the
FDM machine also need to be determined in order to
produce the customize insole. The study showed the
feasibility using low-cost 3D scan solution without
compromising the quality, simplicity of using user-
friendly CAD software. This study has shown that the
additive manufacturing technology has the potential to be

Abdullah et al., 2019
25
applied in the medical industry, particularly in orthotic
and prosthetic manufacturing. Future works includes
clinical assessment to ensure that corrective processes are
effective.
ACKNOWLEDGEMENT
This research is supported by Universiti Teknikal
Malaysia Melaka grant no.
JURNAL/2018/FKE/Q00006.
REFERENCES
[1] Moorthy, T. N. & Sulaiman S. F. (2015).
Individualizing characteristics of footprints in
Malaysian Malays for person identification from a
forensic perspective. Egyptian Journal of Forensic
Sciences, 7, 13–22.
[2] Jin, Y. A., Plott, J., Chen, R., Wensman, J., & Shih,
A. (2015). Additive manufacturing of custom
orthoses and prostheses–A review. Procedia
CIRP, 36, 199-204.
[3] Cotoros, D. & Baritz, M. (2012). Implementing
rapid prototyping technologies for corrective
insoles. International Journal of Modern
Manufacturing Technologies, IV(1), 41–46.