application of continuum damage theory or f … · application of continuum damage theory or f...
TRANSCRIPT

Application of Continuum Damage Theory for Flexural
Fatigue Tests
Eng.°Luiz Guilherme Rodrigues de Mello
National Department of Infrastructure on Transportation

NUMBERS from BRAZIL`s HIGHWAYSFederal Highways (118.000km) Federal Highways Condition
Evaluation
79
84
92
93
94
95
96
97
98
99
00
01
02
03
04
05
06
07
08
Year
100%
80%
60%
40%
20%
0%
DNIT has approximately $4 billions for 2009/2010

INTRODUCTION
21.1
K
f KN ⎟⎠⎞
⎜⎝⎛=ε
nKAdNda
Δ= .
m
m
R
m DWD
α
⎟⎟⎠
⎞⎜⎜⎝
⎛∂∂
−=•

INTRODUCTIONWorks published on the subject:
H. J. Lee (1996). Uniaxial Constitutive Modeling of Asphalt Concrete Using Viscoelasticityand Continuum Damage Theory;
Park et al. (1996). A Viscoelastic Continuum Damage Model and its Application to UniaxialBehavior of Asphalt Concrete;
Y. R. Kim et al. (2002). Fatigue Performance Evaluation of West Track Asphalt MixturesUsingViscoelastic Continuum Damage Approach;
Daniel (2001). Development of a Simplified Fatigue Test and Analysis Procedure Using aViscoelastic Continuum Damage Model and its Implementation to WestTrack Mixtures;
Lundstrom & Isacsson (2003). Asphalt Fatigue Modeling Using Viscoelastic ContinuumDamage Theory;
Lundstrom & Isacsson (2004). An Investigation of the Applicability of Schapery’s WorkPotential Model for Characterization of Asphalt Fatigue Behavior;
Christensen & Bonaquist (2005). Practical Application of Continuum Damage Theory toFatigue Phenomena in Asphalt Concrete Mixtures
Baek et al. (2008). Viscoelastic Continuum Damage Model Based Finite Element Analysis ofFatigue Cracking;
Kutay et al. (2008). Use of Pseudostress and Pseudostrain Concepts for Characterization ofAsphalt Fatigue Tests;

CONTINUUM DAMAGE MECHANICS
“(…) The growth of short crack is them described in global way, using D instead ofthe crack length measure. The fact that short crack propagation does not follow thelong crack behavior is a good justification to use a more global parametrization, inthe framework of CD instead of Fracture Mechanics.” Chaboche & Lesne (1988)
“(…) Description of damage evolution in materials using micromechanical analysis isin principle very difficult as the character of the microstructure and interaction amongdefects is difficult to characterize based on details of the micro-cracks. Due to thisdifficulty, CD mechanics models often ignore the physical details of the defects andinstead simply focus on macroscopic response (e.g. stiffness) .” Lundstrom et al. (2007)
Why Continuum Damage Mechanics?
“(…) The evidence relating to the influence of microcracks on the mechanicalresponse of solids over a wide spectrum of circumstances is too obvious to beneglected.” Krajcinovic (1989)

CONTINUUM DAMAGE MECHANICS
A “proper” mathematical representation forthe damage variable;
Particular objective form for the strainenergy density (Green`s hyperelastic constitutivemodel);
Appropriate form of the damage evolutionlaws;
Three aspects of the CDM theory are associated with theselection of:

A A-A’=AD
AAAD D−
=damage
CONTINUUM DAMAGE MECHANICSClassical Continuum Damage
Scalar damage parameter: will never reaches the value D = 1.In this case we need a damage law (limit at D = 0,5 forexample).
But sometimes damage and microcracks distribution might appear to be different!

CONTINUUM DAMAGE MECHANICSMicrocracks in planesperpendicular to the tensileaxis:
sample will behave asdamaged
sample will behave asundamaged
If the sign of stress is reversed
Krajcinovic, 1989

CONTINUUM DAMAGE MECHANICS
( )εσ
εσ
.1
~
DE
−==
EED~
1−=Effectivestress
concept
Usually, damage parameter are related to mechanicalproperties
The concept of scalar damage has some advantages as theconstitutive equations for the damaged material areequivalent to those for the undamaged material, using theeffective stress instead of the nominal stress. (Krajcinovic 1989)

CONTINUUM DAMAGE MECHANICS
Correspondence principle
Work Potential Theory – WPT;
Damage evolution law;
Schapery (1984, 1990); Park et al. (1996)
CDM applied to viscoelastic materials

CONTINUUM DAMAGE MECHANICS
( )∫ ∂∂
−=t
R
R dtEE
t0
...1)( ττετε )(.1)( t
Et
R
R σε =
∫ ∂∂
−=t
dtEt0
.).()( ττετσ
Constitutive model for viscoelastic material
(convolution integral)
Schapery`s extended correspondence principle suggest that elasticand viscoelastic constitutive equations are identical, but stress andstrains in the viscoelastic body not necessarily are physical quantitiesbut pseudo-elastic variables.
The physical meaning of the pseudostrain (εR) corresponds to the linear viscoelastic stress for a given strain history

CONTINUUM DAMAGE MECHANICS
RC εσ .=
The pseudostrain concepts allow definition of the concept of pseudostiffness (C),which is the loss off stiffness solely due to loss of material integrity caused bydamage and defined as follows:
Park et al (1996)
How determine pseudostrain (sinusoidal loading)?
( )[ ]ϕθωεε ++= tEER
R sin...1 *0 ( )[ ]ϕθωεε ++= tS
ER
R sin...1 *0
Uniaxial condition (Lee 1996) Flexural condition

CONTINUUM DAMAGE MECHANICS
RC εσ .=
ijij
Wε
σ∂∂
= Rij
R
ijWε
σ∂∂
=
( )210 ..21. RRR CCW εε +=
),( DfW RR ε=
Work Potential Theory – WPT
Lee (1996) presented the pseudo-strain energy density function as thefollow:
Green’s hyperelastic model

CONTINUUM DAMAGE MECHANICS
Damage Evolution law
m
m
R
m DWD
α
⎟⎟⎠
⎞⎜⎜⎝
⎛∂∂
−=•
• α is a material constant;
• Initially, it could be defined as viscoelastic property: relaxation orcreep test;
( ) ( )( )
( ) ( )ααα
ε +−
+
=− −⎥⎦
⎤⎢⎣⎡ −=∑ 1/1
1
1/
11
2...
2 ii
N
iii
Ri ttCCID
Numericalintegration

CONTINUUM DAMAGE MECHANICS
Characteristic Curve C x D
2.10CDCCC −=
).exp( 21
CDCC −=
0.0
0.2
0.4
0.6
0.8
1.0
0.0E+00 8.0E+04 1.6E+05 2.4E+05Nor
naliz
ed p
seud
o st
iffne
ss (
C)
Damage parameter (D)
Relationship that define the damage evolution
for a particular material/test/Specimen
(!)

CONTINUUM DAMAGE MECHANICS
Daniel & Kim 2002
Lundström & Isacsson 2003
Damage parameter - D
Pse
udo-
stiff
ness
-C
0
0.2
0.4
0.6
0.8
1
0 50000 100000 150000 200000 250000 300000
Pse
udo-
stiff
ness
Damage parameter
50/6070/100
160/220

MATERIALS AND METHODS
Layer % binder % Voids thickness(cm)
Conventional 5,5% 7% variable
Gap graded 7% 9% 5,0
Open graded 9% 18% 1,3
1,30 cm – open graded
Variableconventional(Dense)
38,0 cm - Base
Subgrade
5,0 cm – gap graded

18
MATERIALS AND METHODS

19
Beams for felxural fatigue tests
Mixtures were tankenfrom construction sites;
molds were carefully filledwith AC (hetereogenity)
Compaction processusing haversine loading (2Hz and 2,8 MPa): close to fieldobservation
Approximately 250 fatigue tests
MATERIALS AND METHODS

20
MATERIALS AND METHODS
Height variation
Stif
fnes
sva
riatio
n

MATERIALS AND METHODS

MATERIALS AND METHODSProjects
Loading modeTest temperature
TestsIdentification Mixture type 4°C 21°C 37°C
BC7 Conventional
Strain Control(haversine)
8 8 8 24
BC4 Open graded 8 8 - 16
KR7 Conventional 8 8 8 24
KRTR7 Conventional 8 8 8 24
SS7 Conventional 8 8 8 24
SS4 Open graded 8 8 - 16
BB3 Gap graded 8 8 8 24
BB4 Open graded 8 8 - 16
JR7 Conventional 8 8 8 24
JR3 Gap graded 8 8 8 24
JR4 Open graded 8 8 - 16
TG7 Conventional 8 8 8 24
TG3 Gap graded 8 8 8 24
TG4 Open graded 8 8 - 16
Total 320

23
MATERIALS AND METHODS
Number of cycles
Stra
in
Wholer curves – 50% So
Number of cycles
Stra
in
Wholer curves – Wn/wn
Pronk & Erkens (2001)

MATERIALS AND METHODSIn summary the following conditions were used:
Air voids: 7% for the conventional specimens, 9% for thegap graded specimens and 18% for the open gradedspecimens.
Load condition: Constant strain level, 6 – 10 levels of therange (300-1900 microstrain)
Load frequency: 10 Hz (2 and 5 Hz for validation)
Test temperature: 4.4, 21, and 37.8oC for conventional andgap graded mixtures; 21.1, and 37.8oC for open gradedmixtures.

MATERIALS AND METHODS

26
RESULTS AND DISCUSSIONS
0.00E+00
5.00E+01
1.00E+02
1.50E+02
2.00E+02
2.50E+02
3.00E+02
3.50E+02
0.00E+00
1.00E+03
2.00E+03
3.00E+03
4.00E+03
5.00E+03
6.00E+03
7.00E+03
0 100000 200000 300000 400000 500000 600000 700000 800000 900000
Mic
ro s
train
(æî)
Flex
ural
Stif
fnes
s -S
-(M
Pa)
Number of Repetitions - (N)
Flex
ural
stiff
ness
Number of cycles
Classical results:

27
RESULTS AND DISCUSSIONS
Stain (microstrain)
Stre
ss
-2000
-1000
0
1000
2000
-300 -200 -100 0 100 200 300
Stre
ss (k
Pa)
Strain (με)
10th
50th
500th
5000th
20000th
90000th
Dissipatedenergy

28
RESULTS AND DISCUSSIONS

29
RESULTS AND DISCUSSIONS
(Rauhut & Kennedy 1982)
T (°C)
k2 VARIATION WITH
TEMPERATURE FOR
CONVENTIONAL MIXTURES

30
k2 VARIATION WITH
TEMPERATURE FOR ASPHALT
RUBBER MIXTURES
RESULTS AND DISCUSSIONS
T (°C)
Despite the variability founded and the amount of tests, k2 will beless temperature susceptible for asphalt rubber mixtures (my pointof view!)

31
Kohls Ranch 100°FNf = 4.41E-10ε-4.09
R2 = 0.93
Kohls Ranch 70°FNf = 1.06E-12ε-4.62
R2 = 0.91
Kohls Ranch 40°FNf = 5.12E-18ε−5.91
R2 = 0.771.E-04
1.E-03
1.E-02
1.E+02 1.E+03 1.E+04 1.E+05 1.E+06 1.E+07
Stra
in L
evel
Cycles to Failure
RESULTS AND DISCUSSIONS

32
RESULTS AND DISCUSSIONS
Failure criteria!!
(Lundstrom et al. 2004)

33
-2000
-1000
0
1000
2000
-400 -200 0 200 400Stre
ss (k
Pa)
Strain (10-6 m/m)
N = 10N = 20N = 30N = 40
RESULTS AND DISCUSSIONS
-2000
-1000
0
1000
2000
-2000 -1000 0 1000 2000
Stre
ss (k
Pa)
Pseudo strain- εR
N = 10N = 20N = 30N = 40
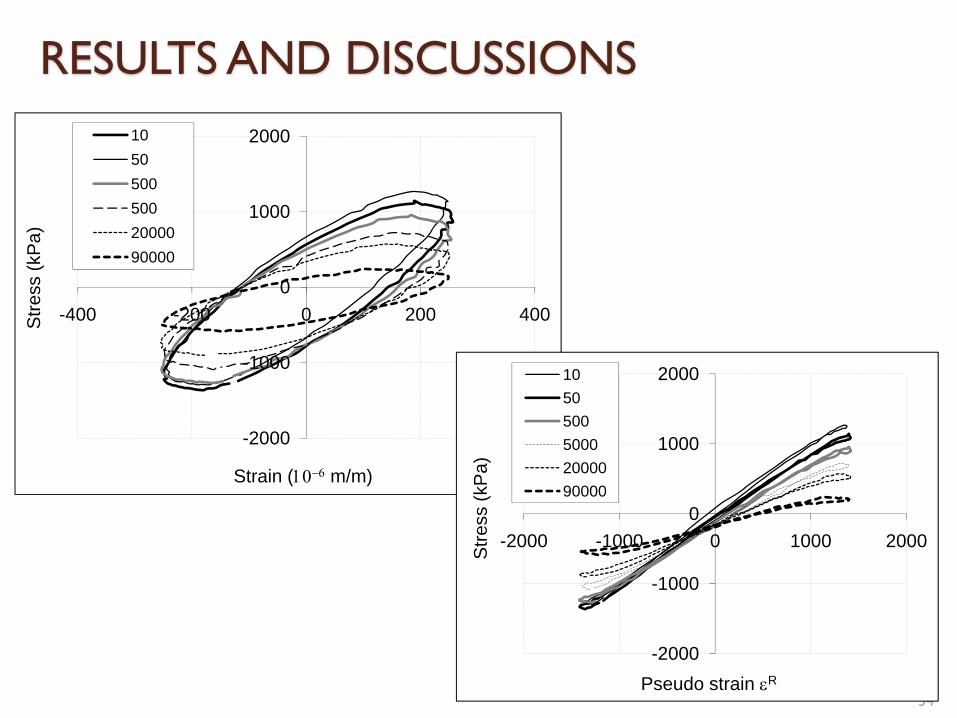
34
-2000
-1000
0
1000
2000
-400 -200 0 200 400Stre
ss (k
Pa)
Strain (10−6 m/m)
10505005002000090000
-2000
-1000
0
1000
2000
-2000 -1000 0 1000 2000Stre
ss (k
Pa)
Pseudo strain εR
105050050002000090000
RESULTS AND DISCUSSIONS

35
Damage calculation
RESULTS AND DISCUSSIONS
( ) )1(1
11
11
2
1 )4
.().(.2
ααα
ε +−+
=−
−⎥⎦⎤
⎢⎣⎡ −≅∑ ii
N
iii
Rm
ttCCID
Daniel (2001) showed that in the case of cyclic loadingsdamage can only accumulate during the tensile loadingportion of each cycle. Therefore, damage was calculated usingonly ¼ of the entire loading time, which was the approximateperiod for tensile stresses under haversine loading (uniaxialtests):

36
RESULTS AND DISCUSSIONSFor flexural conditions, the time should be different:
( ) )1(1
11
11
2
1 )2
.().(.2
ααα
ε +−+
=−
−⎥⎦⎤
⎢⎣⎡ −≅ ∑ ii
N
iii
Rm
ttCCID

37
0.E+00
4.E+04
8.E+04
1.E+05
2.E+05
0.0E+00 2.0E+05 4.0E+05 6.0E+05
Dam
age
para
met
er
Number of cycles
350,0 300,0 250,0212,5 187,5 175,0
0.E+00
1.E+05
2.E+05
3.E+05
4.E+05
5.E+05
0.0E+00 6.0E+04 1.2E+05 1.8E+05 2.4E+05 3.0E+05
Dam
age
para
met
er
Number of cycles
37°C21°C5°C
RESULTS AND DISCUSSIONS

0.0
0.2
0.4
0.6
0.8
1.0
0.0E+00 5.0E+04 1.0E+05 1.5E+05 2.0E+05
Pse
udo
stiff
ness
(C)
Damage parameter (D)
300,0
250,0
Model
38
RESULTS AND DISCUSSIONS
0.0
0.2
0.4
0.6
0.8
1.0
0.0E+00 5.0E+04 1.0E+05 1.5E+05 2.0E+05
Pse
udo
stiff
ness
(C)
Damage parameter (D)
350,0
300,0
250,0
212,5
Model
0.0
0.2
0.4
0.6
0.8
1.0
0.0E+00 5.0E+04 1.0E+05 1.5E+05 2.0E+05
Pse
udo
stiff
ness
(C)
Damage parameter (D)
350,0300,0250,0212,5187,5175,0Model
α = 2,36
T = 21°C
2.10CDCCC −=

39
0.0
0.2
0.4
0.6
0.8
1.0
0.0E+00 2.0E+04 4.0E+04 6.0E+04 8.0E+04
pseu
do s
tiffn
ess
(C)
Damage parameter (D)
975,0950,0900,0750,0675,0Model
RESULTS AND DISCUSSIONS
0.0
0.2
0.4
0.6
0.8
1.0
0.0E+00 1.5E+05 3.0E+05 4.5E+05 6.0E+05
pseu
do s
tiffn
ess
(C)
Damage parameter (D)
275,0237,5225,0175,0162,5Model
T = 37°C
T = 4°C

40
Temperature C0 C1 C2 α
5°C 0,99 1,11E-05 0,84 3,17
21°C 1,03 2,39E-03 0,49 2,36
37°C 1,03 1,02E-02 0,41 1,79
RESULTS AND DISCUSSIONS
T (°C)
Also k2 is lowerfor higher
temperature!

41
RESULTS AND DISCUSSIONS
1.E+02
1.E+03
1.E+03 1.E+04 1.E+05 1.E+06
Stra
in (μ
m)
Number of cycles (Nf)
Power (37°C)
Power (21°C)
Power (5°C)
Comparison shouldbe made using a
pavement structuralanalysis!

42
Open graded mix at T = 21°C
0.0
0.2
0.4
0.6
0.8
1.0
0.0E+00 1.0E+04 2.0E+04 3.0E+04
Pse
udo
stiff
ness
(C)
Damage parameter (D)
800700600600575Modelo
RESULTS AND DISCUSSIONS
0.0
0.2
0.4
0.6
0.8
1.0
0.0E+00 1.0E+05 2.0E+05 3.0E+05
Pse
udo
stiff
ness
(C)
Damage parameter (D)
375300287,5212,5187,5150Modelo
Gap graded mix at T = 5°C

43
0.0
0.2
0.4
0.6
0.8
1.0
0.0E+00 1.0E+05 2.0E+05 3.0E+05
pseu
do s
tiffn
ess
(C)
Damage parameter (D)
375,0300,0212,5187,5150,0Model275,0
RESULTS AND DISCUSSIONS
0.E+00
2.E+03
4.E+03
6.E+03
8.E+03
Flex
ural
stif
fnes
s (M
Pa)
300,0 375,0 275,0 150,0 212,5 187,5

44
0.00
0.20
0.40
0.60
0.80
1.00
0.E+00 5.E+04 1.E+05 2.E+05
pseu
do s
tiffn
ess
(C)
Damage parameter (D)
JR7 - 21°C
JR3 - 21°C
JR4 - 21°C
RESULTS AND DISCUSSIONSComparison should be made using a pavement
structural analysis!

45
0.0
0.2
0.4
0.6
0.8
1.0
0.0E+00 5.0E+04 1.0E+05 1.5E+05 2.0E+05
pseu
do s
tiffn
ess
(C)
Damage parameter (D)
250 - 5 Hz
250 - 5 Hz
187,5 - 5 Hz
300 - 5 Hz
225 - 2 Hz
Model - 10 Hz
RESULTS AND DISCUSSIONS
0.0
0.2
0.4
0.6
0.8
1.0
0.0E+00 8.0E+04 1.6E+05 2.4E+05
pseu
do s
tiffn
ess
(C)
Damage parameter (D)
Model - 10 Hz
240 - 5 Hz
225 - 5 Hz
225 - 2 Hz
200 - 5 Hz
Characteristic curve should be independent of frequencyloading:

46
RESULTS AND DISCUSSIONS
Daniel (2001) and Lundstrom et al. (2003) showedcharacteristic curve is also temperature independent. In myopinion, parameter α (also k2) will be temperature dependentand a unique C x D curve will be able for differenttemperatures.
Why not temperature comparison forcharacteristic curves?

47
0.0
0.2
0.4
0.6
0.8
1.0
0.0E+00 5.0E+04 1.0E+05 1.5E+05
Pse
udo
stiff
ness
(C)
Damage parameter (D)
200,0150,0125,0112,5105,0Strain-controlled modelStress-controlled model
RESULTS AND DISCUSSIONSCharacteristic curve should be independent of loading mode:
0.0
0.2
0.4
0.6
0.8
1.0
0.0E+00 3.0E+04 6.0E+04 9.0E+04
pseu
do s
tiffn
ess
(C)
Damage parameter (D)
350,0300,0250,0225,0150,0Strain-controlled modelStress-controlled model

48
RESULTS AND DISCUSSIONSAs illustrated by different works (Lee et al. 2003; Kim et al.2006), parameter α is directly related with coefficient asfollows: α.22 =k
Conventional mix Asphalt rubber mix

49
RESULTS AND DISCUSSIONSPrediction of fatigue life:

50
RESULTS AND DISCUSSIONSAs we mention before, comparison among different mixturesshould be done by pavement structural analysis. This can bedone using numerical analysis. For example VECD+FEPsoftware (Dr. Richard Kim):

51
RESULTS AND DISCUSSIONSPreliminary results:
N = 5.0 x 10⁷

WHAT DO WE HAVE RIGHT NOW
VEPCD: ViscoElasticPlastic Continuum Damage
Probably some interaction between ContinuumDamage and Fracture Mechanics
(Chehab 2002)

53
The evolution of internal damage in hot mix asphalt (HMA) can beproperly evaluated using the framework of the Continuum DamageTheory to determine its characteristic curve.
The characteristic curves proved to be unique for a wide range ofimposed strain amplitudes for both conventional and asphalt-rubbermixes.
Tests with different temperatures, however, were better fitted byadopting different values of parameter a in the damage evolutionrelation. This parameter reduces with the increase in temperature.
The results of this research, using bending fatigue tests, corroboratethe findings of other researchers about the uniqueness of thecharacteristic curve obtained from uniaxial fatigue tests subjected todirect tension.
CONCLUSIONS

54
Despite the fact that some mechanical properties are indirectlyobtained from bending tests, these are simpler to perform and areavailable and well known in several research centers.
The uniqueness of the characteristic curve is an auspicious factsince it provides a means to characterize a HMA with fewer laboratorytests than other approaches. It also implies that such curves can beimplemented in numerical codes to simulate the behavior of flexiblepavements subject to a wide range of in field load conditions.
CONCLUSIONS

55
ACKNOWLEDGEMENTS