application of equity rubric showing purpose and need for
TRANSCRIPT

Application of Equity Rubric Showing Purpose and Need for Rural and Low
Density Communities Near Megaregions: IH 10 East Corridor,
Houston the Texas State Line
Carol Abel Lewis, Ph.D., Gwendolyn Goodwin, Ph.D., Brandon Rogers, Lydia
Ndagire, Anson Gill September 2020
A publication of the USDOT Tier 1 Center: Cooperative Mobility for Competitive Megaregions
At The University of Texas at Austin

1
DISCLAIMER: The contents of this report reflect the views of the authors, who are responsible for the facts and the accuracy of the information presented herein. This document is disseminated in the interest of information exchange. The report is funded, partially or entirely, by a grant from the U.S. Department of Transportation’s University Transportation Centers Program. However, the U.S. Government assumes no liability for the contents or use there

2
Technical Report Documentation Page 1. Report No. CM2-#
44 2. Government Accession
No.
3. Recipient’s Catalog No. ORCID: 0000-0001-6454-0960; 0000-0003-1316-1981
4. Title and Subtitle Application of an Equity Rubric that Shows Need for Rural and Low Density Communities Near Megaregions: Case Study IH 10 East Corridor, Houston to Texas State Line
5. Report Date September 2020
6. Performing Organization Code
7. Author(s) Carol Abel Lewis, Ph.D.; Gwendolyn Goodwin, Ph.D.
8. Performing Organization Report No. CM2-# 44
9. Performing Organization Name and Address The University of Texas at Austin School of Architecture 310 Inner Campus Drive, B7500 Austin, TX 78712 Texas Southern University Center for Transportation Training and Research 3100 Cleburne Houston, Texas 77004
10. Work Unit No. (TRAIS)
11. Contract or Grant No. USDOT 69A3551747135
12. Sponsoring Agency Name and Address U.S. Department of Transportation Federal Transit Administration Office of the Assistant Secretary for Research and Technology, UTC Program 1200 New Jersey Avenue, SE Washington, DC 20590
13. Type of Report and Period Covered Technical Report conducted December 2018-September 2020
14. Sponsoring Agency Code
15. Supplementary Notes Project performed under a grant from the U.S. Department of Transportation’s University Transportation Center’s Program.
16.Abstract Rural and low density residents proximate to Megaregion anchor cities could be advantaged by improved public transportation into nearby large urban areas. This is particularly the case for residents challenged by inequities due to ethnicity, language and income. Before planning can begin for any transportation project or service, a need must be established. The need is the gap between the deficiency in the area’s transportation system and the possible solutions to address the deficiency. There are a number of methods and strategies to assess vulnerability and determine purpose and need. This work reviews the Equitable Target Area (ETA) tool and compares the outcome to a Composite Vulnerability Index (CVI). Both approaches begin with socioeconomic variables and assess the variables based on census block groups. The IH 10 corridor from Houston east to the Texas State Line forms the case study for this analysis where the research shows that the CVI best identifies vulnerable areas of need. 17. Key Words Megaregional
Transportation, Vulnerable Non-urban Communities, Equity Analysis
18. Distribution Statement No restrictions.
19. Security Classif. (of report) Unclassified
20. Security Classif. (of this page) Unclassified
21. No. of pages 23
22. Price
Form DOT F 1700.7 (8-72) Reproduction of completed page authorized
3
Acknowledgements
The authors thank the Cooperative Mobility for Competitive Megaregions (CM2), a United States
Department of Transportation (USDOT) Tier-1 University Transportation Center (UTC), for
funding of this research. We appreciate contributions of our research advisors, Thomas Gray
(Houston Galveston Area Council), Stephanie Nellons-Paige (Texas Central High Speed Rail) and
Vernon Chambers (Harris County Rides), who reviewed the research concept and validated
importance of this research.
4
Table of Contents Technical Report Documentation Page ......................................................................................................................... 2
Acknowledgements ....................................................................................................................................................... 3
Table of Contents........................................................................................................................................................... 4
Executive Summary ....................................................................................................................................................... 5
Chapter 1. Introduction .................................................................................................................................................. 7
Chapter 2. Literature Review ......................................................................................................................................... 9
Chapter 3. The Corridor: IH 10 East Houston to Texas State Line ............................................................................ 12
Chapter 4. Corridor Findings: IH 10 East Houston to Texas State Line ................................................................... 15
Chapter 5. Research Summary .................................................................................................................................... 22
References ................................................................................................................................................................... 24
Appendix A: Percent of Income Spent on Transportation .......................................................................................... 25
5
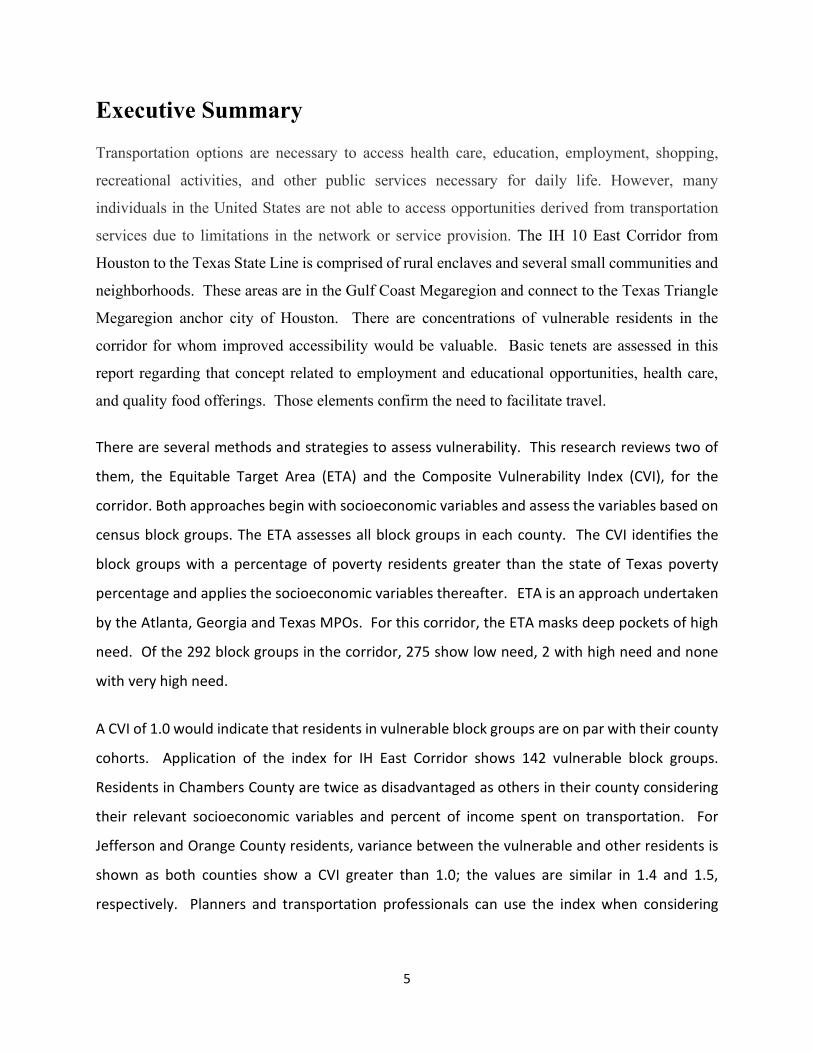
Executive Summary
Transportation options are necessary to access health care, education, employment, shopping,
recreational activities, and other public services necessary for daily life. However, many
individuals in the United States are not able to access opportunities derived from transportation
services due to limitations in the network or service provision. The IH 10 East Corridor from
Houston to the Texas State Line is comprised of rural enclaves and several small communities and
neighborhoods. These areas are in the Gulf Coast Megaregion and connect to the Texas Triangle
Megaregion anchor city of Houston. There are concentrations of vulnerable residents in the
corridor for whom improved accessibility would be valuable. Basic tenets are assessed in this
report regarding that concept related to employment and educational opportunities, health care,
and quality food offerings. Those elements confirm the need to facilitate travel.
There are several methods and strategies to assess vulnerability. This research reviews two of
them, the Equitable Target Area (ETA) and the Composite Vulnerability Index (CVI), for the
corridor. Both approaches begin with socioeconomic variables and assess the variables based on
census block groups. The ETA assesses all block groups in each county. The CVI identifies the
block groups with a percentage of poverty residents greater than the state of Texas poverty
percentage and applies the socioeconomic variables thereafter. ETA is an approach undertaken
by the Atlanta, Georgia and Texas MPOs. For this corridor, the ETA masks deep pockets of high
need. Of the 292 block groups in the corridor, 275 show low need, 2 with high need and none
with very high need.
A CVI of 1.0 would indicate that residents in vulnerable block groups are on par with their county
cohorts. Application of the index for IH East Corridor shows 142 vulnerable block groups.
Residents in Chambers County are twice as disadvantaged as others in their county considering
their relevant socioeconomic variables and percent of income spent on transportation. For
Jefferson and Orange County residents, variance between the vulnerable and other residents is
shown as both counties show a CVI greater than 1.0; the values are similar in 1.4 and 1.5,
respectively. Planners and transportation professionals can use the index when considering

6
public transit projects for vulnerable communities, particularly to improve access to proximate
to megaregions.
7
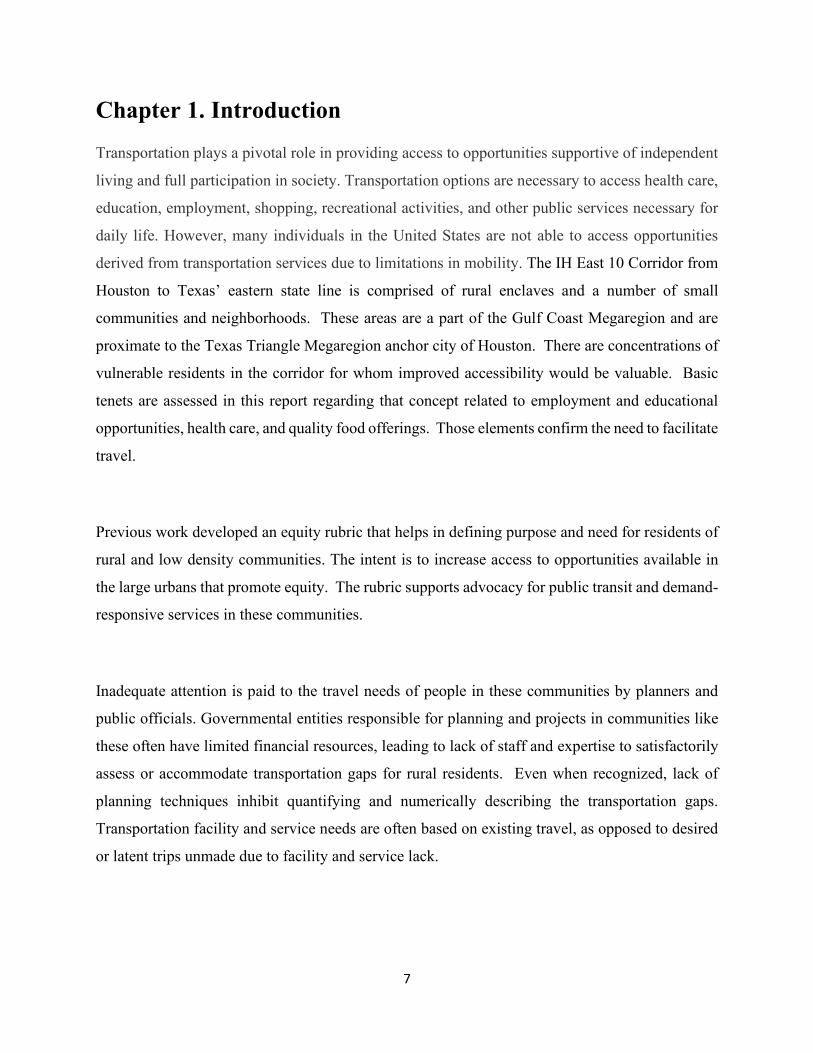
Chapter 1. Introduction
Transportation plays a pivotal role in providing access to opportunities supportive of independent
living and full participation in society. Transportation options are necessary to access health care,
education, employment, shopping, recreational activities, and other public services necessary for
daily life. However, many individuals in the United States are not able to access opportunities
derived from transportation services due to limitations in mobility. The IH East 10 Corridor from
Houston to Texas’ eastern state line is comprised of rural enclaves and a number of small
communities and neighborhoods. These areas are a part of the Gulf Coast Megaregion and are
proximate to the Texas Triangle Megaregion anchor city of Houston. There are concentrations of
vulnerable residents in the corridor for whom improved accessibility would be valuable. Basic
tenets are assessed in this report regarding that concept related to employment and educational
opportunities, health care, and quality food offerings. Those elements confirm the need to facilitate
travel.
Previous work developed an equity rubric that helps in defining purpose and need for residents of
rural and low density communities. The intent is to increase access to opportunities available in
the large urbans that promote equity. The rubric supports advocacy for public transit and demand-
responsive services in these communities.
Inadequate attention is paid to the travel needs of people in these communities by planners and
public officials. Governmental entities responsible for planning and projects in communities like
these often have limited financial resources, leading to lack of staff and expertise to satisfactorily
assess or accommodate transportation gaps for rural residents. Even when recognized, lack of
planning techniques inhibit quantifying and numerically describing the transportation gaps.
Transportation facility and service needs are often based on existing travel, as opposed to desired
or latent trips unmade due to facility and service lack.

8
Addressing this gap and improving planning methodology are important for people who live in
rural and small urban communities so improved transportation can lead to upgraded living and,
perhaps, enable a stronger tax base for their local economy. There are a number of methods and
strategies to assess vulnerability. This research reviews two of them for the corridor, the Equitable
Target Area (ETA) and the Composite Vulnerability Index (CVI).
9
Chapter 2. Literature Review Determining Need A purpose and need statement is required for any transportation project to be considered for
approval by the USDOT. Therefore, the first step in planning any transportation project is
assessing the need to support its implementation. The need is the gap between the deficiency or
problem identified within an area’s transportation system and the possible solutions that can be
implemented. It is often a challenge to strongly support the need for transportation improvements
or developments for rural and small towns because their problems do not seem as significant as
those of urban areas. Therefore, the severity of transportation need for these communities has to
be quantified and justified using the community’s well-being and vulnerability.
There are many categories and definitions of community well-being, but it can be summarized as
the combination of social, economic, environmental, cultural, and political conditions identified
by individuals and their communities as essential for them to flourish and fulfil their potential1.
Some general indicators of a community’s well-being are employment, health, educational
achievement, quality of health services, transportation access, voter participation, and financial
stability2. When communities become deficient in these factors, they are considered vulnerable.
Vulnerable populations comprise the economically disadvantaged, racial and ethnic minorities, the
uninsured, low-income children, the elderly, the homeless, those with chronic health conditions,
lack of accessibility to social services3. In rural and small towns, not only is the quality of
community well-being deteriorating, but the percentage of vulnerable populations is also
increasing in rural and small towns. Findings comparing the years 2000 and 2010 show that rural
areas increased in poverty, unemployment, 65 and older (elderly) population, minority population,
1 Atkinson, S., Bagnall, A., Corcoran, R., South, J., et al. (2017). What is Community Wellbeing? Conceptual Review. Retrieved from Research Gate. 2 Sung, H., Phillips, R. G. (2018). Indicators and Community Well-Being: Exploring a Relational Framework. International Journal of Community Well-Being. Vol. 1, pp. 63–79 https://doi.org/10.1007/s42413-018-0006-0. 3 American Journal of Managed Care (2006). Vulnerable Populations: Who are They? Retrieved from The American Journal of Managed Care.
10
and lack of education4. By providing people with opportunities for better well-being and helping
them realize those opportunities, policymakers would not only be acting to promote well-being as
an intrinsic good, they would also be minimizing vulnerability and investing in people’s potential
and in key drivers for long-term economic growth5. Further, improved lifestyles for rural and low
density residents could ripple to strengthen the economic base of the communities where they live.
Through transportation improvement and development projects, policymakers can enhance the
well-being of any community, especially rural and small towns. Rural and small towns are usually
more vulnerable because of their lack of access to basic services, amenities, health centers, schools,
and employment opportunities. Stommes and Brown6 reported that only one-third (about 32%) of
all rural counties have full access to public transportation services and, if the 28% of communities
that have limited access are counted, that leaves 40% of the rural residents with no public transit
options at all. The authors pointed out that for low-income individuals, long commutes and lack
of transportation are barriers for getting to workplaces. Also, findings confirmed that rural areas
struggle more with healthcare barriers than urban and small urban areas.
Therefore, making public transportation possible can improve the lives of people in these
communities. The United States is not at pace with other countries in conducting studies on how
to address transportation in vulnerable and rural and small communities. These communities are
disadvantaged because of lack of transportation and high cost associated with using the available
transportation means7. Residents in poverty within these rural and small-town communities cannot
afford the transportation that grants them the accessibility to employment and education
opportunities that could potentially redeem them from their poverty condition.
4 Bennett, K. J., Lin, Y., Yeun, M., Leonhirth, D., Probst, J. C. (2016). South Carolina Rural Health Research Center. Retrieved from the South Carolina State Library’s Digital Collection. 5 United Nations Center for Regional Development (2017). Rural-Urban Connectivity in Achieving Sustainable Regional Development. Retrieved from the United Nations Centre for Regional Development. 6 Stommes, Eileen S. & Brown, Dennis M., 2002. "Transportation in Rural America: Issues for the 21st Century," Rural America/ Rural Development Perspectives, United States Department of Agriculture, Economic Research Service, vol. 16(4), January. 7 Pyrialakou, D. V., Gkritza, K., Fricka, J. D. (2016). Accessibility, Mobility and Realized Travel Behavior: Assessing of Transport Disadvantaged. Journal of Transport Geography. Vol. 51, pp.252-269 https://doi.org/10.1016/j.jtrangeo.2016.02.001.

11
In considering transportation problems in rural and small-town communities, it is imperative to
understand that every rural and small-town community is different. The Rural Policy Research
Institute emphasizes that there is more than one type of “rural” community, and the travel behavior
and needs of rural residents vary depending on whether they live in an exurb, a tourist destination
or an agricultural or mining community8. The type and level of vulnerability within the population
differs and is changing, and therefore a general solution cannot be viable for every rural and small-
town community. Because of these differences, there is diversity in the trips made by residents in
these communities. Therefore, various travel options must be considered to meet the transportation
needs of the community.
In some rural areas where population density is low and dispersed, trips made are usually
infrequent. Therefore, a regularly scheduled transit system similar to that of urban communities
may not adequately meet the transportation needs of residents in that particular community. To
succeed in rural communities, public transportation often must operate flexible schedules and
routes, and it often is an amalgam of various services to accommodate the travel needs of
community residents. In rural areas where residents are widely dispersed, other means of
transportation like cycling, ridesharing, and shuttles, may have to be implemented in addition to a
transit service established to enable residents to access bus stops from their homes. Transportation
planning to meet the travel needs for rural and small-town communities has to be executed
according to the particular community, considering various travel means to effectively serve the
travel needs of the residents.
This research assesses previously designed tools, the Equitable Target Areas (ETA) and the
Composite Vulnerability Index (CVI), to identify vulnerable rural and small urban communities
from Houston east along IH 10 to the Texas State Line with the idea of linking to the megaregion
anchor city of Houston for better work educational opportunities, services and amenities.
8 Rails-to-trails. Active Transportation Beyond Urban Centers: Walking and Bicycling in Small Towns and Rural America. Retrieved from Rails to Rails.

12
Chapter 3. The Corridor: IH 10 Houston East to Texas State Line
The primary Texas megaregion is the Triangle that connects Houston, Dallas and San
Antonio/Austin. Most US megaregion maps also show a link north to Oklahoma City and west
and east as the Gulf Coast Megaregion corridor that extends from Corpus Christie through Houston
to New Orleans. Figure 1 reflects the Triangle and those extents with the Gulf Coast region.
Figure 1. Texas Triangle and Gulf Extension Source: Reddit.
This Gulf Coast Corridor moving east from Houston encompasses several communities including
Mont Belvieu, Winnie, Hamilton before arriving at Beaumont, then continuing to the Texas State
Line. These rural and small urban cities have basic components and amenities that are still limited
compared to availability in the megaregion city of Houston. There are three counties, Chambers,
Jefferson and Orange. For purposes of this work, assessment was conducted pulling block groups
in a 10-mile width, using 5 miles each side of the IH10 centerline. There are roughly 375,000
residents within the three corridors. Chambers County with 44,000 residents is proximate to Harris,
where the Houston is located and is in the metropolitan statistical area of Houston. Roughly
250,000 residents make Jefferson County the largest and it is between Chambers and Orange
Counties. Orange County is east of Jefferson with 83,000 residents. An assessment of the
corridor’s health facilities and food options shows a mix of somewhat available to low to no
availability.
13
3.1 Health Disparities Using data from Google Maps, a combined total of 107 medical facilities were located in
Chambers, Jefferson, and Orange counties. Data for the study area shows that Jefferson County
reported two hospitals located in Nederland and Port Arthur. Chambers County listed two hospitals
located in Baytown and Anahuac. Orange County did not have a hospital.
The Human Resources and Health Services Administration (HRSA) database designates and
scores rural areas based on the primary care Health Professions (HPSAs) (US Health Resources &
Services Administration, 2017). A score from 0-26 is assigned and scores closer to 26 indicate
high need/priority. Jefferson County facilities for low income persons needing primary care
services scored 20 and scored 16 for mental health services. These numbers indicated a greater
need for primary care services in Jefferson County. Chambers County reported score of 13 for the
geographic population category for primary care services and 14 for mental health services.
Orange County showed a score of 16 for geographic population category for primary care services
and 17 for mental health services. The scores in Chambers and Orange counties indicate an average
need in these areas.
3.2 Food Deserts Using data from Google Maps, a combined total of 91 grocery or food stores were located in
Chambers, Jefferson, and Orange Counties. The tri county area includes regional and national
chains, e.g. HEB, Wal-Mart, Kroger, and Family Dollar. Noteworthy is the number of “Mom &
Pop” stores and food markets that play a vital role in the study area. These smaller retailers are not
always full-service grocery stores, but these grocers offer limited selections of produce, meat, and
canned foods. Jefferson County contained multiple locations for the large retailers, e.g. HEB,
Kroger, Wal-Mart and Family Dollar. In addition, Jefferson County also reported smaller local
grocery chains like Market Basket and Brookshire Brothers. Orange County and Chambers
County reported fewer larger regional and national chains than found in Jefferson County. These
counties also showed a strong presence of small “Mom and Pop” grocers and food markets. While
grocers appeared to be well located, the fact may remain that many county residents may lack the
resources or need transportation services to access these facilities.

14
3.4 Transit Planning by Metropolitan Planning Organizations (MPOs) Long and short range planning are conducted by two MPOs in the southeast section of Texas --
Houston Galveston Area Council (HGAC) covering the area along IH10 as the corridor traverses
through Chambers County. Thereafter, as the corridor approaches Beaumont and eastern Jefferson
County, the Southeast Texas Regional Planning Commission’s (SERPC) jurisdiction begins and
continues east through Orange County to the state border with Louisiana. The urban areas with
aggregations of employment, education and health care for the corridor are Houston and
Beaumont. A review of both MPO’s short (Transportation Improvement Program) and long range
(Regional Transportation Plan) plans show the importance of addressing transportation for
vulnerable communities in their short range plan and long range plan. However, specific criteria
that lead to that outcome are not apparent in either of the MPO’s documents.
3.5 Transit in the IH 10 East Corridor Public Transportation is provided by two entities for the southeast Texas area around IH 10 East
– Southeast Texas Transit (SETT) and Beaumont Municipal Transit (BMT). SETT provides curb-
to-curb demand/response transportation service to rural areas of Orange and western Jefferson
Counties. Seniors or persons with disabilities in mid-Jefferson County can also use the service.
South East Texas Regional Planning Commission (SETRPC) is designated a rural transit district
and coalesces with several service agencies for service provision. Residents of Beaumont’s urban
area are served by 10 routes of BMT9. SETRPC also coordinates carpool and vanpool for
commuting, providing another option for residents in the IH 10 East Corridor.
There is no fixed route service in Chambers County for the general population. Specialty service
is provided for seniors, persons with disabilities and those with medical needs. Chambers
County’s east side service runs from 7:30 a.m. to 5 p.m. for seniors and people with disabilities
given 24-hour advanced scheduling for rides to Beaumont, Anahuac and Baytown. There is no
fixed fare, but donations are accepted. The west side of Chambers County is served by Chambers
County Transit requiring a one-week advance notice for low income seniors and people with
disabilities. The span of service is 8 a.m. to 5 p.m. and rides are provided to Harris and Galveston
Counties and to the medical center and VA hospitals in Houston.
9 Transportation and Environmental Resources and Beaumont Municipal Transit. Retrieved August 10, 2020.

15
Chapter 4. ETA and CVI Findings: IH 10 Houston East to Texas State Line
This case study examines a corridor that links Houston via Beaumont to the Texas State Line. Several
important variables form the foundation for the analysis. The vulnerability assessment examined
percentages of female head of household, minority population, non-English speakers (NES),
automobile availability and senior population.
The analysis applies two methods to identify vulnerable communities in the IH 10 East Corridor.
The first is utilized by agencies throughout the country and is the Equitable Target Areas (ETA)
tool. The method uses the traditional variables named above and ranks the block groups in 4
categories from low to very high need. The second method is a Composite Vulnerability Index
that begins by segmenting the block groups that have a higher poverty level than the Texas mean.
Thereafter, the traditional variables are examined, along with an additional variable, percentage
of income spent on transportation.
Table 1 shows the socioeconomic values by county. Chambers County’s poverty value is lower
than the state mean, the other two counties are higher than the mean. The percentages of
female headed households and auto availability are less than or equal to the Texas mean. Orange
County’s non-English speakers and minority percentages are less than or comparable to the
state’s.
Table 1: Vulnerability Values by County
Entity Poverty (%) Female Headed (%)
NES (%) Minority (%)
Homes w/Zero Auto (%)
Chambers 13 3 15 28 2 Jefferson 21 7 20 59 5 Orange 16 6 5 20 3 Texas 16 14 8 21 <5
Source: US Census

16
4.1 Equitable Target Area (ETA) Analysis for Vulnerable Communities
Texas’ largest MPOs, Houston’s HGAC and Dallas area’s NCTCOG, have conducted analyses
using a measure developed by Atlanta’s MPO (Atlanta Regional Commission) for determining
vulnerability. The Equitable Target Area score (ETA) is a tool designed to assist planners in
increasing inclusion and equity through first identifying communities of need. For instance, the
Atlanta area’s MPO uses the ETA in the decision making process to prioritize and evaluate
projects, as well as in review of resource allocation10. The ETA applied to the IH 10 East to Texas
State Line Corridor yields an interesting result described below.
4.1.1. Equitable Target Area Score To assess the study area, the research team examined the following variables: low-income, zero
automobile ownership, female headed households, non-English speaking, poverty, senior status,
and minority status at the Census Block Group (BG) level. The study area included 292 BGs.
Percent per variable based on the total population was calculated. The equation below is an
example:
[∑(variable)/∑(Total Pop)]*100)
This step was followed for each variable; these calculations then represented the equitable target
area (ETA) percentage for the study area. Next, the categories were divided into four categories.
Category 1 represents below or at ETA study area. Category 2 is low need with values slightly
lower than the ETA for the study area. Category 3 is high need and Category 4 is the very highest
need.
The next step involved determining the ETA score for all 292 block groups. All six variables for
each block group were assigned a category score based on the study percentage for each variable.
Next, the block group’s variable was then assigned a category ranging 1 through 4. The ETA score
for the block groups was between a minimum of 6 and the maximum of 16.
10 Atlanta Regional Commission, Equity and Inclusion, retrieved June 11, 2020.

17
Finally, block groups with an ETA score at or below the study area’s score were assigned as
Category 1/Low Need. Two hundred seventy-five (275) block groups received the Category 1.
Category 2/Moderate Need consisted of the 15 block groups with ETA scores above the above the
study area’s score. Category 3/High Need contained 2 block groups Category 4 counted 0 block
groups as Very High Need. The results indicated that very few to no block groups in the study area
were in Category 3/High Need or Category 4/Very High Need (Table 2).
Table 2. Equitable Target Area Block Group Scores
Categories ETA Score Block Groups 1 = Low Need 6 thru 10 275 2 = Moderate Need 11 thru 12 15 3 = High Need 13 thru 14 2 4 = Very High Need 15 thru 16 0
The area is somewhat known in southeast Texas as having pockets of poverty. The finding of zero
very high need block groups and only 2 high need block groups in the three IH 10 East Corridor
counties and most as having low need led the team to consider another method of assessment. The
Composite Vulnerability Index was developed and previously applied to another Texas corridor.
The index facilitates a more micro level analysis of the block groups by first defining them by their
level of poverty11.
4.2 Composite Index for Vulnerable Communities The Composite Vulnerability Index is calculated by identifying the block groups with a mean
poverty percentage higher than the Texas mean of 16%. One hundred forty-two (142) block
groups in the three counties exceed that Texas mean percentage (Figure 2).
11Lewis, Goodwin, Robbins-Stout and Rogers (2019) Framework to Determine Purpose and Need for Increased Travel Options. Source: CM2.

18
Figure 2. Map of 142 Block Groups with Greater Than 16% (rounded) Poverty Rate
Of the 292 block groups that are within 5 miles either side of the IH 10 East Corridor centerline,
142 are vulnerable by having a poverty mean higher than the 16% Texas mean. Table 3 shows
Chambers County with 6 block groups, Jefferson county with 107 block groups, and Orange with
29 block groups. The most prevalent vulnerabilities within the block groups are minority, poverty,
and non-English speaking. Of the 142 vulnerable block groups Jefferson county has the highest
mean minority and poverty percentages (76% and 33% respectively), and has a 24% non-English
speaking population.
When viewing mean percentages, Chambers County shows the second highest mean poverty
percentage of 26% and has 50% minority and 21% non-English speaking mean percentages.
Lastly, Orange County with the lowest mean poverty percentage (25%) has 27% minority and 6%
non-English speaking mean percentages. For the least prevalent vulnerabilities (senior population,
female headed households, and zero automobile), Orange County has the highest mean percentage
of senior population (18%) and Jefferson County has the highest mean percentage of both female
headed households (8%) and zero automobile (9%).

19
Table 3. Vulnerability Variables for Block Groups Exceeding 16% Poverty Rates
County Number of Block Groups
Female Headed (%)
NES (%)
Minority (%)
Poverty (%) Senior (%)
Homes w/Zero Autos (%)
Chambers 6 4 21 50 26 17 2 Jefferson 107 8 24 76 33 14 9 Orange 29 7 6 27 25 18 3
Table 4 shows the mean percentage poverty and ranges for the counties. In addition to the mean
values previously described, the vulnerable block group on the low end of the range are equal to
the Texas mean. However, block groups at the highest levels are 80% in Jefferson, more than
40% in Orange and more than double the Texas mean with 34% in Chambers County.
Table 4. Texas and County Mean and Ranges
County Number of Block Groups
Mean Lowest Highest
Chambers 6 25 16 34 Jefferson 107 33 16 80 Orange 29 25 17 43 Texas 16
Table 5 shows the base data for the Composite Vulnerability Index. Because the female head of
household for each county is less than the Texas mean, that value is not included in the
vulnerability index. Recall that the automobile ownership variable was low for all counties, so it,
also, is not included. The non-English speaking population in the vulnerable block groups are
higher than their county means, as are the percentage of minorities.
20
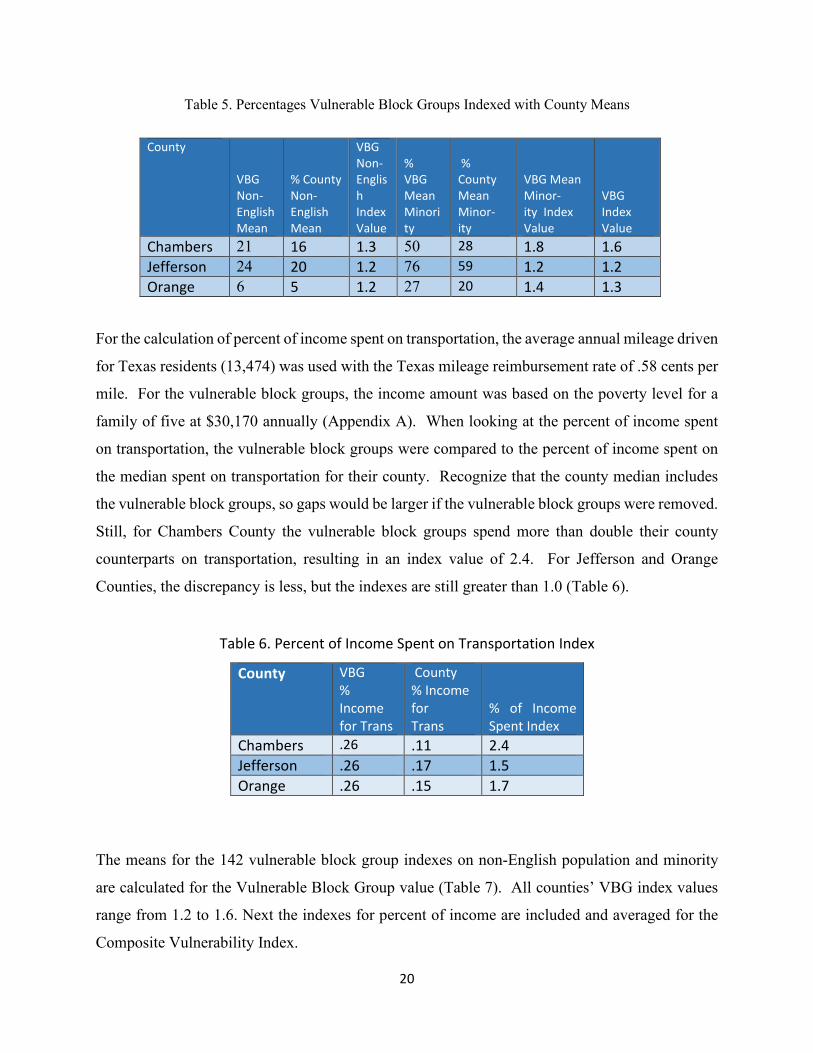
Table 5. Percentages Vulnerable Block Groups Indexed with County Means
For the calculation of percent of income spent on transportation, the average annual mileage driven
for Texas residents (13,474) was used with the Texas mileage reimbursement rate of .58 cents per
mile. For the vulnerable block groups, the income amount was based on the poverty level for a
family of five at $30,170 annually (Appendix A). When looking at the percent of income spent
on transportation, the vulnerable block groups were compared to the percent of income spent on
the median spent on transportation for their county. Recognize that the county median includes
the vulnerable block groups, so gaps would be larger if the vulnerable block groups were removed.
Still, for Chambers County the vulnerable block groups spend more than double their county
counterparts on transportation, resulting in an index value of 2.4. For Jefferson and Orange
Counties, the discrepancy is less, but the indexes are still greater than 1.0 (Table 6).
Table 6. Percent of Income Spent on Transportation Index
County VBG % Income for Trans
County % Income for Trans
% of Income Spent Index
Chambers .26 .11 2.4 Jefferson .26 .17 1.5 Orange .26 .15 1.7
The means for the 142 vulnerable block group indexes on non-English population and minority
are calculated for the Vulnerable Block Group value (Table 7). All counties’ VBG index values
range from 1.2 to 1.6. Next the indexes for percent of income are included and averaged for the
Composite Vulnerability Index.
County VBG Non-English Mean
% County Non-English Mean
VBG Non-English Index Value
% VBG Mean Minority
% County Mean Minor- ity
VBG Mean Minor- ity Index Value
VBG Index Value
Chambers 21 16 1.3 50 28 1.8 1.6 Jefferson 24 20 1.2 76 59 1.2 1.2 Orange 6 5 1.2 27 20 1.4 1.3
21
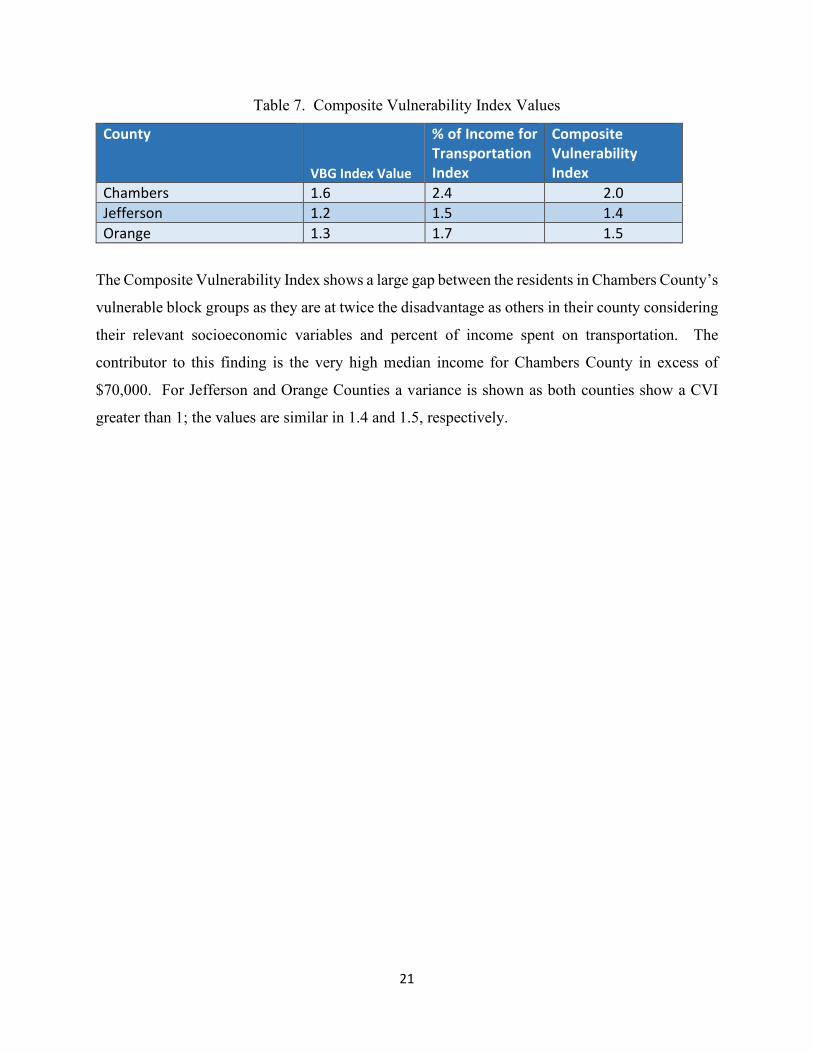
Table 7. Composite Vulnerability Index Values
County
VBG Index Value
% of Income for Transportation Index
Composite Vulnerability Index
Chambers 1.6 2.4 2.0 Jefferson 1.2 1.5 1.4 Orange 1.3 1.7 1.5
The Composite Vulnerability Index shows a large gap between the residents in Chambers County’s
vulnerable block groups as they are at twice the disadvantage as others in their county considering
their relevant socioeconomic variables and percent of income spent on transportation. The
contributor to this finding is the very high median income for Chambers County in excess of
$70,000. For Jefferson and Orange Counties a variance is shown as both counties show a CVI
greater than 1; the values are similar in 1.4 and 1.5, respectively.
22
Chapter 5. Research Summary
5.1 Addressing the Gap Before planning can begin for any transportation, a need must be established. The need is the gap
between the deficiency in the area’s transportation system and the possible solutions to address the
deficiency. Both need and purpose must be shown to begin planning for new transportation service
or a facility and vulnerability should be a consideration. The ETA as a well-used tool for
determining vulnerability served as the starting point prior to conducting the CVI assessment. The
ETA was originally developed for urban areas where variables such as female headed households
and low auto ownership are characteristics shared by low income and minority persons. For rural
and other low density communities, vehicle ownership is a necessity, as there is essentially no
public transportation in many of these areas. Through work in previous rural corridors and the IH
10 East Corridor, the low percentage of female headed households was also confirmed. For these
communities, because all variables do not carry the same importance in rural compared to urban
communities, the ETA tool serves to disguise the intense need for transportation for rural residents.
In comparison, the work of the CVI showed a gap between the vulnerable block groups and other
residents in their counties.
The ETA showed low need for 275 of the 292 block groups in the corridor, 2 with high need and
none with very high need. Only Jefferson had roughly 20% of the block groups showing the
poverty level. Chambers and Orange Counties had 13% and 16%, poverty respectively. Because
the extremes in values are included in the calculation for ETA, significant poverty pockets may be
masked. The CVI work determined there is a need for additional shared ride or public
transportation options for 142 block groups in the three counties along the IH 10 East Corridor
connecting Houston to the state line through Chambers, Jefferson and Orange Counties.
The CVI demonstrated the need via the socioeconomic criteria and the purpose by highlighting the
percentage of income spent on transportation. That these vulnerable individuals and families must
spend a larger portion of their income moving around leaves less for all other needs. Disposable
income is lost for higher education pursuits or access to better employment, spending that could
lead to improved lifestyles. Rural and small-town residents are often challenged in making their

23
case for public transportation improvements because their problems do not seem as significant as
those of urban areas. Unless we identify and examine the vulnerable block groups, people there
can see their level of need buried among the haves in nearby neighborhoods.
5.2 Findings and Recommendations for Future Decision Making The MPOs leading decision making for the communities in the IH 10 East Corridor require a
statement of purpose and need to begin a transportation project. By applying traditional
socioeconomic characteristics and adding the percentage of income spent on transportation by the
vulnerable population compared to their county’s mean, the CVI documents the need of low
income rural and low density populations. Purpose is implied as the percentage of their income
spent on transportation is viewed. There is no way to lower the dollars spent by requiring
additional driving individually. Lowering transportation costs for rural and low density residents
will require public options that include sharing rides. Public transportation is an option but will
require non-traditional thinking to manage costs. Coordinated carpooling or vanpooling could be
considered to improve accessibility to educational complexes or job centers in proximate urban
areas. The discussion about health disparities and food insecurity are trips that do not require daily
travel, so it is important to recognize that transportation options be tailored to the specific
communities and needs. Organizing so as to streamline payment options and facilitate transfers to
urban transportation would expand the attainable destinations.
Planners and transportation professionals can use the index when considering public service and
facility projects for these communities. Also, as conversations and technology improve for
automated vehicles, opportunities may be available to enhance travel options for vulnerable
rural and low density residents.

24
References American Journal of Managed Care (2006). Vulnerable Populations: Who are They? Retrieved from
https://www.ajmc.com/journals/supplement/2006/2006-11-vol12-n13suppl/nov06-2390ps348-s352?p=3.
Atkinson, S., Bagnall, A., Corcoran, R., South, J., et al. (2017). What is Community Wellbeing?
Conceptual Review. Retrieved from www.researchgate.net. Atlanta Regional Commission, Equity and Inclusion, https://atlantaregional.org/regional-equity-and-
inclusion/. Retrieved June 11, 2020. Bennett, K. J., Lin, Y., Yeun, M., Leonhirth, D., Probst, J. C. (2016). South Carolina Rural Health
Research Center. Retrieved from https://dc.statelibrary.sc.gov/handle/10827/23157. Chambers County Economic Development Outlook.
https://www.co.chambers.tx.us/upload/page/0104/docs/EconomicOverviewChambersCounty, Retrieved July 1, 2020.
Lewis, Goodwin, Robbins-Stout and Rogers (2019) Framework to Determine Purpose and Need for
Increased Travel Options. Retrieved from
https://sites.utexas.edu/cm2/files/2020/03/Application-of-Equity-Rubric-TSU-Yr-2.pdf.
Pyrialakou, D. V., Gkritza, K., Fricka, J. D. (2016). Accessibility, Mobility and Realized Travel Behavior: Assessing of Transport Disadvantaged. Journal of Transport Geography. Vol. 51, pp.252-269 https://doi.org/10.1016/j.jtrangeo.2016.02.001.
Rails-to-trails. Active Transportation Beyond Urban Centers: Walking and Bicycling in Small Towns and
Rural America. Retrieved from https://www.railstotrails.org/resourcehandler.ashx?id=4141. Stommes, Eileen S. & Brown, Dennis M., 2002. "Transportation in Rural America: Issues for the 21st
Century," Rural America/ Rural Development Perspectives, United States Department of Agriculture, Economic Research Service, vol. 16(4), January.
Sung, H., Phillips, R. G. (2018). Indicators and Community Well-Being: Exploring a Relational
Framework. International Journal of Community Well-Being. Vol. 1, pp. 63–79 https://doi.org/10.1007/s42413-018-0006-0.
Transportation and Environmental Resources https://www.setrpc.org/south-east-texas-transit/ and
Beaumont Municipal Transit http://beaumonttransit.com/. Retrieved August 10, 2020.
United Nations Center for Regional Development (2017). Rural-Urban Connectivity in Achieving Sustainable Regional Development. Retrieved from https://www.uncrd.or.jp/content/documents/5048Final%20Background%20Paper%20for%20EST%20Plenary%20Session%203%20(1)-rev-3.pdf.

25
Appendix A: Percent of Income Spent on Transportation
The data for the calculations of percent of income spent on transportation are shown through the population, statistics on average annual miles driven and the state of Texas mileage reimbursement rate of .58 cents.
Table A1. Total Mileage and Dollars Spent on Transportation for IH10 East Corridor
County Popu- lation
Annual Mean Miles Driven Per Capita Total Miles
Annual Dollars Spent per County
County Median Income
Vulnerable Household Income*
Chambers 6,707 13,474 90,370,118 $52,414,668 $74,368 $30,170 Jefferson 118,423 13,474 1,595,631,502 $925,466,271 $47,177 $30,170 Orange 1442 13,474 1943 $1127 $53,667 $30,170
* Annual Poverty Level Household Income for Family of Five
Table A2. Percent of Income Spent per Household County Median Spent per
Vulnerable Block Group
Median Spent per Household County Wide
Index Spent Per Vulnerable Block Group Compared to County Median
Chambers .26 .11 2.46 Jefferson .26 .15 1.56 Orange .26 .17 1.78