application of fractional factorial design to optimize...
TRANSCRIPT
R ESEARCH ARTICLE
doi: 10.2306/scienceasia1513-1874.2011.37.219
ScienceAsia 37 (2011): 219–224
Application of fractional factorial design to optimizeextraction method of artemisinin from Artemisia annuaMunawar Khalila,∗, Latifah K. Darusmanb,c, Utami D. Syafitrid
a Department of Chemical Engineering, Faculty of Engineering, University of Malaya, Kuala Lumpur 50603,Malaysia
b Biopharmaca Research Center, Bogor Agricultural University, Jl. Taman Kencana No. 3, Bogor 16151,Indonesia
c Department of Chemistry, Faculty of Mathematics and Natural Sciences, Bogor Agricultural University,Bogor, Indonesia
d Department of Statistic, Faculty of Mathematics and Natural Sciences, Bogor Agricultural University,Bogor, Indonesia
∗Corresponding author, e-mail: [email protected] 9 Dec 2010
Accepted 11 May 2011
ABSTRACT: Fractional factorial design was applied to optimize the extraction process of artemisinin from Artemisia annuaL. Three different techniques i.e., Soxhlet, maceration, and microwave-assisted extraction were optimized to determine theoptimum extraction conditions. Thin layer chromatography and high performance liquid chromatography were used todetermine the yield of artemisinin in the sample. The optimum condition was obtained by immersing 0.5 g of sample in 3 mlof chloroform for 2 min. The amount of artemisinin extracted from the sample was 47.9± 0.6× 10⁻³% w/w. In addition,the predicted values calculated by the model were in good agreement with the experimental values.
KEYWORDS: optimization, dummy variables, ANOVA, TLC, HPLC, antimalarial
INTRODUCTION
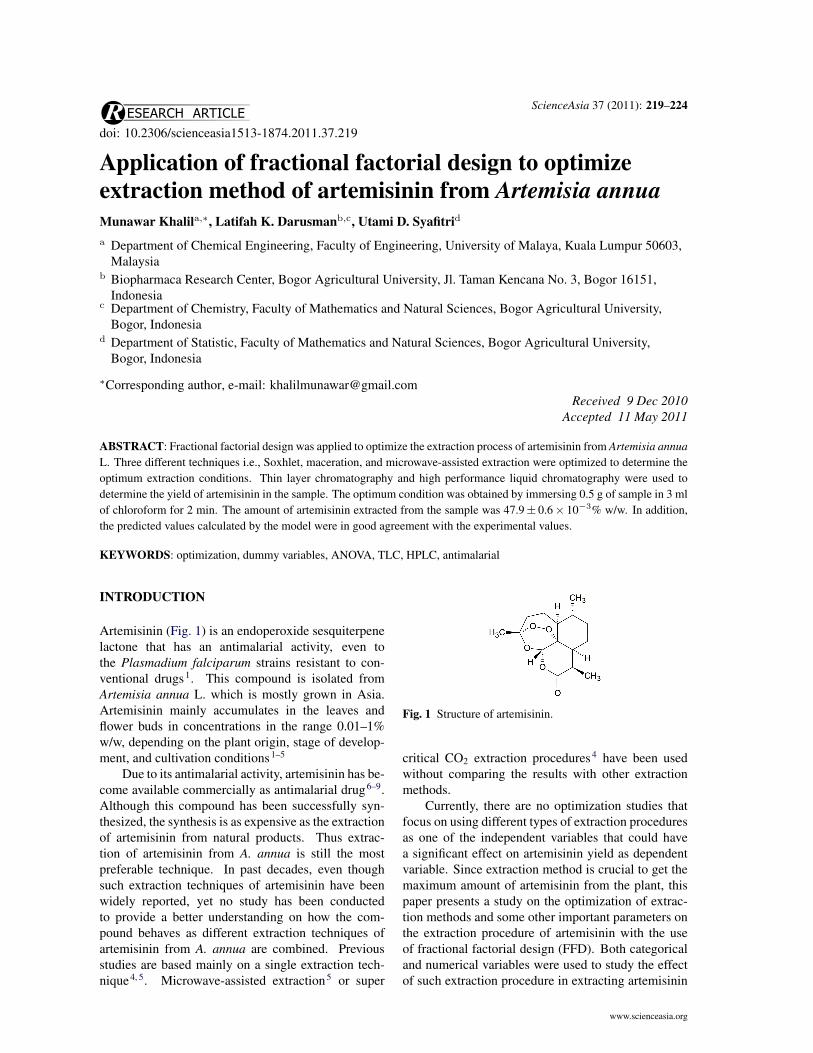
Artemisinin (Fig. 1) is an endoperoxide sesquiterpenelactone that has an antimalarial activity, even tothe Plasmadium falciparum strains resistant to con-ventional drugs1. This compound is isolated fromArtemisia annua L. which is mostly grown in Asia.Artemisinin mainly accumulates in the leaves andflower buds in concentrations in the range 0.01–1%w/w, depending on the plant origin, stage of develop-ment, and cultivation conditions1–5
Due to its antimalarial activity, artemisinin has be-come available commercially as antimalarial drug6–9.Although this compound has been successfully syn-thesized, the synthesis is as expensive as the extractionof artemisinin from natural products. Thus extrac-tion of artemisinin from A. annua is still the mostpreferable technique. In past decades, even thoughsuch extraction techniques of artemisinin have beenwidely reported, yet no study has been conductedto provide a better understanding on how the com-pound behaves as different extraction techniques ofartemisinin from A. annua are combined. Previousstudies are based mainly on a single extraction tech-nique4, 5. Microwave-assisted extraction5 or super
Fig. 1 Structure of artemisinin.
critical CO2 extraction procedures4 have been usedwithout comparing the results with other extractionmethods.
Currently, there are no optimization studies thatfocus on using different types of extraction proceduresas one of the independent variables that could havea significant effect on artemisinin yield as dependentvariable. Since extraction method is crucial to get themaximum amount of artemisinin from the plant, thispaper presents a study on the optimization of extrac-tion methods and some other important parameters onthe extraction procedure of artemisinin with the useof fractional factorial design (FFD). Both categoricaland numerical variables were used to study the effectof such extraction procedure in extracting artemisinin
www.scienceasia.org

220 ScienceAsia 37 (2011)
from A. annua. In this study, three parameters,extraction methods (categorical variable), the ratiobetween sample and solvent (numerical variable), andextraction time (numerical variable) were optimizedto get the highest yield of artemisinin as its response.The total artemisinin was analysed using thin layerchromatography (TLC) and high performance liquidchromatography (HPLC). From the optimization pro-cess, a mathematical model was generated to predictthe amount of artemisinin extracted from the samplefor different values of the variables, and to describe thesignificance and the effect of such important variablesto the artemisinin yield; in this case, extraction timewas also included as a variable.
EXPERIMENTS
Materials
A. annua samples were provided by Medicinal CropsResearch Institute, Ministry of Health, Indonesia. Asextraction solvent, analytical reagent grade of hex-ane, chloroform, and methanol were purchased fromMerck (purity 98%). A GF254 silica gel plate wasused in thin layer chromatography analysis. An HPLCgrade of methanol, acetonitrile, and ethyl acetate(Merck, purity 99%) were used as mobile phase inHPLC analysis. Pure artemisinin from Sigma Aldrich(purity 98%) was used as a standard.
Extraction Method
In this study, three different extraction methods,namely Soxhlet, maceration, and microwave-assistedextraction (MAE), were used to extract artemisininfrom the plant sample. Two independent numericalvariables, namely the sample/solvent ratio and theextraction time, were varied to optimize the extractionof artemisinin. For each type of categorical variable(extraction methods), the range of numerical vari-ables (sample/solvent ratio and extraction time) aredifferent. All three independent variables (extractionmethod, sample/solvent ratio, and extraction time)were combined randomly by the software based onfractional factorial design (FFD) rules to optimizethe effect of those three variables to the yield ofartemisinin. A series of trials were conducted basedon this experimental design randomly generated byFFD. The extraction methods used in this study werethe following:
Soxhlet extraction
In the Soxhlet extraction method, the samples wereextracted with hexane using three different sample/-solvent ratios (25/250, 50/250, and 100/250 g/ml)
during three different times (90, 180, and 360 min).Following the extraction process, the filtrates werecollected and then concentrated using rotary evapora-tor until a waxy paste was obtained. These paste fil-trates were then diluted in hexane (with the ratio 12 mlof hexane for each gram of concentrated filtrate) andleft overnight. This hexane-filtrate solution was thenfiltered and the hexane-soluble phase was partitionedusing liquid-liquid extraction with acetonitrile. Theacetonitrile phase was then used in further quantifica-tions in TLC and HPLC analysis.
Maceration extraction
In the maceration technique, samples were immersedin chloroform at three different sample/solvent ratios(0.5/3, 1/6, and 2/12 g/ml) for three different extrac-tion times (0.5, 1, and 2 min). After the extraction, thesolutions were filtrated and the filtrates used in furtherquantifications in TLC and HPLC analysis.
Microwave-assisted extraction (MAE)
In MAE, samples were extracted with hexane atthree different sample/solvent ratios (0.5/30, 1/60,and 2/120 g/ml) for three different extraction times(7.5, 15, and 30 min) using microwave extractionapparatus. After the extraction, the solutions werethen filtrated to separate the raw plant sample and theextract filtrate. These filtrates were then partitionedusing liquid-liquid extraction technique with acetoni-trile. The acetonitrile phase was then used in furtherquantifications in TLC and HPLC analyses.
Quantification of artemisinin
The existences of artemisinin in the sample were con-firmed both qualitatively and quantitatively using thinlayer chromatography (TLC) and high performanceliquid chromatography (HPLC). In the qualitativeanalysis using TLC, artemisinin standard and extractsolutions obtained from the extraction process werespotted onto the silica gel GF254 TLC plate. ThisTLC system was then developed using 7.5% of ethylacetate in chloroform as its mobile phase. To detectthe presence of artemisinin in the sample, the platewas sprayed with 50% of sulphuric acid and thenheated at 100 °C for an hour. Comparison of reten-tion factor (Rf ) of standard and sample was used todetermine which spot belongs to artemisinin.
For quantitative analysis, HPLC analysis wascarried out to identify and quantify the presence andthe amount of artemisinin in the sample using a Hi-tachi HPLC instrument (pump model L-2130, columnoven model L-2300) equipped with UV-Vis Detector(model L-2420). The analysis was conducted with
www.scienceasia.org
ScienceAsia 37 (2011) 221
pre-column method, in which all extract solutionswere evaporated from their solvent, and then dilutedwith 200 µl of methanol and 800 µl of NaOH 0.2%.The solutions were then heated at 50 °C for 30 min,and then another 200 µl of methanol and 800 µlof acetic acid 0.05 M were added to the solution.The final solutions were then injected to the HPLCinstrument based on a described method7, usinga C-18 column (Li-Chrospher, diameter: 4.6 mm,length: 125 mm). The mobile phase used wasmethanol/acetonitrile/buffer, 0.9 mM Na2HPO4, and3.6 mM NaH2PO4 (pH: 7.76) in a ratio 45/10/45. Flowrate was maintained at 0.3 ml/min, injection volumewas 20 µl, and detector wavelength was at 260 nm.
Experimental design and optimization
To investigate the effect of tested independent vari-ables to the response within the investigation range,a fractional factorial design (FFD) analysis was per-formed. In FFD, the number of experimental points isexpressed as jk−1, where j is the number of factorstested and k is the number of levels. Since therewere three factors and three levels, this results in nineexperimental points that were carried out in randomorder. In addition, to model the relationship betweenthe responses and the variables tested, the data weresubjected to a multiple linear regression analysis.
Since the extraction method is a categorical data,to use it in the regression analysis it needs to beconverted to a “dummy” variable. A dummy variableis a numerical variable that is used to represent abinary categorical variable8. The number of dummyvariables required to represent categorical data withmultiple levels (n) is expressed as (n − 1). Thussince there are three different extraction methods to beoptimized (n = 3), two dummy variables are requiredto represent them (assigned as D1 and D2). Table 1presents the two dummy variables used to representthe extraction method. In addition, all the numericvariables (the ratio of sample/solvent and extractiontime) are assigned three successive coded levels. Thehigh, middle, and low range are assigned the codedlevels 2, 1, and 0.5, respectively. Table 2 presentsthe range of numeric independent variables and theircoded level. In this study, each point was carried out intwo repetitions. Those experimental designs (in codedlevel) are presented in Table 3.
Statistical analysis
To investigate the success of the optimization process,ANOVA was used for graphical analysis of the data.The coefficient of determination, R2, was used tocheck on the quality of model generated, and the
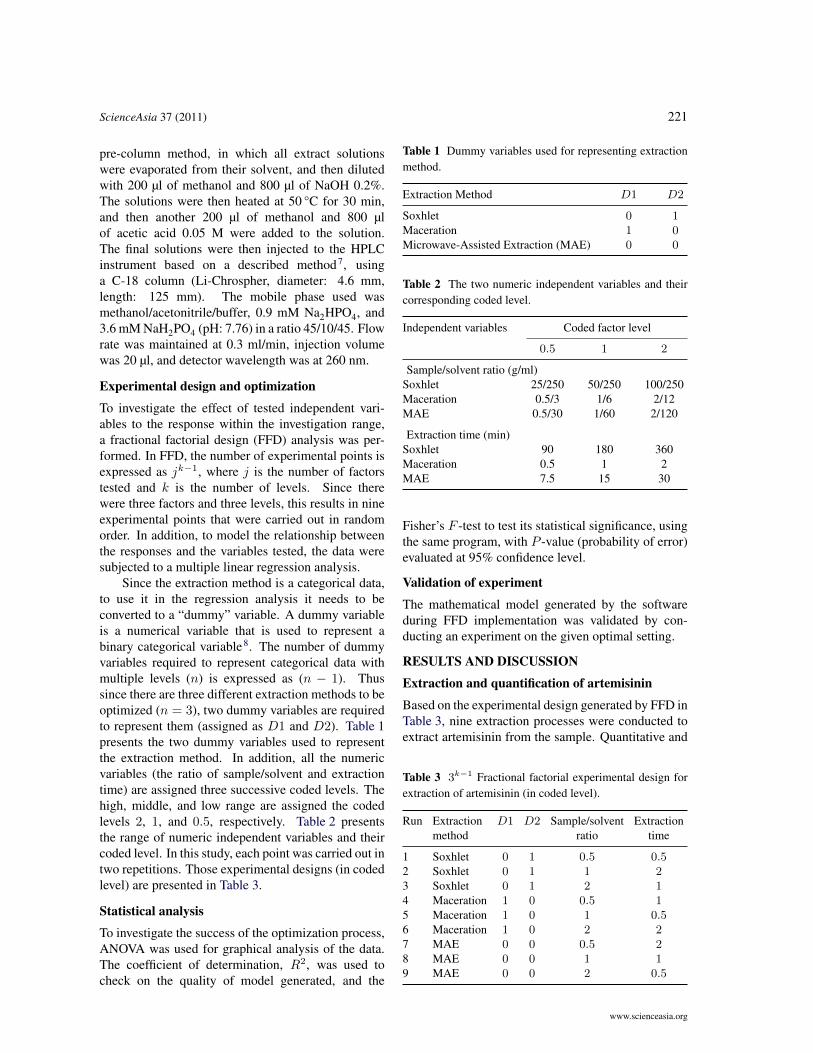
Table 1 Dummy variables used for representing extractionmethod.
Extraction Method D1 D2
Soxhlet 0 1Maceration 1 0Microwave-Assisted Extraction (MAE) 0 0
Table 2 The two numeric independent variables and theircorresponding coded level.
Independent variables Coded factor level
0.5 1 2
Sample/solvent ratio (g/ml)Soxhlet 25/250 50/250 100/250Maceration 0.5/3 1/6 2/12MAE 0.5/30 1/60 2/120
Extraction time (min)Soxhlet 90 180 360Maceration 0.5 1 2MAE 7.5 15 30
Fisher’s F -test to test its statistical significance, usingthe same program, with P -value (probability of error)evaluated at 95% confidence level.
Validation of experiment
The mathematical model generated by the softwareduring FFD implementation was validated by con-ducting an experiment on the given optimal setting.
RESULTS AND DISCUSSION
Extraction and quantification of artemisinin
Based on the experimental design generated by FFD inTable 3, nine extraction processes were conducted toextract artemisinin from the sample. Quantitative and
Table 3 3k−1 Fractional factorial experimental design forextraction of artemisinin (in coded level).
Run Extraction D1 D2 Sample/solvent Extractionmethod ratio time
1 Soxhlet 0 1 0.5 0.52 Soxhlet 0 1 1 23 Soxhlet 0 1 2 14 Maceration 1 0 0.5 15 Maceration 1 0 1 0.56 Maceration 1 0 2 27 MAE 0 0 0.5 28 MAE 0 0 1 19 MAE 0 0 2 0.5
www.scienceasia.org

222 ScienceAsia 37 (2011)
Fig. 2 TLC chromatogram for extraction of A. annua andstandard of artemisinin (k1: k run, first repetition; k2: k
run, second repetition; k = 1, 2, . . . , 9).
Fig. 3 Chemical reaction pathways for artemisinin derivati-zation to Q260 7.
qualitative analysis were then conducted to quantifythe response.
The chromatogram shows a spot at Rf = 0.78showing that all extraction procedures had success-fully extracted artemisinin from the sample (Fig. 2).In addition, it can also be inferred that both Soxhletand MAE extracted more substances than maceration,as evidenced by the larger number of spots. A pos-sible explanation is that these techniques use thermal(Soxhlet) and microwave (MAE) energy to break cellmembrane of the plant.
In the quantitative analysis conducted with thepre-column technique, artemisinin is previously con-verted into Q260 before injection into the HPLC in-strument. Q260 is an artemisinin derivative compoundthat can strongly absorb UV light at 260 nm. Manystudies have been conducted to determine the chemi-cal derivation pathways of artemisinin to Q2607, 9, 10.These chemical reaction pathways are presented inFig. 3.
Based on the given chemical reaction pathways,artemisinin was hydrolysed using base and acid toform Q260. At first, artemisinin was hydrolysedusing NaOH in order to break the ring B, C, and D(lactone) on the artemisinin structure to form Q292.Afterwards, Q292 was hydrolysed again using aceticacid. In this process, a proton (H+) activates a pair
Peak Q260
(a)
Peak Q260
(b)
Peak Q260
(c)
Peak Q260
(d)
Fig. 4 HPLC chromatograms of (a) standard artemisinin20 ppm; (b) extract from 360 min of Soxhlet extraction at theratio sample/solvent of 50/250 g/ml (Run 2); (c) extract from2 min of maceration extraction at the ratio sample/solvent of2/12 g/ml (Run 6); (d) extract from 30 min of MAE methodat the ratio sample/solvent of 0.5/30 g/ml (Run 7).
of free electrons in the oxygen to form a heterocyclicpiran ring that integrates to ring A to form Q260. Inthe HPLC chromatogram (Fig. 4) the peak of Q260was observed at a retention time of approximately4.3 min. From the calculated yields (Table 4), it isobvious that maceration techniques extracted moreartemisinin than Soxhlet and MAE. The peak area forQ260 for maceration (Fig. 4c) was larger than both inthe Soxhlet (Fig. 4b) and MAE (Fig. 4d).
Apparently, Soxhlet and MAE procedures extractmost of the plant soluble components. But they alsoextract massive amounts of large compounds (e.g.,chlorophyll) that may interfere with HPLC (clogging)or MS (matrix). Even though additional samplepreparations can be conducted, such as filtering, evap-orating, or specific solid phase extraction, to reducethe amount of these interferences, the procedures are
www.scienceasia.org
ScienceAsia 37 (2011) 223
Table 4 Yield of artemisinin in the sample based on HPLCanalysis.
Run D1 D2 X1 X2 Yield of artemisinin± SDa
(× 10−3% w/w)
1 0 1 0.5 0.5 3.04± 0.052 0 1 1 2 8.23± 0.033 0 1 2 1 3.22± 0.064 1 0 0.5 1 34.3± 0.25 1 0 1 0.5 42.7± 0.36 1 0 2 2 46.05± 0.047 0 0 0.5 2 38.92± 0.098 0 0 1 1 35.21± 0.089 0 0 2 0.5 19.34± 0.04
X1: Sample/solvent ratio.X2: Extraction time.
a SD: standard deviation
not only time consuming and may reduce the recovery.In the case of artemisinin extraction, interference byother compounds can be avoided by maintaining theintegrity of the cell membrane, as artemisinin is local-ized entirely in the subcuticular space of the glandulartrichome11. During maceration, as the cell membraneis not disrupted, unwanted massive compounds likechlorophyll do not appear in the extract.
Statistical analysis
To optimize the extraction method with a highestyield, a fractional factorial design (FFD) optimizationwas conducted. The independent variables and re-sponse values shown in Table 4 were used to generatea mathematical model that expresses the behaviour ofthe experiment. This model allows the assessment ofpredicted response (Y ) as a function of the indepen-dent variables and their interactions. The calculatedmodel in terms of coded factors generated by FFD forthe responses in this study is:
Y = 26.5−2.30X1+6.33X2+9.87D1−26.3D2,(1)
where Y is yield of artemisinin; X1 (sample/solventratio), X2 (extraction time), D1, and D2 (dummyvariables) are the independent variables.
To assess the goodness of the fit of the modelthat has been generated by the FFD, the ANOVA wasconducted. The probability of error P was 0.011,R2 was 0.938, adjusted R2 0.877, adequate precision(AP) 10.35, standard deviation (SD) 0.10, and coef-ficient of variation (CV) 1.25%. Based on the result,it is shown that the model is good enough to expressthe interaction of the independent variables and theirresponses. The calculated R2 values are desirably
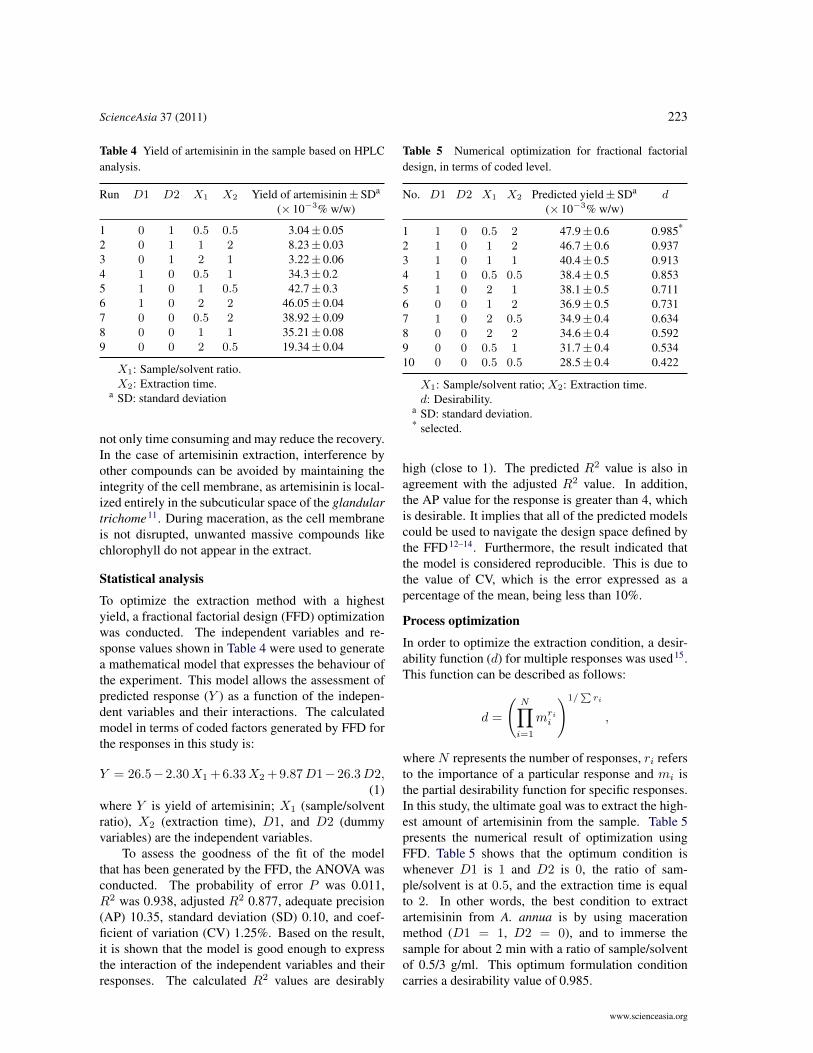
Table 5 Numerical optimization for fractional factorialdesign, in terms of coded level.
No. D1 D2 X1 X2 Predicted yield± SDa d(× 10−3% w/w)
1 1 0 0.5 2 47.9± 0.6 0.985*
2 1 0 1 2 46.7± 0.6 0.9373 1 0 1 1 40.4± 0.5 0.9134 1 0 0.5 0.5 38.4± 0.5 0.8535 1 0 2 1 38.1± 0.5 0.7116 0 0 1 2 36.9± 0.5 0.7317 1 0 2 0.5 34.9± 0.4 0.6348 0 0 2 2 34.6± 0.4 0.5929 0 0 0.5 1 31.7± 0.4 0.53410 0 0 0.5 0.5 28.5± 0.4 0.422
X1: Sample/solvent ratio; X2: Extraction time.d: Desirability.
a SD: standard deviation.* selected.
high (close to 1). The predicted R2 value is also inagreement with the adjusted R2 value. In addition,the AP value for the response is greater than 4, whichis desirable. It implies that all of the predicted modelscould be used to navigate the design space defined bythe FFD12–14. Furthermore, the result indicated thatthe model is considered reproducible. This is due tothe value of CV, which is the error expressed as apercentage of the mean, being less than 10%.
Process optimization
In order to optimize the extraction condition, a desir-ability function (d) for multiple responses was used15.This function can be described as follows:
d =
(N∏i=1
mrii
)1/∑
ri
,
where N represents the number of responses, ri refersto the importance of a particular response and mi isthe partial desirability function for specific responses.In this study, the ultimate goal was to extract the high-est amount of artemisinin from the sample. Table 5presents the numerical result of optimization usingFFD. Table 5 shows that the optimum condition iswhenever D1 is 1 and D2 is 0, the ratio of sam-ple/solvent is at 0.5, and the extraction time is equalto 2. In other words, the best condition to extractartemisinin from A. annua is by using macerationmethod (D1 = 1, D2 = 0), and to immerse thesample for about 2 min with a ratio of sample/solventof 0.5/3 g/ml. This optimum formulation conditioncarries a desirability value of 0.985.
www.scienceasia.org
224 ScienceAsia 37 (2011)
Validation of experiment
To validate the optimum process condition gener-ated by FFD, a laboratory test was conducted atthe selected optimum condition (see Table 5). Theextraction procedure was conducted with macerationtechnique, 2 min of extraction time, and with theratio of sample/solvent of 0.5/3 g/ml. An accu-racy value between predicted and experimental val-ues was calculated to validate the optimization pro-cess. Based on the result, the experimental yieldof artemisinin, 49.1× 10⁻³% w/w, was found to bein good agreement with the predicted value usingthe model, 47.9± 0.6× 10⁻³% w/w. The calculatedaccuracy for predicted and experimental values was97.4%, indicating that the process optimization inFFD is reliable to predict the rheological propertiesof the fluid.
REFERENCES1. Paniego NB, Giulietti AM (1996) Artemisinin produc-
tion by Artemisia annua transformed organ cultures.Enzym Microb Tech 18, 526–30.
2. Liersch R, Soicke H, Stehr C, Tullner HV (1986)Formation of artemisinin in Artemisia annua duringone vegetation period. Planta Med 52, 387–90.
3. Singh A, Vishwakarma RA, Husain A (1988) Evalu-ation of Artemisia annua strain for higher artemisininproduction. Planta Med 54, 275–7.
4. Kohler M, Haerdi W, Christen P, Vauthey JL (1997)Extraction of artemisinin and artemisinic acid fromArtemisia annua L. using super critical carbon dioxide.J Chrom A 785, 353–60.
5. Hao J, Han W, Huang S, Xue B, Deng X (2002)Microwave-assisted extraction of artemisinin fromArtemisia annua L. Separ Purif Tech 28, 191–6.
6. Zhao SS, Zeng MY (1986) Application of precolumnreaction to high-performance liquid chromatography ofqinghaosu in animal plasma. Anal Chem 58, 289–92.
7. Qian GP, Yang YW, Ren QL (2005) Determination ofartemisinin in Artemisia annua L. by reversed phaseHPLC. J Liq Chrom Relat Tech 28, 705–12.
8. Xiong R, Meullenet J-F (2006) A PLS dummy variableapproach to assess the impact of jar attributes on liking.Food Qual Prefer 17, 188–98.
9. Cristen P, Veutley J-L (2001) New trends in extraction,identification and quantification of artemisinin and itsderivatives. Curr Med Chem 8, 1827–39.
10. Van-Nieuwerburgh FCW, Castelle SRFV, Maes L,Goossens A, Inze D, Bocxlaer JV, Deforce DLD (2006)Quantification of artemisinin and its biosynthetic pre-cursors in Artemisia annua L. by high performanceliquid chromatography−electrospray quadrupole time-of-flight tandem mass spectrometry. J Chrom A 118,180–7.
11. Duke MV, Paul RN, Elsohly HN, Sturtz G, Duke SO
(1994) Localization of artemisinin and artemisitenein foliar tissues of glanded and glandless biotypes ofArtemisia annua L. Int J Plant Sci 155, 365–72.
12. Ghafari S, Aziz HA, Isa MH, Zinatizadeh AA (2009)Application of response surface methodology (RSM) tooptimize coagulation-flocculation treatment of leachateusing poly-aluminum chloride (PAC) and alum. J Haz-ard Mater 163, 650–6.
13. Noordin MY, Venkatesh VC, Sharif S, Elting S, Abdul-lah A (2004) Application of response surface method-ology in describing the performance of coated carbidetools ewhen turning AISI 1045 steel. J Mater ProcessTech 145, 46–58.
14. Dean A, Voss D (1999) Design and Analysis of Exper-iments. Springer-Verlag New York, Inc., New York.
15. Montgomery DC (2001) Design and Analysis of Exper-iments, 5th edn, John Wiley & Sons, Inc., New York.
www.scienceasia.org