application of infrared scanners to forest fire detection · application of infrared scanners to...
TRANSCRIPT
152
APPLICATION OF INFRARED SCANNERS TO
FOREST FIRE DETECTION
Stanley N. Hirsch, Project Leader
U.S. Department of Agriculture, Forest ServiceIntermountain Forest and Range Experiment Station
Northern Forest Fire LaboratoryMissoula, Montana
Stanley N. Hirsch received his B.S. degree In electronic engineer-ing at the University of New Mexico and has done graduate work at theUniversity of Idaho. Prior to joining the Forest Service in 1961,Mr. Hirsch served as Senior Instrumentation Engineer for Sandia Corpora-tion and General Electric Company.
As Project Leader for Project Fire Scan, Mr. Hirsch has receivedinternational recognition for his work in remote detection of heatsources obscured by smoke and timber cover. His involvement in thedevelopment of airborne electronic fire surveillance systems led to afire mapping system which became operational in the USDA Forest Ser-vice's Division of Fire Control in 1966. The unique bispectral IRfire detection system, developed under his leadership, was success-fully tested in 1970 and will become operational within the ForestService in 1971. Mr. Hirsch has served as a member of the forestrycommittee of NASA's remote sensing group and also in an advisorycapacity to the remote sensing project at Pacific Southwest Forestand Range Experiment Station, Berkeley, California.
https://ntrs.nasa.gov/search.jsp?R=19730007663 2018-08-22T03:23:10+00:00Z

153
APPLICATION OF INFRARED SCANNERS TOFOREST FIRE DETECTION
Stanley N. HirschI/
Forest fires frequently spread slowly immediately after ig-nition. During this period they are easily suppressed. Thefunction of a detection system is to find fires before they growlarge enough to cause serious suppression difficulty. Outputs ofsmoke and radiant energy, which are the key characteristics inforest fire detection, are extremely variable. During the timefrom ignition until a fire has grown to a size where it is diffi-cult to control, the radiant energy and the smoke outputs mayincrease, continuously with time. More commonly, however, thereis a high initial output of either smoke or flame or both smokeand flame, followed by long dormant periods interrupted occasion-ally by bursts of flame and/or puffs of smoke. Outputs of bothsmoke and heat usually decrease significantly at night. We havenot been able to find any direct correlation between outputs ofsmoke and radiant energy (Fig. 1).
All forest fire detection systems now being used rely uponvisual observation of smoke from lookout towers or aircraft. Suchsystems are only efficient during daylight hours when a column ofsmoke is well developed and rises above the trees and when theatmosphere is clear, not contaminated.
Because of these limitations, our project began to investi-gate the potential of infrared (IR) detection systems. We recog-nized that an IR device could not be operated from lookout towersbecause rough topography and heavy timber severely limit theprobability of obtaining an unobscured line of sight to groundfires burning under a timber canopy. A direct "look" is neededbecause reliable detection cannot be achieved from the smallamount of radiant energy produced by smoke columns rising above afire. Therefore, we proceeded with a study of the IR detectionprobability from aircraft.
At the outset of our studies, we did not know the probabilityof having an unobscured line of sight between an aircraft and afire burning under a timber canopy (Fig. 2). We suspected it wasstrongly dependent on timber characteristics (stand height, bolediameter, number of stems per acre, live crown ratio, and crowncharacteristics) as well as angle of view and fire size. There-fore, we conducted rather extensive tests in 1963-65 in timber
—' Author is Project Leader for Project Fire Scan, USDAForest Service, Intermountain Forest and Range Experiment Station,Ogden, Utah; stationed at the Northern Forest Fire Laboratory,Missoula, Montana.

15'*
types representative of stands found on the North American Conti-nent [1],[2],[31,[41• Initially, we conducted flight tests; laterwe added a mountaintop test because the cost of obtaining suf-ficient data using aircraft would have been prohibitive. We foundthat reliable detection for simulated fires of 5 square feet.?/could be achieved at angles up to 60° from the nadir (as shown inFig. 3).
An IR system scanning 120° at 15,000 feet at ground speeds inexcess of 200 knots could economically compete with an airbornevisual detection system which costs approximately 6$ per squaremile. From 15,000 feet, a 2-milliradian (mrd) resolution systemhas a ground resolution of 30X30 feet directly under the air-craft and 60X120 feet at 60C from the nadir. This providesenough terrain detail to determine target location. Fire targetsof the size we must detect (1 to 10 square feet) will occupy be-tween l.iJXlO-1* to 1.1X10~2 of the instantaneous field of view,depending on the angle of observation and size of the fire. Theeffective target size may be further reduced because of obscurationby timber. Many of the targets detected in the mountaintop testswere up to 95 percent obscured.
The radiant energy from a forest fire (600°C) peaks in the3- to 6-y (micron) region. ' We obtained a 2-mrd IR line scannerwith about 1/2° temperature sensitivity (InSb) and began to eval-uate its performance. After 2 years of flight testing we foundthat many of the fires we detected produced very marginal targets.If an interpreter knew the target locations he was usually able todetect them, but the signatures produced on the imagery were somarginal that randomly located targets in a large search area werenot detectable.
If a 600°C target fills less than 2X10~2 field of view of thescanner, the target's signal-to-background ratio in the 3- to 6-yregion is insufficient to distinguish fire targets from background
£/ The probability of detecting a fire of any size may beinferred by assuming that the probability of detecting a fire with5-ft.2 of burning material is equal to the probability of seeingat least one of five 1-ft.2 fires. To extrapolate the data infigure 3 to fires of smaller or larger areas, the following may beused:
Pn - 1 - (1 - P5)n/5
where;n = area of fire in ft.2.
y = 1X10"6 meters.

155
thermal anomalies. In the 8- to 1^-y region, the target's signal-to-background ratio is less than it is in the 3- to 6-y region.We began to wonder if we could use the 3- to 6-u and 8- to 14-pregions in combination to enhance the target.
Figure 4 shows the 3- to 4-y (A) and 8.5- to 11-y (B)signals from both terrain background and fire targets as seen bya 2-mrd system from 15,000 feet plotted in two-dimensional vectorspace [51. The lower curve contains all background temperaturesfrom 0° to 60°C.— ' The set of points above (shaded area) con-tains target signatures from fires ranging in temperatures from600° to 800°C, areas ranging from 1 to 10 square feet, angles ofview from 0° to 60°, and obscuration ranging from 0 to 95 percent,Amplitude discrimination in the A channel (horizontal line) wouldnot provide effective separation of targets from background, norwould amplitude discrimination in the B channel (vertical line).
A sloping, straight line drawn between the lower curve andthe target points does provide discrimination for most targets.The equation of that line is:
A » KB + C
where :
11B - J WxTATpBRDBdx
K = slope of discrimination line
C = displacement from origin
W = Planck functionA
TA = transmission of atmosphere
Tp • transmission of A channel filter
Tp = transmission of B channel filter
RD = responsivity of A channel detector
RDB » responsivity of B channel detector
* Variations in spectral emlssivity will spread the back-ground points forming a band rather than the discrete curve shownin figure *».

156
or, rewriting and redefining K:
K'A - B - C = 0
If the background temperature range can be predicted for a givenflight, an optimum K can be selected. An effective decision ruleand one that is easy to implement in an analog system is: Atarget exists if the signal is greater than KA - B. A nonlinearfunction that more closely matched the lower curve would be aneven more efficient rule, but it would be more difficult to imple-ment. We employed the KA - B function and found it quite effec-tive.
To minimize the effects of changes in atmospheric moisture,we selected the 3- to 4-y and 8.5- to 11-y bands rather than thetotal 3- to 6-p and 8- to 14-u windows. We empirically selectedspectral regions centered around 3y and 8y, where the ratio ofthe power is relatively insensitive to changes in atmosphericmoisture.
The way we implemented the bispectral system is shown infigure 5. The 8.5- to 11-y channel produces high quality infra-red imagery from which the position of targets can be accuratelydetermined with respect to terrain features.
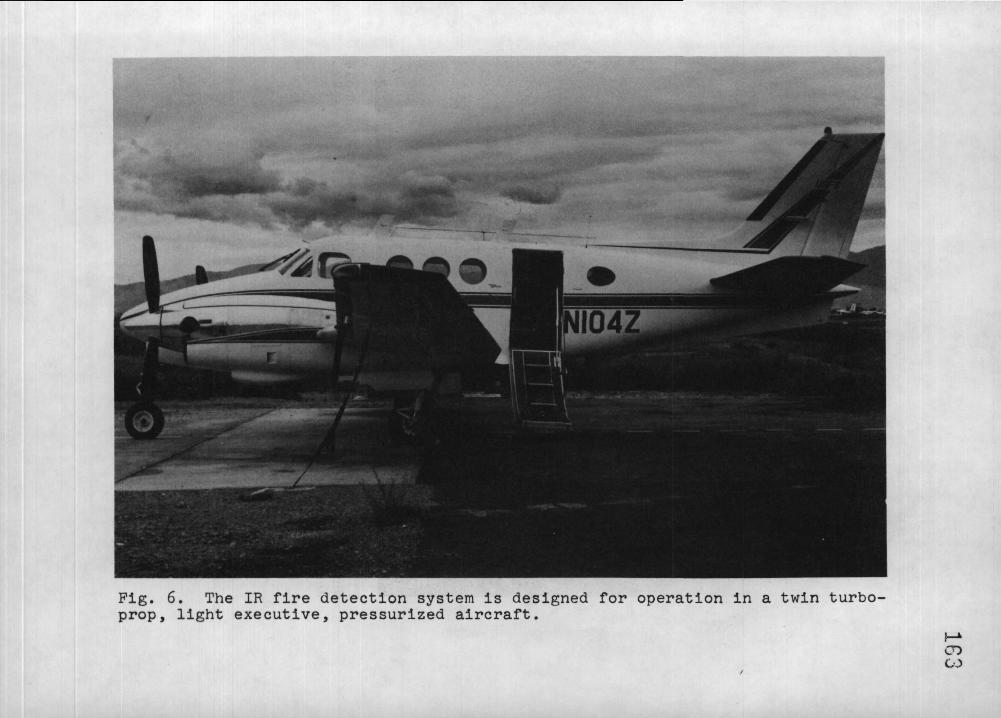
The KA - B signal is pulse-height/pulse-width discriminated.A pulse above a preset threshold and within the pulse-wldthS/limits produces a logic pulse that is stored in a digital memoryfor one scan line. If a logic pulse is produced at the samepoint in two successive scan lines, an output pulse is generated.To eliminate false alarms caused by electrical noise, sufficientoverscan is available to permit scan-to-scan comparison. Theoutput pulse produces a mark on the edge of the film and rein-serts a pulse in the video, which cues the operator (Figs. 6 and 7),
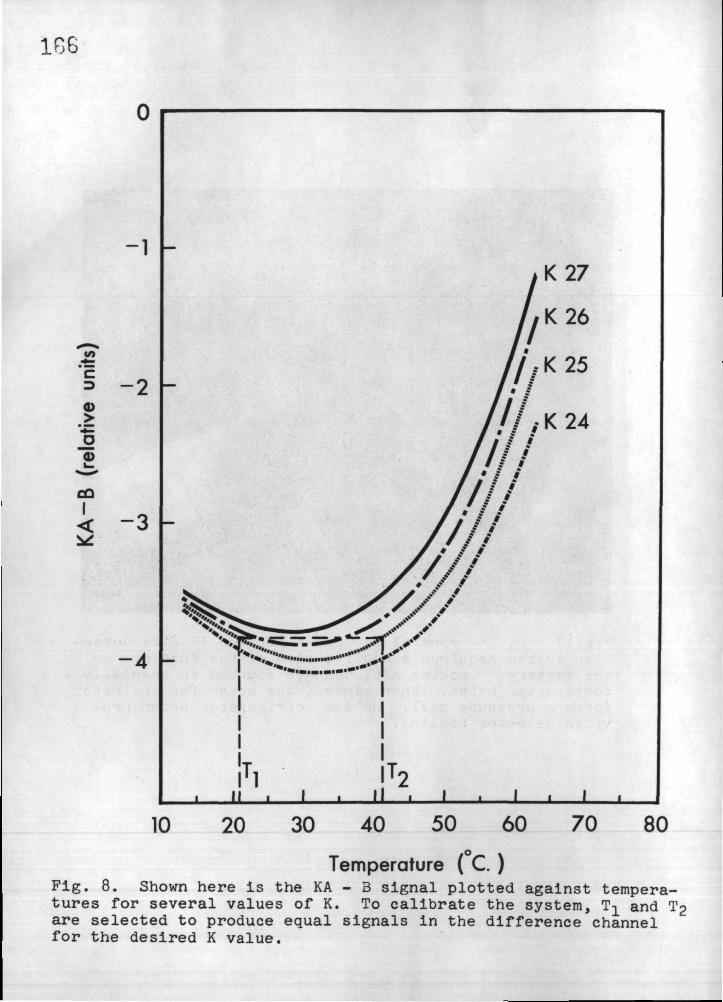
The curvature of the function shown in figure 8 permits se-lection of two temperatures where the signal amplitude is equal.To calibrate the system we select a pair of temperatures thatwill produce equal signals in the difference channel for thedesired K value. We set the internal calibration sources atthese temperatures,2/ and then adjust the gain of the 8.5- to 11-v
Pulse-width limit is set to equal the dwell time for oneresolution element.
2/ Atmospheric transmission is not included in the integra-tion for A and B in figure 8 since the path between the detectorand calibration sources is short.

157
channel until the signal from the two sources is equal. Thissimple procedure assures that the ratio of total gain (amplifier,detector, and optics) in both channels is optimum for differen-tiating between targets and any preselected background range.
We calculated the performance of both the single and bi-spectral systems and predicted that the bispectral system couldproduce a 12:1 improvement in detecting 1-ft.2, 600°C targetsagainst backgrounds ranging from O8 to 50°C. To check our cal-culations we performed flight tests using thermal anomalies inYellowstone National Park to provide a high contrast background.The results of these tests showed a 10:1 Improvement.
The test was performed in April 1970 when nighttime surfacetemperatures were -10°C in areas unaffected by geothermal activity.As shown in figure 9, the temperature at Fire Hole River was 10°C,and that for Hot Lake, which is located adjacent to a geyser, was50°C. Buckets of glowing charcoal were used as targets withsurface areas of 1/2, 1, and 2 ft.2.
We overflew the area at 15,000 feet above terrain. In ad-dition to the normal film recording and TDM marks, we recordedthe 3- to k-vt 8.5- to 11-y, and KA - B signals on magnetic tape.After the flight we photographed the video signals from the taperecordings.
The signals from the 1/2- and 1-ft.2 targets were easilydifferentiated from signals for Hot Lake in the KA - B channel.The signal from the 1-ft.2 target was slightly larger than thesignal from Hot Lake in the 3- to 4-p channel. None of the tar-gets produced measurable signals in the 8.5- to 11-y channel.
During July and August of 1970, the equipment was opera-tionally tested in an 8,000-square-mile area adjacent to Missoula,Montana. On '12 patrol flights, of 5-1/2 hours' duration each,over 800 hot targets were detected and plotted. More than 200of the targets were wildfires. Forty-five of these were detectedby the IR system before they were detected by the presently usedvisual system of 59 lookout towers and seven patrol aircraft(Fig. 10).
Many fires were detected visually but missed by the IR sys-tem, and many fires were detected by the IR system but missedvisually. Until we learn more about the relationship betweenheat output and smoke output from latent fires we cannot determinethe relative effectiveness of visual and IR systems. The resultsof the 1970 tests convinced us that IR used in combination with

158
visual detection will result in a more efficient system than visualalone. Even with our limited knowledge of the relative effective-ness of the two systems we can begin operational use of a combinedsystem and substantially reduce total firefighting costs (detectionplus suppression) [6]. The ultimate potential will not be realizeduntil we are able to arrive at optimal combinations.
REFERENCES
[1] S. N. Hirsch, "Applications of remote sensing to forest firedetection and suppression," 1962 Proc. Second Symp. RemoteSensing Environ., pp. 295-308, illus., 1963.
[2] , "Preliminary experimental results with infrared linescanners for forest fire surveillance," 1964 Proc. Third Symp.Remote Sensing Environ., pp. 623-6*48, illus., 1965.
[3] , "Project Fire Scan—summary of 5 years' progress inairborne infrared fire detection," 1968 Proc. Fifth Symp.Remote Sensing Environ., pp. 447-457, illus., 1968.
[4] R. A. Wilson, "Fire detection feasibility tests and systemdevelopment," 1968 Proc. Fifth Symp. Remote Sensing Environ.,pp. 465-477, illus., 1968.
[5] Committee on Remote Sensing for Agricultural Purposes, "Remotesensing (with special reference to agriculture and forestry),"Wash., D.C.: Nat. Acad. Sci., pp. 360-410, 1970.
[6] P. H. Kourtz, "A cost-effectiveness analysis of a simulatedairborne infrared forest fire detection system," Ph.D. dis-sertation, Univ. of California, Berkeley, 1970.

159
cd
<l
M.PO
MX
; 0^
-p0)
Cd
0)
c -o
0) 0)
6o -a^ o
•in
CXO
-PCO
J iH
O -H
-H nT>
C
d
cd -H ^
CO 0
13 0 X
!C
E
cd cd *c3
be a)fc >0)
0
C -d
-P iH
C
<U
CO ?
•H•a <u
0oEco
3ool0)
cd w '
x; E-P
0 C
O-P
-H0
C
O X
I
ofn
x>3
•> •
a E
E•P
0 0
ZJ
J
4^
O
CO
CO
0
CO
C
O
C-i
CC
rHH
Cd
1C
racd «H
COCO0
0
O O
XI -H
-P 4JO
aCO
-P
C
.pCJQ
0 aCO
CO C
x: -P H
P. cocd
0
bO O
>s
O
<i-t bO
j_5 ^
O <i-i
0X
! O
Ca
0O
C
-PS
0
C
•p E cd0,-H
0
O 1
3CO
rH
Cd
0
0 (H
x; >E
-i 0
^T
J O
• 4-> abO
-P
TH C
3
fe
«H
O
CO O
X
l
CO -P
T3
O
0rH
0
4->
Cd -P
O
30
0co id
-p•H
0
>
0 T
3rH
cd xi ?>>Cd
rH
Xt"
0 *Ocd
4-> O
0
O
4-5 ?HC
rH
04J rH
X
I3 C
dX
i E
t3CO
rH
S
O O
(1) O
5
-P 4J
CO C
>> co ECO
iH
3rHK
0 O
M
ti CJ
C <
M 0
cd x
0 O
>>x: EX
I -P
CO

160
Fig. 2. This photograph of the westernwhite pine stand used in the testsshows the "obscuring" effect of atypical forested area.
IOO --PONDEROSA PINE
LODGEPOLE PINE
ALASKAN WHITE SPRUCE
-DOUGLAS-FIR
OAK- HICKORY
PIN OAK•NGELMANN SPRUCE-
SUBALPIME FIR
10 20 X 40' SO
ANGLE FROM NADIR
60
Fig. 3. Shown here are detection probability curves for the 13timber types tested. Target arrays were five 1-ft.2 buckets ofglowing charcoal placed on the circumference of a 9-ft. circle.Flight passes were flown at 10° angular increments from 0° to60° from the nadir.

161
40
30
•o
O
20
TARGETS-
£50 C.
BACKGROUND
8 10
BxlOFig. 4. The signals for both targets and background, as seen bythe 2-mrd IR detection system from 15,000 feet, are plotted intwo-dimensional vector space, where A is the 3- to 4-y and B isthe 8.5- to 11-u vector. Annotation of the target and backgroundtemperatures, areas, and angles of view for detected targets is asfollows: Ti=l ft2, 600°C, 20° background. 0° angle; T2»l ft
2,600°C, 10° background, 30° angle; T3=l ft
2, 800°C, 30° background,60° angle; and TH=! ft2, 600°C, 20° background, 60° angle.

162
QC
Ozuto
\fii©
kfi>aL3uJ
3
, tQ£
Oae0.
Ou£>Ej:H
E
t
=Vj
-O!
Z 0
1-
3"-
Ooc
«o
O
>•
u
-• OT
,
_ -""
«/> K
G
yE0
Oo
0)4-5(0>
>toCO•H-PO<D
T)(Ucdo(Ua0}
•H.00)
cdfn60cdOOcdwCO
IG;
oX)c•H-PCti
CO•H4J05fcVo,ocbO•HCO
•Q
J .p
•a ^naJCO
ti•H
o^
B-H
<D a)
^CO T3
>> <l)CO
N-r(
C ^
o d
^H
W-P
coO
Q
)0)
fn-P
D
,I)^J
«0)0)
>P
, -H•H
-P<M
3O
K 0)
H K0)
0).C
-PH
x:to
to o•H
fn
fe
O.

164
Fig. 7. A, Looking forward, the scanner control console,which uses 5-inch film (left foreground) that is proces-sed in near real time.

165
Fig. 7. B, The special equipment for the IR fire detec-tion system required a modification of the fuselage bythe factory. Looking aft, scanner mounted in speciallyconstructed hatch. When closed, the cover for the hatchforms a pressure seal. Helium refrigerator shown pro-vides detector cooling.
1G6
-1
I-2
-3
-4
K27
K26
,K25
24
10 20 30 40 50 60
Temperature ( C. )
70 80
Fig. 8. Shown here is the KA - B signal plotted against tempera-tures for several values of K. To calibrate the system, T]_ and T2are selected to produce equal signals in the difference channelfor the desired K value.

1C" 7J i

168

1G9