application of physicochemical data for water … monit assess (2012) 184:2017–2029 doi...
TRANSCRIPT

Environ Monit Assess (2012) 184:2017–2029DOI 10.1007/s10661-011-2096-5
Application of physicochemical data for water-qualityassessment of watercourses in the Gdansk Municipality(South Baltic coast)
Monika Cieszynska · Marek Wesolowski ·Maria Bartoszewicz · Malgorzata Michalska ·Jacek Nowacki
Received: 7 April 2010 / Accepted: 25 April 2011 / Published online: 8 June 2011© The Author(s) 2011. This article is published with open access at Springerlink.com
Abstract The paper presents water-quality evalu-ation based on an 8-year monitoring programmein the Gdansk Municipality region, on the South-ern coast of the Baltic Sea. The studies werecarried out from 2000 to 2007 by surface wateranalysis at 15 various sites within eight water-courses. Sampling sites included rather urbanizedor developed lands, farming fields and non-polluted city recreational areas such as parks andforests. Most of the watercourses were sampledmonthly at two locations, one within the uppercourse of the watercourse and the other near itsmouth. In all samples, eight parameters of waterquality were determined: total suspended solids,dissolved oxygen, water temperature, oxygen sat-uration, 5-day biochemical oxygen demand, chem-ical oxygen demand, total phosphorus and totalnitrogen concentration. Interpretation of the ob-tained results revealed that examination of those
M. Cieszynska (B) · M. Bartoszewicz ·M. Michalska · J. NowackiDepartment of Environmental Protectionand Hygiene of Transport,Medical University of Gdansk, PowstaniaStyczniowego 9B str., 81-519 Gdynia, Polande-mail: [email protected]
M. WesolowskiDepartment of Analytical Chemistry,Medical University of Gdansk,Al. Gen. J. Hallera 107, 80-416 Gdansk, Poland
basic physicochemical parameters permits to dis-criminate initially watercourses with respect tolevel of water contamination. During the research,a large dataset was obtained and it was describedby both basic statistical parameters and chemo-metric method of cluster analysis. The paperpresents relations between analysed parametersand influence of land exploitation mode on waterquality and describes variation of the results bothin space and time.
Keywords Cluster analysis ·Gdansk Municipality · Monitoring ·Physicochemical parameters ·River water quality
Introduction
Water is the most common and widespread chem-ical compound in nature which is a major con-stituent of all living creatures. It is essential formetabolism and many accompanying processes incells, and what is more, for many organisms, itconstitutes the only habitat for life. Natural sur-face waters are a solution of many non-organicand organic compounds, colloids, suspensions ofnatural or anthropogenic origin (Dojlido 1987).
The quality of water is of great importance alsofor human lives as it is commonly consumed andused by households. In industry, it serves as a
2018 Environ Monit Assess (2012) 184:2017–2029
solvent, substrate or catalyst of chemical reactions(Goncharuk 2008; Holt 2000; Van Leeuwen 2000;Petraccia et al. 2006). To minimise health hazards,an extensive monitoring programme of surfacewater quality within limits of Gdansk Municipal-ity, located on the southern shore of the BalticSea, was introduced. The examined watercoursesflow through areas that significantly differ, notonly with regard to natural landscape but also tothe type of the surrounding land development.The watercourses have also different hydrologicalcharacteristics. The performed monitoring pro-gramme generated a large database of resultswhich was assessed by basic statistical parametersin order to describe variation of analysed para-meters in particular years and determine pollutionlevels of water from respective watercourses, tak-ing into consideration land exploitation mode.
Agglomerative hierarchical cluster analysis(CA) was applied for a detailed interpretationof the results. CA is an extremely useful toolwhich supports interpretation of large and mul-tidimensional sets of environmental data. In thispaper CA for the results explanation was selectedbecause contrary to other pattern recognitiontechniques (e.g. principal components analysis) itaccounts for the whole variation in the data and nosimplification of the information is necessary (Hilland Lewicki 2006; Otto 1999; Vega et al. 1998).
The utility of CA is confirmed in many papersregarding quality of surface waters (Zhang et al.2009). CA can assist in classification of sam-pling stations in accordance with similarity ofchemical composition of water (Giridharan et al.2009). When applied for different watercourses,it supports recognition of regions with similarphysicochemical properties of water and enablesdetection of factors controlling water quality. Ex-amples of CA application are included in papersconcerning rivers in Northern Italy (Reisenhoferet al. 1998) and Northern Greece (Simeonov et al.2003). In both cases, analysed samples of waterwere grouped into four distinct clusters collectedfrom various watercourses and with differentwater quality.
In this paper, CA was applied to describe vari-ation among samples collected from each water-course in the whole study period. In such case, CApermits to determine whether water quality can
be modified with the watercourse flow and allowsidentification of areas with specific properties ofwater. Samples collected from one watercoursecan be grouped into two—clean and polluted, orthree—clean, highly and medium polluted clustersrepresenting similar water properties (Brogueiraand Cabeçadas 2006; Chang 2005; Kannel et al.2007; Reghunath et al. 2002). Marengo et al.(1995) mentions application of CA for samplesfrom Lagoon of Venice collected from varioussites and at different seasons of the year. In this in-stance, it was concluded that location of samplingpoint rather than a season of sample collectiondetermines clustering of the results.
Experimental
The Gdansk Municipality lies on the southerncoast of the Baltic Sea, in Northern Poland. It ischaracterized by a temperate climate with fourclearly differentiated seasons. Winters are mod-erately severe with mean daily temperatures of−3.4◦C in January; summers are mild with meantemperature of 21.3◦C in August and frequent
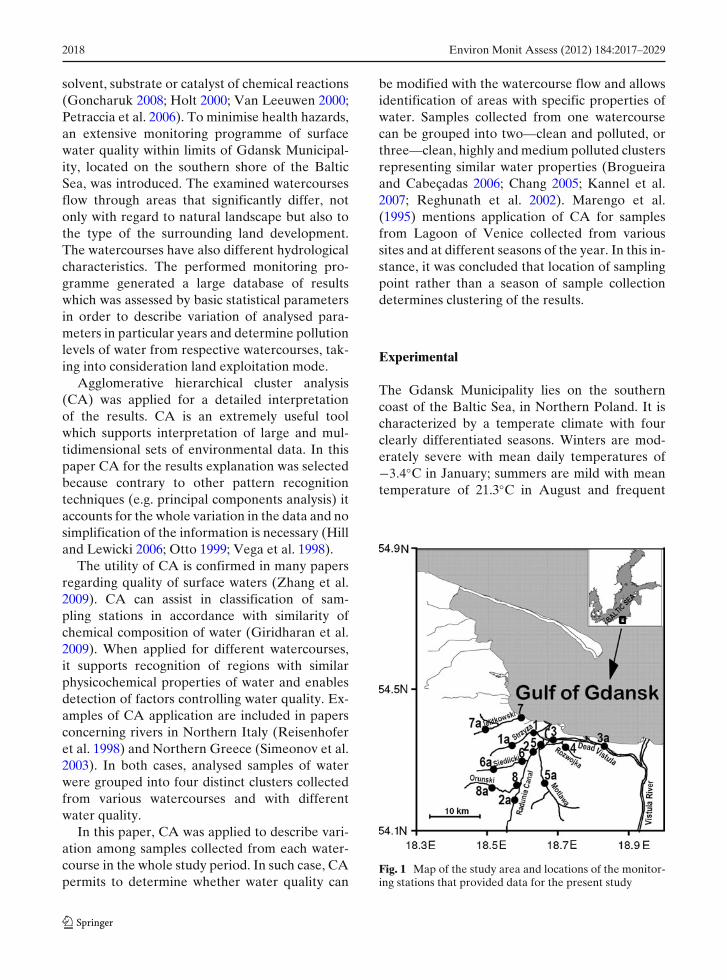
Fig. 1 Map of the study area and locations of the monitor-ing stations that provided data for the present study

Environ Monit Assess (2012) 184:2017–2029 2019
rain or thunderstorms. Monthly rainfall variesfrom 17.9 to 66.7 mm.
Figure 1 shows map of the study area with mon-itoring stations used to provide the study data. Allwatercourses in the study area enter the Gulf ofGdansk via Dead Vistula River, only JelitkowskiStream flows directly into the Gulf of Gdanskin the Jelitkowski Park. Table 1 presents namesof eight watercourses covered by this study, theirgeneral characteristics as well as geographical co-ordinates of the sampling stations.
The sampling points were selected in such away that one of them was situated farthest up-stream (labelled by adding letter “a”), the other
point was near the mouth. The exception wasRozwojka Canal sampled only at one point.The water samples were collected from 2000 to2007. From each watercourse, with the excep-tion of Rozwojka Canal, two samples were takenmonthly from the mainstream, at the depth about20 cm using plastic scoop. On rare occasions,when it was not possible to collect samples fromthe mainstream of the watercourse (Dead VistulaRiver and Motlawa River), the samples weretaken at the distance equal to maximum length ofthe scoop arm, (about 3 m) from the river bank.
In all samples, eight parameters characteris-ing the quality of water were analysed: total
Table 1 General characteristics of the watercourses studied in the Gdansk Municipality area, details of the area surroundingthe sampling stations and their locations
Watercourse Notation Geographical coordinates Average Length Average Site description
of sampling Longitude Latitude depth [km] flowsite (E) (N) [m] [m3.s−1]
Strzyza 1 18.6◦ 54.4◦ 0.4 13.3 0.23 Shipyard, power stationStream (industrial and urban area)
1a 18.6◦ 54.4◦ ForestRadunia 2 18.6◦ 54.3◦ 0.4 13.5 1.50 City centre (urban area)
Canal 2a 18.6◦ 54.2◦ Area with heavy vehicletraffic nearby (urban area)
Dead Vistula 3 18.7◦ 54.4◦ 5.0–8.0 27.0 600.00 City centre (urban area)River to 1200.00
3a 18.8◦ 54.3◦ Mounds of phosphogypsumwastes and ashes froma power station (industrialarea)
Rozwojka 4 18.7◦ 54.3◦ 1.0 4.6 controlled Oil refinery, heavy vehicleCanal by inflow traffic nearby (industrial
of wastewater area)Motlawa 5 18.7◦ 54.4◦ 2.0 65.0 6.80 City centre (urban area)
River 5a 18.7◦ 54.3◦ Fields (rural area)Siedlicki 6 18.6◦ 54.3◦ 0.2 6.9 0.06 Park in a city centre
Stream (recreational area)6a 18.5◦ 54.3◦ Privately owned rural,
suburban lands, wastelands(rural area)
Jelitkowski 7 18.6◦ 54.4◦ 0.3 9.7 0.25 Park, beach—mouthStream to the Gulf of Gdansk
(recreational area)7a 18.5◦ 54.4◦ Forest, park
Orunski 8 18.6◦ 54.3◦ 0.2 7.5 0.03 Park in a city centreStream (recreational area)
8a 18.5◦ 54.3◦ Fields, privately owned rural,suburban landsand wastelands (rural area)

2020 Environ Monit Assess (2012) 184:2017–2029
suspended solids (TSS), dissolved oxygen (DO),water temperature (T), oxygen saturation (OS),5-day biochemical oxygen demand (BOD), chemi-cal oxygen demand (COD), total phosphorus (TP)and total nitrogen (TN). Determinations wereperformed using the procedures recommendedin APHA (2005). List of examined parameterswith their units, used abbreviations and appliedanalytical methods is shown in Table 2. All theanalytical reagents were supplied by the POCHJoint-Stock Company, Poland, and by MerckPoland. Thermometer (model HI 145-20) was pro-vided by HANNA instruments Inc., Woonsocket,RI, USA. ‘Spectronic Genesys 5’ spectropho-tometer used for colorimetric determinations ofTN and TP was produced by Milton Roy Com-pany, Rochester, NY, USA. For TSS deter-mination, Millipore filtration system was used(Millipore Sp. z o. o., Warsaw, Poland).
All physicochemical parameters of water weredetermined immediately upon arrival of the sam-ples at the laboratory. Sample storage was avoidedbecause it might have changed the chemical com-position of water.
All dendrograms in cluster analysis were plot-ted using Ward’s method (Hill and Lewicki 2006;Otto 1999). Euclidean distance was applied forclustering of water samples (Fig. 5); for clustering
of variables (Fig. 4), 1-r Pearson distance wasused. All data were initially standardized throughz-score transformation (Marengo et al. 1995),and then statistical and mathematical calculationswere performed using version 8.0 of the Statisticasoftware (StatSoft Inc., Cracow, Poland) and Mi-crosoft Office Excel 2003 spreadsheet (MicrosoftCorporation, Warsaw, Poland). For dendrogramsshown in Fig. 5, the number of significant clus-ters was determined using the more restrictiveSneath’s index criterion, at 1/3 of the maximumdistance Dmax (Astel et al. 2007).
Results and discussion
Physicochemical characteristics of the studiedwatercourses
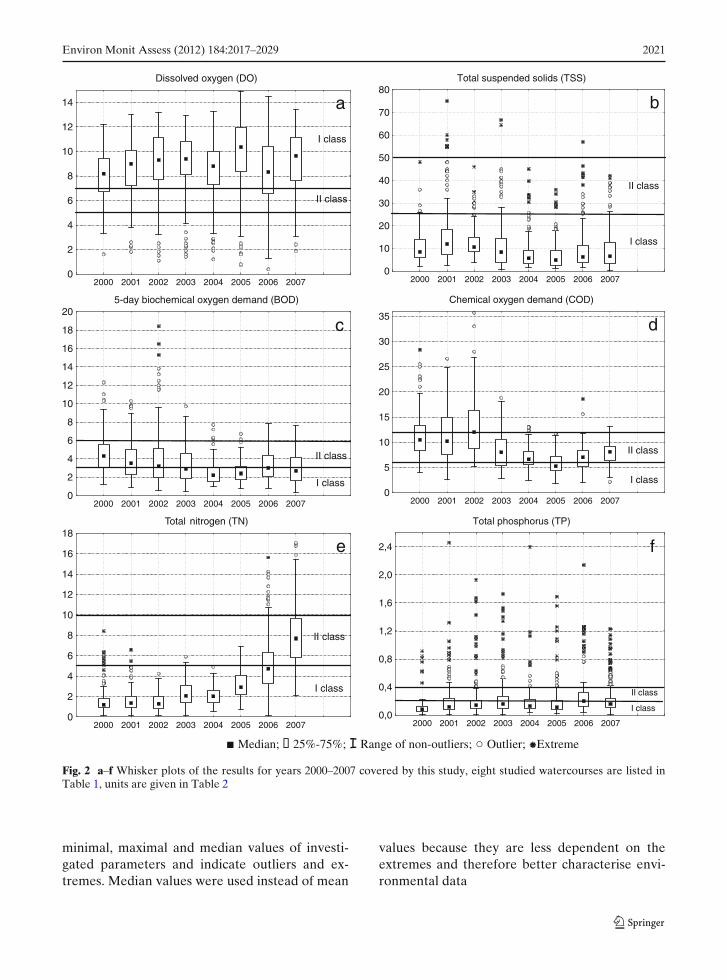
A statistical description of eight physicochemicalparameters determined in Gdansk Municipalityregion for consecutive years of study from 2000to 2007 is presented in Fig. 2a–f, whereas fordifferent watercourses in the whole study periodin Fig. 3a–f. In the study, over 1,300 samples ofwater were collected and analysed, what produceda large database of more than 10,500 results.Figures 2 and 3 are whisker plots which present
Table 2 List ofphysicochemicalparameters measured forthe river water, their unitsand abbreviations used
Parameter Units Abbreviation Applied analytical techniquesused in the text
Water temperature ◦C T Thermometer5-day biochemical mg O2/L BOD Incubation, Winkler titration
oxygen demandChemical oxygen mg O2/L COD Permanganate titration
demandTotal nitrogen mg/L TN Peroxydisulfate oxidation,
concentration cadmium–copper reduction,spectrophotometry
Total phosphorus mg/L TP Peroxydisulfate oxidation,concentration spectrophotometry
Oxygen saturation % OS Calculated based on the DOvalues after accounting for T,atmospheric pressure,and water salinity.
Dissolved oxygen mg O2/L DO Winkler titrationconcentration
Total suspended solids mg/L TSS Filtration and drying
Environ Monit Assess (2012) 184:2017–2029 2021
Dissolved oxygen (DO)
2000 2001 2002 2003 2004 2005 2006 20070
2
4
6
8
10
12
14
I class
II class
a
Total suspended solids (TSS)
2000 2001 2002 2003 2004 2005 2006 20070
10
20
30
40
50
60
70
80
I class
II class
b
5-day biochemical oxygen demand (BOD)
2000 2001 2002 2003 2004 2005 2006 20070
2
4
6
8
10
12
14
16
18
20
I class
II class
c
Chemical oxygen demand (COD)
2000 2001 2002 2003 2004 2005 2006 20070
5
10
15
20
25
30
35
I class
II class
d
Total nitrogen (TN)
2000 2001 2002 2003 2004 2005 2006 20070
2
4
6
8
10
12
14
16
18
I class
II class
e
Total phosphorus (TP)
2000 2001 2002 2003 2004 2005 2006 20070,0
0,4
0,8
1,2
1,6
2,0
2,4
I class
II class
f
Median; 25%-75%; Range of non-outliers; Outlier; Extreme
Fig. 2 a–f Whisker plots of the results for years 2000–2007 covered by this study, eight studied watercourses are listed inTable 1, units are given in Table 2
minimal, maximal and median values of investi-gated parameters and indicate outliers and ex-tremes. Median values were used instead of mean
values because they are less dependent on theextremes and therefore better characterise envi-ronmental data

2022 Environ Monit Assess (2012) 184:2017–2029
Str
zyza
St.
Rad
unia
Can
.
Dea
d V
istu
la
Roz
woj
ka
Mot
law
a
Sie
dlic
ki S
t.
Jelit
kow
ski S
t.
Oru
nski
St.
Dissolved Oxygen (DO)
0
2
4
6
8
10
12
14
16
II class
I class
aTotal suspended solids (TSS)
Str
zyza
St.
Rad
unia
Can
.
Dea
d V
istu
la
Roz
woj
ka
Mot
law
a
Sie
dlic
ki S
t.
Jelit
kow
ski S
t.
Oru
nski
St.0
20
40
60
80
100
I class
II class
b
5-day biochemical oxygen demand (BOD)
Str
zyza
St.
Rad
unia
Can
.
Dea
d V
istu
la
Roz
woj
ka
Mot
law
a
Sie
dlic
ki S
t.
Jelit
kow
ski S
t.
Oru
nski
St.0
5
10
15
20
I class
II class
c
Chemical oxygen demand (COD)
Str
zyza
St.
Rad
unia
Can
.
Dea
d V
istu
la
Roz
woj
ka
Mot
law
a
Sie
dlic
ki S
t.
Jelit
kow
ski S
t.
Oru
nski
St.0
5
10
15
20
25
30
35
40
I class
II class
d
Total nitrogen (TN)
Str
zyza
St.
Rad
unia
Can
.
Dea
d V
istu
la
Roz
woj
ka
Mot
law
a
Sie
dlic
ki S
t.
Jelit
kow
ski S
t.
Oru
nski
St.0
2468
1012141618
I class
II class
e
Str
zyza
St.
Rad
unia
Can
.
Dea
d V
istu
la
Roz
woj
ka
Mot
law
a
Sie
dlic
ki S
t.
Jelit
kow
ski S
t.
Oru
nski
St.
Total phosphorus (TP)
0,0
0,4
0,8
1,2
1,6
2,0
2,4
2,8
I classII class
f
Median; 25%-75%; Range of non-outliers; Outlier; Extreme
Fig. 3 a–f Whisker plots for the studied watercourses (listed in Table 1), results from years 2000–2007; units are given inTable 2
The assessment of water quality is based onstandards established by the Polish Minister ofthe Environment (Dz. U. Nr 162, poz. 1008 2008),
which implement guidelines of the Directive2000/60/EC of the European Parliament knownas Water Framework Directive (WFD 2000)

Environ Monit Assess (2012) 184:2017–2029 2023
into Polish legal system. WFD mainly highlightson biotic components of the European Waters;however, chemical monitoring is also taken intoaccount as an effective source of information(Ocampo-Duque et al. 2006). The values for thefirst and second class of water had been markedin the whisker plots; inferior water quality classeshad not been assigned.
From Figs. 2a–f and 3a–f, it can be concludedthat the quality of examined waters is relativelygood. They are well-oxygenated, with median DOvalues in the first class of water quality; medianTSS content is also within the first class accord-ing to Polish standards, below 10 mg/L for mostyears and majority of watercourses. The nutrient(TN, TP) concentrations are within the limits forthe first class of water quality; however, since2006, a significant increase in the TN contentshould alarm the local authorities. In Fig. 3e,elevated concentrations of TN rather do not referto Strzyza Stream and Jelitkowski Stream. Theresults for TP concentration in consecutive yearsare quite variable, with many extreme and out-lying values (Fig. 2f). This is for the most partcaused by elevated TP concentrations detectedfor the two watercourses: Dead Vistula (site 3a)and Rozwojka (site 4). In case of Rozwojka, highTP values might be attributed to low flow condi-tions and urban run-off. For site 3a on the DeadVistula River, high TP concentrations are causedby a release of phosphorus to the water from thephosphogypsum waste dump in Wislinka district,situated near station 3a. Considering the rapidwater flow in Dead Vistula River (from 600 to1,200 m3 s−1) and its depth of more than 5 m,it can be concluded that the amount of phos-phates delivered to water from the waste dump inWislinka cannot be neglected.
The analysed waters are characterised by ratherhigh organic matter content. It refers to bothorganic matter biodegraded by organisms in bio-chemical processes (BOD) or oxidised by a strongchemical oxidant such as permanganate (COD)(Xia et al. 2005). BOD and COD values for theexamined waters were in the second or close to thesecond class of water quality; some improvementcan be observed from year 2004. Elevated organicmatter content was observed in the warm season;therefore it may be concluded that intensive or-
ganic matter production and a high rate of pho-tosynthesis are the main causes of elevated BODand COD values.
Figure 3a–f shows that physicochemical prop-erties of water from the two watercourses—Jelitkowski Stream and Rozwojka Canal, notice-ably differ from the others in the area of GdanskMunicipality. The Jelitkowski Stream (sites 7, 7a)can be distinguished from all watercourses bythe lowest load of pollution. In the whole studyperiod, this watercourse had the lowest levels oforganic pollution (BOD and COD). Moreover, inJelitkowski Stream, the lowest concentrations ofTN and TP were determined. Jelitkowski Streamcontained the least TSS content; water from thiswatercourse was also well saturated with oxy-gen (high DO). Good quality of water in caseof Jelitkowski Stream can be attributed to thefact that it flows through protected area of aTricity Landscape Park and a few recreationalparks. The second watercourse with an outstand-ing water quality is Rozwojka Canal. In the wholestudy period, most physicochemical parametersof its waters had median values in the secondclass of water quality or below, the only excep-tion was noticed for TSS and TN values. Thisrefers especially to DO concentration and organicmatter content (BOD, COD) and may indicateconsiderable contamination of water (Olajire andImeokparia 2001). Pollution of water in RozwojkaCanal (site 4) and the highest median value of wa-ter temperature (T) might be caused by an inflowof drainage waters or treated wastewater from thenearby oil refinery or the refinery’s wastewatertreatment plant. Effluents from the oil refinerycannot be easily flushed away because of a rela-tively low or at times even no flow of water.
Radunia Canal, Motlawa River and StrzyzaStream belong to rather clean watercourses, withsimilar physicochemical properties. Examinationof water quality in those watercourses allows con-cluding that in the investigated area fields andfarming areas (Radunia Canal, Motlawa River) donot contribute to increase in water pollution orhigher concentrations of biogenic substances. Incase of Strzyza Stream, vicinity of shipyard, powerstation and storage place for ashes from the powerstation also does not remarkably worsen the waterquality.

2024 Environ Monit Assess (2012) 184:2017–2029
More polluted seem to be the three remain-ing watercourses: Dead Vistula River, SiedlickiStream and Orunski Stream. Deteriorated waterquality in the Dead Vistula can be caused by thefact that it is an artificial canal that intersectsVistula River, the largest River in Poland, whichflows through the whole country and accumu-lates vast quantities of various origins pollution(sewage, wastewater, urban and agricultural run-off). Both Siedlicki Stream and Orunski Streamhave similar hydrological properties with ratherlow flow of water (0.06 and 0.03 m3 s−1, respec-tively) and average depth of only 0.2 m. In case ofboth streams, one sampling point, close to mouth,was situated in the city centre park; however,such a poor quality of water in those watercoursesis attributed to their flow through wastelands orprivately owned rural or suburban lands, often de-veloped for gardening or used as a second home.Because these lands are not served by a sewagesystem and are often managed agriculturally,water quality is at higher risk.
Relations between physicochemicalparameters of water
Relations between the physicochemical parame-ters measured in all water samples in the wholestudy period are explained on the basis of thevalues of linear Pearson’s correlation coefficientspresented in Table 3. Analysis of correlationcoefficients (p = 0.05) shows that some commonrelations only for variables describing oxygen con-ditions of water can be noticed. The value ofcorrelation coefficient equals –0.66 for the pairDO and T, and 0.83 for DO with OS. It canbe explained by the fact that OS is calculated
based on DO, taking into consideration the valuesof temperature, atmospheric pressure and watersalinity (Chang 2005; Yunus and Nakagoshi 2004).It is though not surprising that the relation be-tween DO and water temperature (T) is inverselyproportional; with the increase of temperature thevalue of DO decreases (correlation –0.66). DOand OS depletion occurs also with an increaseof BOD and COD values, another pair of inter-correlated variables. The COD with BOD cor-relation can be explained by the fact that BODrepresents labile organic matter which undergoesbiotic decomposition and is a part of COD. CODdescribes total organic matter content, which isoxidised by a strong oxidant (Almeida et al. 2007).A positive correlation of 0.70 between BOD andCOD might suggest that regardless the season ofsampling relation between these two variables isconstant.
The values of correlation coefficients betweenthe other physicochemical parameters of waterare statistically non-significant (p = 0.05). How-ever, it is worth to point out that the values ofcorrelation coefficients were calculated on thebasis of a huge number of pairs of the results(>1,300), what considerably increases the theirlevel of significance. Moreover, the studies carriedout through the long period of 8 years, are of en-vironmental character and are described by highvariability, with frequently observed extreme andoutline values, what also significantly influencesthe correlation coefficients.
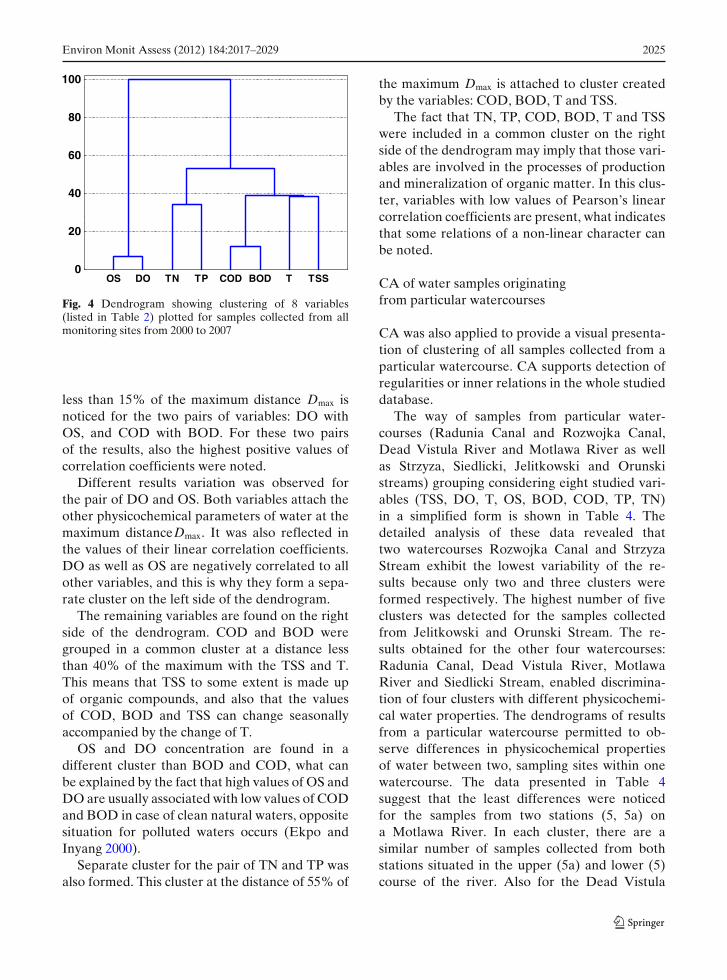
Application of CA, a chemometric method ofdata exploration, broadened and confirmed in-formation about relations between investigatedvariables. Figure 4 shows dendrogram presentingthe clustering of the analysed variables. It can beobserved that the lowest agglomeration distance,
Table 3 Correlationmatrix for studiedparameters, data from thewhole study
n > 10 500. Boldfacedvalues representsignificant correlation(p = 0.05)
TSS DO T OS BOD COD TP
DO −0.03T 0.05 −0.66OS 0.00 0.83 −0.14BOD 0.19 −0.35 0.25 −0.27COD 0.23 −0.32 0.14 −0.31 0.70TP 0.00 −0.18 0.03 −0.22 0.24 0.19TN −0.03 −0.08 −0.14 −0.22 −0.03 −0.11 0.15
Environ Monit Assess (2012) 184:2017–2029 2025
OS DO TN TP COD BOD T TSS0
20
40
60
80
100
Fig. 4 Dendrogram showing clustering of 8 variables(listed in Table 2) plotted for samples collected from allmonitoring sites from 2000 to 2007
less than 15% of the maximum distance Dmax isnoticed for the two pairs of variables: DO withOS, and COD with BOD. For these two pairsof the results, also the highest positive values ofcorrelation coefficients were noted.
Different results variation was observed forthe pair of DO and OS. Both variables attach theother physicochemical parameters of water at themaximum distanceDmax. It was also reflected inthe values of their linear correlation coefficients.DO as well as OS are negatively correlated to allother variables, and this is why they form a sepa-rate cluster on the left side of the dendrogram.
The remaining variables are found on the rightside of the dendrogram. COD and BOD weregrouped in a common cluster at a distance lessthan 40% of the maximum with the TSS and T.This means that TSS to some extent is made upof organic compounds, and also that the valuesof COD, BOD and TSS can change seasonallyaccompanied by the change of T.
OS and DO concentration are found in adifferent cluster than BOD and COD, what canbe explained by the fact that high values of OS andDO are usually associated with low values of CODand BOD in case of clean natural waters, oppositesituation for polluted waters occurs (Ekpo andInyang 2000).
Separate cluster for the pair of TN and TP wasalso formed. This cluster at the distance of 55% of
the maximum Dmax is attached to cluster createdby the variables: COD, BOD, T and TSS.
The fact that TN, TP, COD, BOD, T and TSSwere included in a common cluster on the rightside of the dendrogram may imply that those vari-ables are involved in the processes of productionand mineralization of organic matter. In this clus-ter, variables with low values of Pearson’s linearcorrelation coefficients are present, what indicatesthat some relations of a non-linear character canbe noted.
CA of water samples originatingfrom particular watercourses
CA was also applied to provide a visual presenta-tion of clustering of all samples collected from aparticular watercourse. CA supports detection ofregularities or inner relations in the whole studieddatabase.
The way of samples from particular water-courses (Radunia Canal and Rozwojka Canal,Dead Vistula River and Motlawa River as wellas Strzyza, Siedlicki, Jelitkowski and Orunskistreams) grouping considering eight studied vari-ables (TSS, DO, T, OS, BOD, COD, TP, TN)in a simplified form is shown in Table 4. Thedetailed analysis of these data revealed thattwo watercourses Rozwojka Canal and StrzyzaStream exhibit the lowest variability of the re-sults because only two and three clusters wereformed respectively. The highest number of fiveclusters was detected for the samples collectedfrom Jelitkowski and Orunski Stream. The re-sults obtained for the other four watercourses:Radunia Canal, Dead Vistula River, MotlawaRiver and Siedlicki Stream, enabled discrimina-tion of four clusters with different physicochemi-cal water properties. The dendrograms of resultsfrom a particular watercourse permitted to ob-serve differences in physicochemical propertiesof water between two, sampling sites within onewatercourse. The data presented in Table 4suggest that the least differences were noticedfor the samples from two stations (5, 5a) ona Motlawa River. In each cluster, there are asimilar number of samples collected from bothstations situated in the upper (5a) and lower (5)course of the river. Also for the Dead Vistula

2026 Environ Monit Assess (2012) 184:2017–2029
Table 4 Composition of the clusters detected by the cluster analysis of water samples collected from 2000 to 2007
Watercourse Clusters Year Total
2000 2001 2002 2003 2004 2005 2006 2007
Strzyza Stream I 1 1 (1a)1, 1a II 1 2 1 1 4 (1), 1 (1a)
III 13 22 23 24 18 24 24 23 83 (1), 88 (1a)Radunia Canal I 7 3 10 3 1 2 10 7 13 (2), 30 (2a)
2, 2a II 5 6 2 3 3 1 4 18 (2), 6 (2a)III 4 6 7 8 7 4 4 7 18 (2), 29 (2a)IV 2 5 4 7 7 18 9 6 40 (2), 18 (2a)
Dead Vistula River I 3 10 11 11 4 10 13 12 40 (3), 34 (3a)3, 3a II 1 2 4 3 8 4 7 3 19 (3), 13 (3a)
III 2 4 2 1 3 2 9 (3), 5 (3a)IV 3 5 9 9 4 9 1 7 21 (3), 26 (3a)
Rozwojka Canal I 2 5 7 6 6 12 10 2 50 (4)4 II 7 7 5 3 3 2 10 37 (4)
Motlawa River I 6 5 5 3 2 11 6 20 (5), 18 (5a)5, 5a II 2 8 6 10 3 4 9 9 25 (5), 26 (5a)
III 7 6 8 3 8 7 1 4 24 (5), 20 (5a)IV 3 5 10 5 4 11 3 5 23 (5), 23 (5a)
Siedlicki Stream I 2 1 (6), 1 (6a)6, 6a II 4 5 12 10 9 18 10 5 28 (6), 45 (6a)
III 3 4 1 1 4 6 13 (6), 6 (6a)IV 12 11 12 9 8 5 10 13 43 (6), 37 (6a)
Jelitkowski Stream I 1 2 6 4 6 10 8 6 15 (7), 28 (7a)7, 7a II 1 4 3 1 3 9 (7), 3 (7a)
III 10 8 4 5 6 6 8 31 (7), 16 (7a)IV 7 5 10 5 11 8 8 23 (7), 31 (7a)V 6 3 9 2 2 2 12 (7), 12 (7a)
Orunski Stream I 1 1 1 (8), 1 (8a)8, 8a II 1 1 (8)
III 1 11 8 4 5 3 7 4 19 (8), 24 (8a)IV 8 8 14 14 10 17 7 15 48 (8), 45 (8a)V 7 5 2 6 2 4 10 5 21 (8), 20 (8a)
Eight water parameters listed in Table 2 were determined at each sampling site. Site locations and characteristics aredescribed in Table 1. Data in the table represent the number of samples that were grouped into a given cluster
River (sites 3 and 3a) and Orunski Stream (sites 8and 8a) samples differences in water compositionfrom the two sampling sites were not significant.Therefore, it can be concluded that rivers trans-ferring considerable amounts of water (Motlawa,Dead Vistula) have more stable composition dueto higher ability for self-purification and are moreresistant to inflow of pollutants or more pollutedwater from other watercourses. The highest di-versity of results between two stations 2 and 2awas detected for Radunia Canal. Most of thesamples collected from station 2 were arranged incluster IV, while samples from the site 2a werefound mainly in clusters I and III. In contrast to
the samples originating from the station 2, thesamples from the station 2a, located in the uppercourse of the canal were characterised by lowerconcentration of TSS and DO, smaller degree oforganic matter pollution (COD, BOD) and bio-genic compounds (TN, TP). It was attributed notonly to seasonal small flow or low water level inthe Radunia Canal but also inflow of water fromOrunski Stream and Siedlicki Stream, what canmodify water properties of Radunia Canal at itsmouth to the Motlawa River.
Analysis of dendrograms in Fig. 5a–d plot-ted for samples collected from the particularwatercourses indicated that a month of sample

Environ Monit Assess (2012) 184:2017–2029 2027
collection may influence the arrangement of sam-ples into clusters. Grouping of samples in twoperiods was observed: warm, spring–summer, ap-proximately from May to September, and cool,autumn–winter, more or less from October toApril. Seasonal patterns were detected mainlyfor DO and OS with maximal values in coolseason, accompanied by minimal values of CODand BOD. Similar observations were made bySimeonov et al. (2001). The exception was year2005, for which most of the samples were groupedinto one cluster. In dendrograms plotted for thewatercourses Rozwojka Canal, Radunia Canaland Jelitkowski Stream, the samples collected in
cool period of the year were located in the rightside of the plots (example on Fig. 5a). In case ofOrunski Stream and Dead Vistula River the op-posite situation was noticed with the samples fromthe colder period of the year on the left side ofthe dendrograms (Fig. 5b). The samples collectedfrom three watercourses: Strzyza Stream, SiedlickiStream and Motlawa River, have also tendencyto cluster in accordance with the period of theircollection. This can take place either within cer-tain clusters (Strzyza Stream, Siedlicki Stream;Fig. 5c), or alternately, when clusters I and IIIgroup samples from warmer period, whereas IIand IV from cool period (Motlawa River; Fig. 5d).
0
20
40
60
80
100
I II
warm seasoncool season
0
20
40
60
80
100
I II III VIV
warm season cool season
0
20
40
60
80
100
warm season cool seasoncool season
I II III IV
0
20
40
60
80
100
III III IV
cool seasoncool season warm seasonwarm
season
a b
c d
Fig. 5 a–d Dendrograms illustrate clustering (eight pa-rameters listed in Table 2) of samples collected fromRozwojka—site 4 (a); Orunski Stream—sites 8, 8a (b);Siedlicki Stream—sites 6, 6a (c) and Motlawa River—sites
5, 5a (d) from 2000 to 2007. The two seasons of sampling(warm, cool) with different water properties are separatedwith a vertical dashed line

2028 Environ Monit Assess (2012) 184:2017–2029
Conclusions
Interpretation of the monitoring results revealedthat eight analysed water quality parameters: TSS,DO, T, OS, BOD, COD, TP and TN allowto differentiate watercourses according to waterquality.
It can be also concluded that the quality ofexamined waters is relatively good with respectto Polish standards of water quality which imple-ment EU Water Framework Directive. Distinctivephysicochemical properties of water were notedfor two watercourses Jelitkowski Stream and Roz-wojka Canal. It confirms that water quality of thewatercourses in the region of Gdansk Municipal-ity depends on their location. Jelitkowski Streamflows through forests, Tricity Landscape Park andrecreational areas, whereas Rozwojka on her waypasses oil refinery and receives inflow of treatedsewage and drainage water. Heap of phosph-ogypsum dump is another source of pollution,releasing phosphorus to water. However, this con-tamination regards Dead Vistula River – a largeriver with high flow of water and considerabledepth.
Application of cluster analysis revealed thatcommon clusters were formed for the two pairs ofvariables: DO concentration with OS, and CODwith BOD. Moreover, DO and OS are found inseparate cluster than other variables. CA showedalso that Rozwojka Canal and Strzyza Streamexhibit the least difference of results, while thehighest number of five clusters was observed forJelitkowski Stream and Orunski Stream. In addi-tion, CA demonstrated that the least differencesfor samples collected from two sampling siteswere for the Dead Vistula River, Motlawa Riverand Orunski Stream. The largest diversity of re-sults between the two stations on one watercoursein case of Radunia Canal was detected. CA alsoindicated that samples of water are clustered intwo periods warm and cool, as a month of samplecollection may determine their arrangement intoclusters.
Open Access This article is distributed under the termsof the Creative Commons Attribution Noncommercial Li-cense which permits any noncommercial use, distribution,and reproduction in any medium, provided the originalauthor(s) and source are credited.
References
Almeida, C. A., Quintar, S., Gonzalez, P., & Mallea, M. A.(2007). Influence of urbanization and tourist activitieson the water quality of the Potrero de los Funes River(San Luis–Argentina). Environmental Monitoring andAssessment, 133, 459–465.
APHA (2005). Standard methods for the examinationof water & wastewater (21st ed.). Washington. D.C:American Public Health Association.
Astel, A., Tsakovski, S., Barbieri, P., & Simeonov, V.(2007). Comparison of self-organizing maps clas-sification approach with cluster and principal compo-nents analysis for large environmental data sets. WaterResearch, 41(19), 4566–4578.
Brogueira, M. J., & Cabeçadas, G. (2006). Identification ofsimilar environmental areas in Tagus estuary by usingmultivariate anlysis. Ecological Indicators, 6(3), 508–515.
Chang, H. (2005). Spatial and temporal variations of waterquality in the Han River and its tributaries, Seoul,Korea, 1993–2002. Water Air & Soil Pollution, 161,267–284.
Dojlido, J. (1987). Chemia wody (chemistry of water).Warsaw: Arkady.
Dz. U. Nr 162, poz. 1008 (2008). RozporzadzenieMinistra Srodowiska z dnia 20 sierpnia 2008 roku wsprawie sposobu klasyfikacji stanu jednolitych czesciwód powierzchniowych (Regulation of the PolishMinister of Environment of 20 August 2008 on theclassification of the surface water bodies), 8654–8681.http://static1.money.pl/d/akty_prawne/pdf/DU/2008/162/DU20081621008.pdf. Accessed 20 March 2010.
Ekpo, N. M., & Inyang, L. E. D. (2000). Radioac-tivity, physical and chemical parameters of under-ground and surface waters in Qua Iboe River estuary,Nigeria. Environmental Monitoring and Assessment,60, 47–55.
Giridharan, L., Venugopal, T., & Jayaprakash, M. (2009).Assessment of water quality using chemometric tools:A case study of river Cooum, South India. Archivesof Environmental Contamination and Toxicology, 56,654–669.
Goncharuk, V. V. (2008). A new concept of supplying thepopulation with a quality drinking water. Journal ofWater Chemistry and Technology, 30, 129–136.
Hill, Y., & Lewicki, P. (2006). Statistics, methods and appli-cations: A comprehensive reference for science, indus-try, and data mining. Tulsa: StatSoft.
Holt, M. S. (2000). Sources of chemical contaminants androutes into the freshwater environment. Food Chem-istry and Toxicology, 38, S21–S27.
Kannel, P. R., Lee, S., Kanel, S. R., & Khan, S. P. (2007).Chemometric application in classification and assess-ment of monitoring locations of an urban river system.Analytica Chimica Acta, 582, 390–399.
Marengo, E., Gennaro, M. C., Giacosa, D., Abrigo, C.,Saini, G., & Avignone, M. T. (1995). How chemo-metrics can helpfully assist in evaluating environmen-tal data. Lagoon water. Analytica Chimica Acta, 317,53–63.

Environ Monit Assess (2012) 184:2017–2029 2029
Ocampo-Duque, W., Ferré-Huguet, N., Domingo, J. L.,& Schuhmacher, M. (2006). Assessing water qualityin rivers with fuzzy inference systems: A case study.Environment International, 32(6), 733–742.
Olajire, A. A., & Imeokparia, F. E. (2001). Water qualityassessment of Osun River: Studies on inorganic nutri-ents. Environmental Monitoring and Assessment, 69,17–28.
Otto, M. (1999). Chemometrics: Statistics and computerapplication in analytical chemistry. New York: Wiley.
Petraccia, L., Liberati, G., Masciullo, S. G., Grassi, M., &Fraioli, A. (2006). Water, mineral waters and health.Clinical Nutrition, 25, 377–385.
Reghunath, R., Sreedhara Murthy, T. R., & Raghavan,B. R. (2002). The utility of multivariate statistical tech-niques in hydrogeochemical studies: An example fromKarnataka, India. Water Research, 36, 2437–2442.
Reisenhofer, E., Adami, G., & Barbieri, P. (1998). Usingchemical and physical parameters to define the qualityof karstic freshwaters (Timavo River, North-EasternItaly): A chemometric approach. Water Research, 32,1193–1203.
Simeonov, V., Sarbu, C., Massart, D. L., & Tsakovski,S. (2001). Danube River water data modelling bymultivariate data analysis. Mikrochimica Acta, 137,243–248.
Simeonov, V., Stratis, J. A., Samara, C., Zachariadis, G.,Voutsa, D., Anthemidis, A., et al. (2003). Assessment
of the surface water quality in Northern Greece. WaterResearch, 37, 4119–4124.
Van Leeuwen F. X. R. (2000). Safe drinking water: Thetoxicologist’s approach. Food Chemistry and Toxicol-ogy, 38, S51–S58.
Vega, M., Pardo, R., Barrado, E., & Debán, L. (1998).Assessment of seasonal and polluting effects on thequality of river water by exploratory data analysis.Water Research, 32, 3581–3592.
WFD (2000). Directive 2000/60/EC of the EuropeanParliament and of the Council of 23 October 2000establishing a framework for Community actionin the field of water policy. http://eur-lex.europa.eu/LexUriServ/LexUriServ.do?uri=CELEX:32000L0060:EN:NOT. Accessed 20 March 2010.
Xia, X., Yang, Z., Wang, R., & Meng, L. (2005). Contam-ination of oxygen-consuming organics in the YellowRiver of China. Environmental Monitoring andAssessment, 110, 185–202.
Yunus, A. J. M., & Nakagoshi, N. (2004). Effects of sea-sonality on streamflow and water quality of the PinangRiver in Penang Island, Malaysia. Chinese Geographi-cal Science, 14, 153–161.
Zhang, Y., Guo, F., Meng, W., & Wang, X.-Q. (2009).Water quality assessment and source identification ofDaliao river basin using multivariate statistical meth-ods. Environmental Monitoring and Assessment, 152,105–121.