application of pollen analysis to dating of ice cores … of pollen analysis to dating of ice cores...
TRANSCRIPT

Application of pollen analysis to dating of ice cores from lower-latitude
glaciers
Fumio Nakazawa,1 Koji Fujita,2 Jun Uetake,3 Mika Kohno,4 Toshiyuki Fujiki,2
Serguei M. Arkhipov,5 Takao Kameda,6 Keisuke Suzuki,7 and Yoshiyuki Fujii4
Received 23 January 2004; revised 7 June 2004; accepted 2 August 2004; published 7 October 2004.
[1] Ice cores from temperate regions have long been expected to be useful forunderstanding local climate trends, but a reliable dating method has proved difficult. Herewe show that measurements of pollen using samples with only 10 mL of water can give anaccurate measure of the annual ice accumulation. In addition, two major types of pollenallow us to estimate the summer ice accumulation as well as the annualaccumulation. INDEX TERMS: 1827 Hydrology: Glaciology (1863); 1863 Hydrology: Snow and ice
(1827); 9320 Information Related to Geographic Region: Asia; KEYWORDS: pollen, glaciers, ice cores, middle
and low-latitude, chronology, Aitai
Citation: Nakazawa, F., K. Fujita, J. Uetake, M. Kohno, T. Fujiki, S. M. Arkhipov, T. Kameda, K. Suzuki, and Y. Fujii (2004),
Application of pollen analysis to dating of ice cores from lower-latitude glaciers, J. Geophys. Res., 109, F04001, doi:10.1029/
2004JF000125.
1. Introduction
[2] Studies of deep ice cores from Greenland and Ant-arctica have proven crucial for reconstructing past environ-mental history [e.g., Lorius et al., 1990; Jouzel et al., 1993;Grootes et al., 1993; McManus et al., 1994]. On the otherhand, ice cores from lower-latitude glaciers (between about60�N and 60�S), although covering a shorter timescale, canprovide important climate information that is influenced bythe local surroundings. However, ice core studies on lower-latitude glaciers have generally been limited to elevationsabove 4000 m above sea level (asl); specifically, Dunde(5325 m) [Thompson et al., 1989], Guliya (6200 m)[Thompson et al., 1995a], Dasuopu (7200 m) [Thompsonet al., 2000], and Belukha (4062 m) [Olivier et al., 2003] incentral Asia; Upper Fremont (4000 m) [Naftz et al., 1996] inNorth America; Quelcaya (5670 m) [Thompson et al.,1985], Sajama (6542 m) [Thompson et al., 1998], andHuascaran (6048 m) [Thompson et al., 1995b] in the Andes;and Kilimanjaro (5893 m) [Thompson et al., 2002] inAfrica. Few studies are done on such lower-latitude glaciers,mainly because summer melting distorts the annual signal
from the seasonal variations in chemical concentrations andoxygen isotope ratios (d18O) that are used to date polar icecores. Thus other methods are needed. One study of aHimalayan ice core analyzed snow algae for ice core dating[Yoshimura et al., 2000]. The study found that the detectionand identification of snow algae below 5 m (i.e., over 8 yearsold) of the core is difficult due to autolysis or bacterialdecomposition. Therefore algae analysis is limited to rela-tively recent ice.[3] Thus to develop a dating method applicable to ice
cores from lower-elevation and lower-latitude glaciers, weturned our attention to the seasonality of pollen preservedin an ice core. Previous pollen studies have been mainlydone on arctic ice caps and glaciers [e.g., Fredskild andWagner, 1974; Lichti-Federovich, 1975; McAndrews, 1984;Bourgeois et al., 1985; Short and Holdsworth, 1985;Koerner et al., 1988; Bourgeois, 1990, 2000], where thepollen mostly originates from sources hundreds to thousandsof kilometers away, and thus the pollen concentrationsin ice typically range from 10 to 100 grains L�1. Only afew studies have investigated seasonal pollen variations infirn pits and ice cores [Ambach et al., 1966; Short andHoldsworth, 1985; Bourgeois, 1990, 2000]. However, thecores were not dated in these studies because the methodsrequired about 1000 mL per sample to get enough pollen,which exceeded the typical ice core sample volume of about500 mL. On the other hand, lower-latitude glaciers aretypically within a few tens of kilometers of significantpollen sources, and thus they typically have peak concen-trations of at least 1 pollen grain mL�1 in the ice. Othermerits of using pollen for ice core dating include thefollowing: (1) pollen grains are deposited on glaciersurfaces for only a few months of the year and with apeak period that is independent of the total pollen countbut dependent on the species [Iwanami, 1980, pp. 168–170]; (2) the size of a pollen grain is between about 10and 150 mm, which seems to help it to remain at its
JOURNAL OF GEOPHYSICAL RESEARCH, VOL. 109, F04001, doi:10.1029/2004JF000125, 2004
1Graduate School of Science, Nagoya University, Nagoya, Japan.2Graduate School of Environmental Studies, Nagoya University,
Nagoya, Japan.3Faculty of Bioscience and Biotechnology, Tokyo Institute of
Technology, Tokyo, Japan.4National Institute of Polar Research, Tokyo, Japan.5Institute of Geography, Russian Academy of Sciences, Moscow,
Russian Federation.6Kitami Institute of Technology, Hokkaido, Japan.7Department of Environmental Sciences, Faculty of Science, Shinshu
University, Nagano, Japan.
Copyright 2004 by the American Geophysical Union.0148-0227/04/2004JF000125$09.00
F04001 1 of 6

original depth despite meltwater incursion; and (3) thesporopollenin, which is the outer shell of the pollen,protects the pollen from decay, and thus pollen can bepreserved even in 130,000-year-old ice [McAndrews,1984]. Furthermore, as no pollen sources peak in winter,the concentration of pollen in the winter layer is typicallyless than 0.5 grains mL�1 [Haeberli et al., 1983]. In
addition, the pollen type may allow one to estimate thelayers in different seasons.
2. Study Area and Methods
[4] Sofiyskiy glacier (49�470N, 87�430E) is one of themajor glaciers in the central part of the South Chuyskiy
Figure 1. Vegetation map surrounding the southern Chuyskiy Range, based on a vegetation map byJanvareva [1978].
Figure 2. Topographic map and location of Sofiyskiy glacier.
F04001 NAKAZAWA ET AL.: POLLEN ANALYSIS AND DATING OF ICE CORES
2 of 6
F04001
Range within the Russian Altai Mountains, situated in theborder region between Russia and Mongolia (Figure 1). Themajor types of vegetation surrounding the range are tundraand steppe, including Artemisia and coniferous forest withPinus, Picea, and Abies, as shown in Figure 1. The tree lineson the south and north facing slope around Sofiyskiy glacierare both about 2500 m asl, and tundra predominates abovethe tree line.[5] In July of 2001 a 25.1-m-deep ice core was recovered
on the accumulation area of Sofiyskiy glacier (3435 m asl),and a 4.5-m-deep pit was excavated about 50 m northwestof the drill site (Figure 2). In July 2000 a 3-m-deep pit wasdug near the drill site [Fujii et al., 2000; Kameda et al.,2003]. At the drill site, some surface melting occurs duringthe summer season, and the firn temperature rises to 0�C[Fujii et al., 2002]. Sofiyskiy glacier, like other Altaiglaciers, is characterized as a summer-accumulation-typeglacier [Fujita et al., 2004; Smedt and Pattyn, 2004; Pattynet al., 2004]. The core samples were cut at intervals of about20 cm, and pit samples were obtained every 10 cm. Weanalyzed all pit samples and core samples down to 18.60 mdepth for pollen concentrations, oxygen isotope ratios(d18O), and chemical concentrations. For the pollen analy-
sis, 10 mL of water sample was filtered through hydrophilicPTFE membrane filters with a pore size of 0.2 mm, andpollen grains on the filters were counted using a micro-scope. No chemical treating was done for the pollenanalyses. Total pollen counts in the samples ranged from0 to 209 grains.
3. Results and Discussion
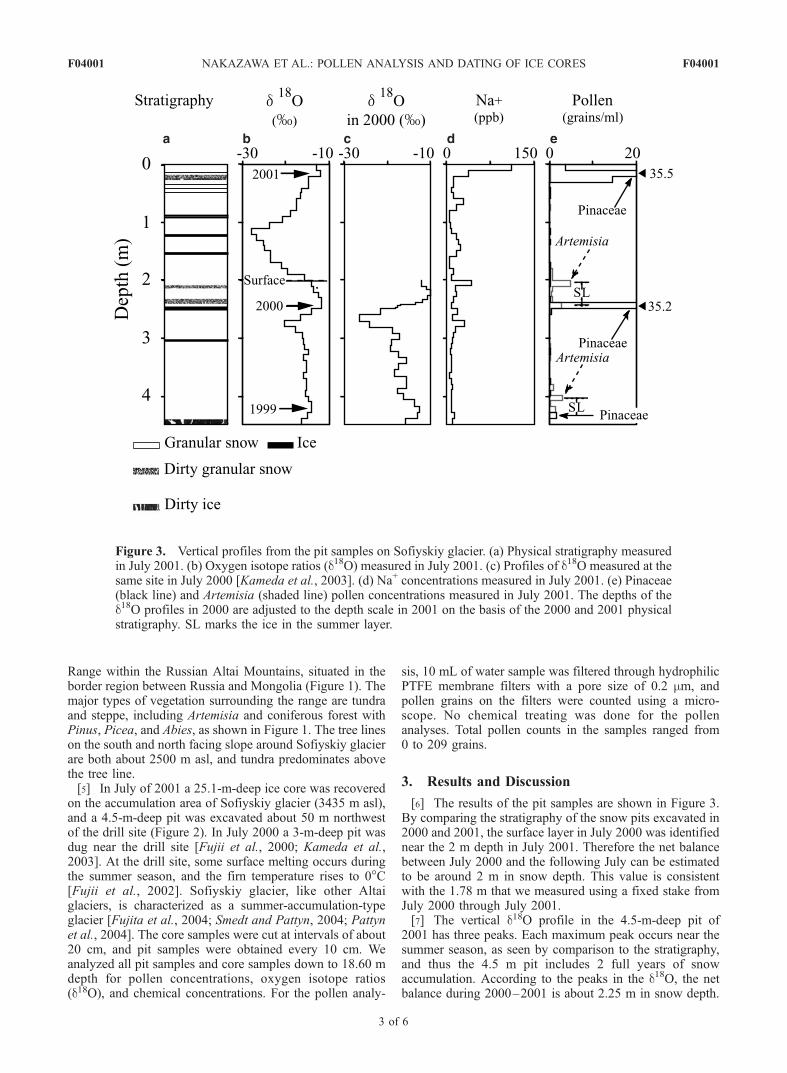
[6] The results of the pit samples are shown in Figure 3.By comparing the stratigraphy of the snow pits excavated in2000 and 2001, the surface layer in July 2000 was identifiednear the 2 m depth in July 2001. Therefore the net balancebetween July 2000 and the following July can be estimatedto be around 2 m in snow depth. This value is consistentwith the 1.78 m that we measured using a fixed stake fromJuly 2000 through July 2001.[7] The vertical d18O profile in the 4.5-m-deep pit of
2001 has three peaks. Each maximum peak occurs near thesummer season, as seen by comparison to the stratigraphy,and thus the 4.5 m pit includes 2 full years of snowaccumulation. According to the peaks in the d18O, the netbalance during 2000–2001 is about 2.25 m in snow depth.
Figure 3. Vertical profiles from the pit samples on Sofiyskiy glacier. (a) Physical stratigraphy measuredin July 2001. (b) Oxygen isotope ratios (d18O) measured in July 2001. (c) Profiles of d18O measured at thesame site in July 2000 [Kameda et al., 2003]. (d) Na+ concentrations measured in July 2001. (e) Pinaceae(black line) and Artemisia (shaded line) pollen concentrations measured in July 2001. The depths of thed18O profiles in 2000 are adjusted to the depth scale in 2001 on the basis of the 2000 and 2001 physicalstratigraphy. SL marks the ice in the summer layer.
F04001 NAKAZAWA ET AL.: POLLEN ANALYSIS AND DATING OF ICE CORES
3 of 6
F04001
This value is close to the 2 m estimated from comparison ofstratigraphy in the 2000 and 2001 snow pits. However, theamplitude of d18O for 1999 and 2000 is smaller in July 2001(Figure 3b) than it was in July 2000 (Figure 3c). The recordsof major ion concentrations show that the peaks haddisappeared rapidly; as an example, we show the Na+
concentrations in Figure 3d. The Na+ peaks in 1999 and2000 are unclear, although the peak in 2001 is at the surfaceto 0.10 m depth. Thus chemical ion species cannot be usedmore deeply in the core.[8] Pollen analyses of the pit samples showed that the
most abundant pollen were Pinaceae (Pinus, Picea, andAbies) and Artemisia. In general, pollen grains of Pinaceaeare scattered from late spring to early summer, whereasthose of Artemisia are scattered in early autumn. Pinaceaepeaks occur at 0.10–0.20, 2.40–2.50, and 4.30–4.40 mdepths, while Artemisia peaks are about 20–30 cm abovethe Pinaceae peaks (Figure 3e). Moreover, the Pinaceaepeaks are very close to the d18O peaks. These peakscorrespond to the seasons of pollen dispersion; in particular,Pinaceae peaks mark spring, whereas Artemisia marksautumn. Therefore the peaks can mark both annual andseasonal layers. These pit observations show that eventhough chemical species and d18O profiles are significantlyaltered by postdepositional processes, pollen profiles in thesame location are only weakly influenced by percolationand refreezing of meltwater.[9] Figure 4 shows pollen concentrations and d18O in the
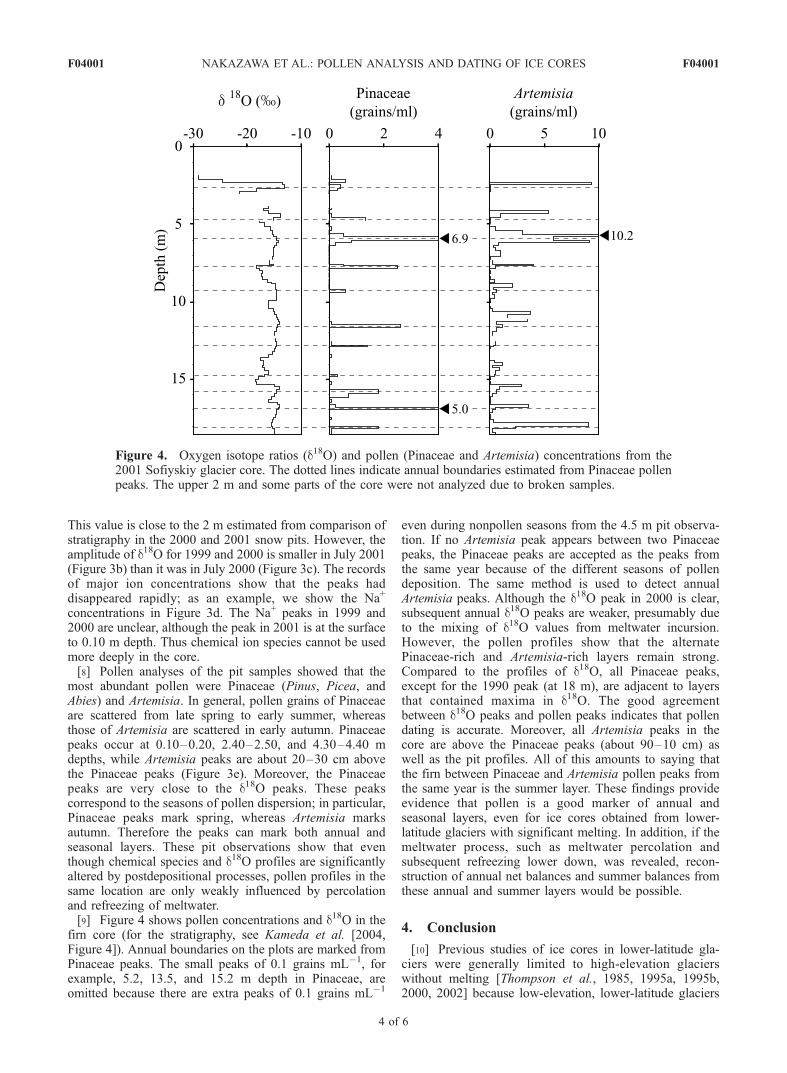
firn core (for the stratigraphy, see Kameda et al. [2004,Figure 4]). Annual boundaries on the plots are marked fromPinaceae peaks. The small peaks of 0.1 grains mL�1, forexample, 5.2, 13.5, and 15.2 m depth in Pinaceae, areomitted because there are extra peaks of 0.1 grains mL�1
even during nonpollen seasons from the 4.5 m pit observa-tion. If no Artemisia peak appears between two Pinaceaepeaks, the Pinaceae peaks are accepted as the peaks fromthe same year because of the different seasons of pollendeposition. The same method is used to detect annualArtemisia peaks. Although the d18O peak in 2000 is clear,subsequent annual d18O peaks are weaker, presumably dueto the mixing of d18O values from meltwater incursion.However, the pollen profiles show that the alternatePinaceae-rich and Artemisia-rich layers remain strong.Compared to the profiles of d18O, all Pinaceae peaks,except for the 1990 peak (at 18 m), are adjacent to layersthat contained maxima in d18O. The good agreementbetween d18O peaks and pollen peaks indicates that pollendating is accurate. Moreover, all Artemisia peaks in thecore are above the Pinaceae peaks (about 90–10 cm) aswell as the pit profiles. All of this amounts to saying thatthe firn between Pinaceae and Artemisia pollen peaks fromthe same year is the summer layer. These findings provideevidence that pollen is a good marker of annual andseasonal layers, even for ice cores obtained from lower-latitude glaciers with significant melting. In addition, if themeltwater process, such as meltwater percolation andsubsequent refreezing lower down, was revealed, recon-struction of annual net balances and summer balances fromthese annual and summer layers would be possible.
4. Conclusion
[10] Previous studies of ice cores in lower-latitude gla-ciers were generally limited to high-elevation glacierswithout melting [Thompson et al., 1985, 1995a, 1995b,2000, 2002] because low-elevation, lower-latitude glaciers
Figure 4. Oxygen isotope ratios (d18O) and pollen (Pinaceae and Artemisia) concentrations from the2001 Sofiyskiy glacier core. The dotted lines indicate annual boundaries estimated from Pinaceae pollenpeaks. The upper 2 m and some parts of the core were not analyzed due to broken samples.
F04001 NAKAZAWA ET AL.: POLLEN ANALYSIS AND DATING OF ICE CORES
4 of 6
F04001
have significant summer melting that complicates standardchemical analysis methods. However, such glaciers cancontain relatively large amounts of pollen that can beanalyzed to determine past climate condition. For example,we found that only 10 mL of melted water sample wasneeded for pollen analysis of one such glacier, Sofiyskiyglacier of the Russia Altai Mountains, which contrasts withprevious studies that needed more than 1 L. Moreover,finding concentration peaks of the each pollen species israther easy because these distinct peaks appear at differentdepths, depending on species that have different pollenseasons.[11] Consequently, we have shown here that pollen anal-
ysis can be used to determine annual layers, even for an icecore obtained from glaciers with significant melting. Fur-thermore, this method also can be used to separate seasonalboundaries by using different pollen species.[12] The lower-latitude glaciers where summer melting
occurs have seldom received attention for ice core study upto date. Thus the analysis of pollen in such glaciers mayprovide a greater understanding of past climates in the lowerlatitudes.
[13] Acknowledgments. We acknowledge the following persons,who contributed to our research project: O. Watanabe of the NationalInstitute of Polar Research and Hugo Decleir of Vrije Universiteit Brusselfor valuable support for this project; N. N. Mikhailov and I. A. Ponomarevof Altai State University for their kind support; H. Kitagawa of NagoyaUniversity and T. Nakagawa of Newcastle University, UK, for pollenanalysis and their useful advice; Y. Iizuka of Yuge National College ofMaritime Technology, S. Matoba of the National Institute for Environmen-tal Studies, and M. Igarashi of the National Institute of Polar Research forchemical analysis; and O. V. Ostanin of Altai State University, G. I.Nenasheva of Altai State University, D. Troshkin of Nagoya University,and K. Fukui of the National Institute of Polar Research for collecting andproviding information on vegetation in Russia’s Altai region. This researchwas supported by a Grant-in-Aid of the International Scientific ResearchProgram of the Ministry of Education, Culture, Sports, Science andTechnology, Japan (principal investigator of the grant: K. Kamiyama ofNIPR, 11208202); by the research project ‘‘Aeolian Dust Experiment onClimate Impact (ADEC),’’ funded by Special Coordination Funds forPromoting Science and Technology; by the Oasis Project (historicalevolution of adaptability in an oasis region to water resource changes),promoted by the Research Institute for Humanity and Nature, Kyoto, Japan;and by a grant from the Ministry of Education, Culture, Sports, Science andTechnology of Japan (G-4, the 21st Century COE Program).
ReferencesAmbach, W., S. Bortenschlager, and H. Eisner (1966), Pollen-analysisinvestigation of a 20 m firn pit on the Kesselwandferner (Otztal Alps),J. Glaciol., 6, 233–236.
Bourgeois, J. C. (1990), Seasonal and annual variation of pollen content inthe snow of a Canadian high Arctic ice cap, Boreas, 19, 313–322.
Bourgeois, J. C. (2000), Seasonal and interannual pollen variability in snowlayers of arctic ice caps, Rev. Palaeobot. Palynol., 108, 17–36.
Bourgeois, J. C., R. M. Koerner, and B. T. Alt (1985), Air-borne pollen:A unique air mass tracer, its influx to the Canadian high arctic, Ann.Glaciol., 7, 109–116.
Fredskild, B., and P. Wagner (1974), Pollen and fragments of plant tissue incore samples from the Greenland Ice Cap, Boreas, 3, 105–108.
Fujii, Y., F. Nishio, and T. Kameda (2000), Glaciological investigation atSofiyskiy glacier, Russia Altai Mountain (Japanese with Englishabstract), Seppyo, 62, 549–556.
Fujii, Y., et al. (2002), Outline of Japan-Russia joint glaciological researchon Sofiyskiy glacier, Russian Altai Mountains in 2000 and 2001, Bull.Glaciol. Res., 19, 53–58.
Fujita, K., N. Takeuchi, V. Aizen, and S. Nikitin (2004), Glaciologicalobservations on the plateau of Belukha glacier in the Altai Mountains,Russia from 2001 to 2003, Bull. Glaciol. Res., 21, 57–64.
Grootes, P. M., M. Stuiver, J. W. C. White, S. J. Johnson, and J. Jouzel(1993), Comparison of the oxygen isotope records from the GISP2 andGRIP Greenland ice cores, Nature, 366, 552–554.
Haeberli, W., U. Schotterer, D. Wagenbach, H. Haeberli-Schwitter, andS. Bortenschlager (1983), Accumulation characteristics on a cold, high-alpine firn saddle from a snow-pit study on Colle Gnifetti Monte Rosa,Swiss Alps, J. Glaciol., 29, 260–271.
Iwanami, Y. (1980), Palynology (in Japanese), 212 pp., Kodansha, Tokyo.Janvareva, L. F. (Ed.) (1978), Altai Territory: The Atlas, 222 pp., Cent.Admin. Board of Geod. and Cartogr. at Minist. Counc. of the U.S.S.R.,Moscow-Barnaul, Russia.
Jouzel, J., et al. (1993), Extending the Vostok ice-core record of palaeocli-mate to the penultimate glacial period, Nature, 364, 407–412.
Kameda, T., Y. Fujii, F. Nishio, L. M. Savatyugin, S. M. Arkhipov, I. A.Ponomarev, and N. N. Mikhailov (2003), Seasonality of isotopic andchemical species and biomass burning signals remaining in wet snowin the accumulation area of Sofiyskiy glacier, Russian Altai Mountains,Pol. Meteorol. Glaciol., 17, 15–24.
Kameda, T., Y. Fujii, K. Suzuki, M. Kohno, F. Nakazawa, J. Uetake, L. M.Savatyugin, S. M. Arkhipov, I. A. Ponomarev, and N. N. Mikhailov(2004), Stratigraphy and ice grains of a 25.3 m ice core from Sofiyskiyglacier, Russian Altai Mountains, in 2001, Bull. Glaciol. Res., 21, 65–69.
Koerner, R. M., J. C. Bourgeois, and D. A. Fisher (1988), Pollen analysisand discussion of time-scales in Canadian ice cores, Ann. Glaciol., 10,85–91.
Lichti-Federovich, S. (1975), Pollen analysis of ice core samples from theDevon Island Ice Cap, Geol. Surv. Can., 75/1A, 441–444.
Lorius, C., J. Jouzel, D. Raynaud, J. Hansen, and H. Le Treut (1990), Theice-core record: Climate sensitivity and future greenhouse warming,Nature, 347, 139–145.
McAndrews, J. H. (1984), Pollen analysis of the 1973 ice core from DevonIsland glacier, Canada, Quat. Res., 22, 68–76.
McManus, J. F., G. C. Bond, W. S. Broecker, S. Johnsen, L. Labeyrie, andS. Higgins (1994), High-resolution climate records from the North Atlan-tic during the last interglacial, Nature, 371, 326–329.
Naftz, D. L., R. W. Klusman, R. L. Michel, P. F. Schuster, M. M. Reddy,H. E. Taylor, T. M. Yanosky, and E. A. McConnaughey (1996), Little IceAge evidence from a south-central North American ice core, U.S.A.,Arct. Alp. Res., 28, 35–41.
Olivier, S., et al. (2003), Glaciochemical investigation of an ice core fromBelukha glacier, Siberian Altai, Geophys. Res. Lett., 30(19), 2019,doi:10.1029/2003GL018290.
Pattyn, F., B. De Smedt, S. De Brabander, W. Van Huele, A. Agatova,A. Mistrukov, and H. Decleir (2004), Ice dynamics and basal propertiesof Sofiyskiy glacier, Altai mountains, Russia, based on DGPS and radio-echo sounding surveys, Ann. Glaciol., 37, 286–292.
Short, S. K., and G. Holdsworth (1985), Pollen, oxygen isotope content andseasonality in an ice core from the Penny Ice Cap, Baffin Island, Arctic,38, 214–218.
Smedt, B. D., and F. Pattyn (2004), Numerical modelling of historical frontvariations and dynamic response of Sofiyskiy glacier, Altai mountains,Russia, Ann. Glaciol., 37, 143–149.
Thompson, L. G., E. Mosley-Thompson, J. F. Bolzan, and B. R. Koci(1985), A 1500 year record of climate variability recorded in ice coresfrom the tropical Quelccaya Ice Cap, Science, 229, 971–973.
Thompson, L. G., E. Mosley-Thompson, M. Davis, J. Bolzan, J. Dai,N .Gundestrup, T. Yao, X. Wu, and Z. Xie (1989), Holocene-LateWisconsin Pleistocene climatic ice core records from Qinghai-TibetanPlateau, Science, 246, 474–477.
Thompson, L. G., E. Mosley-Thompson, M. E. Davis, P.-N. Lin, J. Dai, andJ. Bolzan (1995a), A 1000 year ice core climate record from the GuliyaIce Cap, China: Its relationship to global climate variability, Ann. Gla-ciol., 21, 175–181.
Thompson, L. G., E. Mosley-Thompson, M. E. Davis, P.-N. Lin, K. A.Henderson, J. Cole-Dai, J. F. Bolzan, and K. B. Liu (1995b), Late GlacialStage and Holocene tropical ice core records from Huascaran, Peru,Science, 269, 46–50.
Thompson, L. G., et al. (1998), A 25,000 year tropical climate history fromBolivian ice cores, Science, 282, 1858–1864.
Thompson, L. G., T. Yao, E. M. Thompson, M. E. Davis, K. A. Henderson,and P.-N. Lin (2000), A high-resolution millennial record of theSouth Asian monsoon from Himalayan ice cores, Science, 289, 1916–1919.
Thompson, L. G., et al. (2002), Kilimanjaro ice core records: Evidence ofHolocene climate change in tropical Africa, Science, 298, 589–593.
Yoshimura, Y., S. Kohshima, N. Takeuchi, K. Seko, and K. Fujita(2000), Himalayan ice core dating with snow algae, J. Glaciol., 46,335–340.
�����������������������S. M. Arkhipov, Institute of Geography, Russian Academy of Sciences,
Staromonetniy lane 29, Moscow 109017, Russian Federation. ([email protected])
F04001 NAKAZAWA ET AL.: POLLEN ANALYSIS AND DATING OF ICE CORES
5 of 6
F04001

Y. Fujii and M. Kohno, National Institute of Polar Research, 9�10, Kaga1-chome, Itabashi-ku, 173-8515 Tokyo, Japan. ([email protected];[email protected])T. Fujiki and K. Fujita, Graduate School of Environmental Studies,
Nagoya University, Furo-cho, Chikusa-ku, 464-8601 Nagoya, Japan.([email protected]; [email protected])T. Kameda, Kitami Institute of Technology, 165, Koen-cho, Kitami, 090-
8507 Hokkaido, Japan. ([email protected])
F. Nakazawa, Graduate School of Science, Nagoya University, Furo-cho,Chikusa-ku, 464-8601 Nagoya, Japan. ([email protected])K. Suzuki, Department of Environmental Sciences, Faculty of Science,
Shinshu University, 3-1-1, Asahi, Matsumoto, 390-8621 Nagano, Japan.([email protected])J. Uetake, Faculty of Bioscience and Biotechnology, Tokyo Institute of
Technology, Ookayama, Meguro-ku, 152-8551 Tokyo, Japan. ([email protected])
F04001 NAKAZAWA ET AL.: POLLEN ANALYSIS AND DATING OF ICE CORES
6 of 6
F04001