application of response surface methodology for ... · response surface methodology based on two...
TRANSCRIPT
Iranica Journal of Energy & Environment 3 (2): 134-142, 2012 ISSN 2079-2115 IJEE an Official Peer Reviewed Journal of Babol Noshirvani University of Technology DOI: 10.5829/idosi.ijee.2012.03.02.0027
BUT
Corresponding Author: Seyyed Hassan Pishgar-Komle, Department of Agricultural Machinery Engineering, Faculty of Agricultural Engineering and Technology, University of Tehran, Karaj, Iran. Tel: +98-912-4642074, Fax: +98-261-2808138, E-mail: [email protected].
134
Optimization of Picker-Husker Harvesting Losses in Corn Seed
Department of Agricultural Machinery Engineering, 1
Faculty of Agricultural Engineering and Technology, University of Tehran, Karaj, Iran
Iranian Agricultural Engineering Research Institute, Karaj, Iran
Abstract: Seed corn is one of the most important crops due to its high economical value. For this reason harvesting operation should be done precisely. Losses in harvesting seed corn are inevitable but can be decreased to the acceptable level. There are several machinery factors such as cylinder and travel speed which can affect total harvesting losses in two stage harvesting method (with picker-husker and sheller). For this
1
speed (400, 500 and 600 rpm) and investigated the relationship between the specified factors (independent variables) and machinery losses (dependent variable). All types of machinery losses were measured and summed as total losses from a representative seed corn field. In order to find the relationship between the variables several models (linear, 2FI, quadratic and cubic) were tested. All analyses were done by applying the response surface methodology based on two variables, three levels and central composite design (CCD). Based on the results of this study, the relationship between cylinder and travel speed was analyzed and the corresponding model was designed. The results recommended that the 2FI model as the highest order model with significant term can describe the harvesting losses in relationship between cylinder and travel speed. The coefficient of determination (R ), the adjusted determination coefficient (adjusted R ) and coefficient of2 2
variation (CV) were calculated as 0.90, 0.89 and 3.69%, respectively and the response surface results showed that an increase of travel and cylinder speed would lead to an increase of harvesting losses. It was denoted that the travel speed have more impact on harvesting losses in comparison with cylinder speed. The optimization
1
1
1
INTRODUCTION production of corn from 1960 to 1994 illustrated the
Corn has been, for many years, an important cereal [1]. The corn global production was 818 million crop that supply the world food need. More consideration tonnes in 2009. The cultivated area and yield were
with other cereals such as wheat and rice. The global States of America with production of 333 million tonnes
production growth from 200 to 550 million tones
1
S.H. Pishgar-Komleh, A. Keyhani, M.R. Mostofi-Sarkari and A. Jafari 11 2 1
2
Application of Response Surface Methodology for
purpose this study evaluated the amount of losses in different speed levels (3, 4 and 5 km h ) and cylinder_
study showed the least harvesting losses of 209.88 kg ha in cylinder and travel speed of 600 rpm and 3 km_
h , respectively. It was concluded that the increase of travel and cylinder speed resulted in the increase of_
harvesting losses where the highest losses score was occurred in 5 km h and 600 rpm, respectively._
Key words: Response Surface Methodology; Seed Corn; Picker-husker; Machinery Losses
to this crop leads to more increase of corn in comparison 158 million ha 5,161 kg ha , respectively [2]. United_
(Received: January 3, 2012; Accepted: April 5, 2012)
Iranica J. Energy & Environ., 3 (2): 134-142, 2012
135
was in the first rank in 2009 and followed by China, Brazil, central Iowa. They found that a corn head row spacingMexico with production amount of 164, 51 and 20 million difference of 5cm from the harvested rows resulted in an
corn was 7.3 tonnes per hectare and the annual machine loss was at the corn head [12]. Hanna et al.
The concerns about losses have been in existence compared visible machine losses of a 76cm corn headsince agriculture began. In recent years and due to the used on 76cm and 38cm rows and a single gathering chaingrowth of world food demand, the importance of losses is 38cm corn head used on 38-cm rows. The resultsmore considerable. As much as half of all food grown is illustrated on matched row spacing, machine losses were
[4, 5]. Cutting harvesting and postharvest losses can add total machine loss of the conventional corn head (76cm)a sizable quantity to the global food supply and leads to was significantly less than the single gathering chain corn
Due to high yield of corn, decreasing the amount of ground speed and cylinder speed of corn combinelosses has become more importance. Minimizing corn harvester [14]. Results indicated that the effect of groundharvest losses can mean substantially higher yields speed on header loss and thresher loss while the effect ofand profits. cylinder speed were significant on thresher loss. The
The corn planting area had increased but there are highest total loss (5%) was calculated at ground speed of
question of seed corn harvesting. Based on Iranian found a hyperbolic relationship between grain damageagricultural statistic data the annual production of seed and the amount of harvesting ears by corn combines. Hecorn in 2009 was 15,500 tons with the average yield of found a optimum level of the factors in which the
1
[3]. Seed corn is a crop which is used in next cultivation corn picker field tests showed that ground speed andyear and for this reason it is a sensitive crop which should snapping roll adjustment are the most important factors
harvesting was the ideal of farmers. The aim of Based on the researchers’ results, it is concluded thatmechanized harvesting operation is on time harvesting cylinder and travel speed are the most important factorsand threshing with least loss [6]. Two stage harvesting in corn harvesters which can affect on amount of losses.operation by applying picker-husker and sheller is a So, the aim of the present study is to evaluate the effectcommon method for seed corn harvesting. In this of cylinder and ground speed on seed corn losses and toharvesting system, there are some factors that can reduce discover the relationship between two specified factorsthe losses (ground speed, header height of picker-husker and total loss. Also, the optimum conditions for travel andand cylinder speed of sheller) [7]. During harvesting cylinder speed in which total loss is the least, is anotheroperation there are multiple independent variables goal of this study.affecting the other variables. In this situation it isessential to apply an optimization method which can show MATERIALS AND METHODSthe main and interaction effect of all the factors on losses.
Response surface methodology (RSM) has been Experimental Design: There are two major harvestingreported to be an effective tool for optimization of a systems in Iran for harvesting seed corn (one stageprocess when the independent variables have a combined harvesting system by grain combine and two stageeffect on the desired response. RSM is a collection of harvesting system by picker-husker and sheller). In thisstatistical and mathematical system that has been study the amount of harvesting losses of two stagesuccessfully used for developing, improving and harvesting system (two row picker-husker harvesteroptimizing in different systems [8-11]. (Tornado 80) and sheller) was evaluated and modeled. In
Although several studies were done by applying order to determine losses, the experiment was conductedRSM for optimization, there was no related research to the in Seed and Plant Improvement Research Institute (SPIRI)
visible in-field losses of 84 numbers of combines in north variety of harvested seed corn was single cross 704.
1
1
2.28 t ha . Ardabil, Fars and Korasan-Razavi provinces harvested yield is optimal under the given crop conditions_
tones [2]. In this year (2009) in Iran, the average yield of additional 82 kgha visible machine loss and that 65% of_
many agro-technical issues to be solved, among them the 2.23 km h with cylinder speed of 550 rpm. Quick (2003)_
lost or wasted before and after it reaches the consumer generally similar between the 76 and 38cm corn head and
production was approximately 1.6 million tones [3]. [13] made a study on corn combine harvester and
reducing the need to intensify production in the future. head [13]. Morvaridi et al. [14] analyzed the effect of
were the most important producers of seed corn in Iran [15]. In a study which was done by King et al. [16] the
be out of any crack or break. For years, corn mechanized determining picking losses.
current study. In literature, Ayres et al. [12] measured in Alborz Province of Iran in 2010 production year. The
4S W Y
FR =3.6 10
× ×
×
( )iX∆
Iranica J. Energy & Environ., 3 (2): 134-142, 2012
136
All treatments of cylinder speed (400, 500 and 600 rpm) In order to calculate the feed rate Eq.(1) was applied:1
each experimental plots (every plot was 30 m long and 1.5 (1)m width). In order to measure the picker-husker ground
calculated easily. The cylinder speed of sheller was After measuring the amount of losses for gatheringmeasured by Tacho Hi tester (HIOKI 13404) with five and separating harvesting units all values of losses werereplications. summed as total machinery losses.
Determination of Harvesting Losses: Total machinery Mathematical Models and Analysis: The statisticallosses of two stage harvesting system of seed corn was methodologies in different fields of research have beencalculated based on the standard techniques which are used for optimization [20, 21]. The conventional practiceused by several researchers [17-19] with some changes. of varying one factor at a time, maintaining the otherAs it was specified in previous, seed corn is a crop variables influencing the process at a constant level, doesharvested for using in next cultivation year and should be not, in fact, point out the combined effect of all theout of any crack and damage so harvesting of this crop process variables and constitutes a time consumingshould be done precisely. Harvesting losses (machinery methodology [22]. Beside conventional methods responselosses) can be divided into two categories; gathering and surface methodology (RSM) is a collection ofprocessing: mathematical and statistical techniques that can be useful
picker-husker are the seed corn ears and kernels objective is to optimize this response [22]. Therefore, aimwhich are missed by picker head. In order to measure of RSM is exploring an appropriate approximatingthis type of losses a wooden quadrangular frame relationship between the output responses and the input(0.25 m ) was used. All ears and kernels which were variables and determination of the optimum operating2
not gathered by picker-husker head and were fallen conditions for a system under investigation or of a regioninto this frame were collected and weighed. of the factor space within which operating requirements
separating losses which can be seen in sheller was A central composite design (CCD) with two
harvesting. Threshing losses consist of two kinds of speed) at three levels was performed by applying thelosses: (a) seed corn kernels which are attached to Design Expert 8.0.7 software, in order to prepare data forpieces of cobs and are not being threshed by the statistical calculation, the variables were coded as [22];cylinder and (b) the broken and cracked kernels in
were not shaken out of the cobs and husks in shellerand were lost over the back of sheller. Where ‘x ’ and ‘X ’ are the dimensionless and the actual
In order to measure the amount of threshing and of the independent variable ‘i’ at the central point and
husker (in different travel speed) were put in an elevator variation of the dimension less value.to feed the sheller and were shelled. For every experiment By using Eq.(1) the independent variables wereplots the amount of threshing and separating losses was coded and their levels are presented in Table1. calculated and weighed easily. In order to find the amountof broken and damaged kernels (which known as loss)three kernel samples were taken from sheller’s tank inevery experimental plot. The seeds were studied with amagnifier carefully to find any crack in them. Finally, theaverage weight for damage and broken seeds wascalculated.
1
1
1
for modeling and analyzing situations in which a response
i i
values of the independent variable ‘i’, ‘X’ the actual value
i i
Table 1: Independent variable levels
Levels-------------------------------------------------
Independent variable (unit) -1 0 +1
Travel speed (km h-1) 3 4 5Cylinder speed (rpm) 400 500 600
and travel speed (3, 4 and 5 km h ) were allocated to the_
replications to determine the time passed in a 30 m (km h ), W the harvesting width (m) and Y the seed cornpicker’s run and by recording the time, the speed was yield (kg ha ).
speed, a typical chronometer was used with five Where, FR is feed rate (kg s ), S the travel speed_
_
_
1) Gathering losses which can be seen in front of of interest is influenced by several variables and the
2) Processing losses which consist of threshing and are satisfied [23, 24].
separating losses, all ears which were gathered by picker- ‘ X ’ the step change of ‘X ’ corresponding to a unitΔ
Xi-Xtank of sheller. Separating losses are kernels that (2)xi = i = 1, 2, 3
determined in the second stage of seed corn independent variables (X1, travel speed and X2, cylinder
12
0 i i ii 1 ij i j1 1 1 1
Y ß ß X ß X ß X XK K n n
i i i j i
−
= = = = +
= + + +∑ ∑ ∑ ∑
Iranica J. Energy & Environ., 3 (2): 134-142, 2012
137
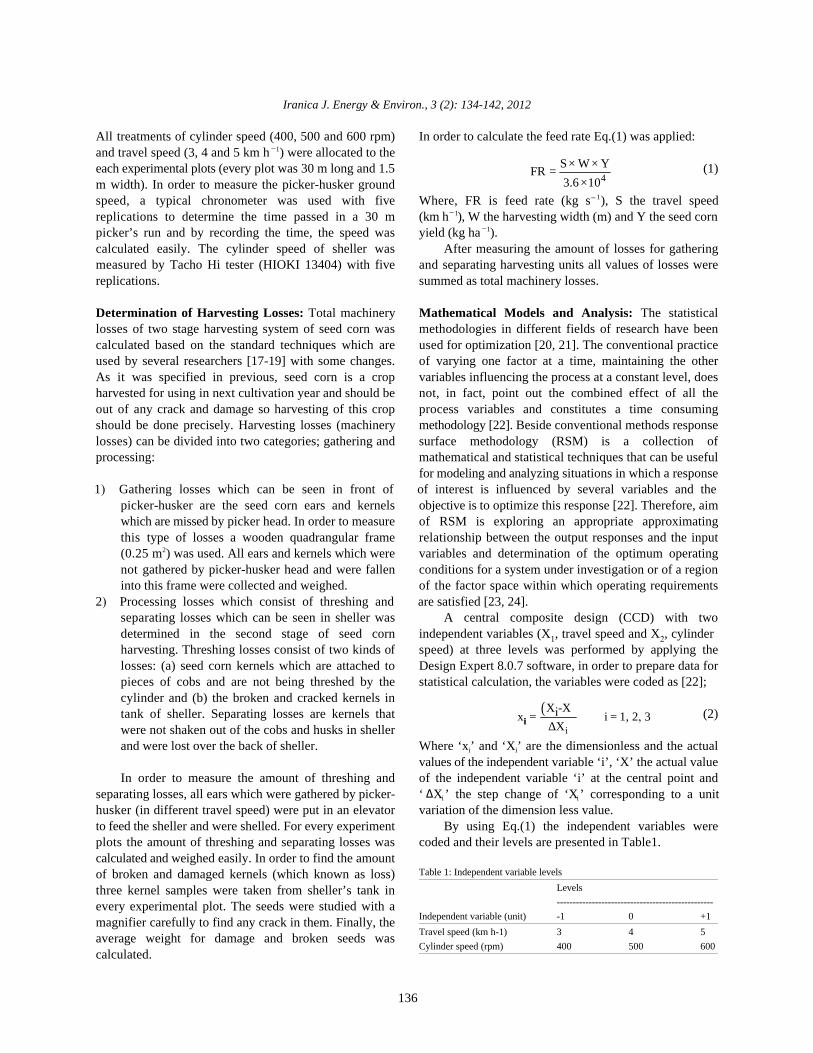
Table 2: The treatment and central composite design arrangement.
Independent variable (unit) Dependent variabale (unit)------------------------------------------------------------------- -----------------------------------------------------------------------
1 1
2 2 3 400 201.2 5.4923 3 4 600 253.2 6.9126 4 4 500 251.3 6.8520 5 4 400 232.4 6.3419 6 4 400 229.3 6.254 7 5 400 246.4 6.7218 8 5 500 269.4 7.3510 9 5 600 274.6 7.4924 10 4 600 245.3 6.6914 11 3 500 199.7 5.4511 12 5 600 291 7.943 13 3 400 215.6 5.881 14 3 400 213.7 5.8321 15 4 400 226 6.166 16 5 400 233.5 6.3725 17 4 500 224.6 6.1316 18 5 500 263.4 7.187 19 3 600 206.5 5.6312 20 5 600 284.1 7.7527 21 4 500 247.4 6.758 22 3 600 208.5 5.6913 23 3 500 227.6 6.2115 24 3 500 204.5 5.5822 25 4 600 244.5 6.6717 26 5 500 247.4 6.759 27 3 600 211.1 5.76
Each independent variable had three levels which of independent variables and the terms ‘X X ’ and ‘X ’were coded as -1, 0 and +1. The experimental design wasa central composite design (CCD) with three replicationsof a factorial point, stars points and center points in atotal of 27 runs. Finally in order to minimize the effects ofunexplained variability in the observed responses (due toextraneous factors) the experiments were randomized [8].The treatments and the total harvesting losses are shownin Table 2.
In order to find the best model, different models werechecked in which general model can be explained byEq.(2) [25]:
(3)
0
i ii
ij
coefficients, ‘k’ is the number of factors studied andoptimized in the experiment, ‘X’, ‘X’ are the coded valuesi j
i j i2
represent the interaction and quadratic terms,respectively.
ANOVA test was applied to evaluate the adequacy(by applying the lack-of-fit test) of different models and toevaluate the statistical significance of the factors inmodel. In order to examine the goodness and evaluate theadequacy of fitted model, coefficient of determination (R )2
was calculated. Design Expert 8.0.7 software wasemployed for the regression analysis and the graphicaloptimization, respectively.
RESULTS AND DISCUSSION
The results of 27 runs using CCD are given inTable 2. As it can be seen the amounts of totallosses for each treatment of parameters were determined.The relationship between these parameters and totalloss was studied. The results indicated that harvesting
with the average percentage of losses of 6.45%.
5 1 5 400 230.6 6.29
Run Experiment No. Cylinder speed (rpm) Travel speed (km h ) Machinery loss (kg ha ) Machinery loss (%)_ _
βwhere ‘Y’ is the dependent response, ‘ ’ is the constant
quadratic coefficients and ‘ ’ is the interactioncoefficient, ‘ ’ is the linear coefficient, ‘ ’ is theβ β
βlosses ranged from 5.45 to 7.94% of total yield
Iranica J. Energy & Environ., 3 (2): 134-142, 2012
138
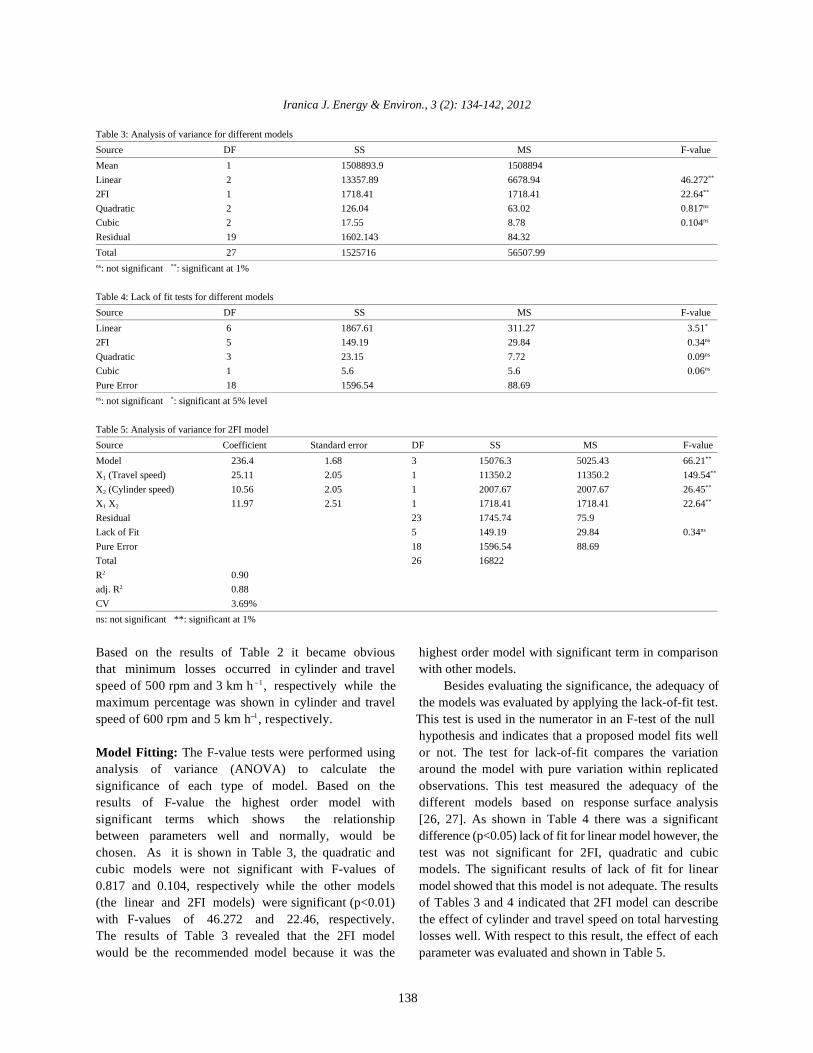
Table 3: Analysis of variance for different models
Source DF SS MS F-value
Mean 1 1508893.9 1508894Linear 2 13357.89 6678.94 46.272**
2FI 1 1718.41 1718.41 22.64**
Quadratic 2 126.04 63.02 0.817ns
Cubic 2 17.55 8.78 0.104ns
Residual 19 1602.143 84.32
Total 27 1525716 56507.99
: not significant : significant at 1%ns **
Table 4: Lack of fit tests for different models
Source DF SS MS F-value
Linear 6 1867.61 311.27 3.51*
2FI 5 149.19 29.84 0.34ns
Quadratic 3 23.15 7.72 0.09ns
Cubic 1 5.6 5.6 0.06ns
Pure Error 18 1596.54 88.69
: not significant : significant at 5% levelns *
Table 5: Analysis of variance for 2FI model
Source Coefficient Standard error DF SS MS F-value
Model 236.4 1.68 3 15076.3 5025.43 66.21**
X (Travel speed) 25.11 2.05 1 11350.2 11350.2 149.541**
X (Cylinder speed) 10.56 2.05 1 2007.67 2007.67 26.452**
X X 11.97 2.51 1 1718.41 1718.41 22.641 2**
Residual 23 1745.74 75.9Lack of Fit 5 149.19 29.84 0.34ns
Pure Error 18 1596.54 88.69Total 26 16822 R 0.902
adj. R 0.882
CV 3.69%
ns: not significant **: significant at 1%
Based on the results of Table 2 it became obvious highest order model with significant term in comparisonthat minimum losses occurred in cylinder and travel with other models.
1
maximum percentage was shown in cylinder and travel the models was evaluated by applying the lack-of-fit test.1
Model Fitting: The F-value tests were performed using or not. The test for lack-of-fit compares the variationanalysis of variance (ANOVA) to calculate the around the model with pure variation within replicatedsignificance of each type of model. Based on the observations. This test measured the adequacy of theresults of F-value the highest order model with different models based on response surface analysissignificant terms which shows the relationship [26, 27]. As shown in Table 4 there was a significantbetween parameters well and normally, would be difference (p<0.05) lack of fit for linear model however, thechosen. As it is shown in Table 3, the quadratic and test was not significant for 2FI, quadratic and cubiccubic models were not significant with F-values of models. The significant results of lack of fit for linear0.817 and 0.104, respectively while the other models model showed that this model is not adequate. The results(the linear and 2FI models) were significant (p<0.01) of Tables 3 and 4 indicated that 2FI model can describewith F-values of 46.272 and 22.46, respectively. the effect of cylinder and travel speed on total harvestingThe results of Table 3 revealed that the 2FI model losses well. With respect to this result, the effect of eachwould be the recommended model because it was the parameter was evaluated and shown in Table 5.
hypothesis and indicates that a proposed model fits well
speed of 500 rpm and 3 km h , respectively while the Besides evaluating the significance, the adequacy of_
speed of 600 rpm and 5 km h , respectively. This test is used in the numerator in an F-test of the null_
Iranica J. Energy & Environ., 3 (2): 134-142, 2012
139
After denoting 2FI as the best model with the highestorder, the independent variables were fitted in thespecified model and the effect of each variable wasevaluated. For this purpose and in order to appraise theadequacy of the fitted model several indicators were used.The coefficient of determination (R ), the adjusted2
determination coefficient (adjusted R ) and coefficient of2
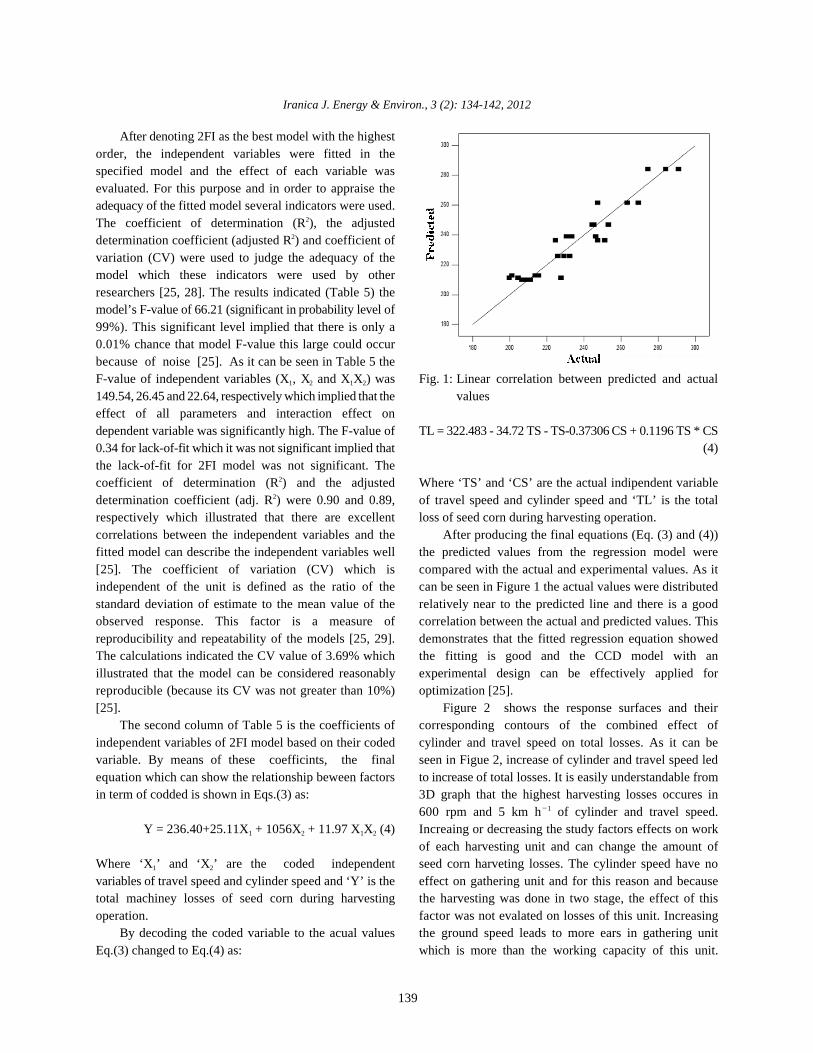
variation (CV) were used to judge the adequacy of themodel which these indicators were used by otherresearchers [25, 28]. The results indicated (Table 5) themodel’s F-value of 66.21 (significant in probability level of99%). This significant level implied that there is only a0.01% chance that model F-value this large could occurbecause of noise [25]. As it can be seen in Table 5 theF-value of independent variables (X , X and X X ) was Fig. 1: Linear correlation between predicted and actual1 2 1 2
149.54, 26.45 and 22.64, respectively which implied that the valueseffect of all parameters and interaction effect ondependent variable was significantly high. The F-value of TL = 322.483 - 34.72 TS - TS-0.37306 CS + 0.1196 TS * CS0.34 for lack-of-fit which it was not significant implied that (4)the lack-of-fit for 2FI model was not significant. Thecoefficient of determination (R ) and the adjusted Where ‘TS’ and ‘CS’ are the actual indipendent variable2
determination coefficient (adj. R ) were 0.90 and 0.89, of travel speed and cylinder speed and ‘TL’ is the total2
respectively which illustrated that there are excellent loss of seed corn during harvesting operation.correlations between the independent variables and the After producing the final equations (Eq. (3) and (4))fitted model can describe the independent variables well the predicted values from the regression model were[25]. The coefficient of variation (CV) which is compared with the actual and experimental values. As itindependent of the unit is defined as the ratio of the can be seen in Figure 1 the actual values were distributedstandard deviation of estimate to the mean value of the relatively near to the predicted line and there is a goodobserved response. This factor is a measure of correlation between the actual and predicted values. Thisreproducibility and repeatability of the models [25, 29]. demonstrates that the fitted regression equation showedThe calculations indicated the CV value of 3.69% which the fitting is good and the CCD model with anillustrated that the model can be considered reasonably experimental design can be effectively applied forreproducible (because its CV was not greater than 10%) optimization [25].
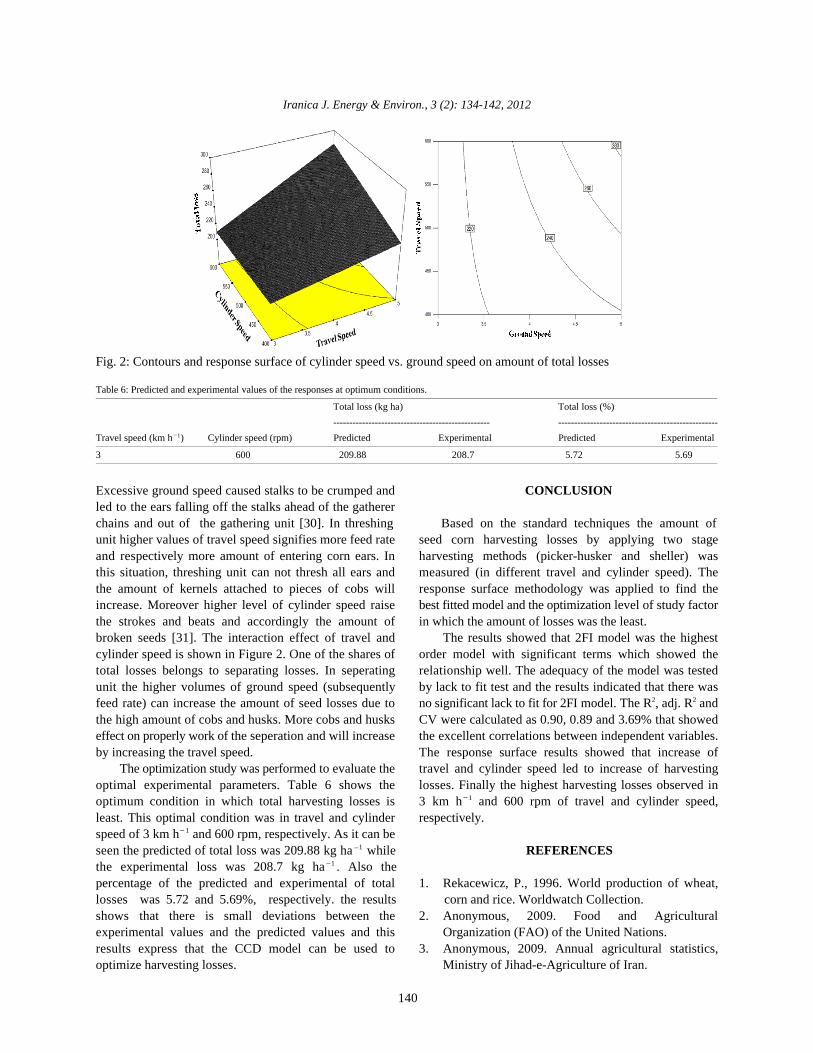
The second column of Table 5 is the coefficients of corresponding contours of the combined effect ofindependent variables of 2FI model based on their coded cylinder and travel speed on total losses. As it can bevariable. By means of these coefficints, the final seen in Figue 2, increase of cylinder and travel speed ledequation which can show the relationship beween factors to increase of total losses. It is easily understandable fromin term of codded is shown in Eqs.(3) as: 3D graph that the highest harvesting losses occures in
Y = 236.40+25.11X + 1056X + 11.97 X X (4) Increaing or decreasing the study factors effects on work1 2 1 2
Where ‘X ’ and ‘X ’ are the coded independent seed corn harveting losses. The cylinder speed have no1 2
variables of travel speed and cylinder speed and ‘Y’ is the effect on gathering unit and for this reason and becausetotal machiney losses of seed corn during harvesting the harvesting was done in two stage, the effect of thisoperation. factor was not evalated on losses of this unit. Increasing
By decoding the coded variable to the acual values the ground speed leads to more ears in gathering unitEq.(3) changed to Eq.(4) as: which is more than the working capacity of this unit.
1
of each harvesting unit and can change the amount of
600 rpm and 5 km h of cylinder and travel speed._
[25]. Figure 2 shows the response surfaces and their
Iranica J. Energy & Environ., 3 (2): 134-142, 2012
140
Fig. 2: Contours and response surface of cylinder speed vs. ground speed on amount of total losses
Table 6: Predicted and experimental values of the responses at optimum conditions.
Total loss (kg ha) Total loss (%)
------------------------------------------------- --------------------------------------------------1
3 600 209.88 208.7 5.72 5.69
Excessive ground speed caused stalks to be crumped and CONCLUSIONled to the ears falling off the stalks ahead of the gatherer
unit higher values of travel speed signifies more feed rate seed corn harvesting losses by applying two stageand respectively more amount of entering corn ears. In harvesting methods (picker-husker and sheller) wasthis situation, threshing unit can not thresh all ears and measured (in different travel and cylinder speed). Thethe amount of kernels attached to pieces of cobs will response surface methodology was applied to find theincrease. Moreover higher level of cylinder speed raise best fitted model and the optimization level of study factorthe strokes and beats and accordingly the amount of in which the amount of losses was the least. broken seeds [31]. The interaction effect of travel and The results showed that 2FI model was the highestcylinder speed is shown in Figure 2. One of the shares of order model with significant terms which showed thetotal losses belongs to separating losses. In seperating relationship well. The adequacy of the model was testedunit the higher volumes of ground speed (subsequently by lack to fit test and the results indicated that there wasfeed rate) can increase the amount of seed losses due to no significant lack to fit for 2FI model. The R , adj. R andthe high amount of cobs and husks. More cobs and husks CV were calculated as 0.90, 0.89 and 3.69% that showedeffect on properly work of the seperation and will increase the excellent correlations between independent variables.by increasing the travel speed. The response surface results showed that increase of
The optimization study was performed to evaluate the travel and cylinder speed led to increase of harvestingoptimal experimental parameters. Table 6 shows the losses. Finally the highest harvesting losses observed in
least. This optimal condition was in travel and cylinder respectively.1
1
1
percentage of the predicted and experimental of total 1. Rekacewicz, P., 1996. World production of wheat,
shows that there is small deviations between the 2. Anonymous, 2009. Food and Agriculturalexperimental values and the predicted values and this Organization (FAO) of the United Nations. results express that the CCD model can be used to 3. Anonymous, 2009. Annual agricultural statistics,optimize harvesting losses. Ministry of Jihad-e-Agriculture of Iran.
2 2
1
_speed of 3 km h and 600 rpm, respectively. As it can beseen the predicted of total loss was 209.88 kg ha while REFERENCES_
the experimental loss was 208.7 kg ha . Also the_
optimum condition in which total harvesting losses is 3 km h and 600 rpm of travel and cylinder speed,_
Travel speed (km h ) Cylinder speed (rpm) Predicted Experimental Predicted Experimental_
chains and out of the gathering unit [30]. In threshing Based on the standard techniques the amount of
losses was 5.72 and 5.69%, respectively. the results corn and rice. Worldwatch Collection.
Iranica J. Energy & Environ., 3 (2): 134-142, 2012
141
4. Lundqvist, J.C.D. and D. Molden, 2008. Saving water: 15. Quick, G.R., 2003. Combine sweet spot: integratingfrom ?eld to fork-curbing losses and wastage in the harvested yield, grain damage and losses.food chain. In SIWI Policy Brief. Stockholm, Sweden: International Conference on Crop Harvesting andSIWI2008. Processing. Louisville, Kentucky USA: American
5. Parfitt, J., M. Barthel and S. Macnaughton, 2010. Society of Agricultural and Biological Engineers.Food waste within food supply chains: quantification 16. King, W.N., L. Peterson and R.G. Curley, 1995.and potential for change to 2050. Phil Trans R Soc B, Field Corn Pickers, California Agriculture.365: 3065-81.doi:10.1098/rstb.2010.0126. 17. Hanna, M. and L.V. Fossen, 1990. Profitable
6. Srivastava, A.K., W.T. Mahoney and N.L. West, Corn Harvesting, Iowa State University Extention,1990. The effect of crop properties on combine PM-574.performance, Transactions of the ASABE, 33: 63-72. 18. Huitink, G., 2008. Corn Production Handbook.
7. Digman, M., 2009. Combine Considerations for a Wet Cooperative Extension Service, University ofCorn Harvest, University of Wisconsin-Extension. Arkansas, pp: 65-66.
8. Koocheki, A., A. Taherian, S.M.A. Razavi and 19. Sumner, P.E. and E.J. Williams, 2009. Measuring FieldA. Bostan, 2009. Response surface methodology for Losses from Grain Combines, The University ofoptimization of extraction yield, viscosity, hue and Georgia cooperative Extension, pp: 973.emulsion stability of mucilage extracted from 20. DeFaveri, D., P. Torre, P. Perego and A. Converti,Lepidium perfoliatum seeds, Food Hydrocolloids, 2004. Statistical investigation on the effects of23: 2369-79. starting xylose concentration and oxygen mass flow
9. Bostan, A. and S.M.A. Razavi, 2008. Optimization of rate on xylitol production from rice straw hydrolyzateextraction process of crude hydrocolloid from Wild by response surface methodology, Journal of Foodsage seed (Salvia macrosiphon) and evaluation of its Engineering, 65(3): 383-9.time-independent rheological properties: M.Sc. 21. Roberto, I.C., S.I. Mussatto and R.C.L.B. Rodrigues,thesis. Ferdowsi University of Mashhad, Iran. 2003. Dilute-acid hydrolysis for optimization of xylose
10. Cui, W., G. Mazza, B.D. Oomah and C.G. Billiaderis, recovery from rice straw in a semi-pilot reactor,1994. Optimization of an aqueous extraction process Industrial Crops and Products, 17(3): 171-6.for flax seed gum by response surface 22. Sampaio, F.C., D. DeFaveri, H.C. Mantovani,methodology, Lebensmittel-Wissenschaftund- F.M.L. Passos, P. Perego and A. Converti, 2006.Technologie, 27: 363-9. Use of response surface methodology for
11. Wu, Y., S.W. Cui, J. Tang and X. Gu, 2007. optimization of xylitol production by the new yeastOptimization of extraction process of crude strain Debaryomyces hansenii UFV-170, Journal ofpolysaccharides from boat-fruited sterculia seeds by Food Engineering, 76: 376-86.response surface methodology, Food Chemistry, 23. Liu, H., K. Wang, P. Li, C. Zhang, D. Du and Y. Hu,105: 1599-605. 2012. Modeling and prediction of transmission laser
12. Ayres, G.E., C.E. Babcock and D.O. 1972. Hull Corn bonding process between titanium coated glass andcombine field performance in Iowa, Grain Damage PET based on response surface methodology, OpticsSymposium, Columbus, Ohio: The Ohio State and Lasers in Engineering, 50: 440-8.University. 24. Montgomery, D.C., 2001. Design and analysis of
13. Hanna, H.M., K.D. Kohl and D.A. Haden, 2002. experiments. 6 ed. New York, Wiley.Machine losses from conventional versus narrow 25. Chen, G., J. Chen, C. Srinivasakannan and J. Peng,row corn harvest, American Society of Agricultural 2011. Application of response surface methodologyand Biological Engineers, 18: 405-9. for optimization of the synthesis of synthetic rutile
14. Morvaridi, N., M.A. Asoodar, N. Khademalhosseini, from titania slag, Applied SurfaceH. Shamsi, M.G. Nezhad and P. Amirpoor, 2008. Science.;doi:10.1016/j.apsusc.2011.11.039.Evaluation of losses on corn combine harvester and 26. Lee, W.C., S. Yusof, N.S.A. Hamid and B.S. Baharin,introducing an optimum pattern under Khouzistan 2006. Optimizing conditions for hot watere xtractionprovince climate condition, 5th National Conference of banana juice using response surface methodologyon Agr Machinary Engineering and Mechanization, (RSM), Journal of Food Engineering, 75: 473-9.Ferdowsi University of Mashhad, Iran. 27. Anonymous, 2011. SAS/STAT User's Guide.
th
Iranica J. Energy & Environ., 3 (2): 134-142, 2012
142
28. Wang, S., F. Chen, J. Wu, Z. Wang, X. Liao and 30. Griffin, G.A., Combine Harvesting, fundamentals ofX. Hu, 2007. Optimization of pectine xtraction machine operation (FMO). third ed1987.assisted by microwave from apple pomace using 31. Sheikh Davoodi, M.J. and E. Houshyar, 2010.response surface methodology, Journal of Food Evaluation of wheat losses using New HollandEngineering, 78: 693-700. combine harvester in Iran, American-Eurasian Journal
29. Chen, G., K. Xiong, J. Peng and J. Chen, 2010. of Agriculture & Environment Science, 8: 104-8.Optimization of combined mechanical activation-roasting parameters of titania slag using responsesurface methodology, Advanced PowderTechnology, 21(3): 331-5.