application of silver nanoparticles in drinking water
TRANSCRIPT

University of Rhode Island University of Rhode Island
DigitalCommons@URI DigitalCommons@URI
Open Access Dissertations
2013
Application of Silver Nanoparticles in Drinking Water Purification Application of Silver Nanoparticles in Drinking Water Purification
Hongyin Zhang University of Rhode Island, [email protected]
Follow this and additional works at: https://digitalcommons.uri.edu/oa_diss
Recommended Citation Recommended Citation Zhang, Hongyin, "Application of Silver Nanoparticles in Drinking Water Purification" (2013). Open Access Dissertations. Paper 29. https://digitalcommons.uri.edu/oa_diss/29
This Dissertation is brought to you for free and open access by DigitalCommons@URI. It has been accepted for inclusion in Open Access Dissertations by an authorized administrator of DigitalCommons@URI. For more information, please contact [email protected].

APPLICATION OF SILVER NANOPARTICLES IN
DRINKING WATER PURIFICATION
BY
HONGYIN ZHANG
A DISSERTATION SUBMITTED IN PARTIAL FULFILLMENT OF THE
REQUIREMENTS FOR THE DEGREE OF
DOCTOR OF PHILOSOPHY
IN
CIVIL AND ENVIRONMENTAL ENGINEERING
UNIVERSITY OF RHODE ISLAND
2013

DOCTOR OF PHILOSOPHY
OF
HONGYIN ZHANG
APPROVED:
Thesis Committee:
Major Professor Vinka Oyanedel-Craver
Leon Thiem
Thomas Boving
Geoffrey Bothun
Aaron Bradshaw
Nasser H. Zawia
DEAN OF THE GRADUATE SCHOOL
UNIVERSITY OF RHODE ISLAND
2013

ABSTRACT
Nanotechnology is an emerging and fast-growing technology. Currently, there are
more than 1,317 nanotechnology-based products on the market. Silver nanoparticles
account for more than 23% of all nano-products. The extensive application of the
silver nanoparticle (AgNP) results in their inevitable release into the environment.
Silver nanoparticles are known as excellent antimicrobial agents, and therefore they
could be used as alternative disinfectant agents. On the other hand, released silver
nanoparticles could pose a threat to naturally occurring microorganisms.
In Chapter 1, we introduce the background information on the environmental fate,
toxicological effects, and application of AgNP and review the current knowledge on
the physicochemical and antimicrobial properties of AgNP in different aqueous
solutions, as well as their application as alternative disinfectants in water-treatment
systems.
In Chapter 2 of this dissertation, we discuss the evaluation of AgNP’s
antimicrobial properties at different water chemistry conditions. It was found that the
aggregation of silver nanoparticles depends on the properties of the background ions,
such as Na+ and Ca
2+, at different water chemistry conditions. Divalent cations can
significantly enhance the aggregation, while monovalent cations and anions do not
have such a significant influence. A saturation-type fitting curve was established,
showing the survival of bacteria under different water chemistry conditions as a
function of the size of the nanoparticles.
In Chapter 3, we talk about the evaluation of the antimicrobial properties of
AgNP when coated with different organic compounds using natural water conditions.

The results obtained showed that silver nanoparticles in surface water, ground water,
and brackish water are stable. However, in seawater conditions, AgNP tend to
aggregate. This study also shows that the antimicrobial activity of AgNP can be
impaired by the presence of a humic substance and high concentrations of divalent
cations. These results are helpful in explaining how discharged AgNP behave in
natural aquatic systems as well as their environmental toxicological effects on
naturally occurring microorganisms.
In Chapter 4, we discuss the investigation of the effect of silver nanoparticles on a
model virus-MS2 bacteriophage. A negligible deactivation effect on MS2 phage was
found regardless of the type of AgNP and the water chemistry conditions used.
In Chapter 5, we talk about the comparison of AgNP-impregnated point-of-use
ceramic water filters and ceramic filters impregnated with silver nitrate. This study
was performed using different water chemistry conditions and different manufacturing
materials. The results showed that AgNP-impregnated ceramic water filters are more
appropriate for this application due to the lesser amount of silver desorbed compared
with silver nitrate-treated filters. The bacterial removal performance of the silver-
treated ceramic filters and concentration of viable bacteria in the filters are dose-
dependent on the amount of silver applied. However, the data showed that influent
water chemistry conditions did not have a significant effect on the performance of the
filters. This study established evidence-based silver application guidelines for the
ceramic water filter manufacturers around the world.
In Chapter 6, the discussion centers in the comparison of a polymer-based
quaternary amine functionalized silsesquioxanes compound and AgNP. The results

showed that the quaternary ammonium functionalized silsesquioxanes-treated ceramic
water filter desorbed less from the filters and achieved higher bacteria removal than
the filters impregnated with AgNP. This indicates that the quaternary ammonium
functionalized silsesquioxanes compound could be considered as a substitute for silver
nanoparticles due to its lower price and higher performance. However, more
information regarding the possible chronic health effects of the silsesquioxanes
compound is needed.
In Chapter 7, we present the main conclusions and recommended future work
based on the dissertation results.

v
ACKNOWLEDGMENTS
I would like to first thank Dr. Vinka Oyanedel-Craver for her inculcation over the
last four years. She has endowed me with valuable knowledge that will benefit me
throughout my life. She also set up an example with meticulous spirit and enthusiasm
to explore. I would also like to express my thanks to Dr. Geoffrey Bothun for his
useful suggestions, advices, and his permission to access to the instruments in his
laboratory. Dr. Thomas Boving and Dr. Thiem have provided constructive advices and
conferred the very helpful knowledge in the environmental field. I would like to thank
Dr. Aaron Bradshaw for his commitment to the Dissertation committee and his
valuable comments and suggestions.
My thanks also go to my family. Thanks to my parents who supported me in my
overseas life. I am also very grateful to my lovely wife, who always encourages me to
go forward.
vi
PREFACE
This dissertation is in manuscript format.
Chapter 2 was originally published by H. Zhang and V. Oyanedel-Craver,
Journal of Environmental Engineering 138 (1) (2012) 58-66.
Chapter 3 was published by H. Zhang, J. Smith, and V. Oyanedel-Craver, Water
Research (2012) 691-699. In addition to the published manuscript text, supplementary
text and figures have been included.
Chapter 4 is a manuscript in preparation to be submitted by H. Zhang and V.
Oyanedel-Craver to Water Research.
Chapter 5 was submitted for publication in ACS Sustainable Chemistry and
Engineering by J. Rayner, H. Zhang, D. Lantagne, J. Schubert, P. Lennon, and V.
Oyanedel-Craver. In addition to the published manuscript text, supplementary text and
figures have been included.
Chapter 6 was submitted for publication in Journal of Hazardous Materials by H.
Zhang and V. Oyanedel-Craver.

vii
TABLE OF CONTENTS
ABSTRACT .................................................................................................................. ii
ACKNOWLEDGMENTS ........................................................................................... v
PREFACE .................................................................................................................... vi
TABLE OF CONTENTS ........................................................................................... vii
LIST OF TABLES ..................................................................................................... xii
LIST OF FIGURES .................................................................................................. xiii
CHAPTER 1 ................................................................................................................. 1
INTRODUCTION ................................................................................................ 1
1 AgNP synthesis .................................................................................................. 1
2 Environmental fate and antimicrobial property of AgNP in different water
chemistry conditions ............................................................................................. 2
2.1 Aggregation behavior of AgNP in different water chemistry conditions .... 2
2.2 Dissolution of AgNP in different water chemistry conditions ..................... 6
2.3 Antimicrobial property of AgNP in different water chemistry conditions 8
3 Application of AgNP in drinking water purification ....................................... 11
4 Dissertation objectives ..................................................................................... 16
5 Dissertation overview....................................................................................... 17
CHAPTER 2 ............................................................................................................... 29
EVALUATION OF THE DISINFECTANT PERFORMANCE OF SILVER
NANOPARTICLES IN DIFFERENT WATER CHEMISTRY CONDITIONS 29
1 Abstract ............................................................................................................ 30

viii
2 Introduction ...................................................................................................... 30
3 Materials and methods ..................................................................................... 32
3.1 Synthetic water solutions ........................................................................... 32
3.2 Preparation and characterization of AgNP ................................................. 32
3.3 Microbial culture ........................................................................................ 34
3.4 Antibacterial assay ..................................................................................... 35
3.5 Data analysis .............................................................................................. 37
4 Results .............................................................................................................. 38
5 Disscussion ....................................................................................................... 45
CHAPTER 3 ............................................................................................................... 56
THE EFFECT OF NATURAL WATER CONDITIONS ON THE ANTI-
BACTERIAL PERFORMANCE AND STABILITY OF SILVER
NANOPARTICLES CAPPED WITH DIFFERENT POLYMERS ................... 56
1 Abstract ............................................................................................................ 57
2 Introduction ...................................................................................................... 58
3 Materials and methods ..................................................................................... 59
4 Results and discussion ..................................................................................... 62
4.1 Characterization of AgNP .......................................................................... 62
4.2 Effect of different water conditions on the characteristics of the AgNP ... 63
4.3 ζ-potentials of AgNP and E. coli in different water conditions ................. 66
4.4 Silver ion release in different water conditions.......................................... 68
4.5 Effect of different water conditions on the disinfection performance of
AgNP ................................................................................................................... 71
ix
5 Conclusion ....................................................................................................... 75
CHAPTER 4 ............................................................................................................... 80
ANTIVIRAL EFFECT OF SILVER NANOPARTICLES IN DIFFERENT
WATER CHEMISTRY CONDITIONS ............................................................. 80
1 Abstract ............................................................................................................ 81
2 Introduction ...................................................................................................... 81
3 Materials and methods ..................................................................................... 83
3.1 MS2 bacteriophage preparation ................................................................. 83
3.2 Synthetic water solutions preparation ........................................................ 84
3.3 AgNP preparation and characterization ..................................................... 84
3.4 Bacteriophage inactivation by AgNP ......................................................... 85
3.5 Particle size, aggregation kinetics, and zeta potential measurement ......... 85
3.6 Silver ion release experiment ..................................................................... 86
4 Results and discussion ..................................................................................... 86
4.1 Effect of different water chemistry conditions on the physicochemical
characteristics of the AgNP and MS2 phage ...................................................... 86
4.2 Dissolution of AgNP in different water conditions.................................... 95
4.3 Antiviral effect of AgNP in various water conditions ............................... 96
5 Conclusion ..................................................................................................... 100
CHAPTER 5 ............................................................................................................. 104
EFFECT OF SILVER ON THE BACTERIAL REMOVAL EFFICACY OF
LOCALLY-PRODUCED CERAMIC WATER FILTERS .............................. 104

x
1 Abstract .......................................................................................................... 105
2 Introduction .................................................................................................... 105
3 Experimental .................................................................................................. 108
3.1 Disk manufacturing and pretreatment ...................................................... 108
3.2 Disk characterization ................................................................................ 109
3.3 Silver release and retention ...................................................................... 109
3.4 Bacterial removal performance ................................................................ 110
3.5 Bacterial retention .................................................................................... 111
4 Results ............................................................................................................ 111
4.1 Disks characterization .............................................................................. 111
4.2 Phase I ...................................................................................................... 112
4.3 Phase II ..................................................................................................... 117
5 Discussion and recommendations .................................................................. 118
CHAPTER 6 ............................................................................................................. 128
COMPARISON OF THE BACTERIAL REMOVAL PERFORMANCE OF
POINT-OF-USE CERAMIC WATER FILTERS IMPREGNATED WITH
SILVER NANOPARTICLES AND POLYMER-BASED QUATERNARY
AMMONIA FUNCTIONALIZED SILANE COMPOUND AS ALTERNATIVE
DISINFECTANT .............................................................................................. 128
1 Abstract .......................................................................................................... 129
2 Introduction .................................................................................................... 130
3 Materials and methods ................................................................................... 132
3.1 Ceramic disks manufacturing ................................................................... 132

xi
3.2 Preparation and characterization of AgNP and TPA ............................... 133
3.3 Microbial culture ...................................................................................... 133
3.4 Evaluation of the antibacterial activity .................................................... 133
3.5 Tracer and bacterial transport experiments .............................................. 134
4 Results and discussion ................................................................................... 135
4.1 Characterization of manufactured ceramic and the disinfectants ............ 135
4.2 Bulk antimicrobial activity of AgNP and TPA ........................................ 138
4.3 Tracer and bacterial tranport .................................................................... 141
4.4 AgNP and TPA concnetration in effluent water ...................................... 145
5 Conclusion ..................................................................................................... 147
CHAPTER 7 ............................................................................................................. 153
CONCLUSION AND FUTURE WORK ......................................................... 153
7.1 Conclusion ............................................................................................... 153
7.2 Future work .............................................................................................. 154
APPENDICES .......................................................................................................... 156

xii
LIST OF TABLES
TABLE PAGE
Table 1-1. Recent studies investigated AgNP aggregation. .......................................... 6
Table 1-2. Summary of pathogen removal performance of silver coated CWFs
manufactured with different clay materials ................................................................ 13
Table 2-1. F and P values obtain from linear regression analysis with a dummy
variable to compare survival rate of E. coli in different water chemistry conditions;
P<0.05 indicating significant difference ..................................................................... 47
Table 2-2. F and P values obtain from linear regression analysis with a dummy
variable to compare particle sizes of AgNP in different water chemistry conditions;
P<0.05 indicating significant difference ..................................................................... 48
Table 4-1. Dissolution of AgNP in different water chemistry conditions .................. 95
Table 5-1. Experimental conditions .......................................................................... 110
Table 6-1.Parameters of tracer and bacteria transport experiment and the percentages
of total bacterial removal .......................................................................................... 141
Table 6-2. Total release and percentage of AgNP and TPA retained in the CWFs .. 145
Table 6-3. Some toxicological parameters of silver and TPA .................................. 146
xiii
LIST OF FIGURES
FIGURE PAGE
Figure 1-1. Aggregation kinetics of AgNP in different concentrations of NaCl
solution. ......................................................................................................................... 4
Figure 1-2. Schematic illustration of dissolution of the oxide layer coated AgNP....... 7
Figure 1-3. Mechanisms of interaction between AgNP and bacterial cells. ................. 8
Figure 1-4. Bacteria trapped in CWF impregnated with AgNP or Ag+ ...................... 12
Figure 1-5. Price of silver per ounce during the last 5 years....................................... 12
Figure 2-1. TEM image of AgNP (line=200 nm) ....................................................... 34
Figure 2-2. A typical respiration curve after 20 h incubation at 25 0C with glucose
injection: 35 mg and AgNP concentration: 11.5 mg/L. P: Oxygen uptake rate during
endogenous respiration; Pc: Oxygen uptake rate after the injection of glucose; Pt:
Oxygen uptake rate after injection of AgNP ............................................................... 37
Figure 2-3. Plot of viability of E. coli cells in the presence of AgNP in (a) salts
solutions, (b) HA solutions. Incubation time: 20h, temperature: 25 oC, AgNP
concentration in each sample: 11.5 mg/L. The concentrations of the ions are listed in
Table A-1. It is clear that Ca2+
and Mg2+
increase the survival rate of E. coli ........... 39
Figure 2-4. Plot of hydrodynamic particle sizes of AgNP in different water chemistry
conditions. (a) Hydrodynamic particle sizes in salts solutions. (b) Hydrodynamic
particle sizes in HA solutions. Incubation time: 20h, temperature: 25 oC, AgNP
concentration in each sample: 11.5 mg/L. The concentrations of the ions are listed in
Table A-1 .................................................................................................................... 40
xiv
Figure 2-5. Plot of ξ-potential of AgNP in (a) salts solutions, (b) HA solutions.
Incubation time: 20h, temperature: 25 oC, AgNP concentration in each sample: 11.5
mg/L. The concentrations of the ions are listed in Table A-1 ..................................... 42
Figure 2-6. Plot of ξ-potential of E. coli in (a) salts solutions, (b) HA solutions.
Incubation time: 20h, temperature: 25 oC, E. coli concentration: 10
9 CFU. The
concentrations of the ions are listed in Table A-1....................................................... 43
Figure 2-7. Silver ionic release in (a) salts solutions, (b) HA solutions. Incubation
time: 20h, temperature: 25 oC, AgNP concentration in each sample: 11.5 mg/L. The
concentrations of the ions are listed in Table A-1....................................................... 44
Figure 2-8.The survival rate of E. coli as a function of hydrodynamic particle sizes.
The curve line is the least-squares fitted to the data collected. Coefficient ymax is the
predicted maximum survival rate of E. coli, where ymax=21.0 and its standard error is
1.04. Coefficient km is the calculated value of particle size at which the survival rate of
E. coli is half of its maximum value, where km=114.6 and its standard error is 13.8.
The adjusted R2 for the fitted line reached 0.87 .......................................................... 46
Figure 3-1. Flowchart of the major techniques used in this study .............................. 62
Figure 3-2. Plot of hydrodynamic particle sizes of all three AgNP in different water
conditions. Incubation time: 20h, temperature: 25 oC, AgNP concentration in each
sample: 11.5 mg/L. Labels on the x axis: DI (DI water), ground (ground water
obtained in University of Rhode Island), surface (Thirty Acre pond water), Brackish
(Brackish water in Card ponds), Sea (Seawater), Mg2+
(1,000 mg/L as Mg2+
in MgCl2
solution), Ca2+
(1,000 mg/L as Ca2+
in CaCl2 solution), Na+ (1,000 mg/L as Na
+ in
NaCl solution), HA (TOC=5 mg/L humic acid solution) ........................................... 65

xv
Figure 3-3. Attachment efficiencies of AgNP in different water conditions. (a)
Attachment efficiencies of AgNP in different concentrations of CaCl2 solutions in the
absence and presence of HA. CaCl2 concentrations: 100-8,000 mg/L; Humic acid
concentration: 5 mg/L as TOC. (b) Attachment efficiencies of AgNP in different
concentrations of NaCl solutions in the absence and presence of HA. Na+
concentrations: 4,000-80,000 mg/L; Humic acid concentration: 5 mg/L as TOC. AgNP
concentration in all water conditions: 11.5 mg/L........................................................ 66
Figure 3-4. Plot of ξ-potential of AgNP (a) and E. coli (b) in the different water
conditions. Incubation time: 20h, temperature: 25 oC, AgNP concentration in (a): 11.5
mg/L. E. coli concentration in (b): 1010
CFU/ml. The concentrations of the ions are
listed in Table S1. Labels on the x axis: DI (DI water), ground (ground water obtained
in University of Rhode Island), surface (Thirty Acre pond water), Brackish (Brackish
water in Card ponds), Sea (Seawater), Mg2+
(1,000 mg/L as Mg2+
in MgCl2 solution),
Ca2+
(1,000 mg/L as Ca2+
in CaCl2 solution), Na+ (1,000 mg/L as Na
+ in NaCl
solution), HA (TOC=5 mg/L humic acid solution) ..................................................... 68
Figure 3-5. Silver ionic release in different water conditions. Incubation time: 20h,
temperature: 25 oC, AgNP concentration in each sample: 11.5 mg/L. Labels on the x
axis: DI (DI water), ground (ground water obtained in University of Rhode Island),
surface (Thirty Acre pond water), Brackish (Brackish water in Card ponds), Sea
(Seawater), Mg2+
(1,000 mg/L as Mg2+
in MgCl2 solution), Ca2+
(1,000 mg/L as Ca2+
in CaCl2 solution), Na+ (1,000 mg/L as Na
+ in NaCl solution), HA (TOC=5 mg/L
humic acid solution) .................................................................................................... 71
Figure 3-6. Plot of disinfection performance of AgNP stabilized with casein, dextrin

xvi
and PVP in collected water samples and synthetic waters. Incubation time: 20h,
temperature: 25 oC, AgNP concentration in each sample: 11.5 mg/L. Labels on the x
axis: DI (DI water), ground (ground water obtained in University of Rhode Island),
surface (Thirty Acre pond water), Brackish (Brackish water in Card ponds), Sea
(Seawater), Mg2+
(1,000 mg/L as Mg2+
in MgCl2 solution), Ca2+
(1,000 mg/L as Ca2+
in CaCl2 solution), Na+ (1,000 mg/L as Na
+ in NaCl solution), HA (TOC=5 mg/L
humic acid solution) .................................................................................................... 74
Figure 4-1 Particle size of AgNP and MS2 bacteriophage in different water conditions:
(a) AgNP in synthetic aqueous solutions; (b) AgNP in natural water conditions; (c)
MS2 bacteriophage in synthetic aqueous solutions; (d) MS2 bacteriophage in natural
water conditions .......................................................................................................... 88
Figure 4-2 Aggregation rates of AgNP and MS2 bacteriophage in different water
conditions: (a) AgNP in synthetic aqueous solutions; (b) AgNP in natural water
conditions; (c) MS2 bacteriophage in synthetic aqueous solutions; (d) MS2
bacteriophage in natural water conditions................................................................... 90
Figure 4-3 Zeta potential of AgNP and MS2 bacteriophage in different water
conditions: (a) AgNP in synthetic aqueous solutions; (b) AgNP in natural water
conditions; (c) MS2 bacteriophage in synthetic aqueous solutions; (d) MS2
bacteriophage in natural water conditions................................................................... 93
Figure 4-4 Survival of MS2 bacteriophage in various water conditions after treatment
with AgNP for 2-h. (AgNP concentration: 1 mg/L) ................................................... 99
Figure 5-1 Concentration of silver in effluent from disks manufactured with
Indonesian (a), Tanzanian (b), or Nicaraguan (c) clay and sawdust, coated with
xvii
different concentrations (mg/g) of either AgNP or Ag+ (horizontal line at 1.E+02
represents USEPA MCL for silver) .......................................................................... 114
Figure 5-2 Percent silver retention in disks manufactured with different clays and
sawdust coated with different species of silver of varying concentrations (mg/g) ... 115
Figure 5-3 LRV of disks manufactured from Indonesian (a), Tanzanian (b), and
Nicaraguan (c) clay and sawdust coated with varying amounts (mg/g) of either AgNP
or Ag+. Vertical lines indicate the 5
th day of operation ............................................. 116
Figure 5-4 Viable bacteria detected in disks manufactured with sawdust coated with
varying amounts of AgNP (a) or Ag+ (b) .................................................................. 117
Figure 6-1 SEM analysis of the manufactured ceramic using back scattered mode (a)
and secondary electron mode (b) .............................................................................. 137
Figure 6-2 Disinfection performances of AgNP and TPA in 10% PBS; Duration: 20 h
................................................................................................................................... 140
Figure 6-3 (a) Effluent NaCl concentrations normalized to the influent pulse
concentration as a function of time for CWF. (b) Effluent E. coli concentrations
normalized to the influent pulse concentration as a function of time for CWF
with/without painting AgNP. (c) Effluent E. coli concentrations normalized to the
influent pulse concentration as a function of time for CWF with/without painting TPA.
Inflow condition: 10% PBS; Solid circles: normalized NaCl concentration; Solid
squares: normalized E. coli concentration using CWFs; Empty squares: normalized E.
coli concentration using AgNP painted CWF; Empty circles: normalized E. coli
concentration using TPA painted CWF; Lines: optimized solute-transport modeling
fits .............................................................................................................................. 144
xviii
Figure 6-4 Concentrations of total silver and total TPA in the effluent water during
300 min.Inflow condition: 10% PBS; Original concentration of AgNP or TPA in
CWFs: 0.03 mg/g ...................................................................................................... 147

1
CHAPTER 1
INTRODUCTION
Nanoparticles are defined as small particles sized between 1 to 100 nanometers in
at least one dimension. Currently there are more than 1,317 nanotechnology-based
consumer products according to an analysis by Nanotechproject.com [1]. Compared to
their counterparts in bulk states, manufactured nanomaterials have the merits of better
adjustable electronic properties, better tunable optical properties, and higher reactivity.
Among all the nano-products, 313 products (23%) are impregnated with nano-sized
silver. Silver nanoparticles (AgNP) are used in a wide range of applications, including
pharmaceuticals, cosmetics, medical devices, foodware, clothing and water
purification, among others uses, due to their antimicrobial properties [2].
1 AgNP synthesis
AgNP can be prepared by various methods including chemical reduction,
electrochemical techniques, and photochemical reduction [3]. Among all the synthetic
methods, chemical reduction is most commonly used. However, toxic compounds
such as borohydride are usually involved. Studies have focused on ―green‖ synthesis
approaches to avoid using hazardous materials. The Tollens method is widely applied
for AgNP synthesis. Environmentally benign monosaccharides and polysaccharides
are used to reduce the Ag(NH3)2+ complex formed by reacting AgNO3 with ammonia
to AgNP. Previous studies have produced AgNP with sizes ranging from 50-200 nm
and silver hydrosols ranging from 20-50 nm [4-6]. Panacek et al. [4] synthesized
AgNP by reduction of the Ag(NH3)2+ complex with two monosaccharides, glucose

2
and galactose, and two disaccharides, maltose and lactose, and found the average
particle size ranged from 25 to 450 nm at various ammonia concentrations (0.005-0.2
M) and pH conditions (11.5-13.0) [4].
Aggregation during synthesis can hinder the production of AgNP with small and
uniform sizes. For antimicrobial purposes, formation of aggregates can reduce the
antimicrobial ability of AgNP [7-9]. Stabilizers are incorporated in the AgNP
manufacturing process to ensure their stability in aqueous solutions. Absorption of the
stabilizing molecules onto the nanoparticle surface depends on the molecular weight,
ionization, and charge density of the stabilizing molecules [3, 4, 10, 11]. Stabilizing
layers can increase the electrostatic and steric repulsion between nanoparticles and
therefore enhance the stability of the nanosuspension [3, 12]. Commonly used
stabilizing agents include different surfactants (such as sodium dodecyl sulfate (SDS)
and Tween) and polymers including Polyvinylpyrrolidone (PVP) [13], Polyvinyl
Achohol (PVA) [12], starch [8, 14], and various proteins [9, 15] .
2 Environmental fate and antimicrobial properties of AgNP in different water
chemistry conditions
The use of AgNP in a wide variety of consumer products will inevitably lead to
the release of the nanoparticles into natural water, which are the final receptacles [16].
Therefore, knowing the fate and reactivity of AgNP under environmentally relevant
conditions is essential to prevent possible negative impacts on microorganisms
commonly found in aquatic ecosystems.
2.1 Aggregation of AgNP in different water chemistry conditions
Previous studies have shown that different water chemistry conditions affect the
3
toxicity of AgNP on microorganism communities [17].
It is widely accepted that the aggregation of AgNP follows the Derjaguin-Landau-
Verwey-Overbeek (DLVO) theory [18-20], which combines the effects of the van der
Waals attraction force and the electrostatic repulsion force created by the double layer
of counterions [8, 20, 21]. In an aqueous solution, AgNP are electrostatically
stabilized when the energy barrier is formed, because the electrostatic repulsion force
is in excess of the van der Waals attraction force. AgNP are stable under this
condition. However, when electrolytes are introduced into the system, the counterions
in the aqueous solution neutralize the surface charges and disrupt the energy barrier,
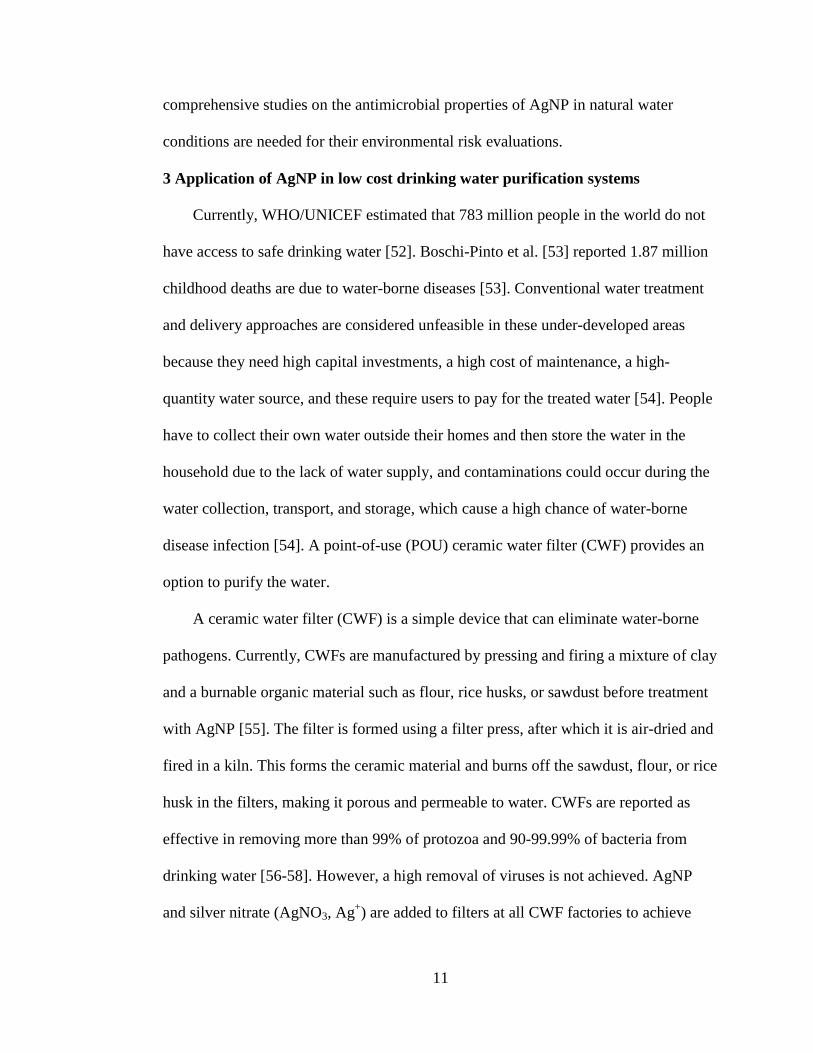
leading to aggregation [19, 21-25]. Figure 1-1 is an example of AgNP aggregation at
increasing concentrations of NaCl [13]. When addition of the electrolyte solution
results in complete removal of the energy barrier, fast aggregation occurs and the
cluster size increases regardless of the electrolyte concentration [19, 20, 26].

4
Figure 1-1 Aggregation kinetics of AgNP in different concentrations of NaCl
solution [13].
ξ-potential is used to quantify the stability of the colloidal systems. Its value
(negative or positive) indicates the degree of repulsion between charged particles in a
nanosuspension. For AgNP suspension, high ξ-potential indicates the AgNP are
electrically stabilized, while AgNP with low ξ-potential tend to aggregate. AgNP, in
aerobic aqueous systems, carry negative charges because Ag(OH)2 species at the
surface can be formed due to the oxidation of metallic silver in the presence of O2 in
an aqueous solution [9, 19, 20]. In an aqueous solution containing ions, adsorption of
anions can impart negative surface charges. More negative ξ-potential values indicate
stronger electrostatic repulsion force between nanoparticles. Previous studies have
also examined the effects of pH on the ξ-potential of AgNP. Li et al. [20] found that
increasing pH (from 4-10) can better help stabilize the uncoated nanoparticles. Other
studies [22] found similar trends using citrate coated AgNP across a wide pH range (2-
10). As the silver atoms at the surface of AgNP are coordinately unsaturated, the OH-

5
group can donate a pair of electrons. Therefore, when pH increases from 2- 10, the
concentration of OH- increases, thus allowing the OH
- to more effectively compete for
surface sits, which generates a negative surface charge in alkaline pH conditions [22].
As the commonly used AgNP are negatively charged, increasing electrolyte
concentration can increase the neutralization by the cations present in the electrolytes,
which results in a decreasing ξ-potential (less stable) colloidal system [8].
Another mechanism of stabilization is steric repulsion [8, 9, 17, 18, 27]. Neutral
organic coatings such as PVP and starch can also sterically prevent AgNP from
aggregating [17, 20, 28]. Similarly, in water solutions containing natural organic
matter (NOM), the NOM can absorb onto the AgNP surface, creating a physical
barrier that hinders the contact between nanoparticles, and thus sterically stabilizing
the nanoparticles.
Numerous studies have focused on the aggregation behavior of AgNP and have
been summarized in Table 1-1.

6
Table 1-1 Recent studies investigated AgNP aggregation
AgNP types Water matrices References Main findings Casein coated AgNP Electrolyte solution [9] Aggregation of casein coated
AgNP agrees with DLVO
theory; Humic acid introduces
steric repulsion
Casein, dextrin, and
PVP coated AgNP
Electrolyte solutions
and natural water
conditions
[8] Aggregation of AgNP agrees
with DLVO theory; Humic
acid and PVP coating
introduces steric repulsion
Bare, citrate, PVP,
and BPEI coated
AgNP
Electrolyte solution [29] Aggregation of AgNP agrees
with DLVO theory
Citrate, SDS, Tween
coated AgNP
Electrolyte solutions [10] Aggregation of AgNP agrees
with DLVO theory
Citrate and PVP
coated AgNP
Electrolyte solution [13] Aggregation of AgNP agrees
with DLVO theory; Humic
acid and PVP coating
introduces steric repulsion
Bare AgNP Electrolyte solutions [20] Aggregation of AgNP agrees
with DLVO theory
Bare AgNP Natural water
conditions
[17] Aggregation of AgNP agrees
with DLVO theory; Humic
acid introduces steric repulsion
2.2 Dissolution of AgNP in different water chemistry conditions
Dissolution of AgNP is an important parameter in determining their
environmental fate. Recent studies have attempted to quantify the dissolution of AgNP
in different water matrices. For aqueous solutions with different pHs, Liu and Hurt
[28]and Elzey et al. [30] have found that lower pH can enhance the dissolution of
AgNP. Figure 1-2 shows the dissolution of AgNP in the presence of DI and electrolyte
solutions.

7
Figure 1-2 Schematic illustration of dissolution of the oxide layer coated AgNP
[19].
In different environmental aqueous conditions, Liu and Hurt [28] investigated the
dissolution kinetics of AgNP and reported that the number of dissolved silver ions
from AgNP coated with sodium citrate (average particle size: 4.8±1.6 nm; initial
concentration: 0.05 mg/L) in diluted synthetic seawater is more than that in seawater
(ionic strength: 0.7 M). This study also showed that ionic strength and NOM may
inhibit AgNP dissolution [28].
Effect of size of AgNP on the dissolution was also study. It was shown that the
dissolution of smaller AgNP (coated with sodium citrate; particle size: 4.8 nm) is
much higher than that of large AgNP (coated with sodium citrate; particle size: 60
nm).
Several studies have modeled the dissolution kinetics of AgNP. Lee et al. [31] has
established a first-order dissolution rate in solutions with various AgNP
concentrations, and the rate constants of first-order kinetics were calculated to

8
0.0734/h, 0.0709/h, and 0.0278/h for initial AgNP concentrations of 0.05 mg/L, 0.1
mg/L, and 1 mg/L [31]. A different AgNP dissolution model was established by
Zhang et al. [32] using citrate coated AgNP (particle size ranges from 20-80 nm)
indicating the dissolution kinetics agree with the Arrhenius equation [32].
2.3 Antimicrobial property of AgNP in different water chemistry conditions
Antimicrobial ability is a well-known property of AgNP. AgNP can inactivate a
broad spectrum of microorganisms. Previous studies have proposed three mechanisms
of the antimicrobial activities of AgNP (Figure 1-3): (i) Could attach to cell membrane
and disrupt the permeability and respiration functions of the cell and thus kill the cells
[7, 33, 34]; (ii) Reactive oxygen species (ROS) can be generated on the surface of
nanoparticles and cause damage of DNA by exerting oxidative stress [35]; (iii) Silver
ions released from AgNP can also cause disruption of ATP production and DNA
replication [36, 37].
Figure 1-3 Mechanisms of interaction between AgNP and bacterial cells [38].

9
Previous studies have evaluated the toxicity of AgNP toward different
microorganisms in aquatic systems. Gao et al. [17] have reported that the LC50 (µg/L)
of AgNP against Escherichia coli (E. coli) and Ceriodaphnia dubia (C. dubia) are less
than 112.14 and 6.18 µg/L, respectively. Studies on the toxicity of AgNP against other
microorganisms, such as Staphylococcus aureus [39], Leuconostoc mesenteroides
[40], Bacillus subtilis [41], and Pseudomonas aeruginosa [42] were also reported.
Recent studies also focus on viruses, a smaller microorganism, as viruses are
responsible for a wide spectrum of diseases in bacteria, plants, and animals and they
play important role in aquatic food webs as active constituents of the microbial loop
[43]. A recent study reported that AgNP (particle size: 21 nm) could not inactivate an
MS2 bacteriophage in a phosphate buffer solution (PBS) even at their highest
concentration (5 mg/L) [44]. Another study shows that IC50 of AgNP on different
strains of HIV-1 virus ranged from 0.19-0.91 mg/mL [45]. However, more research is
needed to determine the antiviral activity of AgNP in environmental relevant
conditions and their antiviral mechanisms.
In environmental conditions, the antimicrobial property of AgNP can be affected
by their stability in different water chemistry conditions. Environmental factors such
as the presence of O2, complexing agents (such as Cl- and SO4
2-, etc), and ionic
strength influence the particle size, surface chemistry, and silver dissolution [46] of
AgNP.
Under various oxidation conditions, Lok et al. [47] showed that E. coli colony
formation was not affected by a treatment of 9.2 nm AgNP prepared under reducing
conditions compared with the control group (E. coli without AgNP treatment).

10
However, after air saturation, aqueous solutions containing AgNP with O2 for 30 min
showed a strong antimicrobial effect on E. coli. Xiu et al. [48] revealed that the
toxicity of AgNP was 20 times less toxic to E. coli than silver ions (EC50: 2.04±0.07
vs 0.10±0.01mg/L) and the toxicity of AgNP increased 2.3-fold after exposure to air
for 0.5 h. In these studies, the presence of a soluble Ag2O layer was the key to the
antimicrobial property of silver.
Several studies have investigated the antimicrobial activity of AgNP in different
environmentally relevant conditions. Jin et al. [49] investigated the antibacterial
properties of AgNP in different synthetic electrolyte solutions and elucidated that the
antibacterial activity of AgNP was much lower than with silver ions when compared
on the basis of total mass of AgNP added across all water conditions. However,
bacterial inactivation also depended on the bacteria cell type as well as the hardness
and alkalinity of the synthetic media. A similar study [50] investigated the effects of
ligands (S2-
, Cl-, SO4
2-, PO4
3-, and EDTA) on the toxicity of AgNP (1 mg/L). The
study revealed that Cl-, SO4
2-, PO4
3- can decrease bacterial inhibition by 20%;
however, sulfide appeared to be more effective to reduce AgNP toxicity by 80%.
Natural organic matter has a negative impact of the antimicrobial performance of
AgNP. Studies have shown that the organic matter can adsorb on the surface of AgNP
and reduce the physical contact between AgNP and bacterial cells [8, 9, 17, 51]. In
addition, the adsorption of organic matters can also inhibit their dissolution, resulting
in a decreasing antimicrobial property [28].
The abovementioned studies focused on investigating the isolated water
compositions, such as individual electrolytes or humic substances. However, more
11
comprehensive studies on the antimicrobial properties of AgNP in natural water
conditions are needed for their environmental risk evaluations.
3 Application of AgNP in low cost drinking water purification systems
Currently, WHO/UNICEF estimated that 783 million people in the world do not
have access to safe drinking water [52]. Boschi-Pinto et al. [53] reported 1.87 million
childhood deaths are due to water-borne diseases [53]. Conventional water treatment
and delivery approaches are considered unfeasible in these under-developed areas
because they need high capital investments, a high cost of maintenance, a high-
quantity water source, and these require users to pay for the treated water [54]. People
have to collect their own water outside their homes and then store the water in the
household due to the lack of water supply, and contaminations could occur during the
water collection, transport, and storage, which cause a high chance of water-borne
disease infection [54]. A point-of-use (POU) ceramic water filter (CWF) provides an
option to purify the water.
A ceramic water filter (CWF) is a simple device that can eliminate water-borne
pathogens. Currently, CWFs are manufactured by pressing and firing a mixture of clay
and a burnable organic material such as flour, rice husks, or sawdust before treatment
with AgNP [55]. The filter is formed using a filter press, after which it is air-dried and
fired in a kiln. This forms the ceramic material and burns off the sawdust, flour, or rice
husk in the filters, making it porous and permeable to water. CWFs are reported as
effective in removing more than 99% of protozoa and 90-99.99% of bacteria from
drinking water [56-58]. However, a high removal of viruses is not achieved. AgNP
and silver nitrate (AgNO3, Ag+) are added to filters at all CWF factories to achieve

12
higher pathogen removal due to their antimicrobial properties [59, 60]. The silver
solutions are applied to CWF either by brushing or dipping [61]. It was reported that
83% of CWF factories apply AgNP and 17% use Ag+ [61]. The concentration of silver
applied at CWF factories varies. Reported amounts of AgNP applied on CWFs ranges
from 32 to 96 mg per CWF [62]. Current guidelines recommend 64 mg of AgNP per
CWF [62].
Two mechanisms of microorganism disinfection by CWFs were suggested. (i)
CWFs can remove microorganisms by size exclusion or adsorption; (ii) AgNP or Ag+
inside of CWFs can inactivate pathogens [63]. Figure 1-5 shows the bacteria trapped
inside of CWFs coated with AgNP or Ag+.
.
Figure 1-4 Bacteria trapped in CWF impregnated with AgNP or Ag+
Numerous studies have investigated the pathogen removal performance of silver-
impregnated CWFs. Table 1-2 summarizes these studies, including the types of silver
and pathogens as well as the removal performances.

13
Table 1-2 Summary of pathogen removal performance of silver coated CWFs
manufactured with different clay materials
References Pathogen types Pathogen reduction
performance
Types of
silver
Type of clay
% LRV
[64] E. coli >2 AgNP Nicaraguan
Cryptosporidium
parvum
4.3
MS2
bacteriophage
<1
[65] E. coli 2.9 AgNP Nicaraguan
[66] E. coli >3 AgNP Nicaraguan
[54] E. coli 7 AgNP Nicaraguan
Clostridium
spores
3.3-4.9
MS2
bacteriophage
<1
[67] E. coli 3 AgNP Nicaraguan
[55] E. coli >97.8 AgNP Guatemalan,
Redart,
Mexican
[63] E. coli 4.5 AgNP Nicaraguan
[56] E. coli 99 Ag+
Cambodian
MS2
bacteriophage
90-99
[68] E. coli 4.56 AgNP Guatemalan
Although studies have addressed the pathogen reduction of silver-coated CWFs
manufactured with different materials, other manufacturing conditions may affect the
performance of CWFs. When applying silver on CWFs, a variety of water sources is
used at factories to prepare silver solutions, from untreated surface water to treated
water. Water characteristics at the filter user’s home also vary with location. Previous
studies have reported a reduction in antibacterial properties of AgNP with increased
size of the nanoparticle clusters due to aggregation in the presence of divalent ions
such as Ca2+
and Mg2+
[8]. In addition, environmental waters usually contain organic

14
compounds, such as humic acids (HA) [8, 51]. These natural organic matter
compounds can rapidly coat the nanoparticle surfaces, creating a physical barrier that
prevents interaction between nanoparticles and bacteria. While previous studies have
reported that different water chemistry conditions can have an impact on the
disinfection performance of AgNP in the aqueous phase[8], these parameters have not
been evaluated on CWFs either in the field or in laboratory tests.
Due to the silver application, desorption of silver from coated CWFs has been
reported during the first flushes of water. Previous studies using a phosphate buffer as
an influent solution reported a decrease in silver concentration in effluent from AgNP-
impregnated CWFs to below the United States Environmental Protection Agency
(USEPA) maximum contaminant level (MCL) for silver in drinking water (0.1 mg/L
or 100 ppb) within few flushes [69]. However, no comprehensive study has evaluated
the desorption of either AgNP or Ag+ from CWFs using different clays and water
chemistry conditions.
Silver application in CWFs has advantages in reducing pathogens. However, the
price of silver has increased significantly in the past few years, from approximately
$10 to $30 per ounce (Figure 1-6) [70].

15
Figure 1-5 Price of silver per ounce during the last 5 years [70].
The increase in the price of silver is threatening the sustainability of CWFs.
Therefore, alternative disinfectants are needed to ensure the antimicrobial efficacy of
the CWF system. One promising disinfectant agent candidate is 3-(trihydroxysilyl)
propyldimethyloctadecyl ammonium chloride (TPA), which is a quaternary amine
functionalized silsesquioxane compound. Getman [71] compared the antimicrobial
performance between TPA and silver and found that TPA can deactivate 99.99% of E.
coli in a nylon-thin film, while silver does not exhibit any performance during a one-
hour antimicrobial test [71]. In addition to its high antimicrobial properties, TPA
powder is less expensive (~ $222 per kg) than silver (~ $1024 per kg). TPA is
currently applied as an antibacterial or anti-mold reagent. Its applications include
integration into thermoplastics or thermoset; dissolution in water and other solvents
for use in coating, as with caulk or adhesive formulations; and application as a surface
treatment for disinfection purposes [71].

16
Currently, no studies have applied TPA in CWFs. This dissertation provides a
comparative study on the antimicrobial properties of TPA and AgNP in aqueous
phases and evaluates their application in CWFs.
4 Dissertation objectives
Evaluating the reactivity of AgNP is essential to support their application in water
treatment technologies. Reactivity of nanoparticles is also important in order to
address their environmental impacts once released in natural systems. Therefore,
considering the gaps in the literature, the following objectives were developed:
Determine the effect of natural water composition on the bactericidal and
antiviral activity of AgNP stabilized with different coatings. This goal is
important, since few studies have focused on studying their antimicrobial
properties (especially their antiviral properties) [17] and physicochemical
properties [17, 72] in natural water conditions. This study will provide new
evidence of how natural waters affect the abovementioned properties of AgNP,
which is helpful in explaining their environmental fate.
Determine the performance of silver nanoparticles applied to ceramic water
filters used for water treatment in developing communities. This goal is
important, since previous literature has only focused on the effects of silver
concentration and CWF manufacturing materials on the bacterial removal of
AgNP-impregnated CWFs. This study will provide new evidence on how
different water chemistries influence the bacterial removal and biofilm
formation inside CWFs.

17
Compare the disinfection performance of ceramic water filters impregnated
with two antibacterial compounds: AgNP and TPA. This goal is important,
since previous literature has only focused on how the application of different
silver species (AgNP and AgNO3) affects CWF performance. This study will
provide new evidence of the feasibility in applying cheaper but more effective
alternative disinfectants on CWFs.
5 Dissertation overview
Chapter 1 provides a background and literature review of the environmental fate
of AgNP, their antimicrobial properties, their application in CWFs, and potential
alternative candidates in place of AgNP.
Chapter 2 is entitled ―Evaluation of the disinfectant performance of silver
nanoparticles in different water chemistry conditions.‖ It was published in the Journal
of Environmental Engineering (2012) volume 138 by Hongyin Zhang and Vinka
Oyanedel-Craver. This manuscript evaluated the physicochemical properties and
antimicrobial performance of AgNP over a range of electrolyte types and
concentrations. The effects of natural organic matter were also investigated using
humic acid as a surrogate.
Chapter 3, ―The effect of natural water conditions on the anti-bacterial
performance and stability of silver nanoparticles capped with different polymers‖ was
published in Water Research (2012) volume 46 by Hongyin Zhang, James A. Smith,
and Vinka Oyanedel-Craver. This chapter describes the significance of different
natural water conditions in affecting the physicochemical properties (including particle

18
size, aggregation behavior, ξ-potential, dissolution) and antimicrobial performance of
AgNP coated with dextrin, casein, and PVP.
Chapter 4, ―Antiviral effect and physicochemical characteristics of silver
nanoparticles in different water conditions‖ is a manuscript in preparation by Hongyin
Zhang and Vinka Oyanedel-Craver. This chapter investigates the physicochemical
behavior and antiviral effect of AgNP (coated with sodium citrate and PVP) in
different synthetic aqueous solutions and natural water conditions.
In Chapter 5, we investigated the performance of ceramic disks manufactured
with clays from three different factories and two types of burn-out materials. Firstly,
the ceramic disks were coated with three different concentrations of either AgNP or
Ag+. Effluent silver concentration, silver retention, E. coli removal, and biofilm
formation were evaluated. Then, the influence of three water chemistries including
NaCl, CaCl2, and humic acid on AgNP and Ag+ were evaluated on disks against the
same abovementioned parameters. The manuscript is authored by Justine Rayner,
Hongyin Zhang, Jesse Schubert, Pat Lennon, Daniele Lantagne, and Vinka Oyanedel-
Craver and was submitted to ACS Sustainable Chemistry and Engineering for possible
publication.
Chapter 6 is entitled ―Comparison of the bacterial removal performance of point-
of-use ceramic water filters impregnated with silver nanoparticles and quaternary
ammonium functionalized silane as an alternative disinfectant.‖ The manuscript is
authored by Hongyin Zhang and Vinka Oyanedel-Craver and has been submitted to
the Journal of Hazardous Materials. This chapter investigated the antimicrobial
performance of AgNP and TPA in an aqueous solution using a respirometric technique
19
and determined the bacterial removal performance of CWFs coated with AgNP or
TPA. The release of AgNP and TPA from ceramic material was also measured to
determine their potential health impacts.
Finally, the conclusion and recommended future research are summarized in
Chapter 7.

20
REFERENCE
1. Woodrow Wilson Center. 2011; Available from:
http://www.nanotechproject.org/inventories/consumer/analysis_draft/.
2. Choi, O., et al., The inhibitory effects of silver nanoparticles, silver ions, and
silver chloride colloids on microbial growth. Water Res, 2008. 42(12): p.
3066-3074.
3. Sharma, V.K., R.A. Yngard, and Y. Lin, Silver nanoparticles: green synthesis
and their antimicrobial activities. Adv Colloid Interface Sci, 2009. 145(1-2): p.
83-96.
4. Panacek, A., et al., Silver colloid nanoparticles: synthesis, characterization
and their antibacterial activity. J. Phys. Chem. C, 2006. 110: p. 16248-16253.
5. Yu, D. and V. Yam, Controlled synthesis of monodisperse silver nanocubes in
water. J Am Chem Soc, 2004. 126: p. 13200–13201.
6. Saito, Y., et al., Simple chemical method for forming silver surfaces with
controlled grain sizes for surface plasmon experiments. Langmuir, 2003. 19: p.
6857–6861.
7. Morones, J.R., et al., The bactericidal effect of silver nanoparticles.
Nanotechnology, 2005. 16(10): p. 2346-2353.
8. Zhang, H., J.A. Smith, and V. Oyanedel-Craver, The effect of natural water
conditions on the anti-bacterial performance and stability of silver
nanoparticles capped with different polymers. Water Res., 2012. 46(3): p. 691-
699.
9. Zhang, H. and V. Oyanedel-Craver, Evaluation of the disinfectant performance

21
of silver nanoparticles in different water chemistry conditions. J. Environ.
Eng., 2012. 138: p. 58-66.
10. Kvitek, L., et al., Effect of surfactants and polymers on stability and
antibacterial activity of silver nanoparticles (NPs). J. Phys. Chem. C, 2008.
112: p. 5825-5834.
11. Ren, D. and J.A. Smith, Proteinate-Capped Silver Nanoparticle Transport in
Water-Saturated Sand. Journal of Environmental Engineering, 2012: p.
121119223630003.
12. Rai, M., A. Yadav, and A. Gade, Silver nanoparticles as a new generation of
antimicrobials. Biotechnol Adv, 2009. 27(1): p. 76-83.
13. Huynh, K.A. and K.L. Chen, Aggregation kinetics of citrate and
polyvinylpyrrolidone coated silver nanoparticles in monovalent and divalent
electrolyte solutions. Environ Sci Technol, 2011. 45(13): p. 5564-5571.
14. Tai, C.Y., et al., Synthesis of silver particles below 10nm using spinning disk
reactor. Chemical Engineering Science, 2009. 64(13): p. 3112-3119.
15. Navarro, E., et al., Toxicity of silver nanoparticles to Chlamydomonas
reinhardtii. Environ Sci Technol, 2008. 42: p. 8959-8964.
16. Colvin, V.L., The potential environmental impact of engineered
nanomaterials. Nature Biotechnol., 2003. 21: p. 1166-1170.
17. Gao, J., et al., Dispersion and toxicity of selected manufactured nanomaterials
in natural river water samples: effects of water chemical composition. Environ
Sci Technol, 2009. 43: p. 3322-3328.
18. Chen, K.L. and M. Elimelech, Influence of humic acid on the aggregation

22
kinetics of fullerene (C60) nanoparticles in monovalent and divalent
electrolyte solutions. J Colloid Interface Sci, 2007. 309(1): p. 126-134.
19. Li, X. and J.J. Lenhart, Aggregation and dissolution of silver nanoparticles in
natural surface water. Environ Sci Technol, 2012. 46(10): p. 5378-5386.
20. Li, X., J.J. Lenhart, and H.W. Walker, Dissolution-accompanied aggregation
kinetics of silver nanoparticles. Langmuir, 2010. 26(22): p. 16690-16698.
21. Li, M. and C.P. Huang, Stability of oxidized single-walled carbon nanotubes in
the presence of simple electrolytes and humic acid. Carbon, 2010. 48(15): p.
4527-4534.
22. El Badawy, A.M., et al., Impact of Environmental Conditions (pH, Ionic
Strength, and Electrolyte Type) on the Surface Charge and Aggregation of
Silver Nanoparticles Suspensions. Environ Sci Technol, 2010. 44: p. 1260-
1266.
23. Piccapietra, F., L. Sigg, and R. Behra, Colloidal stability of carbonate-coated
silver nanoparticles in synthetic and natural freshwater. Environ Sci Technol,
2012. 46(2): p. 818-825.
24. Gebauer, J.S. and L. Treuel, Influence of individual ionic components on the
agglomeration kinetics of silver nanoparticles. J Colloid Interface Sci, 2011.
354(2): p. 546-554.
25. Van Hoecke, K., et al., Aggregation and ecotoxicity of CeO(2) nanoparticles in
synthetic and natural waters with variable pH, organic matter concentration
and ionic strength. Environ Pollut, 2011. 159(4): p. 970-976.
26. Liu, X., et al., Influence of Ca(2+) and Suwannee River Humic Acid on

23
aggregation of silicon nanoparticles in aqueous media. Water Res, 2011.
45(1): p. 105-112.
27. Illes, E. and E. Tombacz, The effect of humic acid adsorption on pH-dependent
surface charging and aggregation of magnetite nanoparticles. J Colloid
Interface Sci, 2006. 295(1): p. 115-123.
28. Liu, J. and R.H. Hurt, Ion release kinetics and particle persistence in aqueous
nano-silver colloids. Environ. Sci. Technol., 2010(44): p. 2169-2175.
29. Li, X., J.J. Lenhart, and H.W. Walker, Aggregation kinetics and dissolution of
coated silver nanoparticles. Langmuir, 2012. 28(2): p. 1095-1104.
30. Levard, C., et al., Environmental transformations of silver nanoparticles:
impact on stability and toxicity. Environ Sci Technol, 2012. 46(13): p. 6900-
6914.
31. Lee, Y.J., et al., Ion-release kinetics and ecotoxicity effects of silver
nanoparticles. Environ Toxicol Chem, 2012. 31(1): p. 155-159.
32. Zhang, W., et al., Modeling the primary size effects of citrate-coated silver
nanoparticles on their ion release kinetics. Environ Sci Technol, 2011. 45(10):
p. 4422-4428.
33. Sondi, I. and B. Salopek-Sondi, Silver nanoparticles as antimicrobial agent: a
case study on E. coli as a model for Gram-negative bacteria. J. Colloid
Interface Sci., 2004. 275(1): p. 177-182.
34. Park, M.V., et al., The effect of particle size on the cytotoxicity, inflammation,
developmental toxicity and genotoxicity of silver nanoparticles. Biomaterials,
2011. 32(36): p. 9810-9817.

24
35. Feng, Q.L., et al., A mechanistic study of the antibacterial effect of silver ions
on Escherichia coli and staphylococcus aureus. J. Biomed. Mater., 2000.
52(4): p. 662-668.
36. Cumberland, S.A. and J.R. Lead, Particle size distributions of silver
nanoparticles at environmentally relevant conditions. J. Chromatogr. A, 2009.
1216(52): p. 9099-9105.
37. Kittler, S., et al., Toxicity of Silver Nanoparticles Increases during Storage
Because of Slow Dissolution under Release of Silver Ions. Chemistry of
Materials, 2010. 22(16): p. 4548-4554.
38. Marambio-Jones, C. and E.M.V. Hoek, A review of the antibacterial effects of
silver nanomaterials and potential implications for human health and the
environment. Journal of Nanoparticle Research, 2010. 12(5): p. 1531-1551.
39. Kim, J., Antibacterial activity of Ag+ ion-containing silver nanoparticles
prepared using the alcohol reduction method. J. Ind. Eng. Chem., 2007. 13: p.
718-722.
40. Vertelov, G., et al., A versatile synthesis of highly bactericidal myramistin
stabilized silver nanoparticles. nanotechnology, 2008. 19(355707-355708).
41. Yoon, K., et al., Antimicrobial effect of silver particles on bacterial
contamination of activated carbon fibers. Environ. Sci. Technol., 2008. 42: p.
1251-1255.
42. Balogh, L., et al., Dendrimer-silver complexes and nanocomposites as
antimicrobial agents. Nano. Lett., 2001. 1: p. 18-21.
43. Hewson, I., C. Chow, and J. Fuhrman, Ecological role of viruses in aquatic

25
ecosystems. 2010, Chichester: eLS. John Wiley & Sons Ltd.
44. You, J., Y. Zhang, and Z. Hu, Bacteria and bacteriophage inactivation by
silver and zinc oxide nanoparticles. Colloids Surf B Biointerfaces, 2011.
85(2): p. 161-167.
45. Lara, H.H., et al., Mode of antiviral action of silver nanoparticles against HIV-
1. J Nanobiotechnology, 2010. 8: p. 1.
46. Suresh, A.K., D.A. Pelletier, and M.J. Doktycz, Relating nanomaterial
properties and microbial toxicity. Nanoscale, 2013. 5: p. 463-474.
47. Lok, C.N., et al., Silver nanoparticles: partial oxidation and antibacterial
activities. J Biol Inorg Chem, 2007. 12(4): p. 527-534.
48. Xiu, Z.M., J. Ma, and P.J. Alvarez, Differential effect of common ligands and
molecular oxygen on antimicrobial activity of silver nanoparticles versus silver
ions. Environ Sci Technol, 2011. 45(20): p. 9003-9008.
49. Jin, X., et al., High-through screening of silver nanoparticle stability and
bacterial inactivation in aquatic media: Influence of specific ions. Environ Sci
Technol, 2010. 44: p. 7321-7328.
50. Choi, O., et al., Role of sulfide and ligand strength in controlling nanosilver
toxicity. Water Res, 2009. 43(7): p. 1879-1886.
51. Fabrega, J., et al., Silver nanoparticle impact on bacterial growth: effect of pH,
concentration, and organic matter. Environ Sci Technol, 2009. 43: p. 7285-
7290.
52. WHO/UNICEF, Progress on Drinking Water and Sanitation: 2012 Update.
2012.

26
53. Boschi-Pinto, C., L. Velebit, and K. Shibuya, Estimating child mortality due to
diarrhea in developing countries. World Health Organization Bulletin, 2008.
86: p. 710-717.
54. Van Halem, D., Ceramic silver impregnated pot filters for household drinking
water treatment in developing countries. 2006, Delft University of
Technology.
55. Oyanedel-Craver, V.A. and J.A. Smith, Sustainable colloidal-silver-
impregnated ceramic filter for point-of-use water treatment. Environ. Sci.
Technol., 2008. 42: p. 927-933.
56. Brown, J. and M.D. Sobsey, Microbiological effectiveness of locally produced
ceramic filters for drinking water treatment in Cambodia. J Water Health,
2010. 8(1): p. 1-10.
57. van Halem, D., et al., Assessing the sustainability of the silver-impregnated
ceramic pot filter for low-cost household drinking water treatment. Phys.
Chem. Earth, 2009. 34(1-2): p. 36-42.
58. Lantagne, D.S., Investigation of the potters for peace colloidal silver
impregnated ceramic filter. Report 1: Intrinsic Effectiveness. 2001.
59. Pradeep, T. and Anshup, Noble metal nanoparticles for water purification: A
critical review. Thin Solid Films, 2009. 517(24): p. 6441-6478.
60. Lv, Y., et al., Silver nanoparticle-decorated porous ceramic composite for
water treatment. Journal of Membrane Science, 2009. 331(1-2): p. 50-56.
61. Rayner, J., Current practices in manufacturing locally-made ceramic pot
filters for water treatment in developing countries. Journal of Water, Sanitation
27
and Hygiene for Development 2013. (in press).
62. CMWG, Best Practice Recommendations for Local Manufacturing of Ceramic
Pot Filters for Household Water Treatment. 2011: Atlanta, GA, USA.
63. Bielefeldt, A.R., K. Kowalski, and R.S. Summers, Bacterial treatment
effectiveness of point-of-use ceramic water filters. Water Res., 2009. 43(14): p.
3559-3565.
64. Lantagne, D.S., Investigation of the Potters for Peace Colloidal Silver
Impregnated Ceramic Filter, Report 1: Intrinsic Effectiveness. 2001: Alethia
Environmental, Allston.
65. Fahlin, C.J., Hydraulic Properties Investigation of the Potters for Peace
Colloidal Silver Impregnated, Ceramic Filter. 2003, University of Colorado at
Boulder College of Engineering.
66. Campbell, E., Study on Life Span of Ceramic Filter Colloidal Silver Pot
Shaped (CSP) Model. 2005: Managua, Nicaragua.
67. Duke, W.F., R. Nordin, and A. Mazumder, Comparative Analysis of the
Filtron and Biosand Water Filters. 2006, University of Victoria: British
olumbia.
68. Kallman, E., V. Oyanedel-Craver, and J. Smith, Ceramic Filters Impregnated
with Silver Nanoparticles for Point-of-Use Water Treatment in Rural
Guatemala. Journal of Environmental Engineering, 2011. 137: p. 407-415.
69. USEPA. Available from: http://water.epa.gov/drink/contaminants/index.cfm.
70. Ebulllionguide. Available from: www. Ebulllionguide.com/price-chart-silver-
last-5-years.aspx.
28
71. Getman, G.D., An advanced non-toxic polymeric antimicrobial for consumer
products, in Rubber World 2011. p. 22-25.
72. Chinnapongse, S.L., R.I. MacCuspie, and V.A. Hackley, Persistence of singly
dispersed silver nanoparticles in natural freshwaters, synthetic seawater, and
simulated estuarine waters. Sci Total Environ, 2011. 409(12): p. 2443-2450.

29
CHAPTER 2
EVALUATION OF THE DISINFECTANT PERFORMANCE OF SILVER
NANOPARTICLES IN DIFFERENT WATER CHEMISTRY CONDITIONS
By
Hongyin Zhang and Vinka Oyanedel-Craver*
is published in Journal of Environmental Engineering, 138, 58-66
1Department of Civil and Environmental Engineering, University of Rhode Island,
Bliss Hall 213, Kingston, RI 02881

30
1 Abstract
This study aimed to determine the effect of different water chemistry conditions
on the bactericidal properties of silver nanoparticles (AgNP). Lower disinfection
performance of AgNP was obtained in divalent cationic solutions in comparison with
monovalent solutions with the same concentration. Average particle size of AgNP
increased with increasing electrolyte concentration as divalent cations (Ca2+
and Mg2+
)
produced larger AgNP aggregates than those formed with monovalent solutions. ξ-
potential measurements showed that AgNP in divalent cationic solutions had low
absolute ξ-potential values (-9.8- -23.2 mV) while the values obtained in monovalent
solutions were considerable higher. The measurements of the concentration of ionic
silver released indicated that the fraction of dissolved Ag+ (5.9-18.8 ppb) was around
0.1% of the total mass of Ag0 added. The contribution of Ag
+ to the overall
disinfection performance was negligible at the conditions tested. In this study, we have
analyzed different physco-chemical properties of silver nanoparticles and the survival
rate of Escherichia coli (E. coli)in different AgNP solutions. The data we collected
lead to a correlation between survival rate of of E. coli and average size of AgNP. We
found a strong correlation between this two parameters tha can be fitted to a saturation
type curve, reaching a survival plateau around 20% survival at an average particle size
of 200 nm for all the water chemistry conditions tested.
2 Introduction
AgNP are commonly used in a wide range of applications, including solar energy
absorption and chemical catalysis and disinfection [1-5]. Consumer products
containing AgNP accounted for more than 25% of the 1,015 nanotechnology-based

31
consumer products available on the market in 2009 [6]. AgNP have large surface areas
per volume ratio and high reactivity compared with the bulk solid. This feature gives
AgNP antimicrobial properties.
Three possible antimicrobial mechanisms of AgNP have been raised: (1) AgNP
can damage cell membrane and intracellular components [7, 8], (2) silver ions released
from AgNP can be sorbed into the cell wall and cause lysis and death [7, 9, 10], and
(3) reactive oxygen species (ROS) can be formed in AgNP solution [11-14]. While the
antibacterial properties of AgNP have been extensively demonstrated [15-18],their
performance at different water chemistries have not been fully understood yet. Some
evidence shows that the disinfection effectiveness of AgNP is size dependent [19], and
that the process of aggregation reduces their surface area, reducing the cell-particle
interaction, membrane penetration, and the rate of silver ion release [6].
Studies measuring the rate of silver ions release at different dilutions of seawater
showed that the salt concentration did not affect the AgNP’ oxidation kinetics;
however, high ionic strength increased the size of the particles from 1.9 to 200 nm
after 24 hours [6]. Gao et al. [20] also found that fresh water samples with higher ionic
strength produced large AgNP [20]. Jin et al. [21] studied the effect of different water
matrices on the AgNP size, silver ions release, and antimicrobial activity using a fixed
concentration of Ca2+
and Mg2+
. The study revealed that Ca2+
and Mg2+
increased the
AgNP aggregation in different electrolyte solutions with the same ionic strength in
comparison with mono-valent ions. The antimicrobial test showed that Gram-negative
bacteria Pseudomonas putida was more resistant to AgNP compared to Gram-positive
bacteria Bacillus subtilis [21].

32
In this work, we used seven different electrolyte solutions to study systematically
the influence of different cations and anions on physico-chemical characteristic of the
particles and disinfection performance. One objective of this study was to establish a
correlation between survival rate of bacteria and particle characteristics that could
easily predict the disinfection performance of AgNP at different water chemistry
conditions.
3 Materials and methods
3.1 Synthetic water solutions
Synthetic water solutions were prepared using eight different solutions, four
mono-valent and three divalent salts in addition to one solution containing humic acids
(HA). These different solutions were prepared using cations concentrations ranging
from 10 to 1000 mg/L (ionic strength range 0.16-167 mM/L) and HA concentrations
ranging from 0.2-20 mg/L [22, 23]. These ranges of concentrations were selected to
mimic the ionic strength and dissolved organic carbon (DOC) content in natural
waters (seawater conditions were not included). Table A-1 (Appendix A) presents the
complete list of solutions tested. The effect of cations with different valence and
anions on the disinfection performance and average particle size of AgNP was
evaluated using a statistical test using a general linear model in PASW SPSS 18.0. All
salts and other reagents were ACS reagent grade and used as received.
3.2 Preparation and characterization of AgNP
AgNP (70.37% w/w Ag0) stabilized with casein were obtained from Argenol
laboratories. The nanoparticles are proposed to bind to casein polymers surface via
complexation with the carboxylate or amino group of casein [24]. A fresh AgNP stock

33
solution of 4 mM was prepared immediately before testing using deinozed (DI) water
and the respective electrolyte as presented in Table A-1. Transmission Electron
Microscopy (TEM) observations of AgNP were performed with a JEM-2100 TEM
transmission electron microscope (Jeol) (Figure 1). The surface charge and average
size distribution were determined by zeta potential and dynamic light scattering (DLS)
using a Zetasizer (Nano ZS, ZEN 3600, Malvern) at 25 oC. Silver nitrate (ACS reagent
grade) was used to compare the antimicrobial activity between AgNP and Ag+ ion.
Silver ions released in each batch test concentrations were measured after 20 h (the
same duration as described in the Antibacterial assay) by passing a sample through an
10,000 nominal molecular weight cut-off (NMWCO) ultrafiltration membrane
(Millipore, NMWCO: 10,000) using a stirred ultrafiltration cell (Millipore, Model
8200) in dark condition [21, 25]. Concentrations of silver ion were analyzed using
ICP-MS (X series, Thermo Elemental).

34
Figure 2-1 TEM image of AgNP (line=200 nm).
3.3 Microbial cultures
A non-pathogenic wild strain of E.coli provided by IDEXX laboratories was used
for bacteria transport experiment through ceramic filter [26]. This organism was
selected because of its use as specific indicator of fecal contamination in drinking
water and its extensive use in several studies on AgNP, which will allow us to
compare our results with previously published work. Bacteria were grown as
described by Vigeant et al. [27]. Cells were re-suspended in a sterilized solution
prepared with the respective electrolyte solution (Table A-1) to a concentration of
(1±4) 1010
CFU/ml. Determination of the E. coli concentrationwas performed using
the membrane filtration technique, applying m-FC with Rosolic Acid Broth
35
(Millipore) and incubation at 44.5 0C for 24 h. Blue colonies were counted and
recorded as individual E. coli.
3.4 Antibacterial assay
Different solutions were prepared with mono-valent and divalent salt and organic
matter compounds to mimic different natural water chemistries. Bacteria deactivation
batch tests were performed using manometric respirometric equipment (OxiTop
control system, WTW Weilheim, Germany). An OxiTop control system includes a
sample bottle sealed with a measuring head, a small container for CO2 absorbent fixed
at the neck of the bottle, and an OxiTop controller for data recording. The test is based
on automated pressure measurements conducted via piezoresistive electronic pressure
sensors in a closed bottle under constant temperature. Different amount of salts, DI
water, and 10 ml E. coli (total 100 ml mixture, E. coli concentration: 109 CFU/ml)
were inoculated into sample bottles. The sample bottles were sealed with the
measuring heads and placed in the incubator at 25 0C. The endogeneous respiration
was determined by measuring the pressure drop within 2-3 h without adding carbon
source or nanoparticles. Then, 0.5 ml glucose of a 70 g/L (glucose was sufficient for
E. coli over 20 h, data not shown) was injected to determine the oxygen uptake rate
(OUR) without AgNP . Finally, after about 2-3 h, 0.25 ml AgNP stock solution was
injected into the bottles to determine the alteration of the OUR due to the reduction of
bacteria. The total duration of the experiments was 20 h. The percentage of the
bacteria reduction using a modified equation from Tzoris et al. was calculated using
the following equation [28]:

36
Survival rate(%)Pt P
Pc P100
Where Pc is the pressure drop after the injection of glucose, Pt is the OUR after the
injection of AgNP, P is the OUR during the endogenous respiration without the
addition of carbon source or nanoparticles. Figure 2-2 presents a typical respiration
curve. Compared to the conventional deactivation methods based on microbial growth
(such as plate count method), the manometric respirometric method determined the
activity of all active bacteria (not only those that are able to grow). Other advantage is
that this method is based on the total oxygen uptake rate of all bacteria while the plate
count method could miscount colonies grown from bacteria aggregates, considering
only individual bacteria.

37
Figure 2-2 A typical respiration curve after 20 h incubation at 25 0C with glucose
injection: 35 mg and AgNP concentration: 11.5 mg/L. P: Oxygen uptake rate
during endogenous respiration; Pc: Oxygen uptake rate after the injection of
glucose; Pt: Oxygen uptake rate after injection of AgNP.
3.5 Data analysis
The data acquired were fitted using the Origin 8 software, minimizing the
weighted sum of squared errors of determined parameters between the calculated
values and the experimental data. Linear regression analysis with a dummy variable to
compare the survival rate of E. coli and particle size in the presence of different ions
was performed using PASW SPSS 18.0. F statistic values and p values were
calculated. p values of less than 0.05 were considered significant.

38
4 Results
The shape and sizes of AgNP in DI water determined by TEM are presented in
Figure 2-1. AgNP exhibited spherical shape, commonly observed in other studies [6,
29]. Average size of AgNP was 75.5±2.56 nm using DLS which is larger than sizes
determined by TEM (12.6±5.7 nm). The discrepancy is likely due to the formation of
AgNP aggregates.In addition, DLS measurement is volume-squared weighted
distributions and it can be influenced by small numbers of large aggregates compared
to TEM size measurement.
Figure 2-3 shows that the survival rate of E. coli (0-20%) increased with
increasing ion concentration across all conditions tested. The survival rates of E. coli
were 18.3% and 20.2% at 1000 mg/L for Mg2+
and Ca2+
, respectively, while survival
rate for most mono-valent cations and anions at 1,000 mg/L was below 10% (with the
exception of sulfate mono-valent salts). Humic acid (HA) was used as natural organic
matter in this antimicrobial assay. The survival rate of E. coli in HA was between 4 to
5%. Similarly, Gao et al. [20] showed that the toxicity of AgNP of bacteria and
microinvertebrate decreased with increasing concentration of natural organic matter as
total organic carbon (10-4
-10 mg/L)[20].

39
Figure 2-3 Plot of viability of E. coli cells in the presence of AgNP in (a) salts
solutions, (b) HA solutions. Incubation time: 20h, temperature: 25 oC, AgNP
concentration in each sample: 11.5 mg/L. The concentrations of the ions are listed
in Table A-1. It is clear that Ca2+
and Mg2+
increase the survival rate of E. coli.
Figure 2-4 presents the sizes of AgNP across different water chemistry
conditions. The average size of AgNP increased when the concentration of salts
increased. Our result showed that Mg2+
and Ca2+
cations produce a large aggregation
of AgNP. At 1000 mg/L, sizes of AgNP reached over 1000 nm for Mg2+
and Ca2+
cations while aggregates produced by mono-valent cations at the same concentration
were about ten times smaller. These observations agree with the Schulze-Hardy rule
[30], which indicates that the critical coagulationconcentration of a typical colloidal
system is extremely sensitive to the valence of the counter-ions. Sizes of AgNP in HA

40
solutions decreased with increasing HA concentration except at the point of 1 mg/L
(32.5 nm). At 10 mg/L, AgNP sizes in HA solution reached 31.3 nm, which was
similar to the sizes for mono-valent cations at the same concentration. The aggregates
produced by mono-valent cations at 10 mg/L were below 40 nm.
Figure 2-4 Plot of hydrodynamic particle sizes of AgNP in different water
chemistry conditions. (a) Hydrodynamic particle sizes in salts solutions. (b)
Hydrodynamic particle sizes in HA solutions. Incubation time: 20h, temperature:
25 oC, AgNP concentration in each sample: 11.5 mg/L. The concentrations of the
ions are listed in Table A-1.
ξ-potential is related to the stability of the colloidal systems. Its value (negative or
positive) indicates the degree of repulsion between adjacent or charged particles in a
colloidal system. As Figure 2-5 shows, AgNP had negative ξ-potentials across all

41
water chemistry conditions, which is attributed to the adsorption of various anions
onto the AgNP surface. The data also showed that ξ-potential of AgNP solutions
became less negative as the salt concentration increased. However, AgNP in divalent
cationic solution exhibited lower absolute ξ-potential values (-9.8 mV to -23.2 mV) in
comparison with mono-valent cations (-15.6 mV to -39.8 mV). Our values are smaller
than those obtained by Jin et al. [30] who found that the ξ-potentials of AgNP at
different fixed ionic strength solutions (5.6 mM) ranged from -10mV to -60 mV and
with the addition of divalent cationic to the solutions (7 mg/L Mg2+
and 40 mg/L
Ca2+
), the range decreased to between -10 mV to -40 mV [21]. A different surface
modification of the nanoparticle and, in our case, higher concentration of electrolyte
can explain the difference in the results. However, both studies showed that the
attractive interaction between divalent cations and negative charged AgNP increased
led to higher aggregation and large particles. For AgNP in HA solutions, ξ-potentials
decreased (-29.1- -35.2 mV) with increasing concentration. At 10 ppm, ξ-potentials of
AgNP in HA solution exhibited similar values to those in the mono-valent cationic
solutions, except NaCl solution.

42
Figure 2-5 Plot of ξ-potential of AgNP in (a) salts solutions, (b) HA solutions.
Incubation time: 20h, temperature: 25 oC, AgNP concentration in each sample:
11.5 mg/L. The concentrations of the ions are listed in Table A-1.
Figure 2-6 shows that the absolute ξ-potential values for E. coli solutionswere
lower compared to those for AgNP solutions at the same electrolyte concentration.
Similarly to the AgNP, E. coli in divalent cationic solutions had less negative values,
ranging from -0.71 mV to -5.44 mV, while in NaHCO3 solutions, the most negative
values were obtained (-7.7 mV to -11.6 mV). Divalent cations were more likely to be
adsorbed to the E. coli membrane, reducing the absolute ξ-potential values.
Consequently, less electrostatic repulsion was produced when AgNP were mixed with
the bacteria in solutions containing divalent cations, making the AgNP-bacteria
interaction easier to happen; thus, decreasing the survival rate of E. coli.
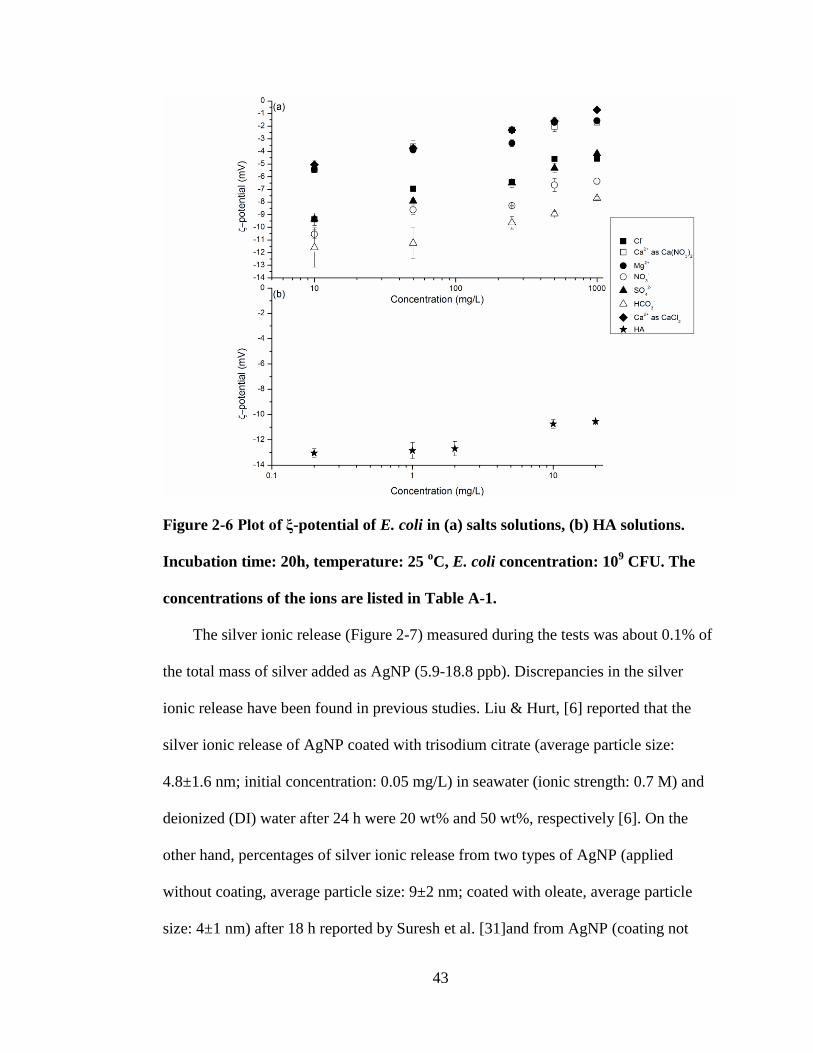
43
Figure 2-6 Plot of ξ-potential of E. coli in (a) salts solutions, (b) HA solutions.
Incubation time: 20h, temperature: 25 oC, E. coli concentration: 10
9 CFU. The
concentrations of the ions are listed in Table A-1.
The silver ionic release (Figure 2-7) measured during the tests was about 0.1% of
the total mass of silver added as AgNP (5.9-18.8 ppb). Discrepancies in the silver
ionic release have been found in previous studies. Liu & Hurt, [6] reported that the
silver ionic release of AgNP coated with trisodium citrate (average particle size:
4.8±1.6 nm; initial concentration: 0.05 mg/L) in seawater (ionic strength: 0.7 M) and
deionized (DI) water after 24 h were 20 wt% and 50 wt%, respectively [6]. On the
other hand, percentages of silver ionic release from two types of AgNP (applied
without coating, average particle size: 9±2 nm; coated with oleate, average particle
size: 4±1 nm) after 18 h reported by Suresh et al. [31]and from AgNP (coating not

44
specified; average particle size in DI water: not specified) after 24 h reported by Jin et
al, (2010) [21]were below 1% under conditions similar to the one used in this study.
To determine the contribution of the silver ions released to the overall disinfection
performance of the AgNP, several AgNO3 solutions were prepared ranging from 1 to
20 ppb (as Ag +), and the survival rate of E coli was determined following the same
abovementioned manometric respirometric method. At all the concentrations tested,
100% E. coli survival was obtained, which indicated that silver ions in solution have a
negligible effect on the disinfection performance of AgNP.
Figure 2-7 Silver ionic release in (a) salts solutions, (b) HA solutions. Incubation
time: 20h, temperature: 25 oC, AgNP concentration in each sample: 11.5 mg/L.
The concentrations of the ions are listed in Table A-1.

45
5 Discussion
Our results showed that AgNP exhibited high antimicrobial activity across several
water chemistry conditions (20% survival and below). Figure 2-8 presents the results
for the survival rate of E.coli as a function of the average AgNP particle size in all
solutions tested. Survival rate of E.coli increased sharply with the increase of the
AgNP average particle size up to 200 nm. After achieving this threshold, the survival
rate seemed to converge to a value close to 20%. A modified saturation type equation
was proposed to tentatively describe the relation between particle size and survival
rate (AgNP concentration: 11.5 mg/L).
yymaxx
kmx (eq. 2)
Where y is the survival rate of E. coli; x is the particle size of AgNP (nm); ymax is the
maximum survival rate of E. coli (%); km is the particle size at which y is half of ymax
(nm).

46
Figure 2-8 The survival rate of E. coli as a function of hydrodynamic particle
sizes. The curve line is the least-squares fitted to the data collected. Coefficient
ymax is the predicted maximum survival rate of E. coli, where ymax=21.0 and its
standard error is 1.04. Coefficient km is the calculated value of particle size at
which the survival rate of E. coli is half of its maximum value, where km=114.6
and its standard error is 13.8. The adjusted R2 for the fitted line reached 0.87.
Statistical analysis compared survival rate and particle size in the presence of
different representative ions. Table 2-1 and 2-2 shows the F and p values calculated
for the particle sizes and survival rates in solutions of different ionic compositions.
The null hypothesis proposed that different ions have no significant effect on the
AgNP particle size or survival rate of E.coli. Any p value smaller than 0.05 implies
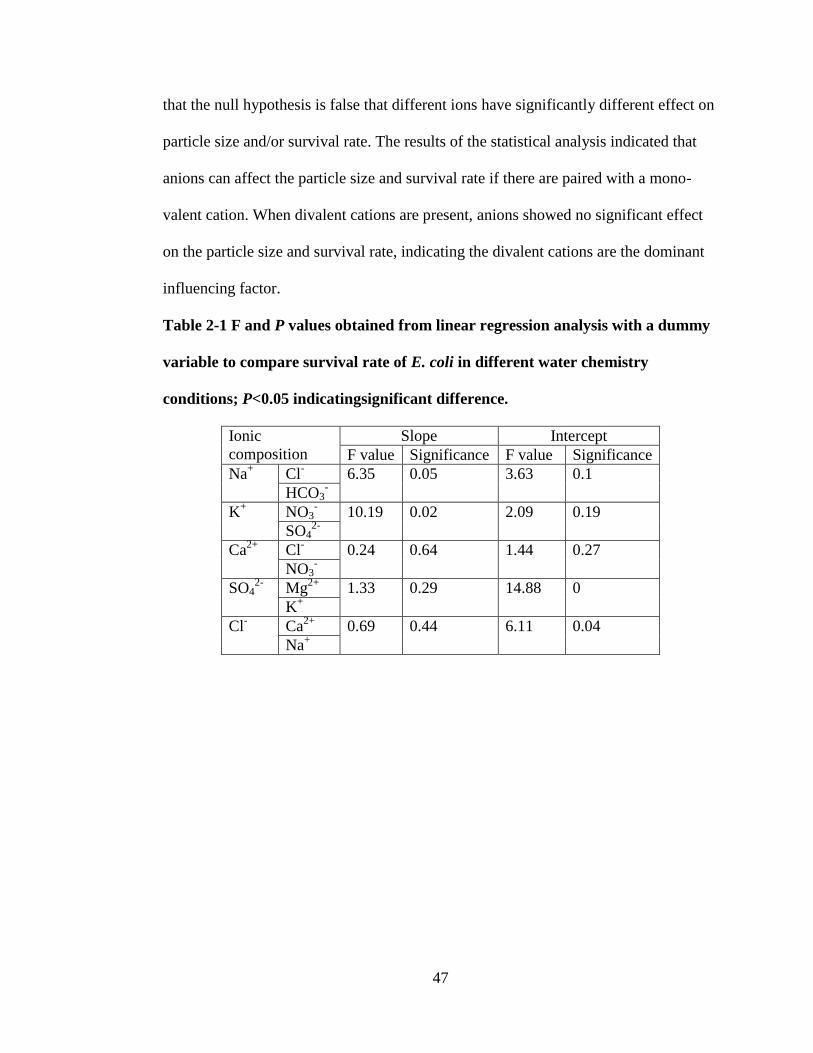
47
that the null hypothesis is false that different ions have significantly different effect on
particle size and/or survival rate. The results of the statistical analysis indicated that
anions can affect the particle size and survival rate if there are paired with a mono-
valent cation. When divalent cations are present, anions showed no significant effect
on the particle size and survival rate, indicating the divalent cations are the dominant
influencing factor.
Table 2-1 F and P values obtained from linear regression analysis with a dummy
variable to compare survival rate of E. coli in different water chemistry
conditions; P<0.05 indicatingsignificant difference.
Ionic
composition
Slope Intercept
F value Significance F value Significance
Na+ Cl
- 6.35 0.05 3.63 0.1
HCO3-
K+ NO3
- 10.19 0.02 2.09 0.19
SO42-
Ca2+
Cl- 0.24 0.64 1.44 0.27
NO3-
SO42-
Mg2+
1.33 0.29 14.88 0
K+
Cl- Ca
2+ 0.69 0.44 6.11 0.04
Na+

48
Table 2-2 F and P valuesobtained from linear regression analysis with a dummy
variable to compare particle sizes of AgNP in different water chemistry
conditions; P<0.05 indicating significant difference.
Ionic
composition
Slope Intercept
F value Significance F value Significance
Na+ Cl
- 6.78 0.040 1.07 0.34
HCO3-
K+ NO3
- 13.31 0.01 0.46 0.52
SO42-
Ca2+
Cl- 0.22 0.66 0.36 0.57
NO3-
SO42-
Mg2+
167.80 0 7.15 0.03
K+
Cl- Ca
2+ 7.57 0.03 1.06 0.34
Na+
The antimicrobial performance of AgNP has been related to the collision
frequency between bacteria and AgNP [32]. Other studies suggested that the
antimicrobial performance is size-dependent [16, 29, 33]. Smaller particles can more
easily attach to and penetrate the cell membrane compared to larger particles,
damaging the cell membrane by impairing its permeability and respiration [8, 19, 29,
34]. Morones et al. [29] indicated that AgNP with a diameter smaller than 10 nm were
able to interact with E. coli and Pseudomonas aeruginosa [29]. However, Xu et al.
[35] observed that AgNP with a particle size up to 80 nm could also accumulate inside
Pseudomonas aeruginosa cells [35]. In this study, we proposed that the disinfection
performance of AgNP is size-dependent as shown in Figure 2-8. Survival rate of
Escherichia coli (E. coli) and average size of AgNP showed a strong correlation that
can be fitted to a saturation type curve, reaching a survival plateau around 20%
survival at average particle size of 200 nm. However, it should be noticed that low

49
survival rates are achieved (about 20%) even at large particle sizes (200nm <
X<1000nm). This is could be because the presence of Ca2+
and Mg2+
could promote
the formation of ion bridges between the negatively charged AgNP and the
lipopolysaccharide molecules on the cell membrane. This interaction could decrease
the electrostatic repulsion and enhance the aggregation of AgNP with E. coli [21]. The
AgNP-E. coli aggregates can impair the permeability of the cell membrane, causing
membrane leakage and cell death. In addition, particle size distribution showed that
the sizes of AgNP in divalent cationic solutions were monodispersed, with few small
nanoparticles capable to penetrate the cell membrane. Therefore, our results showed
that the AgNP-E. coli interaction played a major role in the antimicrobial activity in
divalent cationic solutions.
In our study, the levels of silver ions detected did not significantly contribute to
the overall disinfection performance. Low concentration of silver ions (5.9-18.8 ppb)
and high concentration of E. coli (109 CFU/ml) could explain the observed
phenomena. Other studies, such as Choi et al. [2] reported 100% inhibition of E. coli
PHL628-gfp with concentration of silver ions of 0.5 mg/L. Jin et al. [21] reported an
IC50 of 0.1 mg/L to 50 mg/L for Gram-negative bacteria Pseudomonas putida (initial
concentration: 108 cells/ml) [21]. Suresh et al. [31] indicated that the concentration of
0.48 mg/L Ag+ released from AgNP (initial concentration: 100 mg/L) had no
significant effect on E. coli (initial concentration: 105 CFU/ml) [31].
ROS generation has been proposed to be one of the AgNP antimicrobial
mechanisms [36]. Recent studies revealed that AgNP in dark conditions (the same
conditions as in our experiments) cannot produce ROS. In natural light conditions,

50
ROS generated by AgNP exhibited no relationship with intracellular ROS
concentration and bacterial inhibition [37, 38]. Simon-Deckers et al. [38] also showed
that ROS production did not correlate with their observed antimicrobial activity.
Instead, they suggested that the antimicrobial activity of AgNP is due to the impaired
cell membrane [38]. Our experiments were performed in dark conditions; therefore,
ROS contribution to the disinfection processes could be considered negligible.
Conclusively, this study suggests several implications. (1) The antimicrobial
performance of AgNP is mainly size-dependent. (2) Aggregation of AgNP depends on
the ions at different water chemistry conditions. Divalent cations can significantly
enhance the aggregation while mono-valent and anions do not have such significant
influence. (3) Silver ionic release exhibited negligible contributions to the
antimicrobial activity of AgNP in this study.

51
REFERENCE
1. Tiwari, D.K., J. Behari, and P. Sen, Application of nanoparticles in waste
water treatment. World Applied Sciences Journal, 2008. 3: p. 417-433.
2. Choi, O., et al., The inhibitory effects of silver nanoparticles, silver ions, and
silver chloride colloids on microbial growth. Water Res, 2008. 42(12): p.
3066-3074.
3. Carlson, C., et al., Unique cellular interaction of silver nanoparticles: Size-
dependent generation of reactive oxygen species. J. phys. Chem, 2008. 112: p.
13608-13619.
4. Gurunathan, S., et al., Biosynthesis, purification and characterization of silver
nanoparticles using Escherichia coli. Colloids Surf B Biointerfaces, 2009.
74(1): p. 328-335.
5. Pradeep, T. and Anshup, Noble metal nanoparticles for water purification: A
critical review. Thin Solid Films, 2009. 517(24): p. 6441-6478.
6. Liu, J. and R.H. Hurt, Ion release kinetics and particle persistence in aqueous
nano-silver colloids. Environ. Sci. Technol., 2010(44): p. 2169-2175.
7. Feng, Q.L., et al., A mechanistic study of the antibacterial effect of silver ions
on Escherichia coli and staphylococcus aureus. J. Biomed. Mater., 2000. 52(4):
p. 662-668.
8. Sondi, I. and B. Salopek-Sondi, Silver nanoparticles as antimicrobial agent: a
case study on E. coli as a model for Gram-negative bacteria. J. Colloid
Interface Sci., 2004. 275(1): p. 177-182.

52
9. Navarro, E., et al., Toxicity of silver nanoparticles to Chlamydomonas
reinhardtii. Environ Sci Technol, 2008. 42: p. 8959-8964.
10. Cumberland, S.A. and J.R. Lead, Particle size distributions of silver
nanoparticles at environmentally relevant conditions. J. Chromatogr. A, 2009.
1216(52): p. 9099-9105.
11. Hamasaki, T., et al., Kinetic analysis of superoxide anion radical-scavenging
and hydroxyl radical-scavenging activities of platinum nanoparticles.
Langmuir, 2008. 24: p. 7354-7364.
12. Lok, C., et al., Silver nanoparticles: Partial oxidation and antibacterial
activities. J. Biol. Inorg. Chem., 2007. 12: p. 527-534.
13. Watts, R.J., et al., Comparative toxicity of hydrogen peroxide, hydroxyl
radicals, and superoxide anion to Escherichia coli. Advances in
Environmental Research, 2003. 7(4): p. 961-968.
14. Park, M.V., et al., The effect of particle size on the cytotoxicity, inflammation,
developmental toxicity and genotoxicity of silver nanoparticles. Biomaterials,
2011. 32(36): p. 9810-9817.
15. Ju-Nam, Y. and J.R. Lead, Manufactured nanoparticles: an overview of their
chemistry, interactions and potential environmental implications. Sci Total
Environ, 2008. 400(1-3): p. 396-414.
16. Panacek, A., et al., Silver colloid nanoparticles: synthesis, characterization
and their antibacterial activity. J. Phys. Chem. C, 2006. 110: p. 16248-16253.
17. Nowack, B. and T.D. Bucheli, Occurrence, behavior and effects of
nanoparticles in the environment. Environ Pollut, 2007. 150(1): p. 5-22.

53
18. Tolaymat, T.M., et al., An evidence-based environmental perspective of
manufactured silver nanoparticle in syntheses and applications: a systematic
review and critical appraisal of peer-reviewed scientific papers. Sci Total
Environ, 2010. 408(5): p. 999-1006.
19. Rai, M., A. Yadav, and A. Gade, Silver nanoparticles as a new generation of
antimicrobials. Biotechnol Adv, 2009. 27(1): p. 76-83.
20. Gao, J., et al., Dispersion and toxicity of selected manufactured nanomaterials
in natural river water samples: effects of water chemical composition. Environ
Sci Technol, 2009. 43: p. 3322-3328.
21. Jin, X., et al., High-through screening of silver nanoparticle stability and
bacterial inactivation in aquatic media: Influence of specific ions. Environ Sci
Technol, 2010. 44: p. 7321-7328.
22. Hoecke, K.V., et al., Aggregation and ecotoxicity of CeO2 nanoparticles in
synthetic and natural waters with variable pH, organic matter concentration
and ionic strength. Environmental Pollution, 2011. 159: p. 970-976.
23. Bui, T.X. and H. Choi, Influence of ionic strength, anions, cations, and natural
organic matter on the adsorption of pharmaceuticals to silica. Chemosphere,
2010. 80(7): p. 681-686.
24. Liu, Y. and R. Guo, The interaction between casein micelles and gold
nanoparticles. J Colloid Interface Sci, 2009. 332(1): p. 265-269.
25. Fabrega, J., et al., Silver nanoparticle impact on bacterial growth: effect of pH,
concentration, and organic matter. Environ Sci Technol, 2009. 43: p. 7285-
7290.

54
26. Oyanedel-Craver, V.A. and J.A. Smith, Sustainable colloidal-silver-
impregnated ceramic filter for point-of-use water treatment. Environ. Sci.
Technol., 2008. 42: p. 927-933.
27. Vigeant, M.A., et al., Reversible and irreversible adhesion of motile
Escherichia coli cells analyzed by total internal reflection aqueous
fluorescence microscopy. Appl. Environ. Microbiol., 2002. 68: p. 2794-2801.
28. Tzoris, A., V. Fernandez-Perez, and E.A.H. Hall, Direct toxicity assessment
with a mini portable respirometer. Sensors and Actuators B: Chemical, 2005.
105(1): p. 39-49.
29. Morones, J.R., et al., The bactericidal effect of silver nanoparticles.
Nanotechnology, 2005. 16(10): p. 2346-2353.
30. Elimelech, M., et al., Particle Deposition and Aggregation: Measurement,
Modelling and Simulation. 1995, Oxford, England: Butterworth-Heinemann.
31. Suresh, A.K., et al., Silver nanocrystallites: Biofabrication using Shewanella
oneidensis, and an evaluation of their comparative toxcity on Gram-negative
and Gram-positive bacteria. Environ Sci Technol, 2010. 44: p. 5210-5215.
32. Dror-Ehre, A., et al., Silver nanoparticle-E. coli colloidal interaction in water
and effect on E. coli survival. J Colloid Interface Sci, 2009. 339(2): p. 521-526.
33. Zook, J.M., et al., Stable nanoparticle aggregates/agglomerates of different
sizes and the effect of their size on hemolytic cytotoxicity. Nanotoxicology,
2011. 5: p. 517-530.

55
34. Sharma, V.K., R.A. Yngard, and Y. Lin, Silver nanoparticles: green synthesis
and their antimicrobial activities. Adv Colloid Interface Sci, 2009. 145(1-2): p.
83-96.
35. Xu, X., et al., Real-time probing of membrane transport in living microbial
cells using single nanoparticle optics and living cell imaging. Biochemistry,
2004. 43: p. 10400-10413.
36. Kim, J.S., et al., Antimicrobial effects of silver nanoparticles. Nanomedicine,
2007. 3(1): p. 95-101.
37. Choi, O. and Z. Hu, Size dependent and reactive oxygen species related
nanosilver toxicity to nitrifying bacteria. Environ Sci Technol, 2008. 42: p.
4583-4588.
38. Simon-Deckers, A., et al., Size-, composition- and shape-dependent
toxicological impact of metal oxide nanoparticles and carbon nanotubes
toward bacteria. Environ Sci Technol, 2009. 43: p. 8423-8429.

56
CHAPTER 3
THE EFFECT OF NATURAL WATER CONDITIONS ON THE ANTI-
BACTERIAL PERFORMANCE AND STABILITY OF SILVER
NANOPARTICLES CAPPED WITH DIFFERENT POLYMERS
By
Hongyin Zhang1, James Smith
2, and Vinka Oyanedel-Craver
1*
is published in Water Research, 46, 691-699
1Department of Civil and Environmental Engineering, University of Rhode Island,
Bliss Hall 213, Kingston, RI 02881
2Department of Civil and Environmental Engineering, University of Virginia,
Thornton Hall, Charlottesville, VA 22904

57
1 Abstract
This study evaluated the effect of natural water composition onto the bactericidal
and physicochemical properties of silver nanoparticles (AgNP) stabilized with three
different polymeric compounds.
All the nanoparticles behaved similarly in the water conditions tested. Compared
to solutions with low organic matter content and monovalent ions, lower disinfection
performances of AgNP suspensions were obtained in the following order seawater ≤
high organic matter content water ≤ high divalent cations content synthetic water.
Suspension of AgNP in seawater and water with divalent cations (Ca2+
and Mg2+
)
formed larger AgNP aggregates (less than 1400 nm) compared to other solutions
tested (up to approximately 38 nm). The critical coagulation concentration (CCC) of
AgNP was determined to quantitatively evaluate the stability of the nanoparticle
suspension in different water conditions. When the concentration of dissolved organic
matter was increased from 0 mg/L to 5 mg/L, the CCC increased by a factor in the
range of 2.19±0.25 for all AgNP in divalent solutions, but a smaller increase occurred,
in the range of 1.54±0.21 fold, when monovalent solutions were used.
The concentration of ionic silver released indicated that the dissolved Ag+ (3.6 -
48.2 ppb) was less than 0.5% of the total mass of Ag0 added. At all the conditions
tested, the concentration of silver ions in solution had a negligible contribution to the
overall anti-bacterial performance of AgNP.
This study demonstrated that the anti-bacterial performance of AgNP at selected
natural water conditions decreases in the presence of dissolved natural organic matter
or divalent ions, such as humic acid and calcium carbonate. These results may be

58
helpful in understanding the toxicity of AgNP in various natural water conditions and
in explaining the risk associated with discharging AgNP in natural aquatic systems.
2 Introduction
Nanotechnology is an emerging and fast-developing technology. There are more
than 1,300 nanotechnology based consumer products according to the Woodrow
Wilson center in 2011 [1]. Among these nanoproducts, silver nanoparticles (AgNP)
accounted for more than 23% of total applications of nanomaterials.
AgNP are of great interest because of their chemical catalytic ability, stability and
antimicrobial properties [2, 3]. AgNP are introduced into consumer products, it is
unavoidable that AgNP will be released into the natural water bodies [4]. Therefore,
the fate and reactivity of these nanoparticles at different water chemistry conditions is
essential to elucidate their impacts in microorganism commonly found in different
water ecosystems.
AgNP can be synthesized using physical or chemical methods. Sharma et al.
introduced the Tollens method, which involves the reduction of Ag(NH3)2+ in the
aqueous phase by an aldehyde (usually saccharides). Different stabilizing agents, such
as sodium citrate, some surfactant and polymers are used to create a stable dispersion
of AgNP in liquid solutions [2].
Critical coagulation concentration (CCC) is defined as the minimum amount of
electrolyte that is required to completely destabilize a suspension. This parameter is
frequently used to measure the stability of nanosuspensions since it quantify the
minimum amount of electrolyte solutions that is required to destabilize the
nanoparticle suspension [5]. Compared to ―naked‖ AgNP, AgNP coated with

59
polymers have shown higher stability [5, 6]. Huynh and Chen, [5] found that the CCC
value of AgNP coated with PVP is more than two folds and four folds higher than the
value obtained for AgNP coated with sodium citrate [5] and ―naked‖ AgNP,
respectively [6]. While many researchers have manufactured and used AgNP
stabilized with different compounds, only few research studies have compared their
disinfection performance and stability (in terms of particle size and ξ-potential) using
natural water conditions [7, 8].
For the purposes of this work, we selected casein, dextrin, and PVP-stabilized
AgNP. Commercially available AgNP coated with casein was selected because casein
because of their extensive application in point-of-use ceramic water filters [9, 10],
therefore their performance and stability at natural water conditions is of great interest.
PVP coating was selected because they are considered to be environmentally-friendly
stabilizers and because other researchers have used them to conduct AgNP
characterization and anti-microbial activity tests [2, 11]. Few studies have synthesized
silver nanoparticles using dextrin as a coating agent and studied the antibacterial
activity and physicochemical properties of the coated nanoparticles [12]. In this study,
AgNP coated with casein, PVP and dextrin were used to examine the influence of
different natural water conditions on the physicochemical characteristics of the
particles and their antibacterial performance. Synthetic water conditions were also
studied to isolate the effects of different ions and organic compounds on the
disinfectant performance of AgNP.
3 Materials and methods

60
A non-pathogenic, wild strain of E. coli provided by IDEXX laboratories was
used for bacteria disinfection experiments. E. coli was selected because of its use as a
specific indicator of fecal contamination in drinking water and because of its extensive
use in several studies on AgNP [9, 13, 14]. Determination of the E. coli concentration
was performed using the membrane filtration technique, applying m-FC with Rosolic
Acid Broth (Millipore) and 24-h incubation at 44.5 0C. Details regarding growth and
stock solutions preparation can be found in the Appendix B.
Commercial AgNP (70.37% w/w Ag0) stabilized with casein (AgNP-casein) were
obtained from Argenol laboratories. AgNP stabilized with dextrin (dextrin from maize
starch, average molecular weight: 1,670 g/mol, Sigma Aldrich) (AgNP-dextrin) and
polyvinylpyrrolidone, (PVP, average molecular weight: 29,000 g/mol, Sigma Aldrich)
(AgNP-PVP) were prepared via the Tollens method described by Kvitek et al. [15]
with minor modifications, i.e., 0.35 wt% for both dextrin and PVP were added as
stabilizers, respectively [15].The resultant concentrations of AgNP in the cell were
measured as total silver using ICP-MS (X series, Thermo Elemental). Transmission
Electron Microscopy (TEM) observations of the AgNP were performed with a
transmission electron microscope (JEM-2100 TEM). The surface charge and average
size of the AgNP in different water conditions were determined in triplicate with
dynamic light scattering (DLS) using a Zetasizer (Nano ZS, ZEN 3600, Malvern) at 25
0C.
Critical coagulation concentration (CCC) refers to the concentration of the
counter ions in an electrolyte solution that could completely eliminate the surface
charge of particles so that the energy barrier to aggregation is removed, resulting in
61
rapid aggregation. CCC values were determined to evaluate the aggregation of AgNP
in the different electrolyte solutions. CCC was calculated according to Huynh and
Chen, [5]. (For the detailed procedure, see the Appendix B)
Different water samples and synthetic water solutions with monovalent salts,
divalent salts, and humic acid were prepared. Bacteria deactivation batch tests were
performed in duplicate using manometric respirometric equipment (OxiTop control
system, WTW Weilheim, Germany). An OxiTop control system includes a sample
bottle sealed with a measuring head, a small container for CO2 absorbent fixed at the
neck of the bottle, and an OxiTop controller for data recording. The test was based on
automated pressure measurements conducted via piezoresistive electronic pressure
sensors in a closed bottle at constant temperature.
Silver ions released in each batch test concentration were measured after 20 h by
passing a sample through the same ultrafiltration membrane used for the cleaning and
concentration of the nanoparticle solutions. Concentrations of silver ions as total silver
in the percolate were measured using ICP-MS (X series, Thermo Elemental). Silver
nitrate (ACS reagent grade) was used to compare the anti-microbial activity between
AgNP and silver ions.
Figure 3-1 shows the flowchart of the major technique procedures used in this
study. The experimental data obtained in this study was analyzed using SPSS 18.0.
Bivariate correlation matrix among different factors (i.e., silver ion release, Cl-
concentration, divalent cation concentration) was established using bivariate
correlation function.

62
Figure 3-1 Flowchart of the major techniques used in this study.
4 Results and discussion
4.1 Characterization of AgNP
The shape and sizes of AgNP in DI water were determined by TEM. All three
AgNP were spherical, which has been reported in other studies using the same
manufacturing methods [15]. AgNP aggregates were observed in all TEM images.
Average particle sizes of AgNP-casein, AgNP-dextrin, and AgNP-PVP measured
using DLS were larger than those determined by TEM (Table B-2). The discrepancy is
likely due to the formation of AgNP aggregates, as shown in the TEM images.In
addition, DLS measurements are volume-squared weighted distributions. Compared to
TEM size measurements, they can be influenced by nanoparticle aggregates in
different water chemistries.

63
4.2 Effect of different water conditions on the characteristics of the AgNP
Figures 3-2 and 3-3 and Table B-3 (Appendix B) present the sizes and CCC
values of AgNP for different water conditions. The largest aggregates were formed in
the seawater, CaCl2, and MgCl2solutions which contain high concentration of divalent
cations. Interestingly, sizes of AgNP in brackish water were smaller than those in
ground water despite the higher concentration of divalent cations in the brackish
water. This could be explained by the absorption of NOM, present in a relatively high
concentration in brackish water, onto the surface of the nanoparticles, creating steric
repulsion forces against aggregation and thus increasing the colloidal stability of the
nanoparticles [8].
The data obtained from the CCC measurements (Figure 3-3) shows that (i) CCC
values from divalent electrolyte solution were more than an order of magnitude higher
than those in monovalent salt solution; (ii) the presence of NOM can increase the CCC
values by up to 2.2 folds; (iii) AgNP-PVP shows the highest colloidal stability
followed by AgNP-casein and AgNP-dextrin. The above-mentioned observations well
supported the nanoparticle size measurements in Figure 3-2. Firstly, Shulze-Hardy
rule indicates that the stability of a colloidal system is extremely sensitive to the
valence of the counter-ions present in the solution. Therefore, the high concentrations
of divalent cations (Table B-1) present in CaCl2, MgCl2 solutions and seawater can
promote AgNP aggregation. Similar results were found for AgNP that were ―naked‖
and coated with citrate or PVP [5, 6]. Figure 3-3 and Table A3 also provide evidence
that CCC could be increased by the addition of humic acid, model NOM in this study.
Similarly, previous studies showed that NOM could reduce aggregation and increase

64
CCC values of AgNP coated with citrate and PVP in different water chemistry
conditions [5, 6]. However, Li et al. [6] using fulvic acid did not observe this trend.
The discrepancy could be due to the fact that fulvic acid molecules are smaller than
humic acid molecules [6].
Our study showed that the CCC values of AgNP with different coatings in all
water conditions followed the same trend i.e., AgNP-PVP>AgNP-casein>AgNP-
dextrin. It is proposed that the binding force of different atoms in the stabilizers on the
surface of the AgNP plays an important role in the stability of AgNP [8]. Nitrogen
atoms in PVP are more strongly bonded on the surface of AgNP in comparison with
oxygen atoms in dextrin [8]. Casein includes both strong nitrogen atom bonds and
weak oxygen atom bonds onto the nanoparticles [16]. Stronger binding forces could
ensure a stronger attachment of the stabilizers on the surfaces of the AgNP, precluding
substitution by other ions or polymers [15].
In addition, a steric repulsion effect can also influence the aggregation behavior.
Long polymer chains may form complex steric configurations, thus increasing the
repulsion force between nanoparticles [17, 18]. In our study, the length of the
stabilizer chains were in the following order: PVP (MW polymer: 29,000; MW of
monomer: 111) > dextrin (MW polymer: 1,670; MW monomer: 162). Therefore, the
length of the stabilized chain could have an important effect on the stability of the
AgNP for all of the natural and synthetic water conditions tested. Casein has a
complicated molecular formula, and it is likely that the intricate steric configurations
and the electrostatic effect of the casein proteins contributed to its stabilizing effect
[19].

65
Figure 3-2 Plot of hydrodynamic particle sizes of all three AgNP in different
water conditions. Incubation time: 20h, temperature: 25 oC, AgNP concentration
in each sample: 11.5 mg/L. Labels on the x axis: DI (DI water), ground (ground
water obtained in University of Rhode Island), surface (Thirty Acre pond water),
Brackish (Brackish water in Card ponds), Sea (Seawater), Mg2+
(1,000 mg/L as
Mg2+
in MgCl2 solution), Ca2+
(1,000 mg/L as Ca2+
in CaCl2 solution), Na+ (1,000
mg/L as Na+ in NaCl solution), HA (TOC=5 mg/L humic acid solution).

66
Figure 3-3 Attachment efficiencies of AgNP in different water conditions. (a)
Attachment efficiencies of AgNP in different concentrations of CaCl2 solutions in
the absence and presence of HA. CaCl2 concentrations: 100-8,000 mg/L; Humic
acid concentration: 5 mg/L as TOC. (b) Attachment efficiencies of AgNP in
different concentrations of NaCl solutions in the absence and presence of HA.
Na+ concentrations: 4,000-80,000 mg/L; Humic acid concentration: 5 mg/L as
TOC. AgNP concentration in all water conditions: 11.5 mg/L.
4.3 ξ-potentials of AgNP and E. coli in different water conditions
ξ-potential relates to the stability of the colloidal systems. Its value (negative or
positive) indicates the degree of repulsion between adjacent or charged particles in a
colloidal system. As Figure 3-4 (a) shows, AgNP had negative ξ-potentials for all
water conditions tested, which is attributed to the adsorption of various anions onto the

67
surfaces of the AgNP. Our values were smaller compared to those obtained by Jin et
al. , who found that the ξ-potentials of AgNP at different fixed ionic strength solutions
(5.6 mM) ranged from -10 mV to -60 mV and that, with the addition of divalent
cations to the solutions, the range decreased to -10 mV to -40 mV. A different surface
modification of the nanoparticles and, in our case, the higher concentration of
electrolyte can explain the difference in the results. However, both studies showed that
the attractive interaction between divalent cations and negatively charged AgNP led to
more extensive aggregation and larger particles.
Figure 3-4 (b) shows that the absolute ξ-potential values for E. coli in different
water conditionswere lower than those for AgNP solutions. Divalent cations were
more likely to be adsorbed to the E. coli membrane, reducing the absolute ξ-potential
values. Consequently, less electrostatic repulsion was produced when AgNP were
mixed with the bacteria in solutions containing divalent cations, facilitating the
interaction of the AgNP and the bacteria, thereby decreasing the survival rate of the E.
coli.

68
Figure 3-4 Plot of ξ-potential of AgNP (a) and E. coli (b) in the different water
conditions. Incubation time: 20h, temperature: 25 oC, AgNP concentration in (a):
11.5 mg/L. E. coli concentration in (b): 1010
CFU/ml. The concentrations of the
ions are listed in Table S1. Labels on the x axis: DI (DI water), ground (ground
water obtained in University of Rhode Island), surface (Thirty Acre pond water),
Brackish (Brackish water in Card ponds), Sea (Seawater), Mg2+
(1,000 mg/L as
Mg2+
in MgCl2 solution), Ca2+
(1,000 mg/L as Ca2+
in CaCl2 solution), Na+ (1,000
mg/L as Na+ in NaCl solution), HA (TOC=5 mg/L humic acid solution).
4.4 Silver ion release in different water conditions
The release of silver ions (Figure 3-5) measured during the tests was less than
0.5% of the total mass of the silver added as AgNP (3.6 - 48.2 ppb). Discrepancies in
the silver ion release have been found in previous studies. Liu and Hurt, [20] reported
that the silver ion release of AgNP (initial concentration of 0.05 mg/L) in seawater

69
(ionic strength: 0.7 M) and deionized (DI) water after 24 h was 20 wt% and 50 wt%,
respectively [20]. However, percentages below 1% also have been obtained under
conditions similar to those used in this study [7, 21]. In this study, the silver ion
release was sensitive to different water chemistries. It was previously reported that Cl-
may co-precipitate Ag+ by forming AgCl, and NOM could coat the AgNP surface
rapidly and inhibit AgNP dissociation [7, 21]. This could explain why silver ion
release in water conditions with high Cl- and NOM content is small. The lowest silver
ion release was found in the humic acid solution. Since the TOC concentration in the
humic acid solution was similar to the TOC concentrations found in natural water, the
low ion release in humic acid solution may be attributed to the difference between
humic acid and other NOM species in natural waters. To determine the contribution of
the released silver ions to the overall disinfection performance of the AgNP, several
AgNO3 solutions were prepared, ranging from 1 to 50 ppb (as Ag+). The survival rate
of E coli was determined by the manometric respirometric method mentioned earlier.
At all the concentrations tested, no significant disinfection efficacy was observed
(Figure A2). Similarly, Suresh et al. [21] indicated that a concentration of 0.48 mg
Ag+/L released from AgNP (initial concentration: 100 mg/L) had no significant effect
on E. coli when he used an initial concentration of 105 CFU/mL [21]. Fabraga et al.
[22] indicated that 2-20 ppb of silver ion showed negligible antimicrobial property.
The results we obtained likely can be attributed to the low silver ion concentrations at
these water conditions and the high E. coli concentration used (1010
CFU/mL) [22].
The fact that silver ion concentrations were low and that they made a negligible
contribution to the overall anti-microbial effect do not imply that silver release did not

70
occur. Most likely, due to the high concentration of Cl-, silver released from the
nanoparticles formed AgCl, which was precipitated. Additionally, although some
previous studies reported high bactericidal properties for silver ions [13, 15], however,
microbial growth-based methods were use the antibacterial properties of the AgNP.
The growth-based methods measure the bacteriostatic effect of the nanoparticles,
while the respirometric respiration method (used in this study) measures the total
deactivation of bacteria. Therefore, it is likely that at similar concentration of AgNP,
respirometry based methods will show a lower activity than growth-based methods
since the bacteria could have lost their capacity to replicate, while maintaining some
(or full) metabolic activity.

71
Figure 3-5 Silver ionic release in different water conditions. Incubation time: 20h,
temperature: 25 oC, AgNP concentration in each sample: 11.5 mg/L. Labels on
the x axis: DI (DI water), ground (ground water obtained in University of Rhode
Island), surface (Thirty Acre pond water), Brackish (Brackish water in Card
ponds), Sea (Seawater), Mg2+
(1,000 mg/L as Mg2+
in MgCl2 solution), Ca2+
(1,000
mg/L as Ca2+
in CaCl2 solution), Na+ (1,000 mg/L as Na
+ in NaCl solution), HA
(TOC=5 mg/L humic acid solution).
4.5 Effect of different water conditions on the disinfection performance of AgNP
Prior to assessing the disinfection performance of AgNP, the toxicities of the
three stabilizers were measured using the same respirometric method. The results
indicated that no toxicity was associated with the three stabilizers (data not shown).

72
Figure 3-6 shows the disinfection performance of the three AgNP in different
water conditions. For natural water conditions, we found a similar disinfection
behavior of AgNP in surface and brackish water. This likely occurred because of the
presence of NOM that could be adsorbed on the surface of AgNP, reducing their
toxicity by creating physical barriers between the nanoparticles and E. coli [8].
Anionic ligands, such as Cl-, also could impair the toxicity of the AgNP by reacting
with their surfaces to form AgCl, thus reducing their toxicity. Different from surface
and brackish water, AgNP in ground water had greater disinfection performance,
which likely was due to the lower NOM content. It is noteworthy that the disinfection
performance of AgNP in seawater was the lowest among all the water conditions. In
addition to the above-mentioned factors that reduce the toxicity of AgNP, the
formation of the large aggregates that were observed in seawater (Figure 3-2) may
impair their toxicity.
In synthetic electrolyte solutions, the order of the Cl- content in NaCl, CaCl2, and
MgCl2 solution was MgCl2>CaCl2>NaCl. The toxicity of AgNP should follow the
order of MgCl2<CaCl2<NaCl since Cl- content could plays a role in reducing the
toxicity (due to silver precipitation). However, the order of measured toxicity of AgNP
in the electrolyte solutions was NaCl>CaCl2≈ MgCl2. This is likely because the
bactericidal property of the AgNP could be size-dependent (Figure B-3). It is
noteworthy that the sizes of the AgNP aggregates in the CaCl2 and MgCl2 solutions
were much larger than that in the NaCl solution (Figure 3-2). This result agrees with
previously published data, suggesting that the toxicity of AgNP is size-dependent [14,
23, 24]. Smaller particles can attach to and penetrate cell membranes more easily than

73
larger particles and therefore damage the cell membrane by impairing its permeability
and interfering the respiration process [14, 23, 24]. In this study, HA solution
exhibited lower toxicity than other synthetic electrolyte solutions despite the fact that
the sizes of the AgNP in the HA solution were similar to those in the NaCl solution.
Previous studies have proposed that the low toxicity is due to the rapid coating of the
surface of AgNP by humic acid, which creates a physical barrier that impedes AgNP-
bacteria interactions and thus reduces their toxicity [8, 22].

74
Figure 3-6 Plot of disinfection performance of AgNP stabilized with casein,
dextrin and PVP in collected water samples and synthetic waters. Incubation
time: 20h, temperature: 25 oC, AgNP concentration in each sample: 11.5 mg/L.
Labels on the x axis: DI (DI water), ground (ground water obtained in University
of Rhode Island), surface (Thirty Acre pond water), Brackish (Brackish water in
Card ponds), Sea (Seawater), Mg2+
(1,000 mg/L as Mg2+
in MgCl2 solution), Ca2+
(1,000 mg/L as Ca2+
in CaCl2 solution), Na+ (1,000 mg/L as Na
+ in NaCl solution),
HA (TOC=5 mg/L humic acid solution).
The statistical analysis showed that Cl- concentration, divalent cation
concentration, NOM concentration and silver ion release are significantly correlated

75
with the antibacterial activity of AgNP (Table B-4). We propose that a combination of
the above-mentioned factors is responsible for the disinfection performance of AgNP.
Table B-4 and Table B-5 show the correlation analysis for all the conditions
tested and water conditions without NOM, respectively. When NOM is included in
the analysis no correlation between size and antibacterial activity was obtained.
However, when NOM-containing water conditions were removed from the analysis,
the bactericidal effect of AgNP is significantly correlated with particle size (Table B-
5).
5 Conclusions
Several conclusions can be drawn from the results of this study, i.e., (i) the anti-
microbial performance of AgNP is mainly particle size-dependent in absence of NOM,
and NOM can mitigate the toxicity of AgNP; (ii) the aggregation of AgNP depends on
the ions and NOM at different water conditions; divalent cations can significantly
enhance the aggregation; and (iii) the silver ion release level that was detected made a
negligible contribution to the anti-microbial activity of AgNP at the experimental
conditions we evaluated. The results showed that AgNP are very active at all the water
chemistry conditions tested but their bactericidal property could be impaired by the
HA content of such waters. Water that contains high divalent cation concentrations
also could reduce the bactericidal properties of AgNP due to the formation of large
AgNP aggregates and consequently precipitation. Finally, this study clearly
demonstrated the complexity of the interactions of AgNP with different dissolved and
particulate species that commonly are found in natural waters and the need for

76
standardized methodologies to evaluate the performance and impacts of these
nanomaterials.

77
REFERENCE
1. Woodrow Wilson Center. 2011; Available from:
http://www.nanotechproject.org/inventories/consumer/analysis_draft/.
2. Sharma, V.K., R.A. Yngard, and Y. Lin, Silver nanoparticles: green synthesis
and their antimicrobial activities. Adv Colloid Interface Sci, 2009. 145(1-2): p.
83-96.
3. Tolaymat, T.M., et al., An evidence-based environmental perspective of
manufactured silver nanoparticle in syntheses and applications: a systematic
review and critical appraisal of peer-reviewed scientific papers. Sci Total
Environ, 2010. 408(5): p. 999-1006.
4. Colvin, V.L., The potential environmental impact of engineered
nanomaterials. Nature Biotechnol., 2003. 21: p. 1166-1170.
5. Huynh, K.A. and K.L. Chen, Aggregation kinetics of citrate and
polyvinylpyrrolidone coated silver nanoparticles in monovalent and divalent
electrolyte solutions. Environ Sci Technol, 2011. 45(13): p. 5564-5571.
6. Li, X., J.J. Lenhart, and H.W. Walker, Dissolution-accompanied aggregation
kinetics of silver nanoparticles. Langmuir, 2010. 26(22): p. 16690-16698.
7. Jin, X., et al., High-through screening of silver nanoparticle stability and
bacterial inactivation in aquatic media: Influence of specific ions. Environ Sci
Technol, 2010. 44: p. 7321-7328.
8. Gao, J., et al., Dispersion and toxicity of selected manufactured nanomaterials
in natural river water samples: effects of water chemical composition. Environ
Sci Technol, 2009. 43: p. 3322-3328.

78
9. Oyanedel-Craver, V.A. and J.A. Smith, Sustainable colloidal-silver-
impregnated ceramic filter for point-of-use water treatment. Environ. Sci.
Technol., 2008. 42: p. 927-933.
10. Kallman, E., V. Oyanedel-Craver, and J. Smith, Ceramic Filters Impregnated
with Silver Nanoparticles for Point-of-Use Water Treatment in Rural
Guatemala. Journal of Environmental Engineering, 2011. 137: p. 407-415.
11. Rai, M., A. Yadav, and A. Gade, Silver nanoparticles as a new generation of
antimicrobials. Biotechnol Adv, 2009. 27(1): p. 76-83.
12. Patakfalvi, R., et al., Synthesis and direct interactions of silver colloidal
nanoparticles with pollutant gases. Colloid and Polymer Science, 2008. 286: p.
67-77.
13. Choi, O., et al., The inhibitory effects of silver nanoparticles, silver ions, and
silver chloride colloids on microbial growth. Water Res, 2008. 42(12): p.
3066-3074.
14. Morones, J.R., et al., The bactericidal effect of silver nanoparticles.
Nanotechnology, 2005. 16(10): p. 2346-2353.
15. Kvitek, L., et al., Effect of surfactants and polymers on stability and
antibacterial activity of silver nanoparticles (NPs). J. Phys. Chem. C, 2008.
112: p. 5825-5834.
16. Manno, D., et al., Synthesis and characterization of starch-stabilized Ag
nanostructures for sensors applications. Journal of Non-Crystalline Solids,
2008. 354(52-54): p. 5515-5520.

79
17. Chen, K.L., et al., Assessing the colloidal properties of engineered
nanoparticles in water: case studies from fullerene C60 nanoparticles and
carbon nanotubes. Environmental Chemistry, 2010.
18. Elimelech, M., et al., Particle Deposition and Aggregation: Measurement,
Modelling and Simulation. 1995, Oxford, England: Butterworth-Heinemann.
19. Liu, Y. and R. Guo, The interaction between casein micelles and gold
nanoparticles. J Colloid Interface Sci, 2009. 332(1): p. 265-269.
20. Liu, J. and R.H. Hurt, Ion release kinetics and particle persistence in aqueous
nano-silver colloids. Environ. Sci. Technol., 2010(44): p. 2169-2175.
21. Suresh, A.K., et al., Silver nanocrystallites: Biofabrication using Shewanella
oneidensis, and an evaluation of their comparative toxcity on Gram-negative
and Gram-positive bacteria. Environ Sci Technol, 2010. 44: p. 5210-5215.
22. Fabrega, J., et al., Silver nanoparticle impact on bacterial growth: effect of pH,
concentration, and organic matter. Environ Sci Technol, 2009. 43: p. 7285-
7290.
23. Zook, J.M., et al., Stable nanoparticle aggregates/agglomerates of different
sizes and the effect of their size on hemolytic cytotoxicity. Nanotoxicology,
2011. 5: p. 517-530.
24. Sondi, I. and B. Salopek-Sondi, Silver nanoparticles as antimicrobial agent: a
case study on E. coli as a model for Gram-negative bacteria. J. Colloid
Interface Sci., 2004. 275(1): p. 177-182.

80
CHAPTER 4
ANTIVIRAL EFFECT OF SILVER NANOPARTICLES IN DIFFERENT
WATER CHEMISTRY CONDITIONS
By
Hongyin Zhang and Vinka Oyanedel-Craver*
is in preparation to submit to Water Research
Department of Civil and Environmental Engineering, University of Rhode Island,
Bliss Hall 213, Kingston, RI 02881
81
1 Abstract
In this study, the effect of different water chemistry conditions on the antiviral
performance of silver nanoparticles (AgNP) stabilized with commonly used
compounds sodium citrate (cit) and polyvinylpyrrolidone (PVP) has been evaluated.
Particle size, aggregation kinetics, and zeta potentials of both silver nanoparticles and
MS2 bacteriophage were measured. It was found that both nanoparticles and MS2
virus behaved similarly in the water conditions tested. The antiviral experiment was
conducted using a double agar layer technique. The result shows that a 2-h exposure of
MS2 bacteriophage to silver nanoparticles (1 mg/L) did not affect the survival
(>88.9%) of the MS2 bacteriophage. However, a slight decrease in the virus survival
was found in aqueous solutions containing high concentration of Ca2+
. This study may
be helpful in understanding the antiviral property of AgNP in various water chemistry
conditions and in explaining the environmental risk associated with AgNP discharge
in natural aquatic systems.
2 Introduction
Silver nanoparticles (AgNP) have a wide range of applications especially as an
antimicrobial agent. It is estimated that AgNP based consumer products account for
more than 23% of the total nanomaterials impregnated products. Due to their extensive
application in industry and households, it is inevitable that AgNP will be released into
the natural aquatic systems and interact with the local microorganisms [1].
Previous studies have evaluated the toxicity of AgNP towards different
microorganisms in aquatic system. Gao et al. [2] have reported that the LC50 (µg/L) of
AgNP against Escherichia coli (E. coli) and Ceriodaphnia dubia (C. dubia) are less

82
than 112.14 and 6.18 µg/L, respectively. Zhang et al. [3] showed that the antibacterial
performance of AgNP (11.2 mg/L) ranges from 67.9-81.8% E. coli inhibition in
surface, ground, brackish, and sea water. Studies on toxicity of AgNP against other
microorganisms such as Staphylococcus aureus [4], Leuconostoc mesenteroides [5],
Bacillus subtilis [6], Pseudomonas aeruginosa [7] were also reported. However, little
is known about the antiviral effect of AgNP. A recent study reported that AgNP
(particle size: 21 nm) could not inactivate MS2 bacteriophage in phosphate buffer
solution (PBS) even at their highest concentration (5 mg/L). Another study shows that
IC50 of AgNP on different strains of HIV-1 virus ranged from 0.19-0.91 mg/mL [8].
Three possible mechanism of antiviral effect have been proposed. Studies have
reported that the silver ion dissolved from AgNP can cause toxicity by interacting with
viral DNA or RNA and the thiol groups in capsule proteins [9] [10]. Lara et al. [9]
proposed that AgNP can inhibit the virus binding onto host cells by direct interacting
with viral particles with similar sizes. Liga et al. [10] showed virus can be inactivated
photocatalytically by AgNP doped TiO2 nanoparticles due to the generation of reactive
oxygen species (ROS).
The mechanisms proposed have associated the antiviral property of AgNP with
their physicochemical properties such as particle size and dissolution of AgNP. These
physicochemical properties vary in different water chemistry conditions. For example,
it has been widely reported that AgNP tend to aggregate in aqueous solutions
containing high concentration of divalent cations such as Ca2+
and Mg2+
[11-15]. Ionic
strength and the natural organic matter content in water can also alter the dissolution
behavior of AgNP [3, 11, 16, 17].

83
As viruses are responsible for a wide spectrum of diseases in bacteria, plants, and
animals and they play important role in aquatic food webs as active constituents of the
microbial loop [18], it is important to investigate the antiviral effect of discharged
AgNP in different water conditions to elucidate their environmental risks. However, to
the author’s knowledge, few studies have focused on this issue [8].
In this study, we selected sodium citrate and PVP stabilized AgNP because these
two stabilizers are environmentally friendly and have been used in previous research
[3, 13, 14, 16, 19-21]. These AgNP were used to examine the influence of different
natural water conditions on the physicochemical characteristics of the nanoparticles
and their antiviral property. Synthetic water conditions were studied to isolate the
effects of different ions and organic compounds on the antiviral performance of
AgNP.
3 Materials and methods
3.1 MS2 bacteriophage preparation
MS2 bacteriophage was selected as a model virus in this study because they have
been widely studied and allow us to compare the results. The ATCC 15597-B1 MS2
bacteriophage was cultured following the ATCC procedure. A tryptic soy broth
solution (TSB) containing 10 g/L Tryptone, 1 g/L yeast extract, 8 g/L NaCl was
prepared and autoclaved. Then, filter-sterilized 10 ml glucose solution (10 w/w%), 2.0
ml CaCl2 solution (1 M), and 1.0 ml Thiamine (10 g/L) was added in TSB. E. coli
(ATCC 15597) cells were grown in this Luria-Bertani medium for approximately 12 h
under incubation conditions (37 oC). The bacterial stock has a typical concentration of
108 CFU/ml. MS2 bacteriophage was propagated using a double agar layer (DAL)

84
technique. Approximately 100 µL of bacteriophage, 200 µL of host bacteria, and 5 ml
LB containing 5 g/L agar, 0.1% glucose, 2 mM CaCl2 and 0.1 mg/ml Thiamine) were
poured into plates containing 15 g/L agar. The plates were incubated at 37 oC
overnight and harvested by adding 1.0 mM NaCl solution to the surface of the plate.
The liquid was collected and centrifuged at 2000 rpm for 20 min at room temperature
and the supernatant was collected and filtered with 0.2 µm low-protein binding
membrane (Whatman) to remove materials larger than 200 nm. Further filtration was
conducted using a 0.05 µm low-protein binding membrane (Whatman). Finally,
ultrafiltration was applied using a 10 kDa ultrafiltration membrane to remove nutrients
and small debris. The obtained MS2 bacteriophage was enumerated by the
abovementioned DAL technique (typical concentration: 106 PFU/ml).
3.2 Synthetic water solutions preparation
Synthetic water solutions were prepared using NaCl, CaCl2, and HA with cations
concentrations ranging from 10-10,000 mg/L (ionic strength for NaCl: 0.44-440 mM;
ionic strength for CaCl2: 0.75-750 mM) and humic acid ranging from 1-10 mg/L as
total organic carbon (TOC). Natural water samples were collected from in Rhode
Island from Thirty Acre Pond (surface water) and Narragansett Bay (seawater).
Ground water was collected in Kingston campus, University of Rhode Island.
3.3 AgNP preparation and characterization
AgNP stabilized with sodium citrate (Sigma Aldrich) (AgNP-Cit) and PVP
(average molecular weight: 29,000 g/mol, Sigma Aldrich) (AgNP-PVP) were prepared
via the Tollens method described by Kvitek et al. [20] with minor modifications. 0.035
w/w% for both sodium citrate and PVP were added respectively. The obtained AgNP

85
suspensions were cleaned using DI water by ultrafiltration using a 10k kDa membrane
(Whatman) in an ultrafiltration cell (Millipore). Concentrations of the AgNP were
measured as total silver using ICP-AES (Thermo Elemental).
3.4 Bacteriophage inactivation by AgNP
AgNP were added into the synthetic solutions and natural water samples. Then,
100 µl of MS2 stock solution was added into the suspension to obtain the final silver
concentration of 1 mg/L. After 2-h exposure to AgNP in dark condition at room
temperature, the AgNP were exposed to 400 mg/L of sodium thiosulfate for 2 min to
neutralize any AgNP or silver ions remaining in solution. MS2 in these water samples
was served as the controls. The phage samples were serially diluted in 1 mM NaCl
solution during DAL assay. The plates were incubated at 37 oC overnight and only
samples with the number of PFU from 0 to 300 were enumerated. Silver nitrate was
used to compare the antiviral activity between AgNP and silver ions.
3.5 Particle size, aggregation kinetics, and zeta potential measurement
Particle size, aggregation kinetics, and zeta potential were measured for both
AgNP and MS2 phages using the same concentration of AgNP or virus as used in the
antiviral assay was applied (1 mg/L). AgNP or MS2 phages were suspended in the
same aqueous solutions used in the antiviral assay for 2 h. The average size and zeta
potential of the AgNP and viral particles were then determined in duplicate using a
Zetasizer (Nano ZS, ZEN 3600, Malvern) at 25 oC. For all the aggregation kinetics
experiments, DLS measurements recorded the hydrodynamic diameter of AgNP and
viral particles as a function of time at 100 s time intervals. The initial aggregation rate

86
of AgNP was calculated by conducting a linear least-squares regression analysis of
hydrodynamic radius over time.
3.6 Silver ion release experiment
Ion release from AgNP samples was quantified by ultrafiltration using a 3 kDa
molecular weight cut-off membrane as described previously [22]. Nitric acid was
added to the percolate (HNO3 concentration: 2%). ICP-AES was used to quantify the
total silver concentration.
4 Results and discussion
4.1 Effect of different water chemistry conditions on the physicochemical
characteristics of the AgNP and MS2 phage
Figure 4-1 and 4-2 present the sizes and aggregation kinetics of AgNP and
MS2 particles in different water conditions. The average size of AgNP increased with
increasing cations concentration. In synthetic aqueous solutions, larger aggregates
were formed in the NaCl and CaCl2 solutions contain high concentration of cations.
This figure also shows that Ca2+
can produce large aggregates more effectively. In HA
solutions, particle sizes of AgNP and MS2 are quite stable. The aggregation kinetics
measured in Figure 2 well supported the nanoparticle size measurement. In natural
water conditions, AgNP and MS2 in seawater formed the largest aggregates. Ca2+
ions
appear to have a substantial effect on destabilization of the AgNP and MS2 particles
compared to monovalent cations. Effect of divalent cations on the aggregation
behavior of AgNP and viral particles has been previously reported [12-14, 23, 24].
These observations agree well with Shulze-Hardy rule, which indicates that the
stability of a colloidal system is extremely sensitive to the valence of the counterions

87
present in the system. In our case, cations in aqueous solutions can adsorb on the
surface of the particles, neutralize the negative surface charges, and remove the energy
barrier between particles, which allows particles to aggregate easily. AgNP and MS2
in HA solution are very stable. Previous studies proposed that HA molecules can
rapidly adsorb on the surface of nanoparticles and create steric repulsion [3, 13, 25].
Therefore, HA have a stabilizing effect on nanoparticles. Compared with citrate coated
AgNP, AgNP-PVP is more stable due to the combining effects of electrostatic
repulsion and steric repulsion. The nitrogen atom in PVP can bind with AgNP
strongly. The strong attachment of the PVP molecules on nanoparticle surface
preclude substitution by other ions or polymers and create steric repulsion between
nanoparticles [20]. Weak aggregation behavior of MS2 virus was also found. Previous
studies suggested that steric repulsion from the capsule protein hinders their
aggregation [23, 24, 26]. In addition, steric interaction energy contributed by osmotic
and elastic repulsive force from the virus’s fiber also increases stability of viral
particles [23, 26].
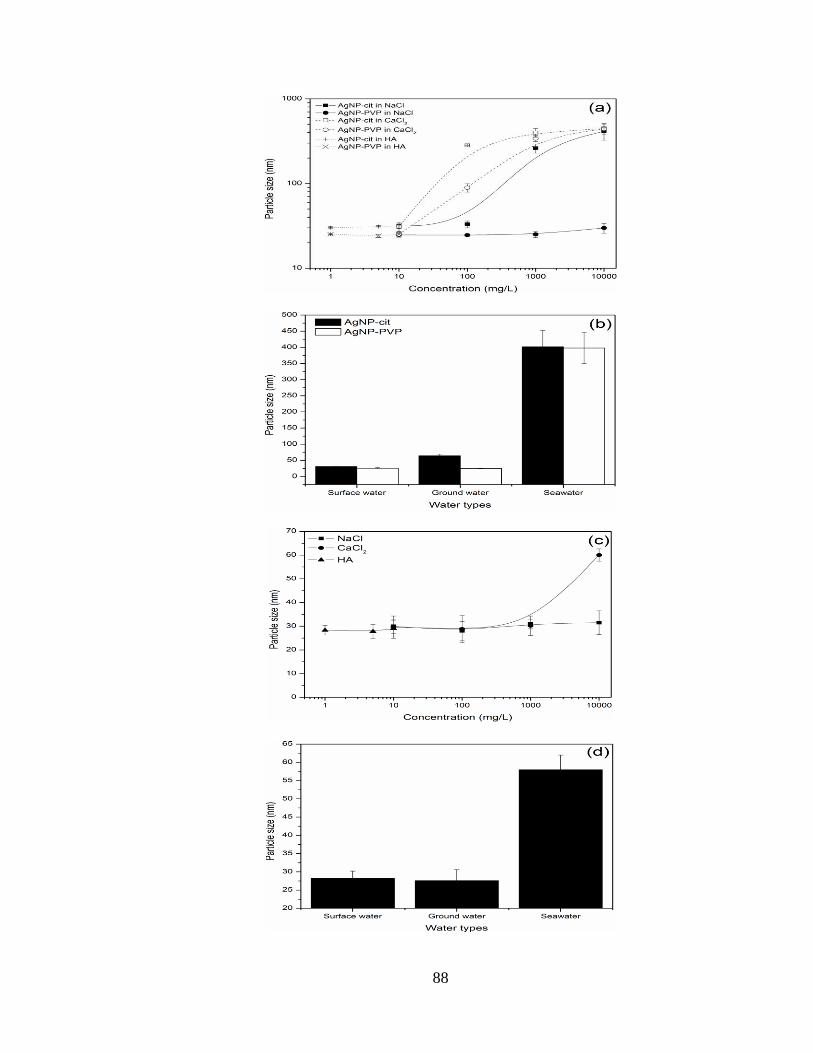
88

89
Figure 4-1 Particle size of AgNP and MS2 bacteriophage in different water
conditions: (a) AgNP in synthetic aqueous solutions; (b) AgNP in natural water
conditions; (c) MS2 bacteriophage in synthetic aqueous solutions; (d) MS2
bacteriophage in natural water conditions

90

91
Figure 4-2 Aggregation rates of AgNP and MS2 bacteriophage in different water
conditions: (a) AgNP in synthetic aqueous solutions; (b) AgNP in natural water
conditions; (c) MS2 bacteriophage in synthetic aqueous solutions; (d) MS2
bacteriophage in natural water conditions

92
Zeta potential is related to the stability of a colloidal system. Results from zeta
potential measurements (Figure 4-3) showed that zeta potentials of AgNP and MS2
are negative across all water chemistry conditions, indicating the surface charge of the
particles is negative. Zeta potentials became less negative with increasing electrolyte
concentrations due to the surface charge screening by the cations. Consistent with the
particle size measurement, zeta potential measurements agree with the Shulze-Hardy
rule, showing that Ca2+
is more effective to neutralize the surface charges than Na+.

93
94
Figure 4-3 Zeta potential of AgNP and MS2 bacteriophage in different water
conditions: (a) AgNP in synthetic aqueous solutions; (b) AgNP in natural water
conditions; (c) MS2 bacteriophage in synthetic aqueous solutions; (d) MS2
bacteriophage in natural water conditions.

95
4.2 Dissolution of AgNP in different water conditions
Table 4-1 shows the dissolved concentration of Ag+ released from AgNP in
various water conditions.
Table 4-1 Dissolution of AgNP in different water chemistry conditions (water
chemistry conditions include concentrations of cations (in mg/L) in synthetic
electrolyte solutions and the natural water samples)
Silver nanoparticles Water chemistries Dissolved Ag (ppb)
AgNP-cit Na+ (mg/L) 10 ND
102
3.0±1.5
103
16.0±4.0
104
319.0±3.0
Ca2+
(mg/L) 10 ND
102
ND
103
ND
104
18.6±2.6
HA (mg/L as TOC) 1 ND
5 ND
10 ND
Surface water 4.4±4.4
Ground water 5.9±1.0
Seawater 2.8±1.0
AgNP-PVP Na+ (mg/L) 10 ND
102
2.7±0.4
103
5.4±1.0
104
162.0±36.0
Ca2+
(mg/L) 10 ND
102
ND
103
ND
104
17.0±2.4
HA (mg/L as TOC) 1 ND
5 ND
10 ND
Surface water 4.5±4.5
Ground water 4.6±0.5
Seawater 3.0±2.5
ND: not detected
It is noteworthy that dissolution of AgNP increases with increasing NaCl
concentration. This phenomenon could be caused by the reaction between released

96
Ag+ with Cl
-. It is well known that Ag
+ and Cl
- can form AgCl precipitate. Further
increase in Cl- concentration can react with AgCl to form soluble silver chloride
complexes AgCl2- and AgCl3
2-, which is responsible for the increased dissolved silver
concentration. Our results agree with previous literatures. Ken and Vikesland. [1]
reported the dissolved silver concentration increased with increasing NaCl
concentration (10-550 mM) for after approximately 2 weeks experiment. However,
dissolved silver was only detected in CaCl2 solution at the highest electrolyte
concentration (104 mg/L Ca
2+). It is proposed that the AgNP dissolution in CaCl2
could be inhibited due to the formation of AgNP aggregates, which could diminish the
exposed surface area of AgNP and hinder the mass transport of reactants to active
sites. Soluble silver chloride complex can still be formed in the presence of excessive
Cl-.
No dissolved silver was observed in presence of HA. Previous studies suggested
that natural organic compound such as HA could inhibit AgNP dissolution by several
mechanisms including surface adsorption to block AgNP oxidation sites, reversible
reaction of released Ag+ to Ag
0 with HA as a reductant [2-5]. In natural water samples,
less AgNP dissolution was found in seawater compared with surface and ground
water. This could be due to the combining effects of the two abovementioned
dissolution inhibition mechanisms: aggregation and presence of natural organic
compounds. Similarly, Liu and Hurt. [2] compared the dissolution kinetics of AgNP in
DI, low salt seawater buffer, and seawater. It was found that the silver release is much
slower in seawater than in DI water.
4.3 Antiviral effect of AgNP in various water conditions

97
Figure 4-4 shows the survival of virus after treatment with AgNP for 2 h. Overall,
over 90% MS2 phages survived after treatment with AgNP in all water chemistry
conditions tested. Environmental factors such as ionic strength, specific ions, and
presence of natural organic compounds that influence toxicity of AgNP have been
reported [3, 6-11]. Previous published work suggested that these environmental
factors affect the physicochemical properties of AgNP which is closely associated to
their toxicity [9]. Ionic strength and presence of divalent or multivalent cations result
in aggregation of AgNP. Large aggregates exhibited lower toxicity compared with
monodispersed nanoparticles [3, 11-13]. Specific ions such as Cl- and SO4
2- presence
in water can form complexes with released silver ions. The complexes are usually less
toxic than Ag+ [7, 8]. Natural organic compounds can also reduce toxicity of AgNP by
inhibiting AgNP dissolution and adsorbing on the nanoparticle surface to create
physical barriers between nanoparticles and microorganism [2, 6]. The combination of
these environmental factors diminishes the antiviral performance of AgNP. In
addition, compared to other microorganisms such as bacteria, MS2 bacteriophage is
more resistant to AgNP [14]. Our result is consistent with previous studies. You et al.
[14] reported that AgNP (coated with polyvinyl alcohol) failed to inactivate MS2
bacteriophage at the highest concentration (5 mg/L Ag) tested, which is related to the
availability of dissolved Ag+ and their preferable binding to virus structures. Other
study found that 5 mg/L uncoated and polysaccharide coated AgNP (particle size 10
nm) had no effect on virus propagation [15]. Interestingly, it is also noteworthy that a
slight decrease in virus survival was observed in aqueous solutions containing high
concentration of Ca2+
. As zeta potential deceases with increasing ionic strength,

98
divalent cations enhanced the interaction between nanoparticles and MS2 phages by
forming aggregates, which may result in a slight increase in the antiviral activity of
AgNP [10]. Previous studies have reported similar effect on bacteria [10, 16]. In
addition, AgNP can facilitate MS2 phage to infect the bacteria host by changing
bacteria cell membrane structures and permeability [14]. However, aggregation of
AgNP can reduce the membrane disruption effect [3], which may consequently
interfere with the ability of the virus to infect the E. coli bacteria resulting in less
plaque forming units found in the agar plates.

99
Figure 4-4 Survival of MS2 bacteriophage in various water conditions after
treatment with AgNP for 2-h. (AgNP concentration: 1 mg/L)

100
5 Conclusion
Conclusively, this study has demonstrated that presence of divalent cations in
aqueous solutions destabilize AgNP and MS2 phages. Presence of Cl- enhances
dissolution of AgNP by forming soluble AgCl2- and AgCl3
2- complexes. Antiviral
experiments showed that AgNP have negligible antiviral effect on MS2 bacteriophage
regardless of the various water chemistry conditions due to the environmental factors
(such as ionic strength and presence of specific ions such as Cl-) that can reduce AgNP
toxicity. Finally, this study shows that the complexity of the interactions of AgNP
with different dissolved and particulate species that are commonly found in synthetic
aqueous solution and natural waters. The results of this study provides insights into the
potential environmental impact of discharged AgNP on the naturally occurring virus
community.

101
REFERENCE
1. Colvin, V.L., The potential environmental impact of engineered
nanomaterials. Nature Biotechnol., 2003. 21: p. 1166-1170.
2. Gao, J., et al., Dispersion and toxicity of selected manufactured nanomaterials
in natural river water samples: effects of water chemical composition. Environ
Sci Technol, 2009. 43: p. 3322-3328.
3. Zhang, H., J.A. Smith, and V. Oyanedel-Craver, The effect of natural water
conditions on the anti-bacterial performance and stability of silver
nanoparticles capped with different polymers. Water Res., 2012. 46(3): p. 691-
699.
4. Kim, J., Antibacterial activity of Ag+ ion-containing silver nanoparticles
prepared using the alcohol reduction method. J. Ind. Eng. Chem., 2007. 13: p.
718-722.
5. Vertelov, G., et al., A versatile synthesis of highly bactericidal myramistin
stabilized silver nanoparticles. nanotechnology, 2008. 19(355707-355708).
6. Yoon, K., et al., Antimicrobial effect of silver particles on bacterial
contamination of activated carbon fibers. Environ. Sci. Technol., 2008. 42: p.
1251-1255.
7. Balogh, L., et al., Dendrimer-silver complexes and nanocomposites as
antimicrobial agents. Nano. Lett., 2001. 1: p. 18-21.
8. You, J., Y. Zhang, and Z. Hu, Bacteria and bacteriophage inactivation by
silver and zinc oxide nanoparticles. Colloids Surf B Biointerfaces, 2011.
85(2): p. 161-167.

102
9. Lara, H.H., et al., Mode of antiviral action of silver nanoparticles against HIV-
1. J Nanobiotechnology, 2010. 8: p. 1.
10. Liga, M.V., et al., Virus inactivation by silver doped titanium dioxide
nanoparticles for drinking water treatment. Water Res, 2011. 45(2): p. 535-
544.
11. Zhang, H. and V. Oyanedel-Craver, Evaluation of the disinfectant performance
of silver nanoparticles in different water chemistry conditions. J. Environ.
Eng., 2012. 138: p. 58-66.
12. Li, X., J.J. Lenhart, and H.W. Walker, Dissolution-accompanied aggregation
kinetics of silver nanoparticles. Langmuir, 2010. 26(22): p. 16690-16698.
13. Li, X., J.J. Lenhart, and H.W. Walker, Aggregation kinetics and dissolution of
coated silver nanoparticles. Langmuir, 2012. 28(2): p. 1095-1104.
14. Huynh, K.A. and K.L. Chen, Aggregation kinetics of citrate and
polyvinylpyrrolidone coated silver nanoparticles in monovalent and divalent
electrolyte solutions. Environ Sci Technol, 2011. 45(13): p. 5564-5571.
15. Thio, B.J., et al., Mobility of capped silver nanoparticles under
environmentally relevant conditions. Environ Sci Technol, 2012. 46(13): p.
6985-6991.
16. Liu, J. and R.H. Hurt, Ion release kinetics and particle persistence in aqueous
nano-silver colloids. Environ. Sci. Technol., 2010(44): p. 2169-2175.
17. Liu, J., Sonshine, D. A., Shervani, S., Hurt, R, Controlled Release of
Biologically Active Silver from Nanosilver Surfaces. ACS Nano, 2010. 4: p.
6903-6913.

103
18. Hewson, I., C. Chow, and J. Fuhrman, Ecological role of viruses in aquatic
ecosystems. 2010, Chichester: eLS. John Wiley & Sons Ltd.
19. Panacek, A., et al., Silver colloid nanoparticles: synthesis, characterization
and their antibacterial activity. J. Phys. Chem. C, 2006. 110: p. 16248-16253.
20. Kvitek, L., et al., Effect of surfactants and polymers on stability and
antibacterial activity of silver nanoparticles (NPs). J. Phys. Chem. C, 2008.
112: p. 5825-5834.
21. Li, X. and J.J. Lenhart, Aggregation and dissolution of silver nanoparticles in
natural surface water. Environ Sci Technol, 2012. 46(10): p. 5378-5386.
22. Jin, X., et al., High-through screening of silver nanoparticle stability and
bacterial inactivation in aquatic media: Influence of specific ions. Environ Sci
Technol, 2010. 44: p. 7321-7328.
23. Gutierrez, L. and T.H. Nguyen, Interactions between rotavirus and Suwannee
River organic matter: aggregation, deposition, and adhesion force
measurement. Environ Sci Technol, 2012. 46(16): p. 8705-8713.
24. Mylon, S., et al., Influence of salts and natural organic matter on the stability
of bacteriophage MS2. Langmuir, 2010. 26: p. 1035-1042.
25. Fabrega, J., et al., Silver nanoparticle impact on bacterial growth: effect of pH,
concentration, and organic matter. Environ Sci Technol, 2009. 43: p. 7285-
7290.
26. Wong, K., et al., Influence of inorganic ions on aggregation and adsorption
behaviors of human adenovirus. Environ Sci Technol, 2012. 46(20): p. 11145-
11153.

104
CHAPTER 5
EFFECT OF SILVER ON THE BACTERIAL REMOVAL EFFICACY OF
LOCALLY-PRODUCED CERAMIC WATER FILTERS
By
Justine Rayner1, Hongyin Zhang
2, Jesse Schubert
3, Pat Lennon
3, Daniele Lantagne
1
and Vinka Oyanedel-Craver2*
is accepted in ACS Sustainable Chemistry & Engineering
1Department of Civil and Environmental Engineering, Tufts University, Anderson
Hall 207, 200 College Avenue, Medford MA 02155
2Department of Civil and Environmental Engineering, University of Rhode Island, 1
Lippitt Road, Kingston, RI 02881
3PATH, 2201 Westlake Ave, Seattle, WA 98121

105
1 Abstract
Locally produced ceramic water filters (CWF) are an effective technology to
treat pathogen-contaminated drinking water at the household level. CWF
manufacturers apply silver to filters during production; although the silver type and
concentration vary and evidence-based silver application guidelines have not been
established. We evaluated the effects of three concentrations of two silver species on
effluent silver concentration, E. coli removal, and biofilm formation inside ceramic
disks manufactured with clay imported from three CWF factories using sawdust as the
burn-out material. Additionally, we evaluated performance using water with three
chemistry characteristics on disks made from the clays using either sawdust or rice
husk as burn-out material. Results showed: 1) desorption of silver nitrate (Ag+) was
higher than desorption of silver nanoparticle (AgNP) for all disks; 2) effluent
concentration, E. coli removal, and biofilm formation inside the disks were dose-
dependent on the amount of silver applied; and, 3) neither water chemistry conditions
nor burn-out material showed an effect on any of the parameters evaluated at the silver
concentration tested. Recommendations for filter manufacturers to use only silver
nanoparticles at a higher concentration than currently recommended are discussed.
2 Introduction
Worldwide, an estimated 783 million people do not have access to an improved
water source [1] and hundreds of millions more drink water that is contaminated at the
source or during collection, transport or storage [2]. Drinking water contaminated by
pathogenic microorganisms causes gastrointestinal infections, which account for 1.87
million childhood deaths each year, mostly in developing countries [3]. Potters for

106
Peace (PfP) style ceramic water filters (CWF) are a low-cost technology produced
locally in developing countries by pressing a mixture of clay and an organic (burn-out)
material into the filter shape and then firing it to a ceramic state. Combustion of the
burn-out material during the firing process creates the filter structure. CWFs remove
pathogens from water by retaining them on the surface or trapping them within the
filters pores.
CWFs are effective at removing more than 99% of protozoan[4, 5]and 90-99.99%
of bacterial organisms from drinking water [6],however, the removal of viruses
remains a challenge. In the field, water treated by CWFs is often improved to the
World Health Organization’s (WHO) low-risk standard [7] of fewer than 10 CFU
(colony forming unit) E. coli /100 mL [6], and filter use has been associated with a
reduction in diarrheal disease among users [8].
Silver nanoparticles (AgNP) and silver nitrate (AgNO3, Ag+) are known anti-
microbial agents, and are added to filters, mostly after the firing process [9]. Reported
log reduction values (LRVs) of E. coli by CWFs coated with AgNP range from 2.5 to
4.56 [9, 10]. LRVs of 2.1 to 2.4 of E. coli have been measured using filters coated
with Ag+ [6]; however, in the same study similar LRVs were also measured in CWFs
without Ag+ application [6]. In production, 83% of factories use AgNP and 17% use
Ag+
[11]. Factories use Ag+ because it is cheaper than AgNP and/or it is locally
available. The concentration of silver applied at each factory varies. Reported AgNP
concentrations range from 107 to 288 ppm [11], excluding probable outliers. The
silver solution is applied to fired filters by brushing or dipping. When silver solution is
applied by brushing, factories reported applying from 32 to 96 mg of AgNP per filter.

107
The current guideline, which is experiential rather than evidence based, is 64 mg of
AgNP per filter [12].
A variety of water sources are used at factories to prepare silver solutions, from
untreated surface water to treated water [11].Water characteristics at the filter user’s
home also vary with location. Previous studies have reported a reduction in
antibacterial properties of AgNP with increased size of the nanoparticle clusters due to
aggregation in the presence of divalent ions such as Ca2+
and Mg2+
[13, 14]. In
addition, water can contain organic compounds, such as humic acids (HA). These can
rapidly coat the nanoparticle surfaces, creating a physical barrier that prevents
interaction between nanoparticles and bacteria [13-15].While previous studies have
reported that different water chemistry conditions can impact the disinfection
performance of AgNP in the aqueous phase, these parameters have not been evaluated
on CWFs either in the field or in laboratory tests.
Desorption of silver from coated CWFs has been reported during the first flushes
of water [9]. A study using phosphate buffer as influent solution reported a decrease in
silver concentration (as total silver) in effluent from AgNP-impregnated CWFs to
below the United States Environmental Protection Agency (USEPA) maximum
contaminant level (MCL) for silver [16] in drinking water (0.1 mg/L or 100 ppb)
within few flushes [9]. To our knowledge, no comprehensive study has evaluated the
desorption of either AgNP or Ag+ from CWFs using different pottery clays and water
chemistry conditions.
In this study, we evaluated the performance of ceramic disks manufactured with
clays from three different factories and two types of burn-out material, sawdust and

108
rice husks. In Phase I, disks manufactured with the different clays and sawdust were
coated with three different concentrations of either AgNP or Ag+ and evaluated for: 1)
effluent silver concentration and silver retention; 2) E. coli removal; and, 3) biofilm
formation. In Phase II, the influence of three water chemistries (Na+-NaCl, Ca
2+-
CaCl2, and humic acid as natural organic matter) on AgNP and Ag+
were evaluated on
disks manufactured with each of the clays and each of the burn-out materials against
the same outcome parameters.
3 Experimental
3.1 Disk manufacturing and pretreatment
While PFP-style filters are a 10-liter capacity filter pot, in this study 10-cm
diameter disks were manufactured to simplify transport and testing. Disks were
manufactured at Advanced Ceramics Manufacturing (Tucson, AZ) with clay imported
from filter factories in Indonesia (Indo), Tanzania (Tanz) and Nicaragua (Nica). The
burn-out material, processed between U.S. sieve numbers 16 and 30 (1.19-mm and
0.595-mm openings, respectively), comprised 15% (burn-out:clay ratio by weight) of
the filter mixture. Disks were pressed at 3.58 PSI and air-dried. The different clays
required different firing temperatures in order to achieve sufficient strength for testing.
Fired disk thickness was approximately 1.5 cm. At the manufacturing facility, disks
were boiled in water for one hour and the percent porosity of each disk was calculated
by dividing the difference between saturated weight and dry weight by the geometric
disk volume.
Disks were then shipped to the University of Rhode Island (URI) where they were
cut to 3.8 cm diameter to fit existing filter holders. To eliminate any possible

109
microbiological contamination, disks were heat treated to 550°C for 30 min, then
allowed to cool at room temperature. The sides of the disks were sealed with silicone,
allowed to dry, and then sealed in the filter holders with silicone.
3.2 Disk characterization
Tracer experiments were conducted to determine the intrinsic characteristics of
the disks and to identify possible anomalies such as preferential channels in the porous
matrix. Tracer tests and the subsequent determination of the advection and dispersion
coefficients were performed using the procedure described in Oyanedel-Craver et al.
[9] but with NaCl instead of tritiated water.
3.3 Silver release and retention
Suspended silver nanoparticles (AgNP) (coated with casein; 70 w/w% AgNP)
was purchased from Laboratorios Argenol and dissolved silver (Ag+) from Sigma
Aldrich. Silver was applied by brushing each disk with a specific concentration of
either Ag+ or AgNP in the appropriate electrolyte solution according to the procedure
described in Oyanedel-Craver et al. [9]. Disks were then flushed with a bacteria-free
solution for 24 hours. Effluent silver concentration was measured after preserving
samples by adding 2% nitric acid, using inductively coupled plasma atomic emission
spectroscopy (ICP-AES) after 100 minutes, 200 minutes, 300 minutes, and at 24
hours. Percent retention of silver (R) was calculated by dividing the difference
between the initial mass of silver added (m0) and the total mass of silver released over
the 24 hours period (mt), by the initial amount of silver added to the disk:

110
0
0
tm mR
m
3.4 Bacterial removal performance
The two phases of microbiological removal testing included: 1) the
determination of the optimal amount of silver required to achieve maximum bacterial
deactivation (only on sawdust disks); and, 2) evaluation of the bacterial removal
efficacy under different influent water chemistry conditions (using both sawdust and
rice-husk disks) using current recommended silver concentration [12] (Table 5-1).
Phase I and Phase II tests were conducted in duplicate, using two disks of each clay. In
Phase I, only disks manufactured with sawdust were tested due to not having sufficient
disks with rice husks for both phases of the study. In Phase II, disks manufactured
with sawdust or rice husk and each of the clays were tested.
Table 5-1 Experimental conditions
Study
Phase &
Burn-out
Silver (AgNP or
Ag+) concentration
(mg/g)
Water characteristics
I
Sawdust
0.003
10% phosphate buffer solution 0.03
0.3
II
Sawdust
or rice
husk
0.003 150 mg/L Na+-NaCl
0.003 150 mg/L Ca2+
-NaCl
0.003 5 mg/L humic acid as total organic
carbon
After 24 hours of flushing with a bacteria free solution, a concentration of 106
CFU/mL E. coli in water of the same chemical composition as used during the
flushing stage (i.e., deionized water with a buffer solution, electrolytes, or humic acid)
was prepared and continuously fed to the disks at a flow rate of 0.5 mL/min using a
peristaltic pump. The concentration of bacteria in the influent and effluent were

111
measured using the method described by Vigeant et al. [17]. Samples (10 mL) were
taken daily for 10 days, and LRVs were calculated. For Phase I testing, a phosphate
buffer solution was selected to minimize natural decay of bacteria during the test
period. A fresh solution of bacteria was prepared daily for Phase I and Phase II testing.
At a feed of 0.5 mL/min for 10 days, the total throughput for each disk over the
study period was ~7.2 L, which equates to ~1300 L through a full-sized filter. This
was calculated by multiplying the flow rate per cm2 of the filter disk by the area of a
full-sized Nicaraguan filter using filter dimensions presented in van Halem. [5] Using
this calculation, the test period simulated approximately four months of a filter treating
10 L of water per day.
3.5 Bacteria retention
After completing the bacterial removal tests, the concentration of biofilm (viable
bacteria) contained in the pores of the disks was determined. The disks were ground
and 10 grams were transferred to a 50-ml flask. The bacteria were dispersed in the
buffer solution by gentle sonication (20% amplitude) for 15 minutes to detach the
bacteria from the ceramic material. The concentration of bacteria was determined
using Vigeant et al. [17] as above.
4 Results
4.1 Disks characterization
A total of 144 disks were tested, including 30 each of Indo-sawdust, Tanz-
sawdust, and Nica-sawdust and 18 each of Indo-rice husk, Tanz-rice husk, and Nica-
rice husk. The average advection (v) (directly proportional to the fluid velocity) and

112
dispersion (D) (directly proportional to the effective porosity) coefficients and
geometric porosity values for the ceramic disks manufactured from the same recipe
were similar. Results from disks manufactured with Indonesian and Tanzanian clays
were also similar; however, disks manufactured with the Nicaraguan clay had higher
advection and dispersion coefficients, indicating that the solute spread fastest through
the Nicaraguan disks. For each of the clay groups, disks manufactured with rice husk
had slightly lower porosities than disks manufactured with sawdust. Values are
presented in Table B-1.
4.2 Phase I
Silver release and retention
For both types of silver and regardless of clay type, a higher concentration of
silver was measured in effluent from disks coated with higher concentrations of silver
(Figure 5-1).
With the exception of 0.003 mg/g Ag+, for each silver concentration Ag
+ resulted
in a higher effluent silver concentration in comparison with AgNP. Silver
concentration in the effluent reduced with solution throughput regardless of silver type.
Effluent silver concentration from AgNP-coated disks was below the USEPA MCL
after 24 hours in all but one case (disks made with Nicaraguan clay and impregnated
with 0.3 mg/g AgNP) (Table C-2). Effluent concentration from disks impregnated
with 0.3 mg/g Ag+
exceeded the USEPA's MCL in all cases and ranged from 797 ppb
to 2,697 ppb after 24 hours.
An increased concentration of silver resulted in increased silver retention in disks
coated with AgNP regardless of clay type (Figure 5-2). AgNP retention did not vary

113
widely between disks made with different clays. A greater percentage of AgNP was
retained in disks in comparison with Ag+, most notably in disks made with Nicaraguan
clay. An increase in Ag+ concentration from 0.003 mg/g to 0.03 mg/g resulted in
increased retention; however, the highest concentration of Ag+
0.3 mg/g resulted in the
lowest percent retention.

114
Figure 5-1 Concentration of silver (as total silver) in effluent from disks
manufactured with Indonesian (a), Tanzanian (b), or Nicaraguan (c) clay and
sawdust, coated with different concentrations (mg/g) of either AgNP or Ag+
(horizontal line at 1.E+02 represents USEPA MCL for silver)

115
Figure 5-2 Percent silver retention in disks manufactured with different clays
and sawdust coated with different species of silver of varying concentrations
(mg/g).
Bacterial Removal Performance
In all samples, a sharp reduction in LRV was observed from day one to five
(Figure 5-3); however, the LRV leveled off from day five to ten. Thus, the LRV
performance comparison is based on the average of the results from the last five days
of testing.
Disks made with Indonesian and Tanzanian clay resulted in an increased LRV
with increased silver concentration, regardless of species applied (Figure 5-3). No
change in terms of LRV was measured from Nicaraguan disks regardless of silver
species or concentration applied. LRV was comparable between disks coated with
AgNP and Ag+, with the exception of Ag
+ applied at 0.3 mg/g which achieved the
highest LRV in both Tanzanian and Indonesian disks.

116
Disks made with either Indonesian or Tanzanian clay and coated with 0.3 mg/g
AgNP achieved >4 LRV on the 10th
day of testing (1-1.7 LRV improvement over
control disks without silver). A small improvement in LRV over the control disks was
measured with 0.03 mg/g of either silver (<1 LRV) but disks coated with 0.003 mg/g
of silver showed little or no improvement in LRV in comparison with the control
disks.
Figure 5-3 Bacterial log reduction values (LRV) of disks manufactured from
Indonesian (a), Tanzanian (b), and Nicaraguan (c) clay and sawdust coated with
varying amounts (mg/g) of either AgNP or Ag+. Vertical lines indicate the 5
th day
of operation.

117
Viable Bacteria Retention Inside the Disks
The concentration of viable bacteria inside disks decreased with increased silver
concentration of either AgNP or Ag+, with the exception of disks made with
Nicaraguan clay which showed little difference in viable bacteria regardless of silver
concentration (Figure 5-4). Results between AgNP and Ag+ were comparable,
although disks coated with 0.3 mg/g of AgNP had fewer viable bacteria than Ag+.
Small changes were detected in the amount of viable bacteria remaining in disks
coated with 0.003 mg/g of either silver species and the control groups (without silver
application), regardless of clay type.
Figure 5-4 Viable bacteria detected in disks manufactured with sawdust coated
with varying amounts of AgNP (a) or Ag+ (b).
4.3 Phase II
Effect of Influent Chemical Composition and Burn-out Material on Silver
Effluent concentration of silver from disks manufactured with rice husk or
sawdust with 0.003 mg/g of either silver was below the MCL value of 100 µg/L after
two hours of influent throughput with each water chemistry used (Figure B-1).
Variation in influent water characteristics resulted in little difference in silver retention

118
among disks treated with AgNP (Figure B-2). In disks coated with Ag+, there was
some variability in silver retention in disks manufactured with Tanzanian and
Nicaraguan clays when HA was used as the influent solution. A difference in silver
retention was not observed between disks manufactured with the same clay but
different burn-out materials.
For each clay, LRVs were similar regardless of influent water chemistry applied,
the silver type or the burn-out material used (Figure B-3). The amount of viable
bacteria retained in disks coated with AgNP or Ag+ was similar regardless of the
influent water chemistry conditions or burn-out material (Figure B-3). Fewer viable
bacteria were retained in disks manufactured with clay from Nicaragua than disks
made with either Indonesian or Tanzanian clays regardless of silver type or influent
water chemistry.
5 Discussion and Recommendations
In this study, we evaluated AgNP and Ag+
performance at varying concentrations
in disks manufactured with filter material manufactured from clays from different
countries. Additionally, silver was evaluated under water chemistries in disks
manufactured with different clays and different burn-out materials. Disks were used as
a model for full-sized filters due to space, time and laboratory constraints. The main
difference between our methods and full-sized filters is the manufactured procedure.
At CWF manufacturing facilities, filter mixture recipes are established by selecting a
ratio and firing temperature that, using the locally available materials, result in filters
that meet specific quality criteria such as flow rate, LRV and strength. In this study,
rather than manufacture filter disks that would have met factory quality criteria, the
119
ratio of clay to burn-out material was held constant regardless of the clay origin or
burn-out type in order to keep all variables except silver application constant. Firing
temperature was thus adjusted, depending on the clay, to achieve enough disk strength
for testing. A variation in pore structure likely resulted from using the same amount of
burn-out material regardless of burn-out material type or clay properties and also as a
result of the variation in firing temperature.
Disks manufactured from Indonesian and Tanzanian clays had comparable
advection and dispersion parameters and their porosity and mechanical strength were
suitable for testing. The higher advection and dispersion coefficients in disks
manufactured with Nicaraguan clay suggested the solute spread faster, possibly due to
larger or more interconnected pores. The Nicaraguan clay was exceptionally
challenging to work with during manufacturing and the firing temperature (1085°C)
likely resulted in a level of vitrification (over-fired) not found in filters at the factory
level. A separate particle size analysis carried out on the raw clays used in this
research found a very low percentage of clay (<2 micron) in the material from
Nicaragua in comparison with the Tanzanian and Indonesians clays (0.5%, 28.5% and
31%, respectively)[18]. Results from the Nicaraguan disks should therefore be
interpreted with caution in this study. In future research, we recommend holding pore
structure constant – as opposed to mix ratio and manufacturing variables – to account
for differences in manufacturing needed for different raw materials.
The results of our study showed: 1) increased desorption of Ag+ compared with
AgNP; 2) a difference between effectiveness of AgNP and Ag+ (Ag
+ is more effective
at high concentration) ; 3) variation in LRV of E. coli depending upon silver

120
concentration; 4) variation in biofilm formation depending upon silver concentration;
and, 4) at the concentrations tested, no impact of water chemistry on the efficacy of
silver. These results are discusssed in the following paragraphs.
Using phosphate buffer influent water, disks retained AgNP more efficiently that
Ag+. Desorption of AgNP ranged from 5% to 10% for all disks tested, while for Ag
+,
10% to 30% desorbed from Tanzanian and Indonesian clay disks and 30% to 40%
from Nicaraguan clay disks. This effect has been reported by other authors who
evaluated sorption of silver species on unfired clays [19]. Ag+ can be displaced by
cations with higher valence or higher charge density, while AgNP are trapped in the
nano- and micro- porous structure of the filter allowing a slow release of silver ions as
the surface of the nanoparticles is oxidized by the dissolved oxygen in water [20].
In the Indonesian and Tanzanian clays, for both silver species, a dose-response
relationship was observed: an increased concentration of silver resulted in increased
LRV of E. coli.
Disks coated with 0.3 mg/g Ag+ resulted in the highest LRV; however, this was
likely the effect of the high concentration of silver in the effluent (one order of
magnitude above the EPA MCL) and therefore bacteria deactivation is achieved via a
different mechanism of action than the contact of the silver sorbed/trapped in the
porous structure of the disks. With lower concentrations of silver, comparable
bacterial reduction was achieved between AgNP and Ag+; however, less silver was
measured in the effluent of disks coated with AgNP. The application of high
concentrations of Ag+ in filters causes concern about: 1) the time that Ag
+ remains in
the filter material, thus having implications on long-term of silver efficacy; and, 2)

121
potential health consequences associated with ingestion of elevated concentrations of
Ag+ by filter users. The Nicaraguan disks showed little change in LRV regardless of
the type or concentration of silver applied.
In disks manufactured with Indonesian and Tanzanian clays, an application of
0.03 mg/g of AgNP resulted in a 0.4 and 1.0 LRV improvement, and disks coated with
0.3 mg/g AgNP, resulted in a 1 and 1.7 LRV by the 10th
day of testing in comparison
with the control group, respectively. The Tanzanian disks showed a greater change in
LRV than the Indonesian disks, which may be due to differences in the clay or firing
temperature. Disks made from Indonesian and Tanzanian clay coated with 0.3 mg/g
achieved similar LRV (>4) on the 10th day of testing. With the exception of disks
manufactured with Nicaraguan clay, after 24 hours the concentration of AgNP in filter
effluent was below the EPA MCL for each concentration tested, therefore safer for
users and compliant under the current drinking water recommendation.
The application of 0.003 mg/g of either silver did not demonstrate improved LRV
over the control disks (without silver) after 10 days of testing (equivalent to 1300 L
throughput in a full-sized filter). This data is consistent with another study that
compared CWF performance with and without Ag+
application [6].
The biofilm quantification inside the disks supports and expands upon the LRV
results. An increase in silver concentration resulted in reduced biofilm formation in
disks; and, disks with a higher concentration of AgNP had less biofilm formation than
disks with a higher concentration of Ag+. The results of this study demonstrated that a
silver coating reduces the biofilm formation (up to two orders of magnitude) compared

122
with disks without silver. To our knowledge this is the first study providing
quantitative information about the antibiofouling properties of silver in CWF.
Phase II of our study focused on evaluating the impact of: 1) inorganic and
organic compounds present in natural water; and, 2) burn-out materials, on silver
sorption, bacterial removal, and biofilm formation. The silver concentration (0.003
mg/g) used in this phase was selected to minimize the impact of residual silver from
either AgNP or Ag+
on bacteria deactivation. At the selected test conditions, a
difference was not observed between the clays, burn-out material, or the silver species
with the water chemistries evaluated in terms of silver retention, LRV or concentration
of viable bacteria remaining in the disks. This could be due to the low concentration of
silver used, as little impact of this low concentration was also seen using phosphate
buffered water, and several others studies have shown the influence of the chemical
characteristics of the solution on AgNP aggregate size [14, 20]. Based on current
knowledge about the aggregation of nanoparticles in different electrolyte solutions,
water containing a low concentration of divalent ions should be used to prepare the
silver solution used to coat filters.
Recommendations resulting from this research include: 1) factories should use
AgNP rather than Ag+ due to higher retention within the filters: Ag
+ is not
recommended for filter application as it can lead to a silver concentration exceeding
health standards in the filtered water; 2) factories could increase the AgNP
concentration to 0.3 mg/g (approximately 640 g/filter) to achieve improved
microbiological performance without compromising the quality of the effluent from
the filter; and, 3) although this study did not show significant differences in terms of

123
performance with water chemistry, there is evidence from other studies that organic
and inorganic compounds present in natural water can affect AgNP performance.
We recognize that these results and recommendations will have an impact on
factories. Ag+ is locally available and significantly cheaper in some countries (and in
some cases information about quality or concentration may be unavailable); and,
importing AgNP can be a challenge. Therefore, the recommendation to use only
AgNP and to increase AgNP concentration by 10 times the current recommendation
will add a cost burden to the manufacturers. While the manufacture of high quality
filter material will remain important in achieving high performing filters, silver
application improves filter effectiveness; however, silver application at lower
concentrations does not appear to have lasting effectiveness and therefore is not cost
effective.
We also note that previous research has not always documented sufficient detail
required to compare research results including type of silver, silver concentration,
dilution and throughput water characteristics. In some cases this may be attributable to
a lack of documentation or information about silver type or concentration. Previous
research should therefore be compared with caution.
The limitations in this study include the use of a controlled 5.4 L/hr flow rate,
which is about 2-3 times the flow rate used in the field. This flow rate was selected to
achieve throughput equivalent to represent long-term operation in a short period of
time. The results likely overestimate biofilm formation and underestimate
microbiological performance due to faster water velocity, constant pressure, and
reduced contact time between silver and bacteria. This study design was such to
124
challenge the materials and therefore, silver would likely be more effective at the
household level than measured in this study.
This study identified several key parameters that require more detailed studies,
such as silver concentration and the effects of various influent water characteristics
and the nature of clay and other manufacturing variables. Further research
recommendations include: 1) evaluation of higher concentrations of AgNP under a
selection of water chemistry conditions to evaluate nanoparticle aggregation and silver
particle size distribution in filter effluent; 2) evaluate effects of water characteristics
both on silver dilution and filter use (influent solutions); and, 3) evaluate
physicochemical interaction between clay and AgNP or Ag+ on silver sorption and
LRV and the influence of these properties and the pore size distribution of the porous
matrix.
125
REFERENCE
1. WHO/UNICEF, Progress on Drinking Water and Sanitation: 2012 Update.
2012.
2. Clasen, T. and A. Bastable, Faecal contamination of drinking water during
collection and household storage: the need to extend protection to the point of
use. Journal of Water and Health, 2003. 1(3): p. 109-115.
3. Boschi-Pinto, C., L. Velebit, and K. Shibuya, Estimating child mortality due to
diarrhea in developing countries. World Health Organization Bulletin, 2008.
86(9): p. 710-717.
4. Lantagne, D.S., Investigation of the potters for peace colloidal silver
impregnated ceramic filter. Report 1: Intrinsic Effectiveness, USAID, Editor.
2001.
5. van Halem, D., Ceramic silver impregnated pot filters for household drinking
water treatment in developing countries. 2006: Delft, The Netherland.
6. Brown, J. and M.D. Sobsey, Microbiological effectiveness of locally produced
ceramic filters for drinking water treatment in Cambodia. Journal of Water
and Health, 2010. 8(1): p. 1-10.
7. WHO, Guidelines for drinking-water quality, 2nd edition, WHO, Editor. 1997:
Geneva, Switzerland.
8. Brown, J., M.D. Sobsey, and D. Loomis, Local drinking water filters reduce
diarrheal disease in Cambodia: a randomized, controlled trial of the ceramic
water purifier. American Journal of Tropical Medicine and Hygiene, 2008.
79(3): p. 394-400.

126
9. Oyanedel-Craver, V.A. and J.A. Smith, Sustainable colloidal-silver-
impregnated ceramic filter for point-of-use water treatment. Environmental
Science & Technology, 2008. 42(3): p. 927-933.
10. Kallman, E., V. Oyanedel-Craver, and S. J, Ceramic Filters Impregnated with
Silver Nanoparticles for Point-of-Use Water Treatment in Rural Guatemala.
Journal of Environmental Engineering-ASCE, 2011. 137(6): p. 407-415.
11. Rayner, J., B. Skinner, and D. Lantagne, Current practices in manufacturing
locally-made ceramic pot filters for water treatment in developing countries.
Journal of Water, Sanitation and Hygiene for Development (in press), 2013.
12. CMWG, Best Practice Recommendations for Local Manufacturing of Ceramic
Pot Filters for Household Water Treatment. 2011: Atlanta, GA, USA.
13. Zhang, H. and V. Oyanedel-Craver, Evaluation of the disinfectant performance
of silver nanoparticles in different water chemistry conditions. Journal of
Environmental Engineering-ASCE, 2011. 138: p. 56-66.
14. Zhang, H., J.A. Smith, and V. Oyanedel-Craver, The effect of natural water
conditions on the anti-bacterial performance and stability of silver
nanoparticles capped with different polymers. Water Research, 2012. 46: p.
691-699.
15. Fabrega, J., et al., Silver nanoparticle impact on bacterial growth: effect of pH,
concentration, and organic matter. Environmental Science & Technology,
2009. 43(7285-7290).
16. USEPA. http://water.epa.gov/drink/contaminants/index.cfm. 2011.

127
17. Vigeant, M.A., et al., Reversible and irreversible adhesion of motile
Escherichia coli cells analyzed by total internal reflection aqueous
fluorescence microscopy. Applied and Environmental Microbiology, 2002.
68(2794-2801).
18. Duocastella, M.d.M. and K. Morrill, Particle size distribution analysis for
ceramic pot water filter production. 2012, Potters without Borders: Enderby,
British Columbia, Canada.
19. Matsumura, Y., K. Yoshikata, and T. Tsuchido, Mode of bactericidal action of
silver zeolite and its comparison with that of silver nitrate. Applied and
Environmental Microbiology, 2003. 69(7): p. 4278–4281.
20. Li, X.A., J.J. Lenhart, and H.W. Walker, Dissolution-Accompanied
Aggregation Kinetics of Silver Nanoparticles. Langmuir, 2010. 26(22): p.
16690-16698.

128
CHAPTER 6
COMPARISON OF THE BACTERIAL REMOVAL PERFORMANCE OF
SILVER NANOPARTICLES AND A POLYMER BASED QUATERNARY
AMINE FUNCTIONALIZED SILSESQUIOXANE COATED POINT-OF-USE
CERAMIC WATER FILTERS
By
Hongyin Zhang and Vinka Oyanedel-Craver*
is submitted to Journal of Hazardous Materials
Department of Civil and Environmental Engineering, University of Rhode Island,
Bliss Hall 213, Kingston, RI 02881

129
1 Abstract
This study compares the disinfection performance of ceramic water filters
impregnated with two antibacterial compounds: silver nanoparticles and a polymer
based quaternary amine functiaonalized silsesquioxane (Poly (trihydroxysilyl)
propyldimethyloctadecyl ammonium chloride (TPA)). These compounds were
evaluated using ceramic disks (6.5 cm) manufactures with clay obtained from a
ceramic filter factory located in San Mateo Ixtatan, Guatemala. Results showed that
TPA can achieve a log bacterial reduction value of 10 while silver nanoparticles
reached up to 2 log reduction using a initial concentration of bacteria of 1010
-1011
CFU/ml . Similarly, bacterial transport experiment through section of ceramic water
filters demonstrated that ceramic filter disks painted with TPA achieved a bacterial log
reduction value of 6.24, which is about 2 log higher than the values obtained for disks
painted with silver nanoparticles (bacterial log reduction value: 4.42). The release of
both disinfectants from the ceramic materials to the treated water was determined
measuring the effluent concentrations in each test performed. Regarding TPA, about
3% of the total mass applied to the ceramic disks was released in the effluent over 300
min, which is slightly lower than the release percentage for silver nanoparticles (4%).
This study showed that TPA provides a comparable performance than silver
nanoparticles in ceramic water filter. Another advantage of using TPA is the cost as
the price of TPA is considerable lower than silver nanoparticles. In spite of the use of
TPA in several medical related products, there is only partial information regarding
the long health risk of this compound. Additional long-term toxicological information

130
for TPA should be evaluated before their future application in ceramic water filters is
considered.
2 Introduction
Ceramic filters impregnated with silver nanoparticles (AgNP) are a promising
point-of-use water treatment technology in the developing world that can be applied
with local materials and labor. Currently, ceramic water filters (CWFs) are
manufactured by pressing and firing a mixture of clay and a combustible material such
as flour, rice husks, or sawdust prior to treatment with AgNP. The filter is formed
using a filter press, after which it is air-dried and fired in a flat-top kiln, increasing the
temperature gradually to about 900 ˚C during an 8-h period [1]. This forms the
ceramic material and burns off the sawdust, flour, or rice husk in the filters, making it
porous and permeable to water. After firing, the filters are cooled and impregnated
with a silver solution (either AgNP or silver nitrate) by either dipping the filters in the
silver solution or painting the silver solution onto the filters.It has been demonstrated
that the silver compounds add disinfection properties to the CWFs [1, 2], increasing
the bacteria removal and therefore increasing the water quality [3]. Also, it has been
hypothesized that the use of the silver solution extends the useful life of the ceramic
filters by preventing the formation of biofilm inside the ceramic matrix [1-3].
The silver compounds are added to the CWFs as the disinfectant in three different
ways: 1) they can be painted on the CWFs, 2) the CWFs can be dipped in the silver
solution, and 3) the silver compounds, in powder form (AgNP or AgNO3) can be
mixed with clay, sawdust and water. Rayner [4] estimated that 56% of the factories
painted the silver solution onto the CWF, 33% dipped the CWFs into the silver

131
solution, and the remaining 11% mixed the silver in powdered form with the clay and
sawdust. About 83% of factories use AgNP, while other 17% use silver nitrate.
The prices of noble metals have increased significantly in the past few years. The
price of silver has increased by almost a factor of three since 2005 [5], threatening the
sustainability of the current application of colloidal silver in CWFs. Therefore,
alternative disinfectant compounds are needed to ensure the efficacy of these systems.
One candidate compound is 3-(trihydroxysilyl) propyldimethyloctadecyl ammonium
chloride (TPA), a polymer that compounds silane with a quaternary ammonium
species. Similar to AgNP, TPA exhibits excellent antimicrobial properties in dissolved
solutions and has long-term durability. A recent report indicated that 0.25 w/w% TPA
exhibited a 99.99% inhibitory effect on Escherichia coli while 1% silver zeolite can
only achieve 41.18% inhibition [6].TPAis usually applied as an antibacterial or anti-
mold reagent. Current TPA applications include impregnation into thermoplastics or
thermoset resins; dissolution in water and other solvents for use in coating, as caulk or
as adhesive formulations; and application asa surface treatment for disinfection
purposes [6]. The price of pure TPA powder is about $222/kg, which is much lower
than the price of silver (about $1024/kg)[5, 7]. The high disinfection performance and
lower price makes TPA a potential disinfectant alternative to AgNP.
To the author’s knowledge, no study has compared the disinfection performance
of TPA and AgNP in CWFs. In this work, the potential application of TPA as a
disinfectant in CWFs was evaluated. TPA was chosen because it is a non-toxic, non-
irritating, biocompatible, thermally stable, and environmental friendly polymer.
Compared with similar quaternary ammonian silane compounds, TPA has the

132
advantageous property of non-leaching because reactive silanol groups within the TPA
can either react with the treated materials to form covalent bonds or form strong
hydrogen bonds [6, 8]. The deactivation efficacies of AgNP and TPA were measured
using a manometric technique that determines the overall activity of active bacteria
and has advantage of avoiding miscounting compared to the traditional plate-count
method. Bacteria were transported through the CWFs to compare the initial
disinfectant performance of CWFs impregnated with AgNP and TPA. The release of
AgNP and TPA from ceramic materials was also measured so that potential
manufacturers could be informed regarding the best management practices to
minimize the exposure of workers to the hazardous materials.
3 Materials and methods
3.1 Ceramic disks manufacturing
The composition of the ceramic disks consisted of 40% Guatemalan clay, 10%
flour and 50% (grog) pottery residues by weight. This selected combination of
materials was the optimum combination because CWFs with higher percentages of
flour were weak and can be broken easily, while CWFs with higher clay content has
low hydraulic conductivity resulting in low flow rates [1]. The clay, flour and grog
were homogeneously (244 g) mixed after which 75 mL of DI water were added [1].
The mixture was molded using a cylindrical mold (with a diameter of 6.5 cm) and
compressed for 1 min at a pressure of 1000 psi. The disks were air-dried at room
temperature for three days and then fired in a furnace with the temperature increasing
at a rate of 1500C/h until a temperature of 600
0C was reached. Then, the rate was
increased to 3000C/h until the temperature reached 900
0C, where it was maintained for

133
3 h. The obtained CWFs were cut into small water filter disks of 1.5 inches in
diameter. The porous structure of the disks was confirmed by scanning electron
microscopy (SEM).
3.2 Preparation and characterization of AgNP and TPA
Commercial AgNP (70.37% w/w Ag0) stabilized with casein was obtained from
Argenol laboratories (Zaragoza, Spain). Commercial TPA (0.5 w/w% TPA) was
obtained from BIOSAFE, Inc. (Pittsburgh, USA). The surface charge and average size
distribution of AgNP and TPA in 10% phosphate buffer solution (PBS) were
determined in triplicate by zeta potential and dynamic light scattering (DLS) using a
Zetasizer (Nano ZS, ZEN 3600, Malvern) at 25 0C.
3.3 Microbial cultures
A non-pathogenic wild strain of E.coli provided by IDEXX laboratories
(Westbrook, USA) was used for the bacteria-transport experiments. This organism
was selected because of its use as a specific indicator of fecal contamination in
drinking water and its extensive use in several studies of AgNP[1, 9, 10], which will
allowed us to compare our results with previously published work. The bacteria were
grown as described by Vigeant et al. [11]. Cells were re-suspended in a sterilized
solution prepared with the respective water samples and synthetic water solution to a
concentration of 1010
-1011
CFU/ml. Determination of the E. coli concentration was
performed using the membrane filtration technique, applying m-FC with Rosolic Acid
Broth (Millipore) and incubation at 44.50C for 24 h[11].
3.4 Evaluation of the antibacterial activity

134
Batch tests of the deactivation of the bacteria by AgNP and TPA (concentration
range: 6-45 mg/L) were performed in duplicates during 20 h using the manometric
respirometric technique described by Zhang et al. [9, 10].
3.5 Tracer and bacteria transport experiment
Transport experiments were performed with the CWFs under two conditions.1)
without AgNP/TPA, and 2) after being painted with the two compounds. The CWFs
were placed in holders connected to a Masterflex pump that maintained a flow rate of
0.5 mL/min. NaCl was used as the conservative tracer. The flow rate of 0.5 mL/min
through a filter disk is estimated at approximately 5.4 L/h using the dimension of a
full-sized water filter. One milliliter of NaCl (10 g/L) was injected, and DI water was
used as the inflow solution. Samples were collected over time, and an electric
conductivity (EC) meter was used to determine the NaCl concentrations. Before the
bacteria transport experiment, the CWFs were saturated with 10% PBS inflow solution
(consist of 1.12 g/L K2HPO4, 0.48 g/L KH2PO4, and 2 mg/L
Ethylenediaminetetraacetic acid (EDTA); pH: 7.3) for 12 h. Then, the CWFs were
dried in an incubator for 12 h. One milliliter of E. coli (1010
-1011
CFU/mL) was passed
through the CWFs, and effluent samples were collected over time to determine the
breakthrough of the E. coli. Then, the CWFs were heated in an oven at 500 0C for 30
min and then cooled to room temperature. The CWFs were painted with AgNP and
TPA using brushes according to the total mass applied as described by Oyanedel-
Craver and Smith [1]. After drying for 24 h, one milliliter of E. coli solution was
passed through the CWFs, and the concentration of the bacteria in the effluent was
determined. Meanwhile, the rate of decay of the bacteria in the 10% PBS also was

135
measured as a control using the same bacterial concentration and inflow conditions.
The CXTFIT program (Riverside, USA) was used to simulate the obtained
breakthrough curves. The advection-dispersion equation with first-order decay is:
2
2
c c cR D v c
t x x
The initial and boundary conditions [1] were:
c(x,0)=0
c(0, t)=c0 for t<t0
c(0, t)=0 for t>t0
( , )0
c L t
x
Where R is the retardation coefficient, c is the concentration of NaCl or E. coli
(CFU/ml), t is time (min), t0 is the tracer or bacteria pulse injection time (min), D is
the dispersion coefficient (cm2/min), µ is the first-order decay coefficient (min
-1), v is
the linear velocity (cm/min), and L is the thickness of the CWF. The model assumes
local equilibrium sorption.
The concentration of AgNP in the effluent was measured as total silver (ICP-MS,
X series, Thermo Elemental, Waltham, USA). TPA concentration was measured as
quaternary ammoniumcompounds (QAC) concentration using a QAC test kit (HACH,
Loveland, USA) and a DR 2100 spectrophotometer (HACH).
4 Result and discussion
4.1 Characterization of the manufactured ceramic and the disinfectants
Figure 6-1 shows the SEM analysis of the manufactured ceramic. The SEM
images clearly showed the porous structure of the disks. The pores in the disk are

136
formed due to the volatilization of the burn off material at high temperature and the
subsequent shrinkage of the clay due to vitrification.

137
Figure 6-1 SEM analysis of the manufactured ceramic using Back scattered mode
(a) and Secondary electron mode (b)
Figure C-1 (Supplementary information) shows the size distribution, average size,
and ζ-potential of AgNP and TPA. The average particle size of the AgNP (69.5 ± 2.6
nm) was smaller than that of TPA (247 ± 27.8 nm). Further analysis was performed to
compare the size distribution of AgNP and TPA. The comparison displayed that the

138
TPA exhibited a wider size distribution than AgNP. However, it was noticed that the
ζ-potential of the AgNP was much smaller than that of TPA. AgNP shows negative ζ-
potential value (-25.6±0.75 mV). In DI water condition, previous studies showed that
AgNP has negative ζ-potential values because an Ag(OH)2—
like species at the surface
can be formed due to the oxidation of metallic silver by O2 presence in water. In water
matrices containing ions, adsorption of anions can also impart a negative surface
charge. On the contrary, the positive ζ-potential value of TPA (27 ± 0.95 mV) was due
mainly to the positively-charged quaternary ammonia groups in the TPA compound.
Similarly, Cumberland and Lead [12] found that AgNP show a ζ-potential value of -
25.8 ± 5 mVin solutions containing HNO3 or NaOH (pH in the range of 5 to 8). A ζ-
potential value of 28.29 mV was found for 3-(trimethoxysilyl)
propyldimethyloctadecyl ammonium chloride that was very similarto that of TPA in
the DI water condition[13]. Since most of the observed ζ-potentials of ceramic
surfaces are negative [14], the ζ-potential values implied that the surface of the CWFs
could adsorb TPA preferentially over the AgNP, which was supported by the results
from the AgNP/TPA release experiment presented in Table 6-2 and Figure 6-4. Our
study also investigated the ζ-potential of E. coli (-6.46 ± 0.43 mV) in a 10% PBS,
which indicates that E. coli may preferentially contact TPA rather than the AgNP due
to the adverse ζ-potential values for TPA and E. coli.
4.2 Bulk Antimicrobial activity of AgNP and TPA
Figure 6-2 presents the antimicrobial activity of AgNP and TPA determined using
a manometric respirometric method. The figure shows that the antimicrobial ability of
both compounds increases with increasing concentration. It is noteworthy that TPA

139
exhibited higher antimicrobial ability (54%) than AgNP (30%) at lower concentration
and similar antimicrobial ability at higher concentration (AgNP: 99%; TPA: 100%).
The mechanism of the antimicrobial activity of AgNP has been attributed to the
damage of bacteria by pitting the cell membrane, lysis of cells caused by silver ion
release, or damage of the cell by the reactive oxygen species formed on the surface of
the nanoparticles [15, 16]. The toxicity of TPA is determined mainly by the positively
charged ammonium groups and octadecyl groups. Kim et al [17] suggested that the
interactions between TPA and the cytoplasmic membrane of E. coli can be enhanced
by the positively charged ammonium groups. In addition, octadecyl groups can also
increase the hydrophobic interaction with the cytoplasmic membrane and then cause
cell disruption and leakage of the membrane. The value of ζ-potential for E. coli in
10% PBS was also determined (-6.46 ± 0.43 mV), which indicates that 1) attraction
forces could exist between the negatively charged E. coli membrane and the positively
charged TPA, and 2) electrostatic repulsion forces could exist between the negatively
charged E. coli membrane and the negatively charged AgNP. This may explain why
TPA has better disinfection performance than AgNP at similar low concentrations. In
addition, high ionic strength in PBS may also account for the lower antimicrobial
property of AgNP. Liu and Hurt [18] reported a decreased concentration of silver ion
released from AgNP in solutions with high ionic strength. As silver ion release was
proposed as an important factor that could affect the antimicrobial properties of AgNP,
decreasing silver ion release could result in a lower antimicrobial property. Zhang and
Oyanedel-Craver [9] observed an increasing particle size of AgNP with increasing
ionic strength and indicated a negative correlation between particle size and

140
antimicrobial property.
Figure 6-2 Disinfection performances of AgNP and TPA in 10% PBS; Duration:
20 h.

141
4.3 Tracer and bacteria transport
Table 6-1 Parameters of tracer and bacteria transport experiment and the
percentages of total bacteria removal.
Linear
velocity
v
(cm/min)
Coefficient
of dispersion
D (cm2/min)
Retardation
factor
R
First-order
decay
coefficient µ
(min-1)
Log
removal
of E.coli
Tracer test 0.1115 0.02304 1 0 N/A
CWF1
(without
painting
AgNP)
0.1115 0.02304 0.5764 0 4.22
CWF1
(painted with
AgNP)
0.1115 0.02304 0.5764 0.0258 4.42
CWF2
(without
painting
TPA)
0.1115 0.02304 0.5383 0 4.34
CWF2
(painted with
TPA)
0.1115 0.02304 0.5383 1.783×10⁻⁸
6.24
N/A: not available
The CXTFIT program was used to provide optimum fits for the tracer and
bacteria transport data. Linear velocity v and dispersion coefficient D were determined
with R = 1 and µ = 0 using the conservative tracer transport experiment data. R and µ
were determined from the bacteria transport experiment. The fitted parameters and the
percentages of bacteria removal are listed in Table 6-1. The simulated concentrations
of NaCl and bacteria agree well with the observed concentrations.
142
Figure 6-3 (a) presents the results of the tracer transport experiment. NaCl was
used as a conservative tracer after the CWF had been washed with DI water for 48 h
until the conductivity of the effluent became constant (< 8 µS/cm). NaCl recovery was
98.9% during the collection of the effluent sample. The figure also shows that
breakthrough occurred at 10 min during the conservative tracer test.
Figure 6-3 (b) and 6-3 (c) present the bacteria transport using CWFs with/without
painted AgNP and TPA, respectively. The breakthrough for E. coli occurred at 5 min.
After the injection of E. coli bacteria, removals of up to 99.4% (bacterial log reduction
value, LRV: 4.22) (CWF1) and 99.55% (LRV: 4.34) (CWF2) (Table 1) were achieved
using CWFs without any AgNP or TPA. This indicates that CWFs themselves remove
the bacteria effectively. After painting the CWFs with the AgNP, improved
percentages of bacteria removal were obtained. The results (Table 6-1) showed that a
higher percentage of bacteria removal was achieved using CWF2 (painted with TPA)
(>99.999%; LRV: 6.24) than CWF1 (painted with AgNP) (99.89%; LRV: 4.42). It also
was found that AgNP and TPA exhibited 82.3% and 99.6% bacteria removal,
respectively, using the following equation:
'Bacterial removal 100%
N N
N
whereN is the number of viable bacteria in the effluent without AgNP/TPA coated on
the CWFs, and N’ is the number of viable bacteria in the effluent with AgNP/TPA
coated on the CWFs. The results indicate that TPA had a higher antimicrobial activity
than AgNP at the experimental conditions used. The results of the bacteria transport
experiment agreed with those obtained in the bulk antimicrobial activity test.

143
Similar results were observed in earlier work [1]. The main mechanism for the
removal of bacteria by CWFs before applying AgNP or TPA was size exclusion [1].
Bacteria passing through CWFs can be retained by the small pores of the CWFs and
pass through the large pores preferentially. However, there is an alternative
mechanism that suggests that the bacteria possibly could be retained in the CWF by a
reversible sorption process [1]. However, if a reversible sorption process is occurring,
the breakthrough of bacteria should appear after the breakthrough of NaCl. It is
noteworthy that the peak of the observed NaCl breakthrough occurred after the peak of
the bacteria breakthrough when comparing Figure6-3 (a) with Figures 6-3 (b) and 6-3
(c). Similar results were observed for bacteria transport in CWFs and natural soils [1,
19-21]. It was also observed that effluent bacteria-concentration peaks occurred before
the tracer peaks.

144
Figure 6-3 (a) Effluent NaCl concentrations normalized to the influent pulse
concentration as a function of time for CWF. (b) Effluent E. coli concentrations
normalized to the influent pulse concentration as a function of time for CWF

145
with/without painting AgNP. (c) Effluent E. coli concentrations normalized to the
influent pulse concentration as a function of time for CWF with/without painting
TPA. Inflow condition: 10% PBS; Solid circles: normalized NaCl concentration;
Solid squares: normalized E. coli concentration using CWFs; Empty squares:
normalized E. coli concentration using AgNP painted CWF; Empty circles:
normalized E. coli concentration using TPA painted CWF; Lines: optimized
solute-transport model fits
4.4 AgNP and TPA concentrations in effluent water
Table 6-2 Total release and percentage of AgNP and TPA retained in the CWFs
Total mass released in the
effluent over 300 min
Mass percentage retained
in CWFs
AgNP 0.04 mg 96%
TPA 0.03 mg 97%
Table 6-2 and Figure 6-4 show the amount of AgNP and TPAretained in the
CWFs and their concentrations in the effluent water. The concentrations of AgNP in
the effluent decreased over time. According to the drinking water guidelines of the
U.S.Environmental Protection Agency (EPA), the total concentration of silver in the
water should not exceed 0.1 mg/L. However, it was observed that the initial
concentration of silver in the effluent was 0.23 mg/L. Consequently, we recommend
that the CWFs should be rinsed for at least 100 min before point-of-use application.
Similarly, the concentration of TPA in the effluent decreased over time. Currently, no
specific regulatory information has been listed for TPA. As comparison, a similar
quaternary ammonium silane product, 3-(trimethoxysilyl) propyldimethyloctadecyl
ammonium chloride (Oral LD50>5000 mg/kg; Dermal LD50>2000 mg/kg; Inhalation

146
LC50>2.0 mg/L), has been documented by the U.S. EPA which shows a lack of
toxicological effects at dose level up to and including a limit dose (i.e. 1000
mg/kg/day) [22]. We recommend that CWFs should be washed at least 300 min to
minimize any possible adverse health effect.
One of the adverse health effects associated with exposure to silver is Argyria, an
irreversible skin condition. The Occupational Safety and Health Administration
(OSHA Washington, USA) and the National Institute for Occupational Safety and
Health (NIOSH, Atlanta, USA) have established an exposure limit of 0.01 mg/m3 (in
air) for metallic and soluble silver compounds. However, although the exposure limit
and health effects of silver have been studied extensively [23], the threshold exposure
limit of TPA still is not available. Studies related to the exposure threshold and health
effects of TPA on animals and humans are needed in future studies.
Table 6-3 Some toxicological parameters of silver and TPA
Acute oral toxicity
(LD50)
Acute dermal
toxicity (LD50)
Acute inhalation
toxicity (LC50)
Oral reference
dose (RfD)
Silver 100 mg/kg (AgNP)
129 mg/kg
(AgNO3)
No mortality
observed (AgNP)
>7.5×10⁻⁴
mg/L
(AgNP)
0.005 mg/kg/day
TPA >5000 mg/kg >5050 mg/kg >2.19 mg/L N/A
N/A: not available. Data is obtained from Korani et al. [24]; Sung et al. [25]; U. S.
EPA [26]; Venugopal and Luckey [27].
Table 6-3 shows some of the toxicological data that have been published for silver and
TPA. These data indicate that silver has a higher acute oral toxicity than TPA.
However, Table 6-3 suggests that acute dermal toxicity and acute inhalation toxicity
are low for both AgNP and TPA. The oral reference dose (RfD) of AgNP has been

147
determined. However, the RfD for TPA is not available because it is an emerging
disinfectant. Future studies are needed to determine the RfD of TPA to assess its
chronic health effects.
Figure 6-4 Concentrations of total silver and total TPA in the effluent water
during 300 min.Inflow condition: 10% PBS; Original concentration of AgNP or
TPA in CWFs: 0.03 mg/g
5 Conclusion
Conclusively, this study showed that TPA is a viable alternative to AgNP in
ceramic disks due to its high antimicrobial properties. Additionally, due to its lower
price compared with AgNP, the application of TPA lowers the cost of CWFs. This
could benefit to manufactures that will be using a product with a market value less

148
variable and could economically benefit the CWF users due to a lower cost of the
product.
TPA can achieve higher bacterial reduction than AgNP in both aqueous solution
and ceramic disks, suggesting that TPA could be an alternative disinfectant agent for
this particular technology. The concentration of both AgNP and TPA released to the
effluent are similar and decrease over time, indicating that similar amount of AgNP
and TPA was retained inside disks. Considering the current toxicological information
of TPA, the release of TPA may not have an acute impact on human health. However,
more information regarding the long-term health effects of TPA is still needed to
support the application of this product to ceramic water filters.

149
REFERENCES
1. Oyanedel-Craver, V.A. and J.A. Smith, Sustainable colloidal-silver-
impregnated ceramic filter for point-of-use water treatment. Environ. Sci.
Technol., 2008. 42: p. 927-933.
2. Bielefeldt, A.R., K. Kowalski, and R.S. Summers, Bacterial treatment
effectiveness of point-of-use ceramic water filters. Water Res., 2009. 43(14): p.
3559-3565.
3. van Halem, D., et al., Assessing the sustainability of the silver-impregnated
ceramic pot filter for low-cost household drinking water treatment. Phys.
Chem. Earth, 2009. 34(1-2): p. 36-42.
4. Rayner, J., Current practices in manufacturing of ceramic pot filters for water
treatment. 2009, Loughborough University.
5. Silverprice. http://goldprice.org/silver-price.html. 2011 [cited 2012 Nov. 11];
Available from: http://goldprice.org/silver-price.html.
6. Getman, G.D., An advanced non-toxic polymeric antimicrobial for consumer
products, in Rubber World 2011. p. 22-25.
7. Biosafe. www.biosafe.com. 2011; Available from: www.biosafe.com.
8. Kimble, E., et al. Quaternary functional silsesquioxanes for use in personal
care: polysilsesquioxane steardimonium chloride. in SCC Technical Showcase.
2012. New York City, NY.
9. Zhang, H. and V. Oyanedel-Craver, Evaluation of the disinfectant performance
of silver nanoparticles in different water chemistry conditions. J. Environ. Eng.,
2012. 138: p. 58-66.

150
10. Zhang, H., J.A. Smith, and V. Oyanedel-Craver, The effect of natural water
conditions on the anti-bacterial performance and stability of silver
nanoparticles capped with different polymers. Water Res., 2012. 46(3): p. 691-
699.
11. Vigeant, M.A., et al., Reversible and irreversible adhesion of motile
Escherichia coli cells analyzed by total internal reflection aqueous
fluorescence microscopy. Appl. Environ. Microbiol., 2002. 68: p. 2794-2801.
12. Cumberland, S.A. and J.R. Lead, Particle size distributions of silver
nanoparticles at environmentally relevant conditions. J. Chromatogr. A, 2009.
1216(52): p. 9099-9105.
13. Song, J., H. Kong, and J. Jang, Bacterial adhesion inhibition of the quaternary
ammonium functionalized silica nanoparticles. Colloids Surf. B 2011. 82(2): p.
651-656.
14. Mullet, M., et al., A simple and accurate determination of the point of zero
charge of ceramic membranes. Desalination, 1999. 121: p. 41-48.
15. Feng, Q.L., et al., A mechanistic study of the antibacterial effect of silver ions
on Escherichia coli and staphylococcus aureus. J. Biomed. Mater., 2000. 52(4):
p. 662-668.
16. Sondi, I. and B. Salopek-Sondi, Silver nanoparticles as antimicrobial agent: a
case study on E. coli as a model for Gram-negative bacteria. J. Colloid
Interface Sci., 2004. 275(1): p. 177-182.

151
17. Kim, H.W., B.R. Kim, and Y.H. Rhee, Imparting durable antimicrobial
properties to cotton fabrics using alginate–quaternary ammonium complex
nanoparticles. Carbohydr. Polym., 2010. 79(4): p. 1057-1062.
18. Liu, J. and R.H. Hurt, Ion release kinetics and particle persistence in aqueous
nano-silver colloids. Environ. Sci. Technol., 2010(44): p. 2169-2175.
19. Fontes, D.E., et al., Physical and chemical factors influencing transport of
microorganism through porous media. Appl. Environ. Microbiol., 1991. 57: p.
2473-2481.
20. Jewett, D.G., et al., Bacterial transport in laboratory columns and filters:
influence of ionic strength and pH on collision efficiency. Water Res., 1995. 7:
p. 1673-1680.
21. Kretzschma, R., et al., Experimental determination of colloid rates and
collision efficiencies in natural porous media. Water Res., 1997. 33: p. 1129-
1137.
22. EPA, U.S. http://www.epa.gov/oppsrrd1/REDs/trimethoxysilyl-quats-red.pdf. .
2007 [cited 2012 Nov. 09]; Available from:
http://www.epa.gov/oppsrrd1/REDs/trimethoxysilyl-quats-red.pdf. .
23. Drake, P.L. and K.J. Hazelwood, Exposure-related health effects of silver and
silver compounds: a review. Ann. Occup. Hyg., 2005. 49(7): p. 575-585.
24. Korani, M., et al., Acute and subchronic dermal toxicity of nanosilver in
guinea pig. Int. J. Nanomed., 2011. 6: p. 855-862.
25. Sung, J.H., et al., Acute inhalation toxicity of silver nanoparticles. Toxicol. Ind.
Health, 2011. 27(2): p. 149-154.

152
26. EPA, U.S. http://www.epa.gov/iris/subst/0099.htm. 1987 [cited 2012 Nov. 11];
Available from: http://www.epa.gov/iris/subst/0099.htm.
27. Venugopal, B. and T.D. Luckey, Metal toxicity in mammals: chemical
toxicology of metals and metalloids. 1978, Academic Press: New York. p. 32-
36.

153
CHAPTER 7
CONCLUSIONS AND FUTURE WORK
7.1 Conclusions
To achieve the three main goals presented in Chapter 1, a systematic investigation
on the physicochemical properties and antimicrobial performance of AgNP in
electrolyte solutions and natural water conditions was conducted. Studies on the
application of AgNP in CWFs manufactured with different clay and burn-out materials
as well as application of TPA in CWFs were also conducted.
Various techniques, such as DLS, membrane ultrafiltration and ultrafiltration, and
ICP were applied to quantify the particle size, aggregation kinetics, surface charges,
and dissolution of AgNP. Antimicrobial performance on E. coli and MS2
bacteriophage were evaluated with a nano-metric respirometric technique and double
layer technique, respectively. Our results showed that AgNP can achieve up to 90%
antibacterial activity. However, negligible antiviral effects of AgNP were observed.
The stability of AgNP varies due to the different stabilizers applied. PVP-coated
AgNP are most stable compared with casein- and dextrin-coated AgNP. The
abovementioned physicochemical properties and antibacterial properties change in
different water chemistry conditions.
To apply the antimicrobial property of AgNP in drinking-water treatment, AgNP
have been coated on CWFs to purify drinking water. This research also focused on
establishing the silver application guidelines for CWF manufacturing. Silver
concentration in the effluent of CWFs has been measured to make sure the effluent

154
concentration is below the U.S. EPA MCL (0.1 ppm) to minimize the negative health
impacts of silver. Simple POU CWFs manufactured with different materials and
different concentrations of two types of silver (AgNP and Ag+) were studied. Bacterial
removal and biofilm formation inside the disks were dose-dependent on the amount of
silver applied. However, neither water chemistry conditions nor burn-out material
showed an effect on any of the abovementioned parameters evaluated at the silver
concentration tested. This study recommends applying a high concentration of AgNP
(≥0.3 mg/g) on CWFs to achieve improved antimicrobial performance.
Investigation on the antimicrobial performance of AgNP and TPA showed that
TPA-coated CWFs outperformed AgNP in a phosphate buffer solution. Amounts of
AgNP or TPA released from CWFs are similar. Our results also showed that the
disinfectant performance of TPA-applied CWFs exceeded AgNP-applied CWFs,
indicating that TPA can be considered as a good alternative to AgNP.
7.2 Future work
1. Our research on the environmental fate of AgNP has elucidated the dissolution
behavior of AgNP in different water chemistry conditions. However, the chronic
environmental ecotoxicity of AgNP is still unknown. Future studies are recommended
to cover the knowledge gap of their long-term (such as experimental duration in
months or longer) toxicological effect on different microorganisms (such as algae and
protozoa) and higher organisms (such as small fish embryos) in different water
chemistry conditions.
2. In the application of AgNP on CWFs, instead of using CWFs applied with 0.003
mg/g AgNP, we recommend to conduct studies on higher concentrations of AgNP
155
(such as 0.3 mg/g) under a selection of water chemistry conditions to evaluate
nanoparticle aggregation and silver particle size distribution in filter effluence. It is
also recommended to evaluate physicochemical interaction between clay and AgNP or
Ag+ on silver adsorption and LRV and the influence of these properties and the pore
size distribution of the porous matrix.
3. Although our study indicated that TPA can be considered as a good alternative to
AgNP in CWF applications, more information regarding the long-term health effects
of TPA is still needed. As our study focused on bacterial removal performances using
a phosphate buffer solution, natural water conditions are recommended to evaluate the
practicality of TPA-applied CWFs. Finally, we recommend the spectrum of water-
borne pathogens (such as viruses and protozoa) that contribute to waterborne diseases
be broadened. Future research on other quaternary ammonia functionalized silane
species is also suggested.

156
APPENDIX A
Table 2-1 Ion composition and pH across various water chemistry conditions
Cation Anion
Conc.(mg/L) Conc.(mg/L) Ionic
strength
(mM/L)
pH
Ca2+
(Cl-) 1000 1775 75 5.84
500 887.5 37.5 6.11
250 443.8 18.8 6.43
50 88.8 3.8 6.76
10 17.8 0.8 6.81
Ca2+
(NO3-) 1000 3100 75 6.13
500 1550 37.5 6.16
250 775 18.8 6.27
50 155 3.8 6.38
10 31 0.8 6.6
Na+(Cl) 648 1000 28.2 6.76
324 500 14.1 6.76
162 250 7.05 6.77
32.4 50 1.41 6.79
6.5 10 0.3 6.79
Na+(HCO3
-) 377 1000 16.4 9.26
188.5 500 8.2 9.16
94.3 250 4.1 8.78
18.9 50 0.82 7.5
3.77 10 0.164 7
K+(NO3
-) 629 1000 16.1 6.92
314.5 500 8.05 6.92
157.3 250 4 6.92
31.5 50 0.81 6.91
6.3 10 0.16 6.91
K+(SO4
2-) 812.5 1000 31.2 7
406.3 500 15.6 6.99
203 250 7.8 6.98
40.6 50 1.56 6.9
8.1 10 0.3 6.9
Mg2+
(SO42-
) 1000 4000 166.8 6.25
500 2000 83.4 6.34

157
250 1000 41.7 6.39
50 200 8.34 6.42
10 40 1.7 6.54
Humic acid 20 n/a n/a 6.5
10 n/a n/a 6.65
2 n/a n/a 6.66
1 n/a n/a 6.66
0.2 n/a n/a 6.65
158
APPENDIX B
1 Natural water sample collection and synthetic water preparation
Water samples were collected in Rhode Island from Thirty Acre Pond (Latitude:
+41.489220, Longitude: -71.546375) (surface water), Card Ponds (brackish water)
(Latitude: +41.371779, Longitude: -71572486), and Scarborough State Beach (seawater)
(Latitude: +41.385189, Longitude: -71.475431). The ground water was obtained at the
University of Rhode Island’s Kingston campus (Latitude: +41.487122, Longitude: -
71.526361). The water samples were transported to the laboratory where they were
filtered using filter paper (medium retention, cut-off size: 8 µm, Whatman) to remove
suspended solids. Then, the samples were autoclaved for 30 min at 121 0C to eliminate
microbiological contamination. Naturally occurring ions (Ca2+
, Mg2+
, Na+, K
+, Cl
-, SO4
2-,
and NO3-) were analyzed using ion chromatography (IC) techniques (DX-120, Dionex).
Total alkalinity was determined by phenolphthalein and methyl orange titration.
Dissolved natural organic matter (NOM) was measured as total organic carbon (TOC) via
a TOC analyzer (Apollo 9000, Tekmar Dohrman). Table S1 summarizes the
compositions of all natural water tested. Synthetic water solutions containing MgCl2,
CaCl2, and NaCl were prepared by adjusting the cation concentrations to 1,000 mg/L
(ionic strength: MgCl2, 125 mmol/L; CaCl2, 75 mmol/L; and NaCl, 43.5 mmol/L) to
study the influence of different cations on the disinfection performance and
physicochemical characteristics of the nanoparticles. The concentration of 1,000 mg/L
was selected because it mimics the concentration of the dominant divalent cation species
Mg2+
in seawater, in which the AgNP solution exhibited the lowest toxicity[1]. A humic
acid solution (TOC: 5 mg/L) was also prepared to study the influence of NOM on the

159
disinfection properties of AgNP. All salts and other reagents were ACS reagent grade and
used as received.
2 Microbial cultures
A non-pathogenic, wild strain of E. coli provided by IDEXX laboratories was used
for bacteria disinfection experiments. E. coli was selected because of its use as a specific
indicator of fecal contamination in drinking water and because of its extensive use in
several studies on AgNP [2-4].This allows the comparison of our results with the results
of previously published work. Bacteria were grown as described by Vigeant et al. (2002)
[5]. Cells were re-suspended in a sterilized solution prepared with the respective water
samples and synthetic water solution to a concentration of (1±0.4)×1010
CFU/mL.
Determination of the E. coli concentration was performed using the membrane filtration
technique, applying m-FC with Rosolic Acid Broth (Millipore) and 24-h incubation at
44.5 0C.
3 Determination of critical coagulation concentration
In brief, the initial aggregation rate of AgNP in different electrolyte solutions is
proportional to the change of particle radius (nm) over time (s) (dr
dt)
111 dr
kN dt
(eq.1)
Where k11is the initial aggregation rate of AgNP; N is the initial nanoparticle
concentration.
When the electrolyte concentration in AgNP solution is low, the strong repulsion forces
between AgNP will cause a low degree of aggregation, which is termed as slow
aggregation. After the added electrolyte solution reaches a certain concentration, the

160
aggregation of AgNP falls into the rapid aggregation regime, where the aggregation
energy barriers are completely removed and the aggregation rate is independent of the
increasing electrolyte concentration [6].
The attachment efficiency ―α‖, also defined as the inverse stability ratio (1/W), was
determined by calculating the ratio of a given k11 over the (k11)rapid, which is the
normalized k11 value in the rapid aggregation regime.
11
11
1
( )( )
rapidrapid
dr
k dtdrW k
dt
(eq.2)
Critical coagulation concentration (CCC) is defined as the estimate of the minimum
electrolyte concentration required to reach the rapid aggregation regime. It is determined
by the intersection of the extrapolations between the slow and rapid aggregation regime
[6]. In this study, CCC was determined as x-axis coordinate of the point of intersection
between the linear regression line of attachment efficiencies in the rapid aggregation
regime and the linear regression line of attachment efficiencies in the slow aggregation
regime.
For all the aggregation kinetics experiments, the same concentration of AgNP as
used in the antibacterial assay was applied (11.5 mg/L). DLS measurements of AgNP
solutions recorded the hydrodynamic radius as a function of time at 10 s time intervals.
The initial aggregation rate of AgNP was calculated by conducting a linear least-squares
regression analysis of hydrodynamic radius over time. Electrolyte solutions including
monovalent salt (NaCl) solution (Na+ concentration: 4,000-80,000 mg/L) and divalent
salt (CaCl2) solution (Ca2+
concentration: 100-8,000 mg/L) were prepared to compare the
effect of valence on the CCC values of AgNP. Humic acid (HA) solution (TOC: 5 mg/L)

161
mimicking the NOM was chosen to compare the aggregation kinetics in presence and
absence of HA.
4 Anti-bacterial assay
Different water samples and synthetic water solutions with monovalent salts,
divalent salts, and humic acid were prepared. Bacteria deactivation batch tests were
performed in duplicate using manometric respirometric equipment (OxiTop control
system, WTW Weilheim, Germany). An OxiTop control system includes a sample bottle
sealed with a measuring head, a small container for CO2 absorbent fixed at the neck of
the bottle, and an OxiTop controller for data recording. The test was based on automated
pressure measurements conducted via piezoresistive electronic pressure sensors in a
closed bottle at constant temperature. The anti-bacterial assay was conducted as described
by Zhang and Oyanedel-Craver. (2011) [7]. Different amount of electrolytes solutions, DI
water, and 10 mL E. coli (total 100 mL mixture, E. coli concentration: 1010
CFU/mL)
were inoculated into sample bottles. The sample bottles were sealed with the measuring
heads and placed in the incubator at 25 0C. The endogenous respiration was determined
by measuring the pressure drop within 2-3 h without adding carbon source or
nanoparticles. Then, 0.5 mL glucose of a 70 g/L was injected to determine the oxygen
uptake rate (OUR) without AgNP. Previous tests demonstrated that the amount of
glucose used was not fully consumed during the time length the tests were conducted
(data not shown). Finally, after about 2-3 h, 0.25 mL AgNP stock solution was injected
into the bottles to determine the alteration of the OUR due to the reduction of bacteria.
The total duration of the experiments was 20 h. The percentage of the bacteria reduction
using a modified equation from Tzoris et al. (2005) [8] was calculated using equation 1:

162
Disinfection Performance (%)=( ) 100c
t
P P
P P
(eq.3)
Where Pc is the OUR after the injection of glucose, Pt is the OUR after the injection of
AgNP, and P is the OUR during the endogenous respiration without the addition of
carbon source or nanoparticles. Figure A-1 presents a typical respiration curve. The
control groups without applying AgNPwere used to measure the toxicity of different
water conditions on E. coli. Natural water samples or electrolyte solutions were mixed
with10 mL E. coli (prepared in the same water condition) to a total 100 mL mixture, and
anE. coli concentration of 1010
CFU/mL. The endogenous respiration was determined by
measuring the pressure drop within 2-3 h without adding a carbon source. Then, 0.5 mL
of a 70 g/L aqueous glucose solution was injected to determine the OUR without
AgNP.The intrinsic bacteria decayat the different water conditionshave already been
subtracted leaving the pure disinfection performance of AgNP on E. coli. Compared to
conventional deactivation methods based on microbial growth (such as plate count
methods), the manometric respirometric method determines the activity of all active
bacteria (not only those that are able to grow). Other advantage is that this method is
based on the total oxygen uptake rate of all bacteria while the plate count method could
miscount colonies grown from bacteria aggregates because it considers them as
individual bacteria. A typical respiration curve in DI water is shown in Figure A-1:

163
Figure B-1. A typical respiration curve after 20 h of incubation at 25 0C with glucose
injection: 35 mg and AgNP concentration: 11.5 mg/L. P: Oxygen uptake rate during
endogenous respiration; Pc: Oxygen uptake rate after the injection of glucose; Pt:
Oxygen uptake rate after injection of AgNP.
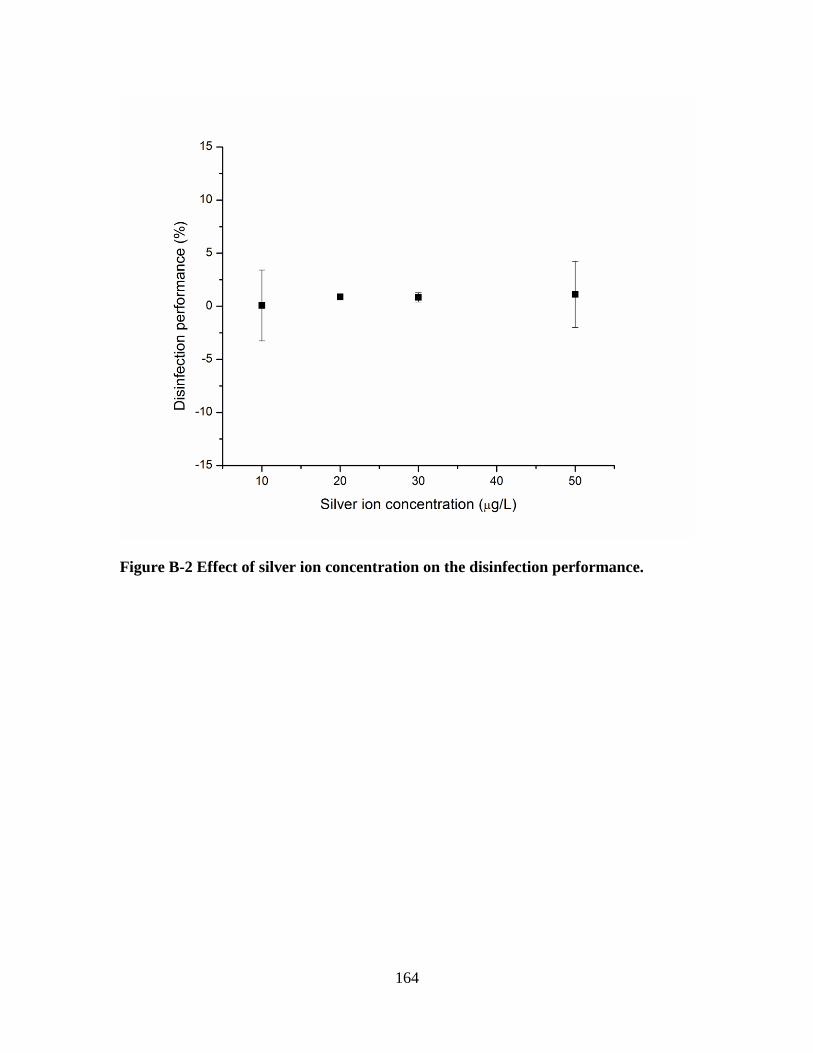
164
Figure B-2 Effect of silver ion concentration on the disinfection performance.

165
Figure B-3 Correlation of disinfection performance with particle size in the
synthetic water conditions without NOM content (MgCl2, CaCl2 and NaCl
solutions). The general trends show that the disinfection performance of the
individual AgNP decreases with increasing particle size.

166
Table B-1 Solution chemistries of natural water samples
DL: Detection limit
Water
samples
TOC
(mg/L)
Alkalinity
(mgCaCO3/L)
Total
Ag
(µg/L)
Major ions (mg/L) Ionic
Strength
(mmol/L) Na+
K+ Mg
2+
Ca2+
Cl- NO3
- SO4
2-
Ground
water
<DL 80 0.077 22 3 3 26 43 2 12 2.93
Surface
water
5.7 25 0.127 14 3 2 6 25 <DL 9 1.35
Brackish
water
7.8 33 0.1 300 12 30 14 520 <DL 76 18.7
Seawater
2.5 150 0.343 10,100 400 1,100 340 18,300 <DL 2,500 642

167
Table B-2 Comparison of particle sizes measured by DLS and TEM
Methods
AgNP
Average DLS sizes (nm) Average TEM sizes (nm)
AgNP-casein
58.0±2.6 12.6±5.7
AgNP-dextrin
27.9±0.3 11.6±4.4
AgNP-PVP
29.64±1.7 13.1±5.4

168
Table B-3 CCC values of AgNP in CaCl2 and NaCl solutions in the absence and
presence of HA
CCC of AgNP
Solutions
CCC of AgNP-
dextrin (mg/L)
CCC of AgNP-
casein (mg/L)
CCC of AgNP-
PVP (mg/L)
CaCl2 solutions
(TOC: 0 mg/L)
365 517 2,087
CaCl2 solutions
(TOC: 5 mg/L)
863 986 4,799
NaCl solutions
(TOC: 0 mg/L)
8,043 34,183 59,090
NaCl solutions
(TOC: 5 mg/L)
14,203 51,045 80,420

169
Table B-4 Correlation matrix of experimental parameters
Disinfection performance
Particle Size ZetaPotential
Silver ion Release
Cl-
concentration TOC
DivalentCation concentration
Disinfection performance
Pearson Correlation 1 -.306 -.609** .779
** -.544
** -.463
* -.595
**
Sig. (2-tailed) .121 .001 .000 .003 .015 .001
Particle size Pearson Correlation -.306 1 .496** -.237 .247 -.322 .641
**
Sig. (2-tailed) .121 .008 .233 .214 .102 .000
Zeta potential Pearson Correlation -.609** .496
** 1 -.485
* .420
* .015 .635
**
Sig. (2-tailed) .001 .008 .010 .029 .941 .000
Silver ion release Pearson Correlation .779** -.237 -.485
* 1 -.254 -.216 -.364
Sig. (2-tailed) .000 .233 .010 .201 .280 .062
Cl- concentration Pearson Correlation -.544
** .247 .420
* -.254 1 -.078 .777
**
Sig. (2-tailed) .003 .214 .029 .201 .700 .000
TOC Pearson Correlation -.463* -.322 .015 -.216 -.078 1 -.296
Sig. (2-tailed) .015 .102 .941 .280 .700 .134
DivalentCation concentration
Pearson Correlation -.595** .641
** .635
** -.364 .777
** -.296 1
Sig. (2-tailed) .001 .000 .000 .062 .000 .134
**. Correlation is significant at the 0.01 level (2-tailed).
*. Correlation is significant at the 0.05 level (2-tailed).

170
Table B-5 Correlation matrix between disinfection
performance and particle size
Disinfection
performance Particle size
Disinfection
performance
Pearson Correlation 1 -.891**
Sig. (2-tailed) .000
Particle size Pearson Correlation -.891** 1
Sig. (2-tailed) .000
**. Correlation is significant at the 0.01 level (2-tailed).
171
REFERENCES
1. Gao, J., et al., Dispersion and toxicity of selected manufactured nanomaterials
in natural river water samples: effects of water chemical composition. Environ
Sci Technol, 2009. 43: p. 3322-3328.
2. Choi, O., et al., The inhibitory effects of silver nanoparticles, silver ions, and
silver chloride colloids on microbial growth. Water Res, 2008. 42(12): p.
3066-3074.
3. Morones, J.R., et al., The bactericidal effect of silver nanoparticles.
Nanotechnology, 2005. 16(10): p. 2346-2353.
4. Oyanedel-Craver, V.A. and J.A. Smith, Sustainable colloidal-silver-
impregnated ceramic filter for point-of-use water treatment. Environ Sci
Technol, 2008. 42: p. 927-933.
5. Vigeant, M.A., et al., Reversible and irreversible adhesion of motile
Escherichia coli cells analyzed by total internal reflection aqueous
fluorescence microscopy. Appl Environ Microbiol, 2002. 68: p. 2794-2801.
6. Huynh, K.A. and K.L. Chen, Aggregation kinetics of citrate and
polyvinylpyrrolidone coated silver nanoparticles in monovalent and divalent
electrolyte solutions. Environ Sci Technol, 2011. 45(13): p. 5564-5571.
7. Zhang, H. and V. Oyanedel-Craver, Evaluation of the disinfectant performance
of silver nanoparticles in different water chemistry conditions. Journal of
Environmental Engineering, 2012. 138: p. 58-66.

172
8. Tzoris, A., V. Fernandez-Perez, and E.A.H. Hall, Direct toxicity assessment
with a mini portable respirometer. Sensors and Actuators B: Chemical, 2005.
105(1): p. 39-49.

173
APPENDIX C
Table C-2 Physical properties of ceramic disks manufactured with different
materials
Clay source and
Burn-out material
Advection
coefficient (cm/min)
Dispersion coefficient
(cm2/min)
Geometric
Porosity
(%)
Indo-sawdust 0.06±0.01 0.01±0.01 57±1.5
Tanz-sawdust 0.06±0.01 0.01±0.00 59±1.8
Nica-sawdust 0.09±0.01 0.05±0.03 54±1.5
Indo-rice husk 0.05±0.01 0.01±0.00 54±0.5
Tanz-rice husk 0.06±0.01 0.01±0.00 54±1.3
Nica-rice husk 0.10±0.01 0.09±0.05 49±1.6

174
Table C-3 Silver concentration in effluent over time from disks coated with
different concentrations of silver
Disk
material
Silver
type
Concent-
ration (mg/g)
Silver in effluent (ppb) over time (min) and
equivalent time (days) and throughput
(Liters) in full-sized filter
100 min
<1 day
9 L
200 min
<2 days
18 L
300 min
~2.5 days
27 L
1440 min
~12 days
130 L
Indo-
Sawdust
AgNP 0.003 86 73 4 ND
0.03 314 139 14 1
0.3 456 407 165 27
Ag+
0.003 223 36 2 ND
0.03 887 449 52 42
0.3 20935 3368 1063 797
Tanz-
Sawdust
AgNP 0.003 141 67 24 ND
0.03 198 78 28 ND
0.3 2377 634 59 46
Ag+
0.003 187 84 14 6
0.03 1816 209 127 51
0.3 27705 5404 1751 1414
Nica-
Sawdust
AgNP 0.003 155 32 17 ND
0.03 236 130 75 31
0.3 2927 1517 946 198
Ag+
0.003 181 323 94 17
0.03 2842 1206 218 65
0.3 25528 22321 7688 2698
ND: not detected
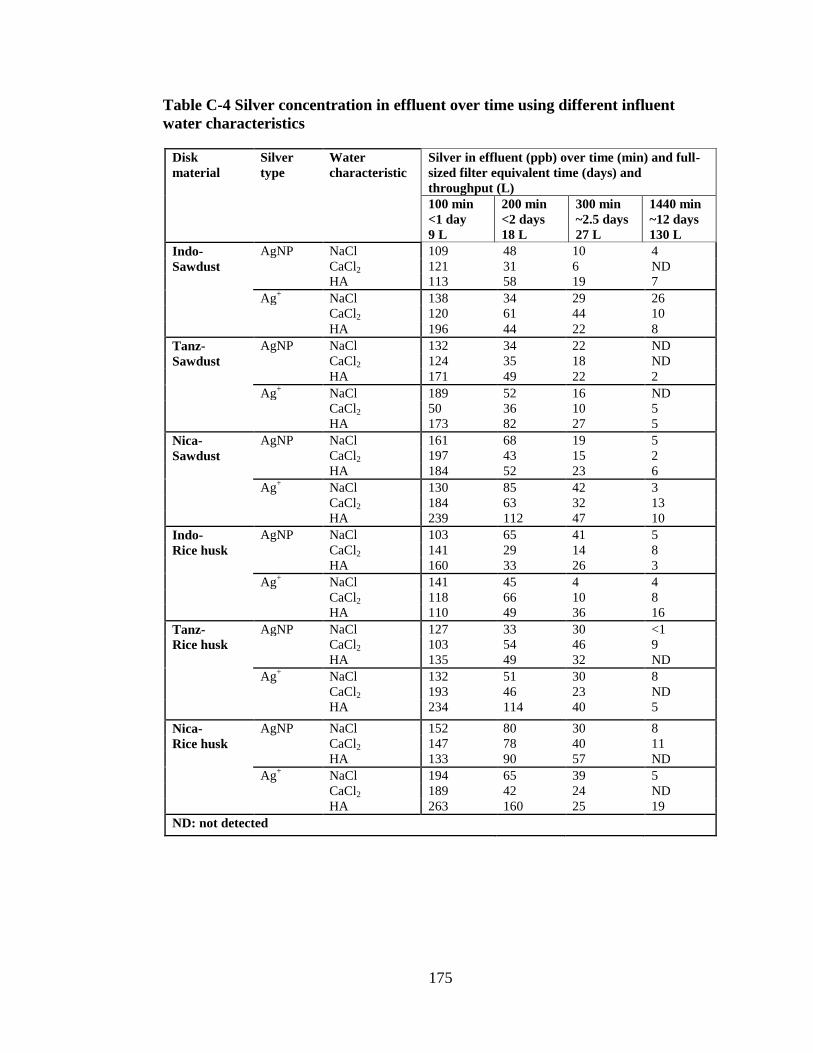
175
Table C-4 Silver concentration in effluent over time using different influent
water characteristics
Disk
material
Silver
type
Water
characteristic
Silver in effluent (ppb) over time (min) and full-
sized filter equivalent time (days) and
throughput (L)
100 min
<1 day
9 L
200 min
<2 days
18 L
300 min
~2.5 days
27 L
1440 min
~12 days
130 L
Indo-
Sawdust
AgNP NaCl 109 48 10 4
CaCl2 121 31 6 ND
HA 113 58 19 7
Ag+ NaCl 138 34 29 26
CaCl2 120 61 44 10
HA 196 44 22 8
Tanz-
Sawdust
AgNP NaCl 132 34 22 ND
CaCl2 124 35 18 ND
HA 171 49 22 2
Ag+ NaCl 189 52 16 ND
CaCl2 50 36 10 5
HA 173 82 27 5
Nica-
Sawdust
AgNP NaCl 161 68 19 5
CaCl2 197 43 15 2
HA 184 52 23 6
Ag+
NaCl 130 85 42 3
CaCl2 184 63 32 13
HA 239 112 47 10
Indo-
Rice husk
AgNP NaCl 103 65 41 5
CaCl2 141 29 14 8
HA 160 33 26 3
Ag+ NaCl 141 45 4 4
CaCl2 118 66 10 8
HA 110 49 36 16
Tanz-
Rice husk
AgNP NaCl 127 33 30 <1
CaCl2 103 54 46 9
HA 135 49 32 ND
Ag+ NaCl 132 51 30 8
CaCl2 193 46 23 ND
HA 234 114 40 5
Nica-
Rice husk
AgNP NaCl 152 80 30 8
CaCl2 147 78 40 11
HA 133 90 57 ND
Ag+ NaCl 194 65 39 5
CaCl2 189 42 24 ND
HA 263 160 25 19
ND: not detected

176
Figure C-4Concentration of silver in effluent (ppb) as a function of time (hours)
from disks manufactured with Indonesian clay and sawdust (a) or rice husk (b),
Tanzanian clay and sawdust (c) or rice husk (d), and Nicaraguan clay and
sawdust (e) or rice husks (f) as burn-out material using different influent water
chemistry conditions.

177
0
20
40
60
80
100
Indo-Saw Indo-Rice Tanz-Saw Tanz-Rice Nica-Saw Nica-Rice
Silv
er r
eten
tio
n in
dis
ks (
%)
Ag+-NaCl
Ag+-CaCl2
Ag+-HA
Ag+ (b)
Figure C-5 Percent silver retention in disks manufactured with clay from
Indonesia, Tanzania or Nicaragua and Sawdust (saw) or rice husk (rice) as burn-
out material coated with 0.003 mg/g of AgNP (a) or Ag+ (b) using different
influent water chemistry conditions

178
Figure C-6 LRV of disks made with sawdust and Indonesian clay with AgNP (a)
or Ag+ (b), Tanzanian clay with AgNP (c) or Ag+ (d) and Nicaraguan clay with
AgNP (e) or Ag+ (f) using different influent water chemistry conditions
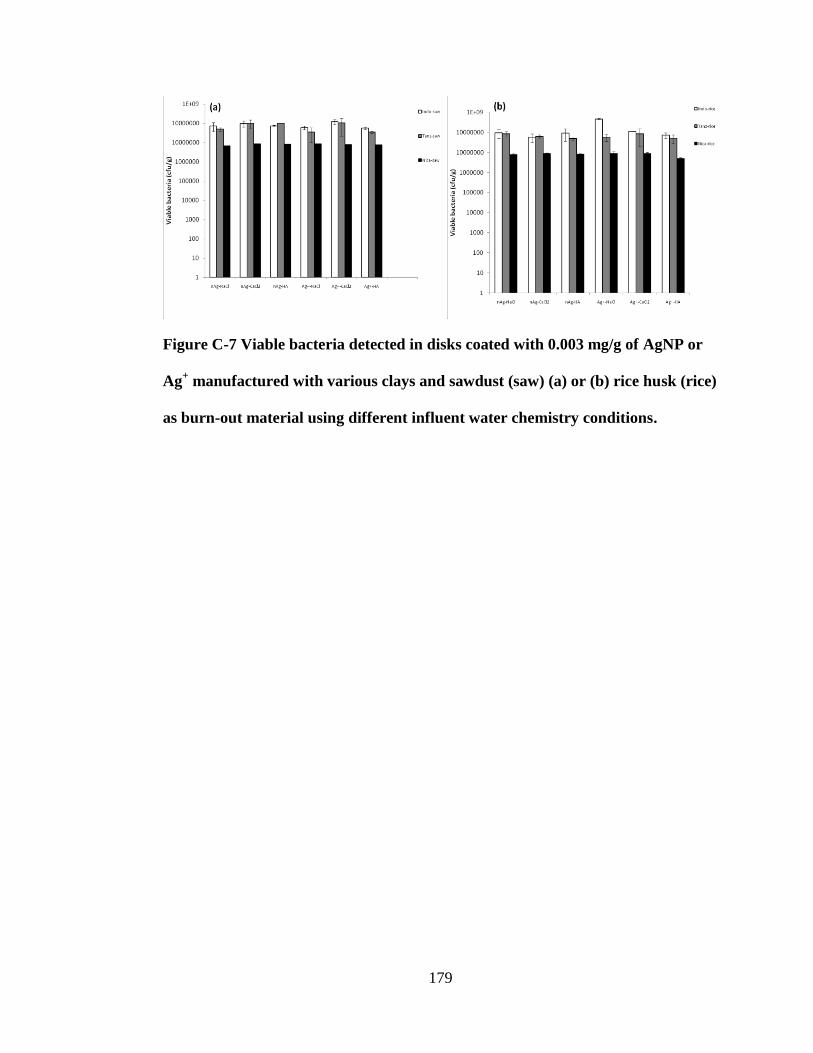
179
Figure C-7 Viable bacteria detected in disks coated with 0.003 mg/g of AgNP or
Ag+ manufactured with various clays and sawdust (saw) (a) or (b) rice husk (rice)
as burn-out material using different influent water chemistry conditions.

180
APPENDIX D
Figure D-1 Average particle sizes, ζ-potentials, and particle size distribution of
AgNP and TPA 10% phosphate buffer solution.