application of synchrophasors in power plants incorporated ... · pdf file•application of...
TRANSCRIPT

• Application of Synchrophasors in Power Plants Incorporated with Condition Monitoring Systems
• Nagarjun.Y
• Assistant Engineer
• Karnataka Power Corporation Limited
• IndiaK P C L

Outline
• Synchrophasor Technology
• Potential Applications in Power Plants
• Integrating with Condition Monitoring
Systems

EMS – 60’s & 70’s Analog, hardwired
The Grid of Future – Smart Grid Evolution

Synchrophasor Technology
Courtesy: CERTS/EPG
Traditional Measurements Synchrophasor Measurements
Voltage Voltage, Current, Frequency
(rate of change)
MW, MVAR MW, MVAR
RMS Magnitude Magnitude & phase angle
Average sampling over 100ms 1-5 cycle averaging
Reporting 1-2s Report 10-60 per second
Time tag at EMS Time tag at measurement

SCADA Data Vs PMU Data
Courtesy: NASPI
SCADA Data PMU Data
Refresh rate 2-5 seconds Refresh rate 30-60 sample/sec
Latency and skew Time tagged data, minimal
latency
‘Older’ legacy communication Compatible with modern
communication technology
Responds to quasi-static
behavior
Responds to system dynamic
behavior
Frequency change means:
Sudden Gen-Load MW
imbalance somewhere in the
grid
Angle-pair change means:
Sudden MW change in a
specific location of the grid
X-ray MRI
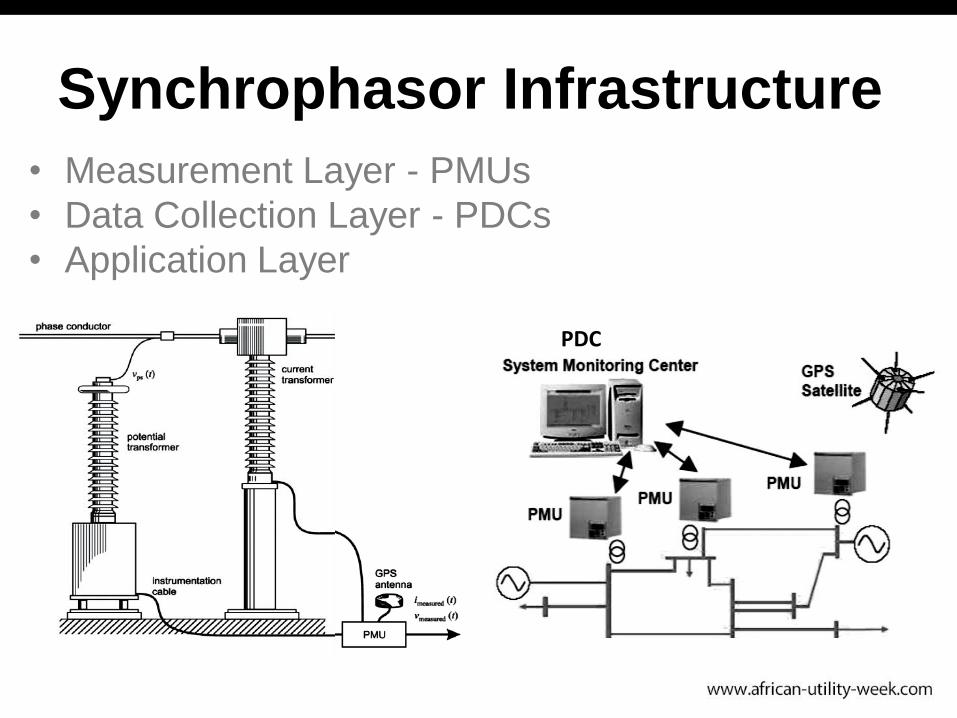
Synchrophasor Infrastructure
• Measurement Layer - PMUs
• Data Collection Layer - PDCs
• Application Layer
PDC

Synchrophasor Technology Worldwide
India
RussiaJapan
Brazil
World Wide
Europe
N.America
China
JapanIndia
Russia
S.Africa
Brazil
Mexico
Australia

PMUs in Europe
France
Switzerland
Italy
Spain
Denmark
Norway
Finland
Sweden
Iceland

PMUs in North America
as of 2007 as of 2014Over 2000 deployed

PMUs in Eastern Europe, Central
Asia & Siberia Interconnected power system (IPS) Ukraine
Belorussia
Latvia
Lithuania
Estonia
Moldova
Georgia
Azerbaijan
Uzbekistan
Kyrgyzstan
Tajikistan
Mongolia
Unified power system (UPS) Russia
Kazakhstan 26 PMUs are located in major power plants
and substations on UPS and IPS

PMUs in China
• Over 1000 PMUs deployed
• All 500kV and above substations and 100 MW
and above power plants have PMUs

PMUs in India
As of 2010 - 04 PMUs
As of 2014 - 62 PMUs
A approval to install 1700
PMUs, 32 PDCs and
Analytic software at 6.5
Billion INR is approved
under URTDSM Scheme,
which includes 11,000 km
of optical fiber.

Synchrophasor Project
Architecture in India
Setup at the NLDC
Site installation
Pre.1991 Dec. 2013
WRER
NR
NER
SR
Total - 62 PMUsNR - 14 Nos.
WR - 16 Nos.
ER - 12 Nos.
SR - 12 Nos.
NER - 08 Nos.

Operational Experiences
• Fault detection, classification and analysis
• Low Frequency Oscillation
• Detection of Coherent Group of Generators
• Islanding Detection and their resynchronization with
the grid
• Dynamic Model Validation Using Synchrophasor data
• Visualization of PSS testing
• Monitoring of Natural disasters(Reference: POSOCO Report on Synchrophasors Initiative in India)
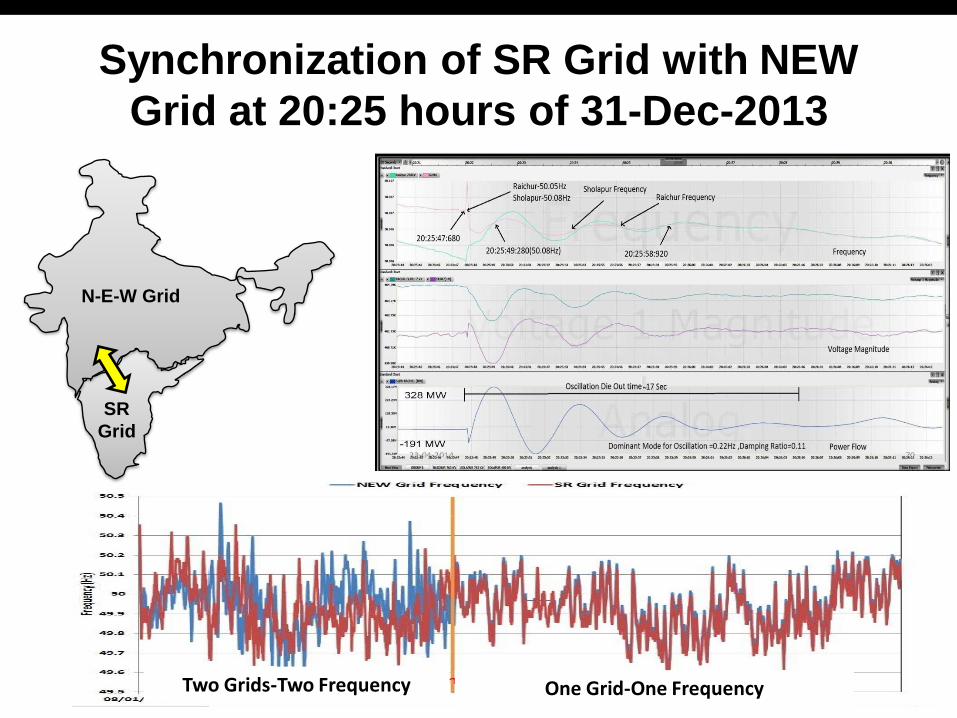
Synchronization of SR Grid with NEW
Grid at 20:25 hours of 31-Dec-2013
N-E-W Grid
SR
Grid
Two Grids-Two Frequency One Grid-One Frequency

Low Frequency Oscillation
On 9-12 August 2014
Coherent Group observed for 0.75 Hz Coherent Group observed for 0.6 Hz
Oscillations in Grid has resulted in tripping of
Generating units and lines

APL Mundra Station, Gujarat
Figures are examples of long-term data used to analyze the effects of power
system disturbances on critical stations
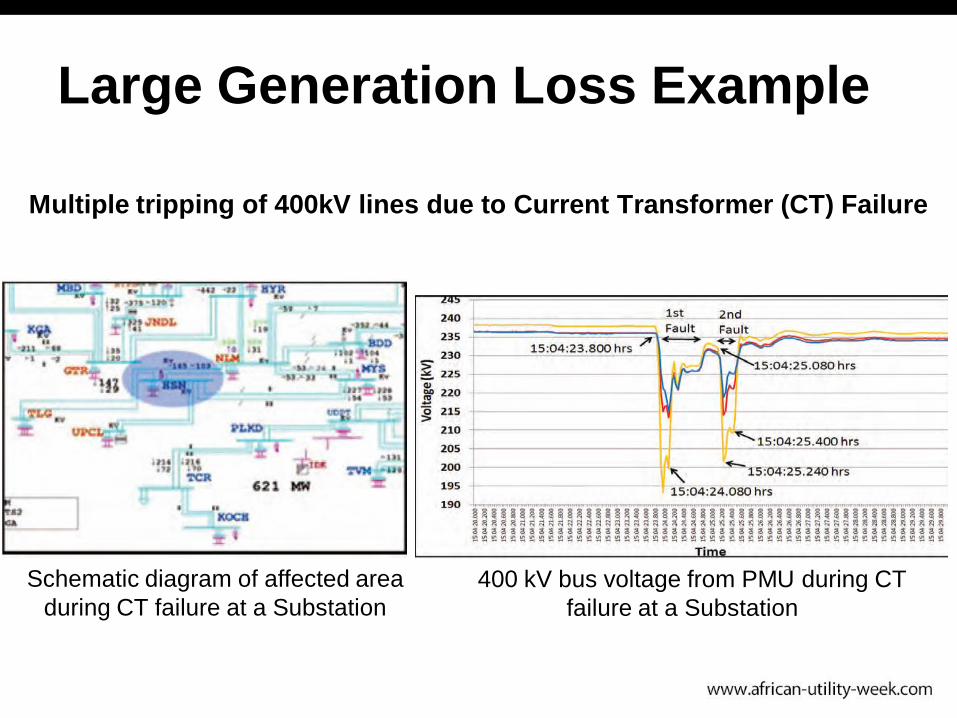
Multiple tripping of 400kV lines due to Current Transformer (CT) Failure
Schematic diagram of affected area
during CT failure at a Substation
400 kV bus voltage from PMU during CT
failure at a Substation
Large Generation Loss Example

Tripping of running Units at
Vijayawada Thermal Power Station (VTPS)
SCADA diagram displaying the area affected400 kV Ramagundam bus voltage during
tripping at Vijayawada TPS
Large Generation Loss Example
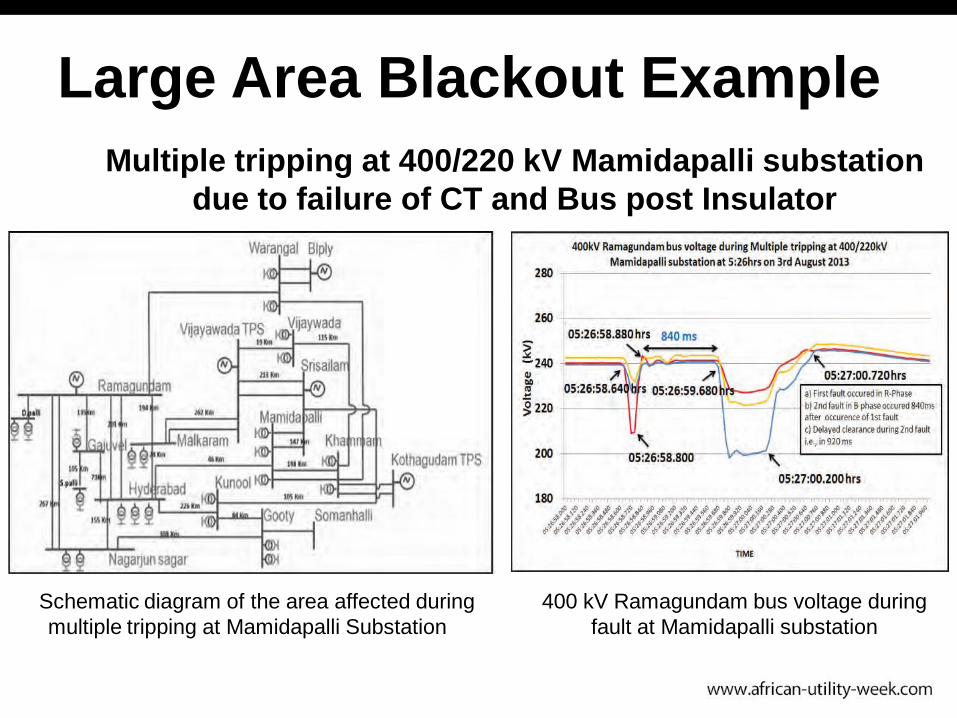
Schematic diagram of the area affected during
multiple tripping at Mamidapalli Substation
400 kV Ramagundam bus voltage during
fault at Mamidapalli substation
Multiple tripping at 400/220 kV Mamidapalli substation
due to failure of CT and Bus post Insulator
Large Area Blackout Example

Essential applications in Power Plants
• Measure – MW, MVAR, frequency, Terminal voltage, field V & I
• Rotor Angle Measurement - Record synchronizing time
• Asset management - Event analysis, Equipment mal-operations
and health monitoring and model validation
• Tariff requirements

Monitoring Module
Condition MonitoringSensors
Monitoring Centre / Server
PMUs
Integrating PMUs with Online Condition Monitoring

• Generator settings verification
• Equipment commissioning
• Monitoring system current unbalance to
protect large generator rotors
• Turbine monitoring
• Relay conversion to PMU
Applications in the Future

– Technology Deployment
– Data Identification
– Data Handling
– Maintenance & Problem Identification
– Data Transmission
– Renewable Resource Integration
Challenges
Conclusion
With massive installation of PMUs, grid control has
improved to a large extent to make the Grid Smart
But the reality is…..
‘Large Blackouts will occur again in the future’…..
Our power grid is too complex to make it fail-safe…..!

Thank You
So, are we a Utility of the future to face the Challenge…?