application of thermodesorption and pyrolysis-gc–aed to the analysis of river sediments and sewage...
TRANSCRIPT

Journal of Analytical and Applied Pyrolysis62 (2002) 297–318 www.elsevier.com/locate/jaap
Application of thermodesorption andpyrolysis-GC–AED to the analysis of river
sediments and sewage sludges forenvironmental purpose
Pierre Faure, Franck Vilmin, Raymond Michels *,Emilie Jarde, Laurence Mansuy, Marcel Elie, Patrick Landais
Uni�ersite Henri Poincare, UMR G2R 7566, 54506 Vandoeu�re Les Nancy, BP239, France
Received 10 July 2000; accepted 29 January 2001
Abstract
Flash Pyrolysis coupled with Gas Chromatography and Atomic Emission Detection(PyGC–AED) is applied to river sediments and sewage sludges. The chromatogramsobtained on such samples are complex and special care must be taken in the tuning of thepyrolyzer, the chromatographic program and the atomic emission detector. Thus, thermodes-orption and pyrolysis conditions are defined in order to obtain a good reproducibility of thepyrograms. The atomic emission detector parameters (make-up flow, reactant gases purityand pressures) are studied in order to obtain a good compromise between selectivity andsensitivity. Tuning and analyses are focused on C, N, S, O, Cl. Multi-elemental detection isshown to be a useful tool for specifying the organic heteroatomic compounds distribution inthe pyrograms of river sediments and sewage sludges. Comparison with PyGC–MS analysesperformed in similar conditions is made. The variability in composition of the samples isclearly revealed. Furthermore, the presence of chlorinated organic compounds is evidenced insome samples. Step by step thermodesorption combined with flash pyrolysis is used in orderto gain information on how the chlorine is associated to the matrix; i.e. adsorbed and/ortightly bound chlorine. The total chlorine content and the adsorbed/bound chlorine ratio ofthe samples are measured using compound independent calibration. © 2002 Elsevier ScienceB.V. All rights reserved.
Keywords: Flash pyrolysis; Atomic Emission Detection; Mass spectrometry; Sewage sludge; Riversediments; Organic micro-pollutants
* Corresponding author. Tel.: +33-383-913838; fax: +33-383-913801.E-mail address: [email protected] (R. Michels).
0165-2370/02/$ - see front matter © 2002 Elsevier Science B.V. All rights reserved.PII: S0165 -2370 (01 )00127 -9

298 P. Faure et al. / J. Anal. Appl. Pyrolysis 62 (2002) 297–318
1. Introduction
Analytical pyrolysis coupled with gas chromatography is a fast and powerful toolfor the characterization of macromolecules. Depending on the type of detectorcoupled to the gas chromatograph, qualitative as well as quantitative informationcan be obtained on the samples. Such techniques are used in organic geochemistryfor the characterization of sedimentary organic matter [1–3]. In order to obtainstructural information on the compounds generated upon pyrolysis, mass spec-trometry is generally used. Indeed, PyGC–MS is a well-established technique forthe characterization of fossil [4–8] or recent organic matter [9–16] in the fields oforganic geochemistry and environmental sciences. Specific detectors such as FPD(Flame Photometric Detector) and NPD (Nitrogen Phosphorus Detector) coupledwith PyGC are used for fingerprinting or are combined with mass spectrometry toimprove the identification of compounds classes. In this last case, the analyticalmethodology focuses only on the compounds revealed by the specific detector. TheFPD detector revealing the presence of sulfur or phosphorus-bearing compounds, isused for the quantitative analysis of sulfur in coal [17] and for the detection ofspecific organic sulfur compounds (such as thiophenes, thiolanes, thianes andbenzothiophenes) [18]. The NPD [3,19,20] detector is used to study nitrogen bearingcompounds.
Despite these detectors being very selective, they must be combined with auniversal detector such as FID, in order to obtain a chromatogram showing all theorganic compounds present. This can be performed by using two different analyti-cal set-ups or by using a split located between the chromatographic column and thedetectors. Moreover, in the case of the FPD detector, the analysis of organic sulfurcompounds is strongly disturbed by the optical ‘quenching’ effect due to coelutionwith high molecular mass hydrocarbons. This detector is also known for itsnon-linear response which complicates quantitative analysis.
The use of Atomic Emission Detection (AED) avoids such drawbacks as far asthe detector response is proportional to the concentration of sulfur in the plasma ofthe detector and is independent of the chemical structure of the molecules (with theexception of products such as polyaromatics). With this detector, selective pyro-grams on C, S, N can be obtained in one analysis. In addition, many other elementsincluding oxygen and halogens can be detected.
In the literature, many publications show application of the PyGC–AED tosedimentary organic matter e.g. to quantify elemental sulfur in coal [21], to studypolyaromatic sulfur compounds in fossil fuels [22], to characterize nitrogen-bearingmolecules in recent sediment [23] and for the analysis of heavy compounds rich inheteroatoms [24–26]. Seeley et al. [26] used this technique in order to characterizeshale and immature kerogens. Sinninghe Damste et al. [24] identified alkyl–pyrrolesin kerogens combining PyGC–AED and PyGC–MS. However, most of the fossilorganic matter from sediments (kerogen, bitumen) is fairly poor in heteroatomiccompounds that can be easily detected by the PyGC method. This is not the casefor modern sediments [23] and especially those contaminated by anthropic activity.

299P. Faure et al. / J. Anal. Appl. Pyrolysis 62 (2002) 297–318
As demonstrated elsewhere [15] analytical techniques derived from organic geo-chemistry can be applied to environmental studies. This approach provides thebackground in which the use of PyGC–AED is described here.
2. Experimental
2.1. Flash pyrolysis-gas chromatography–atomic emission detection
The PyGC–AED system used in this study is composed of a SGE pyrojector(Fig. 1) connected to the injector system of a HP6890 gas chromatograph coupledwith a HP G2350 Atomic Emission Detector. Each device as well as analyticalconditions are described hereafter.
2.1.1. Pyrolysis parameters.The SGE pyrolyzer (Fig. 1) is connected to the split/splitless injector of the
HP6890 chromatograph. The solid sample is loaded in a syringe and injectedthrough the septum into the pyrolysis chamber. The temperature rate on such
Fig. 1. Schematic diagram of the SGE pyrojector.

300 P. Faure et al. / J. Anal. Appl. Pyrolysis 62 (2002) 297–318
Fig. 2. Repeatability of the temperature profiles obtained with the SGE pyrolyzer for the 150–300 °Cheating step (thermodesorption) (a) and the 300–620 °C heating step (pyrolysis) (b).
pyrolyzer can not be programmed. Therefore, the temperature ramps used forthermodesorption/pyrolysis in this study correspond to the fastest rates than can beobtained when the control temperature is set to a given value. Good reproducibilityis however obtained (Fig. 2a and b). Three different pyrojector temperature wereused: (i) the flash pyrolysis was carried out directly at 620 °C (program 1); (ii) atemperature step at 150 °C was sometimes used in order to remove adsorbed waterand volatiles from the samples prior to the flash pyrolysis (program 2); and (iii)after the drying step at 150 °C, a thermodesorption at 300 °C prior to the flashpyrolysis at 620 °C was also carried out (program 3). These pyrolysis conditionsare described in Table 1.
2.1.2. Parameters of the gas chromatographThe HP6890 chromatograph was equipped with a split/splitless injector and a 60
m DB-5 J & W, 0.25 mm i.d., 0.1 �m film fused silica column. Gas chromatographyconditions are described in Table 1.

301P
.F
aureet
al./J.
Anal.
Appl.
Pyrolysis
62(2002)
297–
318
Table 1Analytical conditions for flash pyrolysis (program 1), drying – flash pyrolysis (program 2) and drying – thermodesorption-flash pyrolysis (program 3) usingthe PyGC–AED system.
Program 3Program 1 Program 2TdGC–AED+PyGC–AEDPyGC–AEDPyGC–AED
0.8–1.2 mgPyrolyser Sample weight0 ml/minSeptum purge
25 ml/min during 1 min, then 0 ml/minHelium flowProgram of 1st step: 150 °C1st step: 150 °C
2nd step: 150–620 °C 2nd step: 150–300 °Ctemperature 620 °C3rd step: 300–620 °C
Interface 300 °CGC2 ml/minSeptum purge
75/1 during 1 min, then 50/1Split ratioColumn flow 1 ml/min (constant flow)
1st step: 40 °C during 5 min,Oven temperature 1st step: 40 °C during 5 min,40 °C during 5 min, 6 °C/min up to30°C/min up to 200 °C 30 °C/min up to 200 °C300 °C during 15 minprogram
2nd step: 40 °C during 5 min,2nd step: 40 °C during 5 min,10 °C/min up to 300 °C during 515 °C/min up to 300 °C during 15
min min3rd step: 40 °C during 5 min,6 °C/min up to 300 °C during 15min
302P
.F
aureet
al./J.
Anal.
Appl.
Pyrolysis
62(2002)
297–
318
Table 1 (Continued)
Program 3Program 1 Program 2TdGC–AED+PyGC–AEDPyGC–AED PyGC–AED
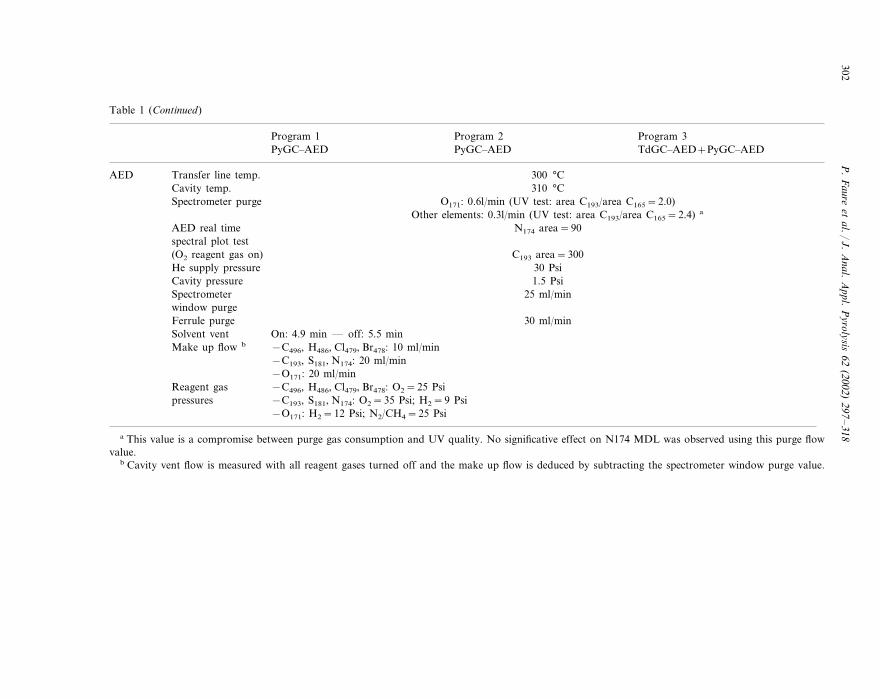
AED Transfer line temp. 300 °CCavity temp. 310 °C
O171: 0.6l/min (UV test: area C193/area C165=2.0)Spectrometer purgeOther elements: 0.3l/min (UV test: area C193/area C165=2.4) a
N174 area=90AED real timespectral plot test
C193 area=300(O2 reagent gas on)30 PsiHe supply pressure
Cavity pressure 1.5 PsiSpectrometer 25 ml/minwindow purgeFerrule purge 30 ml/min
On: 4.9 min — off: 5.5 minSolvent ventMake up flow b −C496, H486, Cl479, Br478: 10 ml/min
−C193, S181, N174: 20 ml/min−O171: 20 ml/min−C496, H486, Cl479, Br478: O2=25 PsiReagent gas
pressures −C193, S181, N174: O2=35 Psi; H2=9 Psi−O171: H2=12 Psi; N2/CH4=25 Psi
a This value is a compromise between purge gas consumption and UV quality. No significative effect on N174 MDL was observed using this purge flowvalue.
b Cavity vent flow is measured with all reagent gases turned off and the make up flow is deduced by subtracting the spectrometer window purge value.
303P. Faure et al. / J. Anal. Appl. Pyrolysis 62 (2002) 297–318
A constant helium flow must be chosen in order to optimize chromatographyperformance but also to obtain a regular flow for the plasma in the AED. Indeed,the column flow has a significant influence on the elemental response coefficients,especially for samples containing compounds eluting over a wide temperature range[27]. The split rate (Table 1) is determined in order to maximize the signal on thecarbon channel of the AED without overloading the column. However, the valuesused are not optimal for all samples as pyrolysis yields vary.
2.1.3. Atomic emission detectorThe operating conditions of the HP G2350 Atomic Emission Detector are
described in Table 1. In the following text, each element recorded by the AED willbe named after its chemical symbol (e.g. Cl for chlorine) and the wavelength atwhich it is detected (e.g. Cl496: chlorine detected at 496 nm).
The values indicated in the operating conditions (Table 1) take into accountfactors that are specific to the various compromises one must reach in order toanalyze complex organic mixtures generated during the flash pyrolysis of sedimentsand sewage sludge. However, other factors directly related to the nature of theAtomic Emission Detection device must be taken into account. For example, it hasbeen shown that the sensitivity for Nitrogen and Oxygen is strongly dependent onthe quality of the background (absence of air in the plasma cavity) and on thequality of the spectrometer purge [28]. The purity of the nitrogen used to purge thecavity (to remove water and oxygen) has a significant effect on the detection limitfor oxygen. Thus special attention must be taken compared to more conventionaldetectors.
Also, detector performance needs to be carefully adjusted. If instrument specifica-tions are followed for the tuning of the plasma make-up flow (40 ml/mn) andreacting gas mixture, a compromise allowing to obtain good detector performanceon a maximum of elements at once is reached. However, when looking for aparticular element, it is possible to significantly increase the performance throughspecific tuning [28]. For C, N, S, we reduced the make up flow to 20 ml/min inorder to lower the detection limit for nitrogen in particular. Even better detectionlimit for nitrogen can be obtained if the flow is reduced to 10 ml/min, but then, theselectivity for carbon is significantly affected. In the case of chlorine, the make upflow can be reduced to 10 ml/min without altering the selectivity. The detectionlimit can also be improved by reducing the oxygen pressure, provided that carbondeposits on the AED discharge tube are avoided. For the analysis of oxygen, themake up flow is tuned to 20 ml/min. This parameter alone has no influence on thedetection limit. However, when the tuning of the make up flow is performedtogether with the optimization of the reactant gas mixture of the plasma (H2 andCH4), the detection limit can be improved by about 50%. Fig. 3 shows that acompromise must be taken between detection limit and selectivity.
2.1.4. Signal treatmentAfter optimization of the selectivity of each channel, a baseline correction for the
nitrogen and oxygen pyrograms is applied. For carbon, the baseline shift can beignored. Two types of baseline corrections can be considered:

304P
.F
aureet
al./J.
Anal.
Appl.
Pyrolysis
62(2002)
297–
318
Fig. 3. Optimization of reagent gases for the analysis of oxygen. The top of the figure shows the relationship between the reagent gases pressure in the plasma(H2 and N2/CH4 mixture) and the detection limit for oxygen (O171) channel. The bottom of the figure shows the relationship between the reagent gasespressure and the selectivity of the detector for oxygen.

305P. Faure et al. / J. Anal. Appl. Pyrolysis 62 (2002) 297–318
(A) substraction by a blank analysis obtained using the same conditions as for arun with a sample.
This method was dismissed for two reasons: (i) the resulting chromatogramscontains a background noise significantly higher than the untreated chro-matograms. Indeed, although the variance of the background noise in a rawpyrogram is �n
2, this value becomes 2�n2 for the pyrogram obtained after the
subtraction process. The background noise is thus artificially increased by about40%; (ii) the analysis time is doubled because blank runs must be performed aftereach acquisition in order to take into account the shift of the baseline through time.
(B) correction of the baseline by an algorithm developed by Nielsen et al. [29]This method is unsuitable when the chromatogram presents Unresolved Com-
pounds Mixture (UCM) which are artificially removed by the mathematical pro-cessing. However, no UCM is observed for the oxygen and nitrogen signalsobtained for our samples. Therefore this baseline correction was used.
2.2. Flash pyrolysis-gas chromatography–mass spectrometry (PyGC–MS).
All samples were analyzed by PyGC–MS using the same SGE pyrolyzer describepreviously (Fig. 1) connected to the split–splitless injector of a HP5890 series II gaschromatograph coupled with a HP 5971 mass spectrometer. The gas chro-matograph was equipped with a 60 m DB-5 J & W, 0.25 mm i.d., 0.1 �m film fusedsilica column. Chromatography conditions were the same as those used for PyGC–AED in order to allow precise comparison of the pyrograms (Table 1).
2.3. Samples
Two types of samples were tested: (i) 15 sediments collected in rivers of easternFrance, known for being polluted by various agricultural and industrial activities;(ii) 30 sewage sludges from industrial and urban wastewater treatment plants aswell as from a lagoonal purification system, all located in eastern France.
River sediments and sewage sludge samples were centrifuged at 6000 rpm during30 min in order to remove the bulk of the water. After pipetting of the water, theresidue was freeze dried during 5 days. Afterwards, the samples were powdered andsieved in order to recover a 40–160 �m size fraction. 0.8–1.2 mg of aliquots wereinjected into the PyGC–AED or the PyGC–MS devices without further treatment.
3. Results
PyGC–MS analyses in ‘Fullscan’ mode of our samples yielded very complexchromatograms. Fig. 4 illustrates the type of signals obtained on a river sedimentand on a urban sewage sludge after PyGC–MS and PyGC–AED. Peak assigne-ments (Table 2) underline the high variability of molecules encountered in thesetypes of samples. The pyrograms detected from MS and AED are very similar.However, the pyrograms from AED show systematically a higher proportion of low

306P
.F
aureet
al./J.
Anal.
Appl.
Pyrolysis
62(2002)
297–
318
Fig. 4. Comparison of the pyrograms (620 °C) obtained by PyGC–MS (‘Fullscan’) and PyGC–AED (C193 channel) on a River sediment sample and asewage sludge using program 1 (Table 1). Note the complexity of the compounds distribution as well as the many unresolved peaks.

307P. Faure et al. / J. Anal. Appl. Pyrolysis 62 (2002) 297–318
molecular weight molecules (especially benzene and toluene-peaks 1 and 4, Table2). Indeed, the mass spectrometer is adjusted in order to detect fragments in therange 50–550 amu. As a matter of fact, fragmentation of low molecular weightmolecules generates high proportions of ions that fall under the mass range atwhich the mass spectrometer operates.
Table 2Identification of the different peak on pyrograms of Fig. 4.
CompoundsNo
1 BenzenePyridine2Pyrrole3
4 Toluene (C1-Benzene)5 Furancarboxaldehyde (Furfural)
C1-Pyrrole6C2-Benzene7
8 StyreneC1-Cyclopentenone9C2-Pyrrole10
11 C1-Furancarboxaldehyde (C1-furfural)C3-Benzene12Phenol13
14 C1-StyreneC1-Phenol15Benzeneacetonitrile16C2-Phenol17Naphtalene18
19 C1-Methoxy-phenol (C1-Guaiacol)Vinyl-phenol20Benzenepropanitrile21
22 C3-PhenolIndole23
24 C1-NaphtaleneVinyl-methoxy-phenol25C1-Indole26Eugenol27C2-Naphtalene28C2-Indole29Dodecanoic acid30Tetradecanoic acid31
32 Pentadecanoic acidC3-Naphtalene33
34 Phenanthrene35 Hexadecanoic acid36 C1-Phenanthrene37 Octadecanoic acid38 Hexadecanamide39 Biomarkers (Steroids)� n-Alkenes
n-Alkanes*

308 P. Faure et al. / J. Anal. Appl. Pyrolysis 62 (2002) 297–318
In order to characterize the molecular content of the PyGC–MS traces, series ofselected ion chromatograms characterizing specific compounds classes were used.Although an important proportion of molecules was identified, many peaks re-mained unknown because of coelution resulting in overlapping mass spectra. Thepresence of organic micropollutants, such as heteroatomic molecules (PCB, pesti-cides...) was difficult to assess, especially when they were unknown to occur in thesamples. Thus, instead of identifying systematically all the compounds present in achromatogram which is time consuming and sometimes unfeasible, PyGC–AEDallowed to discriminate samples through the combination of several element specificpyrograms. This technique was able to quickly reveal the presence of contaminantsby using selective detection of elements. As example, the C193, S181, O171 and N174
channels pyrograms from a river sediment are shown in Fig. 5.However, it was crucial to have optimal control of the detector parameters in
order to obtain good results, especially for oxygen and nitrogen. This was impor-tant as far as most samples yielded molecules containing 1 or 2 heteroatoms(oxygen for example) for 10–20 atoms of carbon. The detector response for a givencompound being directly related to the total amount of elements present in thepeak, the detector response on the carbon channel was 10–20 times stronger thanon the oxygen channel. Without proper optimization of the detector, the oxygensignal would have remained close to the detection limit and oxygenated compoundswould have been overlooked.
3.1. Analysis of ri�er sediments
PyGC–AED was applied to characterize sediments from various rivers of easternFrance using detection on the C193, N174, S181 and O171 channels. The presence ofmolecular sulfur was evidenced by comparison between the chromatogramsrecorded on the S181 and the C193 channels (Fig. 5). The presence of molecularsulfur in natural samples (MS Fig. 5b) was very often a drawback in ourPyGC–MS analysis, as this compound induced distortion in the baseline bycovering other significant organic compounds. In the PyGC–AED analysis, themolecular sulfur (Fig. 5) did not alter the chromatogram recorded on the carbonchannel.
The presence of organic sulfur compounds, pointed out by PyGC–AED, wereidentified as dimethyl-disulfide, methyl-thiophenes, benzothiozole and methylthio-benzothiazole (Fig. 5b) using PyGC–MS. Nitrogen compounds, often moredifficult to detect using PyGC–MS, can be detected by PyGC–AED. Thus, majornitrogen bound molecules such as alkyl–pyrroles and alkyl–pyridines were iden-tified (Fig. 5d). The oxygen compounds evidenced were principally phenol, alkyl–phenols, dihydrobenzofurane, vinyl-methoxy–phenol (Fig. 5c). Unfortunately, notall peaks detected with the AED could be assigned as far as this technique does notallow direct identification. Combination with PyGC–MS in order to identify thesesmaller peaks was unsuccessful as mass spectra were largely covered by other moreabundant compounds.

309P
.F
aureet
al./J.
Anal.
Appl.
Pyrolysis
62(2002)
297–
318
Fig. 5. Examples of pyrograms obtained by pyrolysis at 620 °C on a river sediment using PyGC–AED. The signals shown are recorded on (a) C193 (Carbonat 193 nm), (b) S181 (Sulfur at 181 nm), (c) O171 (Oxygen at 171 nm) and (d) N174 (Nitrogen at 174 nm) channels of the Atomic Emission Detector usingprogram 1 (Table 1). For peak assignments, see Table 3.

310 P. Faure et al. / J. Anal. Appl. Pyrolysis 62 (2002) 297–318
However, combining PyGC–AED with PyGC–MS allowed easy detection andidentification of many N, S and O bearing compounds difficult to trace using solelyPyGC–MS.
3.2. Analysis of sewage sludges
Several samples of sewage sludges collected from industrial and urban wastewater treatment plants as well as from lagoonal purification systems were analyzedby PyGC–AED and PyGC–MS (Fig. 6).
The mass pyrograms and C193 chromatograms obtained from the various samples(Fig. 6), showed slight differences. Mainly the samples of the lagoonal purificationtreatment sludge showed fairly different characteristics (Fig. 6). The use of PyGC–MS led to a similar conclusion. However, when the chromatograms obtained on thenitrogen (N174) channel were considered, all three sample types showed significantdifferences. The samples from the urban sludges showed a fairly complex chro-matogram with well defined peaks. Industrial as well as lagoonal sludges presentednitrogen bearing polar compounds occurring as irregular peaks in the pyrograms.Moreover, these two last sample types were characterized by an UnresolvedCompounds Mixture (UCM) especially intense for the lagoonal sludge. PyGC–MSof the same samples allowed to identify the most abundant peaks as alkyl– indoles,alkyl–pyrroles and alkyl–pyridines. These compounds resulted from the pyrolysisof proteins, polypeptides and amino-acids [9,30,31].
Table 3Identification of the different peak on pyrograms of Fig. 5b, c and d
CompoundsN°
Molecular sulfurMSDimethyl-disulfideS1
S2 Methyl-thiopheneBenzothiazoleS3
S4 Methylthio-benzothiazoleMethyl-furanecarboxaldehydeO1
O2 PhenolO3 Methyl-phenol
DihydrobenzofuraneO4
Vinyl-methoxy-phenolO5
O6 EugenolO7 AcetoguaiaconeN1 Methyl-pyrrole
PyridineN2
N3 Methyl-pyridineN4 Acetylpyrrole

311P. Faure et al. / J. Anal. Appl. Pyrolysis 62 (2002) 297–318
Fig. 6. Comparison of the pyrograms (620 °C) obtained on three different sewage sludge samples(Lagoonal, Urban and Industrial suldges) using PyGC–MS and PyGC–AED tuned for the detection ofC (193 nm), N (174 nm), S (181 nm), O (171 nm) with program 1 (Table 1).
The pyrograms obtained on the oxygen channel (O171) showed additionaldifferences between the samples. The urban and industrial samples werecharacterized by a similar variety of oxygenated compounds in the 7–25 min range.However, at higher retention times, the industrial sludges present additionalcompounds which were absent in the other types of sewage sludges. Samples from

312 P. Faure et al. / J. Anal. Appl. Pyrolysis 62 (2002) 297–318
the lagoonal purification systems showed an overall different distribution, with alower diversity of oxygenated compounds. Only some of the oxygenated com-pounds detected by PyGC–AED could be identified using PyGC–MS. Theywere mainly alkyl–phenols, methoxy-phenols and fatty acids, but could not beclearly attributed to peaks occuring in the PyGC–AED chromatograms.
The distribution of the sulfur compounds (S181 channel) was different for allthree types of samples. The industrial sludges were characterized by a sulfurUCM. The high selectivity of the AED allowed the detection of sulfur com-pounds which could not be identified by PyGC–MS as their abundance was toolow.
The distinction of different origins for the sewage sludges could be pointed outby using PyGC–AED, whereas distinctions remained difficult using only PyGC–MS. The industrial sludges provided signals with a large variety of heteroatomiccompounds (sulfur, nitrogen and oxygen containing molecules) clearly differentfrom the other sample groups. The differentiation between lagoonal and urbansewage sludge was marked on the nitrogen and sulfur channels especially.
3.3. Organic pollutants adsorbed and bound on the sediment matrix of sewagesludges
Metallic trace elements are among the most considered pollutants in sediments.However, it is also important to take into account toxic organic micropollutantslike those present in small quantities in manufactured goods (e.g. polycyclicchlorinated hydrocarbons) and more or less toxic compounds commonly releasedin the environment (e.g. pesticides, detergents, solvents, gasolines). Chlorine is anelement present in many of these compounds. The major classes of chlorinatedorganic compounds, such as PCBs and PCDDs, are under strict internationalregulations and are systematically controlled in sewage sludge.
The efficiency of PyGC–AED in the detection of halogenated compounds innatural organics or in manufactured materials has already been demonstrated[33]. It was therefore expected that the PyGC–AED technique described herewas able to differentiate labile and linked chlorinated molecules in sewagesludges.
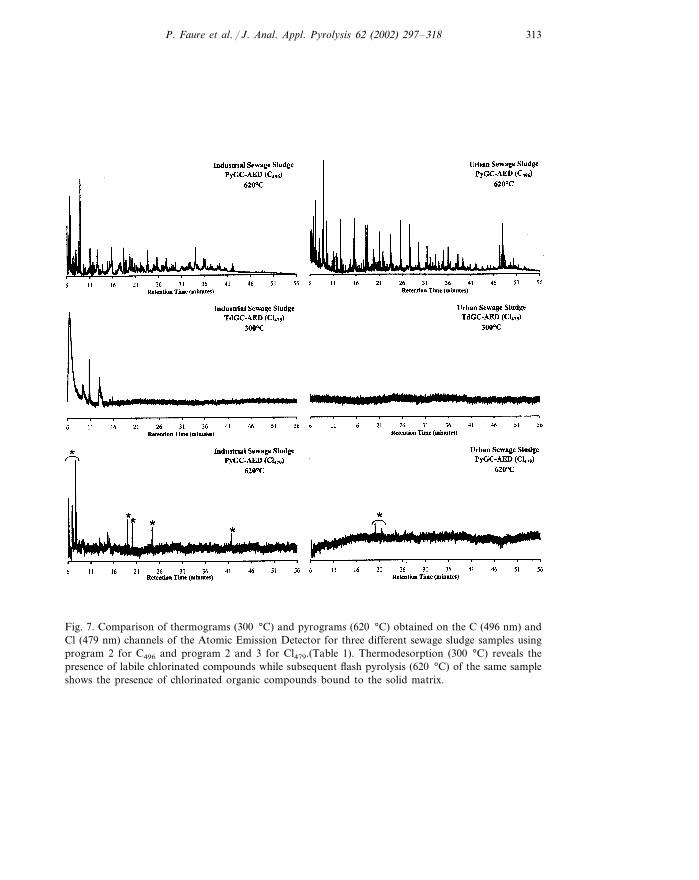
The AED was tuned for Chlorine (Cl479), Bromine (Br) and in order to limitthe number of analyses, the Carbon wavelength selected in this case was 479 nminstead of 193 nm (Table 1). Three different programs of thermodesorption andpyrolysis were applied (Table 2). The program 1 was used for qualitative analy-sis, while programs 2 and 3 were used for quantitation. The selective pyrogramsand thermograms obtained on different sewage sludge types for C496 and Cl479
are presented in Fig. 7.During the first phase corresponding to the drying step (thermodesorption at
150 °C), no chlorine bearing compounds were noticed for the three sample typesinvestigated (industrial, urban and lagoonal sewage sludges).
313P. Faure et al. / J. Anal. Appl. Pyrolysis 62 (2002) 297–318
Fig. 7. Comparison of thermograms (300 °C) and pyrograms (620 °C) obtained on the C (496 nm) andCl (479 nm) channels of the Atomic Emission Detector for three different sewage sludge samples usingprogram 2 for C496 and program 2 and 3 for Cl479.(Table 1). Thermodesorption (300 °C) reveals thepresence of labile chlorinated compounds while subsequent flash pyrolysis (620 °C) of the same sampleshows the presence of chlorinated organic compounds bound to the solid matrix.

314 P. Faure et al. / J. Anal. Appl. Pyrolysis 62 (2002) 297–318
Fig. 7. (Continued)
No significant peaks of chlorinated molecules were detected for the samplescollected from the lagoonal purification systems during either thermodesorption at300 °C or flash pyrolysis at 620 °C. For the samples of the urban sites, traces ofresolved organic compounds were detected only after flash pyrolysis at 620 °C. Theconfirmation of the presence of chlorinated compounds was confirmed by thespectral fingerprint of chlorine: the typical emission ray triplet at 479.5, 481 and481.9 nm was present (Fig. 8a). In the case of industrial sludge samples, a peak ofchlorinated gas (probably HCl) and several resolved chlorinated compounds (elut-ing before 6 min) were evidenced during thermodesorption at 300 °C. During flashpyrolysis at 620 °C, resolved chlorinated compounds were much more abundantthan for the urban sewage sludges.

315P. Faure et al. / J. Anal. Appl. Pyrolysis 62 (2002) 297–318
Fig. 8. (a) Spectral fingerprint of chlorine detected by the UV spectrometer of the Atomic EmissionDetector and (b) non resolved chlorinated compounds corresponding to an artifact of analysis.
In addition to the detection of resolved organic chlorinated compounds forcertain sample types, a UCM was sometimes recorded on the chlorine channel (Fig.8b). After cleaning of the injector and the pyrolysis oven, this hump was notobserved anymore. This phenomenon could be explained by the retention of polarcompounds onto the walls of the injector liner. These compounds probably reactedwith the HCl formed during the destruction of the more thermally fragile chlori-nated compounds. The volatilization of these newly formed products duringchromatography led to the formation of the UCM. Flodin et al. [33] noticed similarphenomena and observed that the addition of a methylating agent (such as TMAH)to the sample led to the elimination of the UCM.

316 P. Faure et al. / J. Anal. Appl. Pyrolysis 62 (2002) 297–318
The amount of chlorine liberated by each sample was quantified using thecompound independent calibration method. All the peaks in the chromatogramrecorded on the chlorine channel were integrated. The data were multiplied by acalibration factor taking into account the split. The final chlorine mass wasnormalized to the amount of sample loaded into the pyrolyzer. The global Cl/Cratio was determined with a precision of �15% using the pyrolysis program 2 andboth the C496 and Cl479 channels. Results are presented in Table 4.
Comparison with the work of Flodin et al. [34] led to the following interpretationof our data:
at 150 °C, no chlorinated compounds were detected indicating that adsorbedchlorinated compounds are absent;at 300 °C, most of the chlorine, including the chlorinated gas was released. Thislatter (certainly HCl) was generated by thermal degradation of thermally fragilechlorinated organic compounds;at 620 °C, higher molecular weight compounds appeared as resolved peaks insome pyrograms, indicating the presence of organic chlorinated compoundstightly bound to the solid matrix. Unfortunately, cross analysis using PyGC–MSdid not allow to identify the type of chlorinated molecules.
4. Conclusion
PyGC–AED is a fast and convenient tool for the characterization of sedimentaryorganic matter containing heteroatomic moieties. The optimization of the analyticalconditions for nitrogen and oxygen is necessary because the AED response for theseelements is sensitive to many factors including purity of the reactant gases, tightnessof the system, baseline fluctuation. Once the PyGC–AED is adequately tuned, theorganic content of sediments or sewage sludges is discriminated based on the
Table 4Weight of released chlorine/weight of pyrolysed sample and C/Cl ratios for the three sludge typesduring dry step (150 °C), thermodesorption (300 °C) and pyrolysis (620 °C).
Weight of released chlorine/weight of sample (mg/g)
Temperature of the pyrolyzer Industrial sewage Urban sewage Lagoonal sewage(°C) sludge sludge sludge
0 / /1500.7 / /300
/Traces620 0.75Cl/C ratio (% weight)
//620 0.35�0.05

317P. Faure et al. / J. Anal. Appl. Pyrolysis 62 (2002) 297–318
different elemental pyrograms (Carbon, Nitrogen, Sulfur, Oxygen) not easily avail-able using PyGC–MS. Additional data brought by PyGC–MS allows to identifythe major heteroatomic compounds. Unfortunately, this is not always possible asroutine mass spectrometers are often not sensitive enough (i.e. detection of chlori-nated compounds in our samples).
The combined use of stepwise thermodesorption and pyrolysis allows a betterunderstanding of how chlorine is linked to the organic matrix. Especially thepresence of chlorinated organic compounds tightly bound to the organic matrix isevidenced in some of the sewage sludges analyzed. However, it is still necessary toidentify the type of molecules bearing this chlorine.
The PyGC–AED technique is also very promising for calculating atomic ratio inthe thermodesorbed and pyrolyzed fractions, respectively. Two types of informationcan be retrieved: (i) qualitative, showing the distribution of organic compoundsbearing several types of heteroatoms; and (ii) quantitative, allowing atomic ratioindices to be calculated related to the organics present in the sample without anyadditional treatment (e.g. to removal of mineral matrix by acid digestion).
Such data can be useful in the fast screening and discrimination of sample groupsin environmental studies. In addition, this can be done without systematic identifi-cation of compounds, a long and tedious approach when solely PyGC–MS is used.Samples can be classified on the basis of simple geochemical indices (Cl/C atomicratio, but also N/C at., O/C at., S/C at.) of the thermodesorption and pyrolysisproducts. Moreover, complementary statistical treatment based on arrays of chro-matograms recorded on several elements can improve the sample discriminationpower of the PyGC–AED.
References
[1] S.R. Larter, A.G. Douglas, J. Anal. Appl. Pyrol. 4 (1982) 1.[2] R.P. Philp, T.D. Gilbert, J. Anal. Appl. Pyrol. 11 (1987) 93.[3] L. Bonfanti, L. Comellas, J.L. Lliberia, R. Vallhonrat-Matalonga, M. Pich-Santacana, D. Lopez-
Pinol, J. Anal. Appl. Pyrol. 44 (1997) 101.[4] D. Van De Meent, S.C. Brown, R.P. Philp, B.R.T. Simoneit, Geochim. Cosmochim. Acta 44 (1980)
999.[5] C.S. Giam, T.E. Goodwin, P.Y. Giam, K.F. Rion, S.G. Smith, Anal. Chem. 49 (1977) 1540.[6] R.P. Philp, T.D. Gilbert, Geochim. Cosmochim. Acta 49 (1985) 1421.[7] P.G. Hatcher, H.E. Lerch, R.K. Kotra, T.V. Verheyen, Fuel 67 (1987) 1069.[8] P.F. Van Bergen, M.E. Collinson, J.S. Sinninghe Damste, J.W. De Leeuw, Geochim. Cos-
mochim.Acta 58 (1994) 231.[9] C. Saiz-Jimenez, J.W. De Leeuw, J. Anal. Appl. Pyrol. 9 (1986) 99.
[10] M.-A. Sicre, S. Pleuve, A. Saliot, J.W. DeLeeuw, M. Baas, Org. Geochem. 21 (1994) 11.[11] C. Saiz-Jimenez, 15th world congress of soil science. Acapulco Mexico (1994), Vol 3a. Commission
II Symposia.[12] R. Sihombing, P.F. Greenwood, M.A. Wilson, J.V. Hanna, Org. Geochem. 24 (1996) 859.[13] P.K. Mukhopadhyay, M.A. Kruge, C.F.M. Lewis, Environmental Geosciences 4 (1997) 137.[14] M.A. Kruge, Northeastern Geology and Environmental Sciences 21 (1999) 121.[15] P. Faure, P. Landais, M. Elie, M. Kruge, E. Langlois and O. Ruau In: Berthelin et al. (Eds.), Effect
of Mineral-Organic-Microorganism Interactions on Soil and Freshwater Environments, NewYork:Kluwer Academic/Plenum Publishers, 1999.
318 P. Faure et al. / J. Anal. Appl. Pyrolysis 62 (2002) 297–318
[16] P. Faure and P. Landais J. Anal. Appl. Pyro., 2000, in press.[17] P. Selsbo, P. Almen, I. Ericsson, Energy and Fuels 10 (1996) 751.[18] J.S. Sinninghe Damste, A.C. Kock-Van Dalen, J.W. De Leeuw, P.A. Schenck, J. Chromatogr. 435
(1988) 435.[19] M.E. Barrio, J.L.L. Lliberia, L. Comellas, F. Broto-Puig, J. Chromat. A. 719 (1996) 131.[20] H.R. Schulten, C Sorge, M. Schnitzer, Biol. Fertil. Soils 20 (1995) 174.[21] P.K.K. Louie, R.C. Timpe, S.B. Hawthorne, D.J. Miller, Fuel 72 (1993) 225.[22] S.G. Mossner, S.A. Wise, Anal. Chem. 71 (1999) 58.[23] R.L. Patience, M. Baxby, K.D. Bartle, D.L. Perry, A.G.W. Rees and S.J., Org. Geochem., 18
(1992) 161.[24] J.S. Sinninghe Damste, T.J. Eglinton, J.W. De Leeuw, Geochim. Cosmochim. Acta 56 (1992) 1743.[25] S. Rowland, R. Evens, L. Ebdon, A. Reest, Anal. Proc. 30 (1993) 87.[26] J.A. Seeley, Y. Zeng, P.C. Uden, T.I. Eglinton, I. Ericson, J. Anal. Atom. Spectro. 7 (1992) 979.[27] N.A. Stevens, M.F. Borgerding, Anal. Chem. 70 (1998) 4223.[28] B.D. Quimby, J.J. Sullivan, Anal. Chem. 62 (1990) 1027.[29] N.-P.V. Nielsen, J.M. Carstensen, J. Smedsgaard, J. Chrom. A. 805 (1998) 17.[30] R. Ishiwatari, S. Yamamoto, N. Handa, J. Anal. Appl. Pyrol. 32 (1995) 75.[31] S. Pleuve, J.W. De Leeuw, M.-A. Sicre, M. Baas, A. Saliot, Geochim. Cosmochim. Acta 60 (1996)
1239.[33] C. Flodin, M. Ekelund, H. Boren, A. Grimwall, Chemosphere 34 (1997) 2319.[34] R. Leschber, In: Effects of organic contaminants in sewage sludge on soil fertility, plants and
animals (1992). (Ed. by S.D. Hall J.E., L’Hermitte P.L., editors), pp. 45–53.
.