application report example - wa
TRANSCRIPT

Supporting Document for Change to [Water Right Number] Prepared for [Applicant Name]
Prepared by [Name] [Date]
ECY 040-1-97B
APPLICATION REPORT EXAMPLE A complete, well-organized application report facilitates review of your application. This template provides example responses to questions found in Sections 6-12 of a Water Right Change Application. Sample responses for multiple project types and scenarios are included.
• If an application question is not relevant to your proposal, in your own report simply indicate that it is not applicable.
• For all applications, be sure to indicate which application subject or question is being addressed, e.g., “8.1 Describe Historic Beneficial Use.”
• Use tables and lists to display quantitative data. • Please include a Table of Contents and use appendices to organize maps
and related exhibits (e.g., well logs, technical memorandum, property ownership documents).

[Applicant Name] Supporting Document for Change to [Water Right
Number] [Month Year]
ECY 040-1-97B August 2020
Professional Endorsement Stamps
Insert Stamp
Signed: mm/dd/yyyy
Insert Stamp
Signed: mm/dd/yyyy
Insert Stamp
Signed: mm/dd/yyyy

[Applicant Name] Supporting Document for Change to [Water Right
Number] Table of Contents
i ECY 040-1-97B August 2020
Section 6 – Project Description ................................................................................................... 1
General Information ................................................................................................................ 1
6.1 – Proposed Change Narrative ........................................................................................... 1
6.2 – Compliance/Enforcement Actions ................................................................................. 1
6.3 – Prior Changes to Water Right ........................................................................................ 1
6.4 – Reservoir Information .................................................................................................... 1
6.5 – Compliance with the State Environmental Policy Act (SEPA) ..................................... 1
6.6 – Period of Use Change Proposal ..................................................................................... 2
6.7 – Temporary Change Proposal .......................................................................................... 2
6.8 – Municipal Change Proposal ........................................................................................... 2
System Design and Information.............................................................................................. 2
6.9 – Existing Water System Description ............................................................................... 2
6.10 – Proposed Water System Description ........................................................................... 2
6.11 – Effect on Return Flow .................................................................................................. 2
6.12 – Effect on System Efficiency ........................................................................................ 4
6.13 – How will Qi and Qa not be Exceeded? ........................................................................ 4
6.14 – Compliance with Fish Screening Requirements .......................................................... 5
Development Schedule ........................................................................................................... 5
6.15 – Proposed Development Schedule ................................................................................ 5
6.16 – Current Status of Active Development Schedules ....................................................... 5
6.17 – Timing to Obtain Other Necessary Permits ................................................................. 5
Section 7 – Related Water Rights ............................................................................................... 6
General Information ................................................................................................................ 6
7.1 – Other Associated Water Rights ...................................................................................... 6
7.2 – Use of Associated Water Rights .................................................................................... 6
7.3 – Wells Added through Showing of Compliance with RCW 90.44.100(3) Form Submittal ................................................................................................................................. 7
Section 8 – Historic Use ............................................................................................................. 7
General Information ................................................................................................................ 7
8.1 – Describe Historic Beneficial Use ................................................................................... 7
8.2 – Instantaneous Rate by Source ........................................................................................ 7

[Applicant Name] Supporting Document for Change to [Water Right
Number] Table of Contents
ii ECY 040-1-97B August 2020
8.3 – Pre-Code Water Use Under Water Right Claim ............................................................ 8
8.4 – Streamflow Records ....................................................................................................... 8
8.5 – Groundwater Level Data ................................................................................................ 8
8.6 – Provision Compliance .................................................................................................... 9
8.7 – Water Flow Meter Use Calculations .............................................................................. 9
8.8 – Power to Water Use Calculations ................................................................................ 10
8.9 – Alternate Water Use Calculations ................................................................................ 11
8.10 – Aerial Photo Analysis ................................................................................................ 13
Water Used for Irrigation ...................................................................................................... 14
8.11 – Family Farm Water Act Compliance ......................................................................... 14
8.12 – Irrigation Scheduling Practices .................................................................................. 14
8.13 – Annual Consumptive Quantity Calculations ............................................................. 14
8.14 – Use of Contract Water within Place of Use ............................................................... 15
Section 9 – Hydrogeological Setting ........................................................................................ 16
9.1 – Points of Withdrawal ................................................................................................... 16
9.2 – Describe the hydrogeology .......................................................................................... 17
9.3 – Aquifer Characteristics (Second Example) .................................................................. 24
Section 10 – Environmental Assessment .................................................................................. 25
General Information .............................................................................................................. 25
10.1 – Aquatic Use of Surface Water Bodies ....................................................................... 25
10.2 – Fish and Salmonid Presence ...................................................................................... 25
Section 11 – Maps ..................................................................................................................... 26
General Information .............................................................................................................. 26
11.1 – Water Right Maps ...................................................................................................... 26
Section 12 – Signatures ............................................................................................................. 27
General Information .............................................................................................................. 27
12 – Ownership Information ................................................................................................. 27
Attachment A – Mitigation Plan ............................................................................................... 28
General Information .............................................................................................................. 28
A.1 – Will the Change Cause Impairment? .......................................................................... 28
A.2 – Water Rights that would be Impaired ......................................................................... 28
A.3 – Quantification of Impairment ...................................................................................... 28

[Applicant Name] Supporting Document for Change to [Water Right
Number] Table of Contents
iii ECY 040-1-97B August 2020
A.4 – Source of Supply for Proposed Mitigation Water ....................................................... 29
A.5 – How will Source of Supply Offset the Impacts of the Proposed Change? ................. 29
A.6 – Security and Longevity of Mitigation ......................................................................... 29
A.7 – Water Rights to be Placed into Trust .......................................................................... 29
A.8 – Benefits and Costs of Water Impoundments or Other Resource Management Techniques ............................................................................................................................ 30
A.9 and 10 – Quantify Offset Provided by Water Impoundment or Other Resource Management Techniques ...................................................................................................... 30
A.11 – Quantify Consumptive Use of Water Right .............................................................. 30
Attachment B – Consolidation of Exempt Wells ...................................................................... 31
General Information .............................................................................................................. 31
B.1 – Same Body of Public Groundwater ............................................................................. 31
B.2 – Suitable Arrangements to Discontinue Use of the Permit-Exempt Well .................... 31
B.3 – Legally Enforceable Agreement to Prevent Use of Permit-Exempt Well on Property 31
B.4 – Permit-Exempt Well Will Be Properly Decommissioned........................................... 31
B.5 – Impacts to Other Water Rights Due to the Consolidation ........................................... 32
B.6 – Use of Water From Permit-Exempt Well .................................................................... 32
B.7 – Is the Consolidation Consistent with Local Plans ....................................................... 32
Attachment C – Quincy Basin Change Authorizations ............................................................ 33
General Information .............................................................................................................. 33
C.1 – Describe the Change Requested .................................................................................. 33
C.2 – If Previously Changed, Have the Prior Changes Been Made? .................................... 33
Attachment D – Drought Change Authorizations ..................................................................... 34
General Information .............................................................................................................. 34
D.1 – Describe Specific Circumstances Pertaining to Water Shortage ................................ 34
D.2 – Describe How Proposed Change Will Address Water Shortage ................................ 34
D.3 – Any Previous Drought-Specific Authorizations for the Subject Parcels? .................. 34
D.4 – Irrigation only – What Types of Crop(s) Are Bring Grown and How Will the Water Shortage Impact Them .......................................................................................................... 34
[Applicant Name] Supporting Document for Change to [Water Right
Number] Table of Contents
iv ECY 040-1-97B August 2020
Tables [Sample Text] Table 6.11 – Existing and Proposed Consumptive Use Breakdown Table 6.15 – Proposed Permitting Schedule Table 6.17 – Additional Permitting Schedule
Figures Figure 1 – Map of Existing Water Right Attributes Figure 2 – Map of Current Water Right Attributes Figure 3 – Map of Proposed Water Right Attributes Figure 4 – Map Showing Infrastructure Associated with Existing Water Use Figure 5 – Map Showing Infrastructure Associated with Proposed Water Use Figure 6 – Map Showing Related Water Rights
Appendices Appendix A – Water Right Record Appendix B – State Environmental Policy Act Documents Appendix C – Water System Planning Documents Appendix D – Photos Appendix E – Technical Specifications on Equipment Appendix F – Historic Use Documents Appendix G – Streamflow Records Appendix H – Water Metering Data Appendix I – Power Meter to Water Use Data and Calculations Appendix J – Alternative Water Use Data and Calculations Appendix K – Aerial Photos Supporting Historic Use Appendix L – Water Well Reports and Testing Reports Appendix M – Property Ownership Documents

[Applicant] Supporting Document for Change to [Water Right
Number]
1 ECY 040-1-97B August 2020
Section 6 – Project Description General Information
6.1 – Proposed Change Narrative [Sample Text] The City would like to add an additional point of withdrawal to water right G3-21111C to improve system redundancy in case of a well failure. The proposed point of withdrawal will be located on the west side of the City, while the existing point of withdrawal is on the east side of the City. SCADA software will be programmed to only let one of the two wells operate at a time. The water right file is contained in Appendix A.
6.2 – Compliance/Enforcement Actions [Sample Text] On August 20, 2013, I was visited by Ecology Water Master, [STAFF NAME], who informed me that my irrigation west of Bertrand Creek was occurring outside of my water right place of use. I requested technical assistance from Ecology to better understand the limits of my water right. The changes requested in this application will align my water right with my water use.
6.3 – Prior Changes to Water Right [Sample Text] In December 2018, the Douglas County Water Conservancy Board processed a change application on this water right. The water right change application was assigned processing number DOUG-18-02 by the conservancy board, and is recorded as CG3-12345C in Ecology’s Water Right Tracking System (WRTS) database. The project is proceeding according to the timeline described under the development schedule in the superseding permit. Construction was begun on March 1, 2018 and completed on April 15, 2018.
6.4 – Reservoir Information [Sample Text] N.A.
6.5 – Compliance with the State Environmental Policy Act (SEPA) [Sample Text] The water right being changed authorizes diversion of 0.5 cubic feet per second for municipal supply. WAC 197-11-800(4) identifies this rate of diversion as being categorically exempt and does not require a threshold determination under SEPA.

[Applicant] Supporting Document for Change to [Water Right Number] [Date]
2 ECY 040-1-97B August 2020
6.6 – Period of Use Change Proposal [Sample Text] The water association requests to change the existing seasonal irrigation water right to a year-round municipal water right. The current period of use is April 1st through September 30th, while the proposed period of use will be January 1st through December 31st.
6.7 – Temporary Change Proposal [Sample Text] The requested temporary change is needed only during construction of the facility. Construction is scheduled to occur from January 1, 2020, through December 31, 2022.
6.8 – Municipal Change Proposal [Sample Text] The water right proposed for change is part of the portfolio of water rights held by the City of Kelso, which is a Group A Public Water System. The City’s public water system ID is 38000. The water right being changed qualifies as being for municipal water supply purposes because it is used by a municipal water supplier for residential purposes through 15 or more residential service connections, as defined in RCW 90.03.015(4)(a). A copy of the applicable pages from the City’s 2010 Water System Plan (including the cover page, water rights section, service area maps, and water rights self-assessment), the City’s Water Facilities Inventory form, and the City’s Water Use Efficiency forms are contained in Appendix C.
System Design and Information
6.9 – Existing Water System Description [Sample Text] The City obtains its water from a Ranney Collector, treats the water, and then distributes it to the system. Refer to the water system figures in the water system plan contained in Appendix C for more details.
6.10 – Proposed Water System Description [Sample Text] The existing water system will stay the same (Appendix C), but an additional point of withdrawal will be drilled on the opposite side of the river. This well will be operated to improve pressures within that zone and also will be a source for the south side of the river in the event that the pipeline crossing the river is ever compromised during an event like an earthquake or Jökulhlaup.
6.11 – Effect on Return Flow [Sample Text]

[Applicant] Supporting Document for Change to [Water Right Number] [Date]
3 ECY 040-1-97B August 2020
The water right was originally being used for seasonal agricultural irrigation. This water right has been acquired by the City and is proposed to be used for year-round municipal supply. Historically, the landowner periodically moved handline impact sprinklers to irrigate a pasture. The application efficiency of this irrigation method is estimated to be average at 75 percent (Ecology Water Resources Program Guidance 1210). The percent consumptive use for this irrigation method is 85 percent, meaning that approximately 15 percent of the use was non-consumptive. This non-consumptive use was return flow that recharged the shallow aquifer adjacent to the river from which the water was originally diverted. The proposed use is year-round municipal supply. The City provided data that breaks down the total water produced from its sources (source metering data) as compared to the effluent discharge from its wastewater treatment facility (daily monitoring reports) (Appendix H). Those data show that during the water right period of use, 60 percent of the water produced from the City’s sources is consumed and 40 percent of the water is non-consumptive and is returned to the river through the wastewater treatment facility discharge. Table 6.11 compares the consumptive use and non-consumptive use of the existing and proposed uses.
Table 6.11. Exising and Proposed Consumptive Use Breakdown
Historic Use (afy)
Proposed Use (afy)
Total Use 100 100
Consumptive Use 85 60
Non-consumptive Use 15 40
Under the proposed use there will be less consumptive use and more water returned on an annual basis to the river than with the historic use. Because the use will now occur year-round instead of seasonally, there will be new consumptive use of water during the non-irrigation season, although summer months where outdoor use and irrigation occur will continue to represent the majority of annual use. Applying historic water use patterns for the City, estimated monthly consumption and return flow are allocated as described in Table 6.11b.

[Applicant] Supporting Document for Change to [Water Right Number] [Date]
4 ECY 040-1-97B August 2020
Table 6.11b. Exising and Proposed Consumptive Use Breakdown by Month of Use (all values in afy)
Historic Use
Historic Consumptive
Use Proposed
Use
Proposed Consumptive
Use
Change in Monthly
Consumptive Use
Oct 0 0 5 3 3
Nov 0 0 5 3 3
Dec 0 0 5 3 3
Jan 0 0 5 3 3
Feb 0 0 5 3 3
Mar 0 0 5 3 3
Apr 0 0 5 3 3
May 10 8.5 5 3 -5.5
Jun 20 17 10 6 -11
Jul 25 21.25 20 12 -9.25
Aug 35 29.75 20 12 -17.75
Sep 10 8.5 10 6 -2.5
TOTAL 100 85 100 60
6.12 – Effect on System Efficiency [Sample Text] The additional point of withdrawal will have no effect on the system’s efficiency.
6.13 – How will Qi and Qa not be Exceeded? [Sample Text] The water right instantaneous rate limit is 600 gpm. The existing point of withdrawal was able to produce 600 gpm when it was new. Over time, the static groundwater level in the well has declined, which has led to a reduction of what can be produced from the well and the installed pump, such that it can only produce 300 gpm currently. The proposed new well will have a pump installed for a design pumping rate of 600 gpm. The SCADA system will only allow for one well to be operated at a time. The new well will be used during the summer to meet the higher demand, while the existing well will be used during the winter. The volume will be metered from each well on a weekly basis to verify that the authorized annual volume is not exceeded in a year, and the data will be recorded and made available to Ecology upon request, consistent with the existing metering Provisions on the right.

[Applicant] Supporting Document for Change to [Water Right Number] [Date]
5 ECY 040-1-97B August 2020
6.14 – Compliance with Fish Screening Requirements [Sample Text] The water right holder has worked with WDFW’s fish screening expert, [NAME], to make sure the diversion intake screen meets or exceeds the standards. [NAME] approved the screening design by email on [DATE].
Development Schedule
6.15 – Proposed Development Schedule [Sample Text] Table 6.15 identifies the timeline for carrying out the requested change after approval of the change authorization.
Table 6.15. Proposed Development Schedule
Stage Years after Change Authorization Granted
Start the project 1 year
Construct all infrastructure to allow for full use of the water right 2 years
Fully use the rate and volume of water authorized under the water right 7 years
6.16 – Current Status of Active Development Schedules [Sample Text] In December 2018, the Douglas County Water Conservancy Board processed a change application on this water right. The water right change application was assigned processing number DOUG-18-02 by the conservancy board, and is recorded as CG3-12345C in Ecology’s Water Right Tracking System (WRTS) database. Ecology modified, but approved, the decision. In the approval order, Ecology modified the development schedule to require completion of construction by December 31, 2019, and full beneficial use by December 31, 2024. The water right holder filed a Complete Construction Notice with Ecology in October 2019 after the well was drilled and equipped with a pump, and the flow meter was installed. Ecology accepted the filing. The existing change authorization is currently active and in good standing. The applicant will need to submit the Proof of Appropriation of Water by [DATE], unless the development schedule is modified through this change application.
6.17 – Timing to Obtain Other Necessary Permits [Sample Text] Table 6.17 identifies the timeline for obtaining other permits after approval of the change authorization.

[Applicant] Supporting Document for Change to [Water Right Number] [Date]
6 ECY 040-1-97B August 2020
Table 6.17. Additional Permitting Schedule Permit Years after Change Authorization Granted
Hydraulic Project Approval 3 months
Building Permit 3 months (concurrent)
Section 7 – Related Water Rights General Information
7.1 – Other Associated Water Rights [Sample Text] Table 7.1 lists all irrigation water rights associated with Green Fern Farm within the place of use of the water right being changed.
Table 7.1. Associated Water Right Information
Water Right Sources
Instantaneous Rate (gpm)
Additive
Instantaneous Rate (gpm)
Non-Additive
Annual Volume (ac-ft/yr)
Additive
Annual Volume (ac-ft/yr)
Non-Additive
Irrigated Acres
Additive
Irrigated Acres
Non-Additive
G2-23564C
Well Nos. 1 and 4
250 0 50 0 25 0
G2-24589C
Well Nos. 2 and 3
250 0 0 50 0 25
Combined Total 500 - 50 - 25 -
The place of use of G2-23564C and G2-24589C are the same. G2-235654C was the original water right obtained for irrigation of the farm. G2-24589C was granted later and allows for withdrawal of an additional 250 gpm from Well Nos. 2 and 3 for irrigation of the same 25 acres authorized under G2-23564C. The maximum annual volume currently authorized to be withdrawn from Well Nos. 1, 2, 3, and 4 is 50 ac-ft/yr. The associated water rights, and water right being changed, are shown visually on Figure 6.
7.2 – Use of Associated Water Rights [Sample Text] Green Fern Farm has used all four existing wells (Well Nos. 1, 2, 3, and 4), which are connected to a common mainline, for irrigation of 25 acres within the place of use of each water right. The instantaneous pumping rate of each well is shown in more detail in Section 8.2. The annual volume withdrawn from each well and water right is shown in more detail in Section 8.7.

[Applicant] Supporting Document for Change to [Water Right Number] [Date]
7 ECY 040-1-97B August 2020
7.3 – Wells Added through Showing of Compliance with RCW 90.44.100(3) Form Submittal [Sample Text] The water right holder submitted a Showing of Compliance with RCW 90.44.100(3) form, dated [DATE], to Ecology to have Well No. 4 recognized as an additional point of withdrawal under G2-23564C.
Section 8 – Historic Use General Information
8.1 – Describe Historic Beneficial Use [Sample Text] The City provides water to its customers from two wells on a year-round basis. Water use by the City under this water right started with the construction of the first well in 1957. The second well was constructed in 1960. As the City has grown, water use has increased over time. The City installed water flow meters on its wells in 1990, and has read the meters weekly ever since. The combined pumping rate from the wells is equal to the water right limit of 650 gallons per minute (refer to Section 8.2). The authorized water right annual volume is 250 ac-ft/yr. The City’s source metering data, as obtained from its most recent Water System Plan (2018), shows that the water use is increasing slightly over time, but is currently at 150 ac-ft/yr (Section 8.7).
8.2 – Instantaneous Rate by Source [Sample Text] The maximum instantaneous flow rate, as measured and calculated at the points of withdrawal, is contained in Table 8.2.
Table 8.2. Maximum Pumping Rate per Source
Water Source
Maximum Pumping
Rate (gpm)
Pump Type Pump Motor (HP)
Pump Make and
Model Notes
Well No. 1 500 Submersible 100 Berkeley 7T-450
Flow Meter – Instantaneous rate
needle
Well No. 2 150 Submersible 20 Berkeley 6T-200
Pump Curve – Total Dynamic Head is
390 feet
650 Installed Capacity
650 Water Right Limit
0 Water Right Limit minus Installed Capacity

[Applicant] Supporting Document for Change to [Water Right Number] [Date]
8 ECY 040-1-97B August 2020
Both wells can and are operated at the same time on occasion. The full water right instantaneous rate is used from the authorized points of withdrawal. A photo of the Well No. 1 flow meter with the instantaneous needle showing 500 gpm is contained in Appendix D. Pump curves for both Well Nos. 1 and 2 are contained in Appendix E.
8.3 – Pre-Code Water Use Under Water Right Claim [Sample Text] The City of Snohomish has a water right claim for diversion from the Pilchuck River. The claim, S1-043282CL, identifies the date of first use as being 1890. A book published by the Snohomish Historical Society in 1981, titled River Reflections, Volume II, contains information taken from newspaper clippings. The book has an entire section dedicated to the history of the City’s water supply. The earliest newspaper article cited was from July 12, 1910, indicating that the City was going to take steps to secure a pure water source. In a January 27, 1911 article, the City is said to have decided upon the point of diversion from the Pilchuck River some 15 miles upstream of the City. A January 2, 1912, article indicates that the new gravity diversion from the Pilchuck River was opened and water flowed into the City from the new location for the first time. Pages from the reference document are contained in Appendix F. The historic accounts show that the actual use of water started prior to the enactment of the surface water code in 1917.
8.4 – Streamflow Records [Sample Text] While SWC 8534(A) is subject to a minimum bypass flow of 6 cfs, Crab Creek has not dropped to this level since before the Columbia Basin Project started to route return flows down the channel. Streamflow records for the stream gage at Crab Creek near Beverly, Washington (United States Geological Survey Gage 12472600) was queried for the minimum daily mean flows over the period of record (October 1, 1958 to May 24, 2018), and the minimum daily mean flow recorded over that entire period was 14.5 cfs (Appendix G). Therefore, as long as the United States Bureau of Reclamation does not change its practices and start to recapture water for reuse, instead of allowing it to flow down lower Crab Creek, this water right should not be restricted by the minimum instream flow provision that is attached to it.
8.5 – Groundwater Level Data [Sample Text] Groundwater levels in the shallow aquifer fluctuate throughout the year based on changes in recharge and demand. This seasonal fluctuation is on the order of 5 feet over the course of the year (Table 8.5). Each winter, the shallow aquifer refills, and there is no decline in groundwater levels observed from year to year. Since the water right holder’s well fully penetrates the aquifer (screened interval is from a depth of 50 to 60 feet below the top of the casing), and due to the productivity of the aquifer, the water right holder has never had any trouble pumping the full instantaneous rate and annual volume from its well.

[Applicant] Supporting Document for Change to [Water Right Number] [Date]
9 ECY 040-1-97B August 2020
Table 8.5. Water Level Data
Date Depth to Water from Top of Casing (feet)
9/18/2018 25.4
4/15/2018 20.0
9/1/2017 24.6
4/5/2017 20.1
9/6/2016 26.0
4/5/2016 21.2 Top of Casing is 2.4 feet above ground surface.
8.6 – Provision Compliance [Sample Text] Provisions contained on the groundwater certificate include the following:
• Access port in well. • Metering. • Chloride and conductivity monitoring.
The water right holder has complied with these provisions as described as follows. The well has a 1-inch inner-diameter access port with drop tube used for monthly water level measurement. A water flow meter has been installed near the wellhead. The flow meter is read on a monthly basis and submitted to Ecology each year, consistent with the metering provisions on the water right. Meter and metering data is contained in Section 8.7. Chloride concentrations have been measured sporadically over the years. Measurements were not made on a regular basis because the concentration has been constant. Data on the chloride concentration is contained in Section 9.3.
8.7 – Water Flow Meter Use Calculations [Sample Text] Water flow meters have been installed on each source utilized under this water right. The water flow meters associated with each well are described in Table 8.7.1.

[Applicant] Supporting Document for Change to [Water Right Number] [Date]
10 ECY 040-1-97B August 2020
Table 8.7.1. Water Meter Information Water Source
Meter Make
Meter Model
Meter Type
Meter Serial Number
Rate Units
Volume Units
Well No. 1 McCrometer MF106 Propeller 13-06291-06 GPM Gallons x 100
Well No. 4 McCrometer MF106 Propeller 13-06818-06 GPM Gallons x 100
Raw water metering data for each source is contained in Appendix H. A summary of the water metering data is contained in Table 8.7.2.
Table 8.7.2. Water Meter Data Summary
Year Well No. 1 (acre-feet)
Well No. 4 (acre-feet)
Total (acre-feet) Notes
2019 24.2 20.7 44.9
2018 26.5 17.9 44.4
2017 22.0 20.4 42.4
2016 21.6 18.6 40.2
2015 27.1 20.9 48.0
2014 12.5 9.5 22.0 Half of field fallowed
2013 19.8 22.3 42.1
The highest water use since the water flow meters were installed on the source was 48.0 acre-feeet in 2015.
8.8 – Power to Water Use Calculations [Sample Text] No water flow meters are currently installed on the sources utilized under this water right, but there are dedicated power meters for each pump motor, power to water calculations were made based on the equation provided in WAC 173-173-160 to estimate the volume of water pumped on an annual basis. The power meters and other variables used in the calculations are described in Table 8.8.1.

[Applicant] Supporting Document for Change to [Water Right Number] [Date]
11 ECY 040-1-97B August 2020
Table 8.8.1. Power Meter Information
Water Source Power Company Meter Serial
Number
Pump Efficiency (decimal)
Motor Efficiency (decimal)
Total Dynamic
Head (feet)
Well No. 1 Puget Sound Energy A014525418 0.67 0.82 240
Well No. 4 Puget Sound Energy Z005167577 0.70 0.80 240
Pump Efficiency from pump curve based on design pumping rate (Appendix C). Motor Efficiency from manufacturer technical specifications sheet (Appendix C). Total Dynamic Head taken from pump curve based on designed pumping rate (Appendix C).
Raw power meter data for each source and the applicable calculations are contained in Appendix I. A summary of the power meter to water use calculations is contained in Table 8.8.2.
Table 8.8.2. Water Meter Data Summary
Year Well No. 1 (acre-feet)
Well No. 4 (acre-feet)
Total (acre-feet) Notes
2019 24.2 20.7 44.9
2018 26.5 17.9 44.4
2017 22.0 20.4 42.4
2016 21.6 18.6 40.2
2015 27.1 20.9 48.0
2014 12.5 9.5 22.0 Half of field fallowed
2013 19.8 22.3 42.1
The highest water use based on the available power meter data, estimates of pump efficiency, motor efficiency, and total dynamic head, was in 2015.
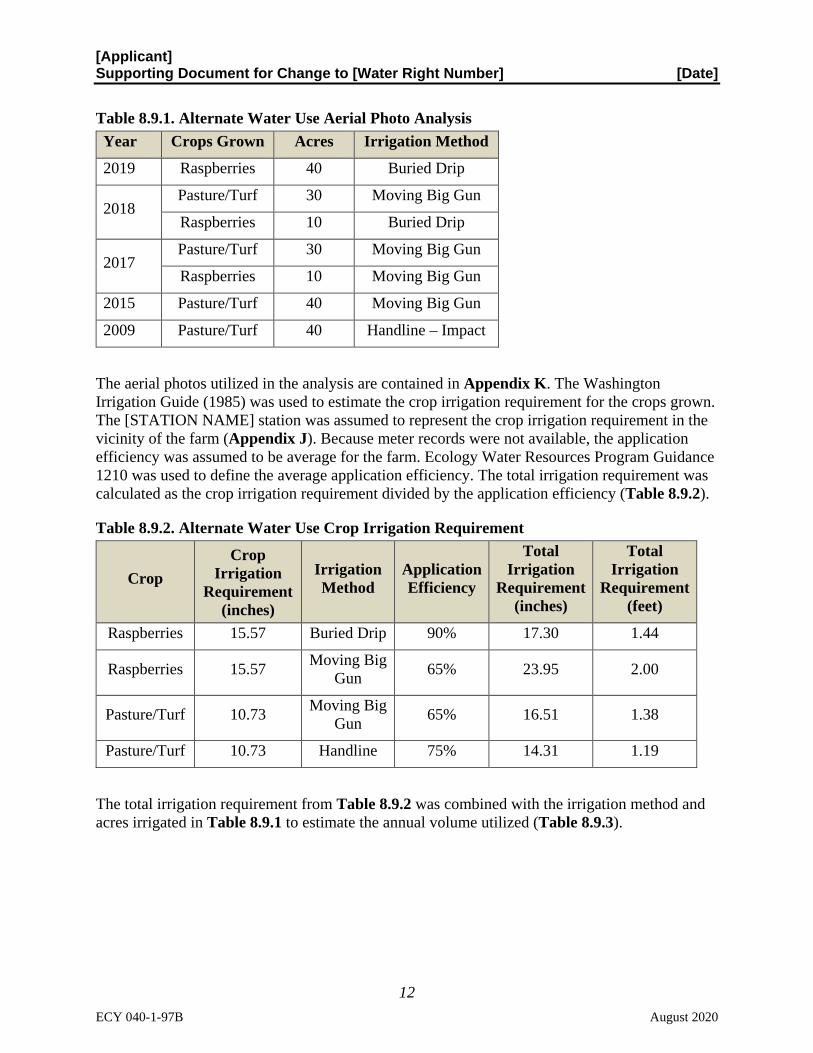
8.9 – Alternate Water Use Calculations [Sample Text] Since no water flow meters or dedicated power meters are available for measuring water use at each source, an alternate water use calculation was made. The alternate water use calculations for this irrigation water right are based on the number of acres irrigated, the crops grown, and the irrigation method utilized. Publicly available aerial photos were obtained for the years of 2009, 2015, and 2017-19 for this analysis. Table 8.9.1 identifies the acreage for each crop grown and the irrigation method utilized for irrigation of those crops.
[Applicant] Supporting Document for Change to [Water Right Number] [Date]
12 ECY 040-1-97B August 2020
Table 8.9.1. Alternate Water Use Aerial Photo Analysis Year Crops Grown Acres Irrigation Method
2019 Raspberries 40 Buried Drip
2018 Pasture/Turf 30 Moving Big Gun
Raspberries 10 Buried Drip
2017 Pasture/Turf 30 Moving Big Gun
Raspberries 10 Moving Big Gun
2015 Pasture/Turf 40 Moving Big Gun
2009 Pasture/Turf 40 Handline – Impact
The aerial photos utilized in the analysis are contained in Appendix K. The Washington Irrigation Guide (1985) was used to estimate the crop irrigation requirement for the crops grown. The [STATION NAME] station was assumed to represent the crop irrigation requirement in the vicinity of the farm (Appendix J). Because meter records were not available, the application efficiency was assumed to be average for the farm. Ecology Water Resources Program Guidance 1210 was used to define the average application efficiency. The total irrigation requirement was calculated as the crop irrigation requirement divided by the application efficiency (Table 8.9.2).
Table 8.9.2. Alternate Water Use Crop Irrigation Requirement
Crop Crop
Irrigation Requirement
(inches)
Irrigation Method
Application Efficiency
Total Irrigation
Requirement (inches)
Total Irrigation
Requirement (feet)
Raspberries 15.57 Buried Drip 90% 17.30 1.44
Raspberries 15.57 Moving Big Gun 65% 23.95 2.00
Pasture/Turf 10.73 Moving Big Gun 65% 16.51 1.38
Pasture/Turf 10.73 Handline 75% 14.31 1.19
The total irrigation requirement from Table 8.9.2 was combined with the irrigation method and acres irrigated in Table 8.9.1 to estimate the annual volume utilized (Table 8.9.3).
[Applicant] Supporting Document for Change to [Water Right Number] [Date]
13 ECY 040-1-97B August 2020
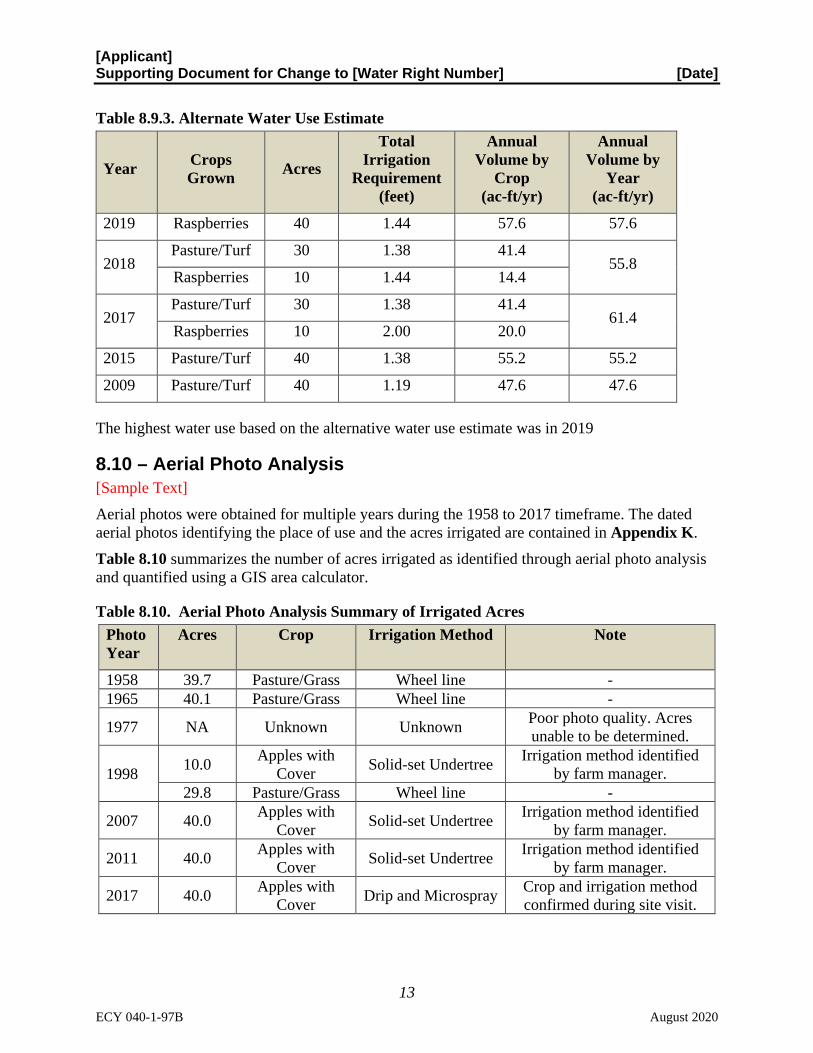
Table 8.9.3. Alternate Water Use Estimate
Year Crops Grown Acres
Total Irrigation
Requirement (feet)
Annual Volume by
Crop (ac-ft/yr)
Annual Volume by
Year (ac-ft/yr)
2019 Raspberries 40 1.44 57.6 57.6
2018 Pasture/Turf 30 1.38 41.4
55.8 Raspberries 10 1.44 14.4
2017 Pasture/Turf 30 1.38 41.4
61.4 Raspberries 10 2.00 20.0
2015 Pasture/Turf 40 1.38 55.2 55.2
2009 Pasture/Turf 40 1.19 47.6 47.6
The highest water use based on the alternative water use estimate was in 2019
8.10 – Aerial Photo Analysis [Sample Text] Aerial photos were obtained for multiple years during the 1958 to 2017 timeframe. The dated aerial photos identifying the place of use and the acres irrigated are contained in Appendix K. Table 8.10 summarizes the number of acres irrigated as identified through aerial photo analysis and quantified using a GIS area calculator.
Table 8.10. Aerial Photo Analysis Summary of Irrigated Acres Photo Year
Acres Crop Irrigation Method Note
1958 39.7 Pasture/Grass Wheel line - 1965 40.1 Pasture/Grass Wheel line -
1977 NA Unknown Unknown Poor photo quality. Acres unable to be determined.
1998 10.0 Apples with Cover Solid-set Undertree Irrigation method identified
by farm manager. 29.8 Pasture/Grass Wheel line -
2007 40.0 Apples with Cover Solid-set Undertree Irrigation method identified
by farm manager.
2011 40.0 Apples with Cover Solid-set Undertree Irrigation method identified
by farm manager.
2017 40.0 Apples with Cover Drip and Microspray Crop and irrigation method
confirmed during site visit.

[Applicant] Supporting Document for Change to [Water Right Number] [Date]
14 ECY 040-1-97B August 2020
Water Used for Irrigation
8.11 – Family Farm Water Act Compliance [Sample Text] The permit for the water right being changed was issued on September 5, 1978, which is after the Family Farm Water Act (FFWA) became effective on December 8, 1977. Table 8.11 identifies all the irrigation water rights held by the applicant in the State of Washington that are subject to the FFWA.
Table 8.11. Family Farm Water Act Water Rights Owned by the Applicant Water Right Number Irrigated Acres Permit Issuance Date
G2-24785C 130 9/5/1978
S1-28795P 2,050 9/15/2015
Total 2,180 -
The requested additional acres to be added under this water right are 20, which will bring the total FFWA water rights held by the applicant to 2,200 acres. This is much less than the 6,000 acres threshold under chapter 90.66 RCW.
8.12 – Irrigation Scheduling Practices [Sample Text] The water right holder has an on-site farm manager that is responsible for irrigation scheduling. The farm manager utilizes a combination of sources, such as soil pits, portable soil moisture probes, plant health, and the irrigation scheduler available on WSU’s AgWeatherNet to determine when and how much to irrigate (http://weather.wsu.edu/, accessed on March 1, 2020)
8.13 – Annual Consumptive Quantity Calculations [Sample Text] Since the change application requests to add additional irrigated acres, the annual consumptive quantity (ACQ) cannot be increased through the change application process. The ACQ is defined in statute as the average consumptive use of the highest 2 years over the most recent 5 years of continuous beneficial use. The water right currently authorizes irrigation of 101.5 acres with a maximum annual volume of 558 ac-ft/yr. The water right is used for irrigation of an apple orchard with a cover crop of grass using undertree impact sprinklers. The change request proposes to convert the water right to irrigation of wine grapes using trickle/drip irrigation. Table 8.13.1 shows the calculated use and consumptive use of the existing irrigation during the highest 2 years of use. The total water use is less than the water right limit.

[Applicant] Supporting Document for Change to [Water Right Number] [Date]
15 ECY 040-1-97B August 2020
Table 8.13.1. Analysis of Consumptive Use for Existing Acres and Crops
Crop CIR (inches)
CIR (feet) Ea (%) CU
(%) TIR (feet) Acres Total Qa (AFY)
CU Qa (AFY)
Apples with Cover
47.40 3.95 75 85 5.27 101.5 535 455
CIR = Crop Irrigation Requirement (from Washington Irrigation Guide (1985) for [STATION NAME] station). Ea and CU for Apple with Cover calculated based on TIR of 4.00 ft. Irrigation method is solid set – undertree. Ea = Application Efficiency (from Ecology Guidance 1210) CU = Consumptive Use TIR = Total Irrigation Requirement (CIR/Ea) Qa = Annual Volume AFY = Acre-feet per year
Table 8.13.2 shows the proposed irrigation and consumptive use.
Table 8.13.2. Analysis of Consumptive Use for Requested Acres and Crops
Crop CIR Ea CU TIR
Acres Total Qa CU Qa
(inches) (feet) (%) (%) (feet) (ac-ft/yr) (ac-ft/yr)
Wine Grapes 15.84 1.32 88 93 1.50 326 489 455
Wine grape CIR calculated based on a total irrigation requirement of 1.5 feet based on metering data for wine grape irrigation in the area.
Irrigation method is trickle/drip.
The request is to increase the number of irrigated acres by 224.5 acres from 101.5 to 326. The total use is calculated to decrease by 46 ac-ft/yr, while the consumptive use will remain the same at 455 ac-ft/yr.
8.14 – Use of Contract Water within Place of Use [Sample Text] Within the place of use, the applicant utilizes water under the water right being changed and from Water Service Contract No. 909-915 with the Quincy-Columbia Basin Irrigation District (QCBID). QCBID water is used to irrigate the western 40 acres, while the water under the water right requested for change occurs on the eastern 80 acres within the place of use. Only water use on the eastern 80 acres has been counted as beneficial use under the water right proposed for change. The contract water, and water right being changed, are shown visually on Figure 6.
[Applicant] Supporting Document for Change to [Water Right Number] [Date]
16 ECY 040-1-97B August 2020
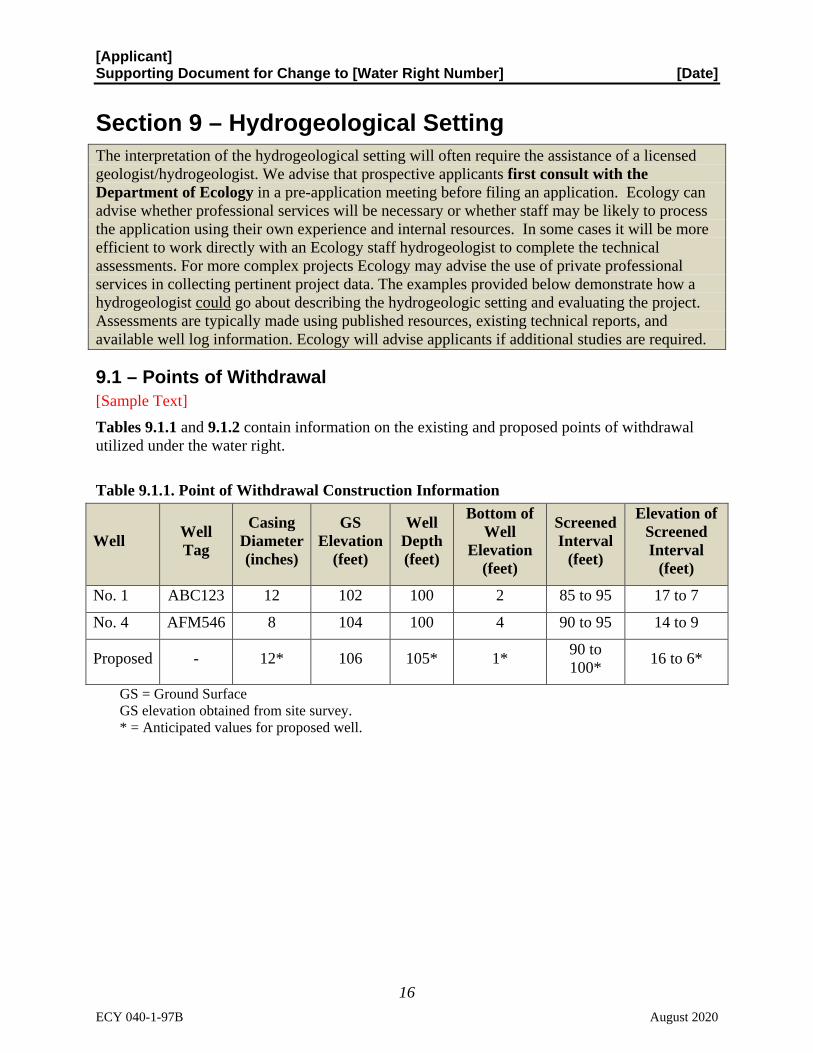
Section 9 – Hydrogeological Setting The interpretation of the hydrogeological setting will often require the assistance of a licensed geologist/hydrogeologist. We advise that prospective applicants first consult with the Department of Ecology in a pre-application meeting before filing an application. Ecology can advise whether professional services will be necessary or whether staff may be likely to process the application using their own experience and internal resources. In some cases it will be more efficient to work directly with an Ecology staff hydrogeologist to complete the technical assessments. For more complex projects Ecology may advise the use of private professional services in collecting pertinent project data. The examples provided below demonstrate how a hydrogeologist could go about describing the hydrogeologic setting and evaluating the project. Assessments are typically made using published resources, existing technical reports, and available well log information. Ecology will advise applicants if additional studies are required.
9.1 – Points of Withdrawal [Sample Text] Tables 9.1.1 and 9.1.2 contain information on the existing and proposed points of withdrawal utilized under the water right. Table 9.1.1. Point of Withdrawal Construction Information
Well Well Tag
Casing Diameter (inches)
GS Elevation
(feet)
Well Depth (feet)
Bottom of Well
Elevation (feet)
Screened Interval
(feet)
Elevation of Screened Interval
(feet)
No. 1 ABC123 12 102 100 2 85 to 95 17 to 7
No. 4 AFM546 8 104 100 4 90 to 95 14 to 9
Proposed - 12* 106 105* 1* 90 to 100* 16 to 6*
GS = Ground Surface GS elevation obtained from site survey. * = Anticipated values for proposed well.

[Applicant] Supporting Document for Change to [Water Right Number] [Date]
17 ECY 040-1-97B August 2020
Table 9.1.2. Point of Withdrawal Water Level Information
Well
GS Elevation
(feet)
MP Height (feet)
MP Elevation
(feet)
Static DTW
from MP (feet)
Static WL
Elevation (feet)
Date of WL Measurement
No. 1 102 2.0 104.0 50.7 53.3 5/4/2018
No. 4 104 2.5 106.5 51.0 55.5 5/4/2018
Proposed 106 3.0* 109.0* 52.0* 57.0* - GS = Ground Surface. MP = Measurement Point (often top of casing). GS elevation obtained from site survey. * = Anticipated values for proposed well.
Water well reports for each well are included in Appendix L.
9.2 – Describe the hydrogeology [Sample Text] Subsurface geologic and hydrogeologic conditions in the project area were evaluated based on a review of water well reports for wells completed within the immediate vicinity of the project area and a review of available geologic and hydrogeologic reports and information covering the project area, including but not limited to:
Armstrong , J. E., D. R. Crandell, D. J. Easterbrook and J. B. Noble (1965). Late Pleistocene Stratigraphy and Chronology of Southwestern British Columbia and Northwestern Washington. Geological Society of America Bulletin. 76: 321-330. Cox, S.E., and Kahle, S.C., Hydrogeology, Ground-Water Quality, and Sources of Nitrate in Lowland Glacial Aquifers of Whatcom County, Washington, and British Columbia, Canada: United State Geological Survey (USGS) Water-Resources Investigation s Report (WRIR} 98- 4195, 1999. Creahan, K., Water Table Elevations and Groundwater Flow in an Unconfined Aquifer in Northern Whatcom County, Washington, Western Washington University, M.S. Thesis, 1988. Culhane, T.D., Whatcom County Hydraulic Continuity Investigations - Parts 1 and 2: Washington State Department of Ecology Open File Technical Report 93-08, 1993. Culhane, T.D., Critical Well/Stream Separation Distances for Minimizing Stream Depletion: Washington State Department of Ecology Open File Technical Report 93-08, 1993. Easterbrook, D.J., Geologic Map of Western Whatcom County, Washington: U.S. Geological Survey, Miscellaneous Investigations Series Map 1- 854- B, scale 1:62,500, 1976. Gibbons, T.D., and Culhane, T.D., Basin Study of Johnson Creek: Washington State Department of Ecology Open File Technical Report 94-01, 1994.
[Applicant] Supporting Document for Change to [Water Right Number] [Date]
18 ECY 040-1-97B August 2020
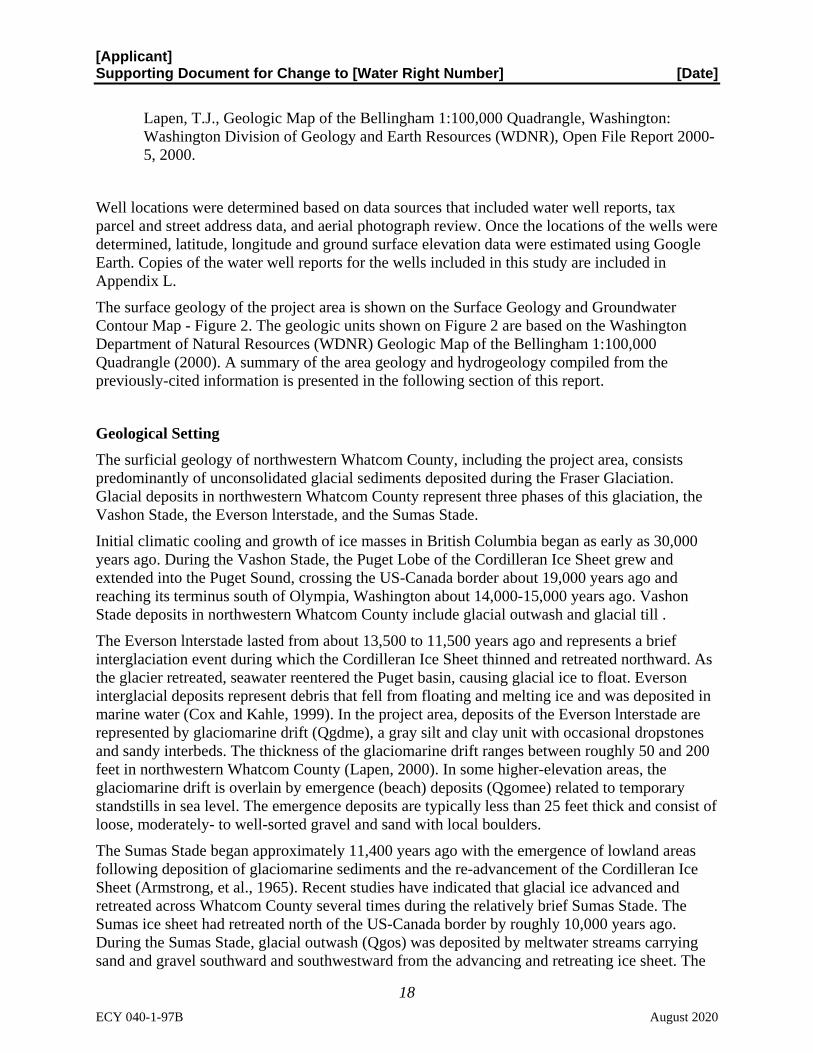
Lapen, T.J., Geologic Map of the Bellingham 1:100,000 Quadrangle, Washington: Washington Division of Geology and Earth Resources (WDNR), Open File Report 2000-5, 2000.
Well locations were determined based on data sources that included water well reports, tax parcel and street address data, and aerial photograph review. Once the locations of the wells were determined, latitude, longitude and ground surface elevation data were estimated using Google Earth. Copies of the water well reports for the wells included in this study are included in Appendix L. The surface geology of the project area is shown on the Surface Geology and Groundwater Contour Map - Figure 2. The geologic units shown on Figure 2 are based on the Washington Department of Natural Resources (WDNR) Geologic Map of the Bellingham 1:100,000 Quadrangle (2000). A summary of the area geology and hydrogeology compiled from the previously-cited information is presented in the following section of this report.
Geological Setting The surficial geology of northwestern Whatcom County, including the project area, consists predominantly of unconsolidated glacial sediments deposited during the Fraser Glaciation. Glacial deposits in northwestern Whatcom County represent three phases of this glaciation, the Vashon Stade, the Everson lnterstade, and the Sumas Stade. Initial climatic cooling and growth of ice masses in British Columbia began as early as 30,000 years ago. During the Vashon Stade, the Puget Lobe of the Cordilleran Ice Sheet grew and extended into the Puget Sound, crossing the US-Canada border about 19,000 years ago and reaching its terminus south of Olympia, Washington about 14,000-15,000 years ago. Vashon Stade deposits in northwestern Whatcom County include glacial outwash and glacial till . The Everson lnterstade lasted from about 13,500 to 11,500 years ago and represents a brief interglaciation event during which the Cordilleran Ice Sheet thinned and retreated northward. As the glacier retreated, seawater reentered the Puget basin, causing glacial ice to float. Everson interglacial deposits represent debris that fell from floating and melting ice and was deposited in marine water (Cox and Kahle, 1999). In the project area, deposits of the Everson lnterstade are represented by glaciomarine drift (Qgdme), a gray silt and clay unit with occasional dropstones and sandy interbeds. The thickness of the glaciomarine drift ranges between roughly 50 and 200 feet in northwestern Whatcom County (Lapen, 2000). In some higher-elevation areas, the glaciomarine drift is overlain by emergence (beach) deposits (Qgomee) related to temporary standstills in sea level. The emergence deposits are typically less than 25 feet thick and consist of loose, moderately- to well-sorted gravel and sand with local boulders. The Sumas Stade began approximately 11,400 years ago with the emergence of lowland areas following deposition of glaciomarine sediments and the re-advancement of the Cordilleran Ice Sheet (Armstrong, et al., 1965). Recent studies have indicated that glacial ice advanced and retreated across Whatcom County several times during the relatively brief Sumas Stade. The Sumas ice sheet had retreated north of the US-Canada border by roughly 10,000 years ago. During the Sumas Stade, glacial outwash (Qgos) was deposited by meltwater streams carrying sand and gravel southward and southwestward from the advancing and retreating ice sheet. The

[Applicant] Supporting Document for Change to [Water Right Number] [Date]
19 ECY 040-1-97B August 2020
Sumas glacial outwash is generally less than 125 feet thick, overlies the glaciomarine drift, and grades from gravel and cobble near the Canadian border to sand with occasional clay lenses near Lynden (Cox and Kahle, 1999). Surface geology in the project area consists of Sumas Stade glacial outwash (Qgos), which is typically sand, with local silt and gravel (Figure 2, Attachment F). Everson-age glaciomarine drift (Qgdme) and emergence deposits (Qgdmee) underlie the glacial outwash and outcrop at the ground surface southwest of the existing POU. It appears that Vashon Stade outwash deposits were encountered beneath the glaciomarine drift in wells 07B02, 07B03, and 07B04, located southwest of the project area.
Hydrogeologic Setting The available geologic and Hydrogeologic information for northwest Whatcom County, the reviewed water well reports, water level data, and other available information indicate that the project area is underlain by a shallow, regionally-extensive aquifer. This regional aquifer has been referred to as the Sumas-Blaine, Sumas-Abbotsford, Abbotsford-Sumas, and Sumas aquifer by various authors and will be called the Sumas aquifer for the purposes of this report. The wells identified for this project, with the exceptions of wells 07B02, 07B03, and 07B04, appear to be completed within the same body of groundwater (less than 100 feet deep) that is referred to by the United States Geological Survey (USGS) as the regionally-extensive surficial Sumas aquifer. Contours representing the elevation of the Sumas aquifer water table, as approximated based on water well reports, are shown on Figure 2. Pertinent characteristics of the Sumas aquifer in the project area are presented in the following sections of this report.
Aquifer Thickness The Sumas aquifer is unconfined and appears to be underlain by glaciomarine drift (Qgdme) and emergence deposits in the immediate project area. An average saturated aquifer thickness of 26 feet was estimated based on water well reports for wells completed in the Sumas aquifer in the vicinity of the POU (Figure 2, Attachment F). The average aquifer thickness may be underestimated because some of the well borings do not appear to have penetrated the full thickness of the aquifer (Attachment F).
Aquifer Parameters Estimates of pertinent parameters (hydraulic conductivity, transmissivity and storativity) for the Sumas aquifer in the vicinity of the water right POU were derived from aquifer testing information presented on water well reports for selected wells in the vicinity of the POU. A summary of the estimated aquifer parameters is presented in Table 4. [Note: Many of the groundwater proposals we receive withdraw water from bedrock sources which require a much greater level of evaluation.]

[Applicant] Supporting Document for Change to [Water Right Number] [Date]
20 ECY 040-1-97B August 2020
Table 9.2.1. Summary of Aquifer Parameter Data Water Right G1-12345
Well Latitude Longitude Specific Capacity(gpm/ft)
Transmissivity (ft 2/ d)
Hydraulic Conductivity(ft /
d)1 39 N/ 2E-0 5C0 1 48.902507 -122.584175 5.7 1,139 44
39N/ 2E-05C02 48.906114 -122.585508 2.0 401 16
39N/2E-05L01 48.897625 -122.588996 12.5 2,506 98
39N/ 2E-05P0 1 48.892677 -122.583233 13.3 2,673 104
39N/ 2E-06801 48.903505 -122.600661 5.5 1,094 43
39N/ 2E-06G01 48.901592 -122.602085 3.4 684 27
39N/ 2E- 06 G02 48.901593 -122.602048 12.5 2,506 98
39N/2E-06K01 48.898420 -122.602546 2.1 428 17
39N/2E-06K02 48.899893 -122.600796 6.7 1,337 52
39N/2E-06K03 48.896402 -122.602878 1.3 267 10
39N/ 2E-08D01 48.890029 -122.588392 12.5 2,506 98
Average 7.0 1,413 55
Reported Ranges
-- 74- 610 2
1,350 - 17,4003 1.07 – 2984
Notes:
1. Hydraulic conductivity was calculated using a saturated aquifer thickness of 26 feet for the project area, as estimated from water well reports (Attachment L).
2. 25th to 75th percentile range of hydraulic conductivity reported by Cox and Kahle (1999) for the Sumas aquifer.
3. Range of transmissivity values reported by Culhane (1993) for the Sumas aquifer. 4. Range of hydraulic conductivity values reported by Gibbons and Culhane (1994) for
the Sumas aquifer. Aquifer transmissivity is a measure of the amount of water that can be transmitted horizontally by the full-saturated thickness of the aquifer under a hydraulic gradient (slope) of 1. Using the Jacob method, the transmissivity (in gallons per day per foot) of an unconfined aquifer can be estimated from the aquifer specific capacity data (Driscoll, 1986). When aquifer tests are conducted, the well driller typically records the pumping rate, duration, and resulting water level drawdown. Eleven of the water well reports for wells located in the project area had sufficient aquifer testing information to estimate well specific capacity and, therefore, aquifer transmissivity.

[Applicant] Supporting Document for Change to [Water Right Number] [Date]
21 ECY 040-1-97B August 2020
[Note: Initial yield test data provided in well logs may not provide sufficient information to assess aquifer characteristics. It can be used to provide a rough estimate of aquifer parameters, but alone is not sufficient to determine aquifer characteristics.] Using the Jacob method and the well specific capacity data, the aquifer transmissivity was estimated to range between 267 and 2,673 square feet per day (ft 2/ d) with an average of roughly 1,413 ft 2/ d in the vicinity of the POU (Table 4). The estimated transmissivity in the vicinity of the POU falls at the low end of the transmissivity range reported by Culhane (1993) for the Sumas aquifer (Table 4). The Culhane (1993) study area was the Johnson Creek drainage, located roughly 4 miles northeast of the POU. The transmissivity of the Sumas aquifer is expected to be somewhat higher in the Johnson Creek drainage compared to the POU (Cox & Kahle, 1999).
Aquifer Hydraulic Conductivity Hydraulic conductivity is a measure of the rate at which water can move through an aquifer and is equal to the transmissivity divided by the saturated thickness of the unit. Based on an assumed saturated aquifer thickness of 26 feet, the transmissivity values estimated for the Sumas aquifer in the vicinity of the tested wells correspond to hydraulic conductivity values ranging between roughly 10 and 104 feet per day (ft/d) with an average of approximately 55 ft/d (Table 4). The estimated range of hydraulic conductivity values falls at the low end of the ranges presented by Gibbons and Culhane (1994) and Cox and Kahle (1999) for the Sumas aquifer (Table 4).
Aquifer Storativity Storativity is a dimensionless quantity that is equal to the volume of water that an aquifer releases from or takes into storage per unit surface area of the aquifer per unit change in hydraulic head. As previously discussed, the Sumas aquifer in the vicinity of the subject properties is under unconfined conditions. Storativity in unconfined aquifers is equal to the aquifer specific yield, which typically ranges between 0.005 and 0.35.
Groundwater Elevation and Flow Direction The groundwater elevation is roughly 60 feet above mean sea level in the vicinity of the POU, with groundwater flowing towards the northwest (Figure 2). Based on the available water level data, the groundwater flow direction is to the NE at roughly 10 feet per mile.
Groundwater Flow Velocity The average linear velocity of groundwater flow in the Sumas aquifer in the project vicinity can be estimated using the following equation:
𝑣𝑣𝑎𝑎𝑎𝑎𝑎𝑎= 1
𝑛𝑛𝑒𝑒𝐾𝐾𝐾𝐾
where ne is effective porosity (dimensionless}, K is hydraulic conductivity (ft/d}, and i is the aquifer hydraulic gradient (dimensionless). The effective porosity of the Sumas aquifer likely ranges between 0.15 and 0.33 based on information presented in Cox and Kahle (1999), Gibbons and Culhane (1994), and our

[Applicant] Supporting Document for Change to [Water Right Number] [Date]
22 ECY 040-1-97B August 2020
understanding of the local geology and hydrogeology. For the average linear velocity calculation, we assumed an average effective porosity of 0.24. The average hydraulic conductivity in the project area is approximately 55 ft/d (Table 4). The hydraulic gradient of the upper surface of the Sumas aquifer in the vicinity of the proposed POU is approximately 0.002 under static conditions. Using the above described values for the variables in the average linear velocity equation indicates that the groundwater velocity in the vicinity of the proposed POU is approximately 0.55 ft/d. The estimated groundwater flow velocity is somewhat lower than the range (0.8 to 5.1 ft/d) reported by Gibbons and Culhane (1994) for the Sumas aquifer in the Johnson Creek drainage.
Aquifer Recharge and Discharge Recharge to the Sumas aquifer where it is unconfined is from the downward percolation of precipitation into the aquifer. In areas where the aquifer is confined, recharge results primarily from the lateral inflow of groundwater from the unconfined portion of the aquifer and, to a much lesser extent, from the vertical infiltration of precipitation through the low-permeability confining units. Where unconfined, the Sumas aquifer discharges to springs, seeps, and other surface water bodies, and through the pumping of groundwater wells. In the vicinity of the POU, groundwater discharges to pumping wells and to California Creek. California Creek flows northwest and discharges to Puget Sound near Blaine, Washington.
Potential Impairment Issues Impairment Definition There are three concepts that are important when considering whether a withdrawal of water from a well would impair another existing water right. The concepts are defined as follows: Impairment is an adverse impact on the physical availability of water for a beneficial use that is entitled to protection, i.e., water rights that are both senior and junior in priority to the right the applicant seeks to change. Qualifying groundwater withdrawal facilities are defined as those wells which, in the opinion of the Department of Ecology (Ecology), are adequately constructed. An adequately constructed well is one that (a) is constructed in compliance with well construction requirements; (b) fully penetrates the saturated thickness of an aquifer or withdraws water from a reasonable and feasible pumping lift (WAC 173-150); (c) is able to accommodate a reasonable variation in seasonal pumping water levels; and (d) is properly sized (including pumping facilities) to the ability of the aquifer to produce water. Well interference may occur when several wells penetrate and withdraw groundwater from the same aquifer .
Potential Well Drawdown Ebe Farms has requested the addition of an unspecified number of future additional wells on parcels located within the proposed POU as POWs for water right Gl-*03193CWRIS. To evaluate potential impact/impairment issues associated with the proposed POWs, the Cooper-Jacob (1946) solution to the Theis equation was used to estimate the potential water level drawdown in the aquifer resulting from pumping a new well.

[Applicant] Supporting Document for Change to [Water Right Number] [Date]
23 ECY 040-1-97B August 2020
Using the Cooper-Jacob method, drawdown in an observation well is given as follows:
𝑠𝑠 =𝑄𝑄
4𝜋𝜋𝜋𝜋 𝑤𝑤(𝑢𝑢)
𝑢𝑢 =𝑟𝑟2
4𝜋𝜋𝑇𝑇
Where s is drawdown, Q is the pumping rate, r is the radial distance from the pumping well to the observation well, S is storativity (equal to specific yield for unconfined aquifers), t is the duration of pumping, and T is transmissivity. For small values of u, w(u) is approximated as:
𝑤𝑤(𝑢𝑢) = −0.5772 − 𝑙𝑙𝑙𝑙(𝑢𝑢) For the drawdown calculation regarding the proposed POWs, we assumed an aquifer average transmissivity of 1,413 ft2/ d and an aquifer specific yield of 0.20, which are representative of the unconfined Sumas aquifer in the project vicinity (Table 4). We assumed that all future wells will be completed within the Sumas aquifer, which has a saturated thickness of approximately 26 feet in the vicinity of the proposed POU. We assumed that a future well would be pumped half the time during the 183-day irrigation season (April to September), which is equivalent to 91.5 days of continuous pumping. The average pumping rate needed to meet the water right Qa of 64 afy over a period of 91.5 days is 157 gpm. We used the Theis equation to calculate the drawdown at various distances from the well that would result from pumping a future well at 157 gpm for 91.5 days. We considered the radius of influence of the well to be distance at which the calculated drawdown is equal to 10 percent of the saturated thickness of the aquifer, i.e. 2.6 feet. Using the assumptions outlined above, the calculated radius of influence of a future well in the POU is 554 feet. This is the distance from the well at which the calculated drawdown is no more than 10 percent of the saturated aquifer thickness. Given this calculated radius of influence, future irrigation wells will be completed at least 554 feet away from any existing water supply well not owned by Ebe Farms. A summary of the potential water level drawdown impacts from the use of the proposed future POWs is shown in Table 9.2.2.
Table 9.2.2. Potential Water Level Impact Data Water Right Gl-12345 Well Pumping
Rate (gpm) Distance to Nearest
Well (feet) Water Level Drawdown
(feet)
Future Well(s) 157 554 2.6

[Applicant] Supporting Document for Change to [Water Right Number] [Date]
24 ECY 040-1-97B August 2020
9.3 – Aquifer Characteristics (Second Example) [Note: If data does not exist, you will need a preliminary permit from Ecology to obtain the necessary data.] [Sample Text] The advance outwash aquifer in the vicinity of the points of withdrawal is approximately 20 feet thick. The aquifer is confined at this location by the overlying glacial till. Analysis of a 24-hour constant-rate pumping test performed on Well No. 1 from [DATE] to [DATE] by [COMPANY] indicates that the transmissivity of the aquifer is 50,000 gallons per day per foot (gpd/ft) (Appendix L). After 24 hours of pumping at 100 gallons per minute, the drawdown in the well was 20 feet, for a 1-day specific capacity of 5 gallons per minute per foot. Well No. 2 was monitored during the pumping test, which allowed for a calculation of 0.0001 for the storage coefficient. After pumping had ceased, recovery in the pumped well was monitored. The well recovered to 95% after 48 hours. The nearest well in the same aquifer to the proposed point of withdrawal is a permit-exempt well associated with a single home located approximately 500 feet NE from the well. To analyze for potential pumping impacts, the drawdown at a distance of 500 feet from the proposed well was calculated using the Cooper-Jacob approximation method (Table 9.3.1).
Table 9.3.1. Calculated Drawdown Over Time at Nearest Well Pumping Duration
(days) Calculated Drawdown
(feet)
1 1.5
7 1.9
30 2.2
182 2.7
365 2.8 Calculation used – Cooper-Jacob Approximation
T = 50,000 gpd/ft S = 0.0001 Q = 100 gpm Distance from Proposed Well = 500 feet
The available drawdown in the neighboring well between the static water level, as reported on the water well report, and the top of the screen is 25 feet. The calculated interference drawdown, when extrapolated out to durations longer than the well will be continuously operated, will not impair the ability of that well owner to withdraw enough water to meet their permit-exempt needs. The recovery observed suggests that the withdrawal rate did not exceed the recharge rate into the aquifer.

[Applicant] Supporting Document for Change to [Water Right Number] [Date]
25 ECY 040-1-97B August 2020
Water Quality Information [Sample Text] Even though the aquifer tapped by the existing and proposed wells is below sea level and the distance from marine water is less than 1 mile, the chloride concentration as measured in Well Nos. 1 and 4 is low at approximately 5 mg/L and has not shown any increasing trend since water quality samples began to be collected in the year 2000, as shown in Table 9.3.2.
Table 9.3.2. Chloride Concentration Over Time
Sample Date Chloride Concentration (mg/L) Well No. 1
Chloride Concentration (mg/L) Well No. 4
8/7/2000 4.8 5.6
8/20/2002 5.8 5.0
9/1/2005 4.2 4.8
7/30/2009 4.5 4.5
8/15/2015 5.0 5.1
The chloride data contained in Table 9.3.2 suggests that seawater intrusion is not currently occurring into the existing wells.
Section 10 – Environmental Assessment General Information
10.1 – Aquatic Use of Surface Water Bodies [Sample Text] The Skykomish River is inhabited by several species of fish (refer to Section 10.2). The river is used recreationally by fishermen, swimmers, kayakers, and rafters. Many of the parks along the river allow people to enjoy the aesthetics of the river. The requested water right change will not cause any additional reduction in flow of the Skykomish River beyond the impact of the existing water use under the right.
10.2 – Fish and Salmonid Presence [Sample Text] The Tucannon River is fish-bearing. Table 10.2 contains information on the presence of salmonids in the Tucannon River near the point of diversion in Starbuck, Washington, according to WDFW’s SalmonScape website.

[Applicant] Supporting Document for Change to [Water Right Number] [Date]
26 ECY 040-1-97B August 2020
Table 10.2. Tucannon River Salmonid Utilization Salmonid Use Type Distribution Type
Spring Chinook Spawning Documented
Fall Chinook Spawning Documented
Summer Steelhead Spawning Documented
Bull Trout Presence Documented
The Snake River Spring/Summer run Chinook salmon, Snake River Fall-run Chinook salmon, and Snake River Basin Steelhead are all listed as Threatened under the Endangered Species Act. In addition to the species identified in Table 10.2, there are other fish species that live in the Tucannon River, such as smallmouth bass, rainbow trout, and mountain whitefish.
Section 11 – Maps General Information
11.1 – Water Right Maps [Sample Text]
Map of Existing Water Right Attributes Refer to Figure 1.
Map of Current Water Use Attributes Refer to Figure 2.
Map of Proposed Water Right Attributes Refer to Figure 3.
Map Showing Infrastructure Associated with Existing Water Use Refer to Figure 4.
Map Showing Infrastructure Associated with Proposed Water Use Refer to Figure 5.
Map Showing Related Water Rights Refer to Figure 6.

[Applicant] Supporting Document for Change to [Water Right Number] [Date]
27 ECY 040-1-97B August 2020
Section 12 – Signatures General Information
12 – Ownership Information [Sample Text] Table 12.1 identifies all parcels within the existing and proposed places of use, along with ownership of those parcels (Appendix M).
Table 12.1. Property Ownership within Places of Use Parcel Number Parcel Owner Place of Use
P12448 James Dunn Existing and Proposed
P12449 James Dunn Existing and Proposed
P12500 Dunn Ranch LLC Proposed
P12501 Dunn Ranch LLC Proposed
P12502 James Dunn Proposed
The applicant is James Dunn. According to the Washington Secretary of State website, James Dunn is the governor for Dunn Ranch LLC (Appendix M). Therefore, James Dunn has signed the change application as the applicant, water right holder, land owner of existing place of use, and land owner of proposed place of use.

[Applicant] Supporting Document for Change to [Water Right Number] [Date]
28 ECY 040-1-97B August 2020
Attachment A – Mitigation Plan Complete this Attachment if the water right change as proposed, without a mitigation plan, would impair an existing water right. For the purposes of this analysis, an existing water right is a water use being carried out under authority of a water right permit, certificate, a water right claim, a minimum instream flow or base flow established by rule, or a legal, permit-exempt well.
General Information
A.1 – Will the Change Cause Impairment? [Sample Text] Yes, without mitigation, the requested change will cause impairment of an existing water right. Moving the City’s point of diversion upstream of the point of diversion for the hydropower plant will reduce the water available from Big Creek for hydropower under those water rights.
A.2 – Water Rights that would be Impaired [Sample Text] The water rights that would be impaired are associated with the Big Creek Hydropower Project (Table A.2). The water rights associated with that hydropower project often exceed the flow in the stream during the irrigation season. Therefore, any reduction of the flow in the creek, when the flow is below 50 cfs, is considered an impairment of the hydropower water rights.
Table A.2. Water Rights that Could be Impaired Information
Water Right Sources
Instantaneous Rate (cfs) Additive
Instantaneous Rate (cfs)
Non-Additive
Annual Volume (ac-ft/yr) Additive
Annual Volume (ac-ft/yr) Non-
Additive
S4-23564C Big Creek 40 0 NS 0
S4-24589C Big Creek 10 0 NS 0
Combined Total 50 - NS - No annual volume specified on the water rights.
A.3 – Quantification of Impairment [Sample Text] The City is moving its diversion on Big Creek from the existing location (approximately 1 mile downstream of the Big Creek Hydropower Project point of diversion) to a new location 0.1 miles upstream of the Big Creek Hydropower Project point of diversion. Streamflow data obtained from the United States Geological Survey (USGS) for Big Creek approximately 2 miles upstream from the Big Creek Hydropower Project diversion consistently shows that the creek always flows in excess of 50 cfs, except for the period of July 1st through September 30th, when the flow can be below 50 cfs. The City’s water right is for 2 cfs. Based on

[Applicant] Supporting Document for Change to [Water Right Number] [Date]
29 ECY 040-1-97B August 2020
the streamflow data, it appears that the impairment of the Big Creek Hydropower Project water right could be up to 2 cfs from July 1st through September 30th.
A.4 – Source of Supply for Proposed Mitigation Water [Sample Text] The City has an active purchase and sale agreement for a parcel of riparian property that has a senior water right on Big Creek upstream of the hydropower project. This water right diverts water from Big Creek at a rate of 2.5 cfs for irrigation of 100 acres.
A.5 – How will Source of Supply Offset the Impacts of the Proposed Change? [Sample Text] The City will purchase the upstream property and associated irrigation water right and permanently donate the water right into the State’s Trust Water Rights Program. Water will no longer be diverted from Big Creek for irrigation during the summer months, which is the period during which mitigation is required.
A.6 – Security and Longevity of Mitigation [Sample Text] Since the water right will be permanently donated to the Trust Water Rights Program, that water will remain as a source of mitigation in perpetuity.
A.7 – Water Rights to be Placed into Trust [Sample Text] The water right to be placed permanently into Trust is contained in Table A.7.
Table A.7. Water Right Information
Water Right
Priority Date Sources
Instantaneous Rate (cfs) Additive
Instantaneous Rate (cfs)
Non-Additive
Annual Volume (AFY)
Additive
Annual Volume (AFY) Non-
Additive
Irrigated Acres
Additive
Irrigated Acres Non-
Additive
SWC 1111 6/1/1956 Big Creek 2.5 0 400 0 100 0
This water right is senior to the hydropower water rights associated with the Big Creek Hydropower Project and the City’s water right. [Providing information on historic use under the water right would be similar to the text contained in Sections 8.7, 8.8, 8.9, and 8.10.]

[Applicant] Supporting Document for Change to [Water Right Number] [Date]
30 ECY 040-1-97B August 2020
A.8 – Benefits and Costs of Water Impoundments or Other Resource Management Techniques [Sample Text] All mitigation proposed to offset impacts is based on acquisition and permanent donation of senior water rights into the State’s Trust Water Rights Program.
A.9 and 10 – Quantify Offset Provided by Water Impoundment or Other Resource Management Techniques [Sample Text] All mitigation proposed to offset impacts is based on acquisition and permanent donation of senior water rights into the State’s Trust Water Rights Program.
A.11 – Quantify Consumptive Use of Water Right [Sample Text] The new point of diversion will cause impairment equivalent to the rate of water diverted under the City water right since the City’s wastewater treatment facility is located in another watershed. The City’s water right authorizes diversion of 2 cfs and 400 ac-ft/yr. The City’s diversion pump is able to pump at 2 cfs year-round. Metering data has shown that the City diverts approximately 250 ac-ft/yr during the months of July through September, when the full 50 cfs is not always available at the Big Creek Hydropower Project diversion. The remaining 150 ac-ft/yr is diverted the rest of the year, when the water supply is sufficient for all water users. This shows that the water right to be acquired will more than offset for impact to the Big Creek Hydropower Project water rights due to the City moving its point of diversion upstream.

[Applicant] Supporting Document for Change to [Water Right Number] [Date]
31 ECY 040-1-97B August 2020
Attachment B – Consolidation of Exempt Wells Complete Attachment B if you are consolidating one or more permit-exempt uses with a valid groundwater permit or certificate. Permit-exempt wells may only be consolidated with a groundwater permit or certificate. Permit-exempt wells cannot be consolidated with a groundwater claim, other permit-exempt wells, or surface water rights. Refer to RCW 90.44.105 for more information. Note that you must meet ALL the conditions identified in Sections B1 through B7.
General Information
B.1 – Same Body of Public Groundwater [Sample Text] The permit-exempt well and Water Association Well No. 3 are completed in the same body of public groundwater. The water well reports are contained in Appendix L. Both wells are completed in the Missoula Glacial Flood Deposits aquifer. These deposits are coarse-grained sand and gravel, and the aquifer is very productive. The distance between the wells is only ½ mile. The groundwater level in the wells is the same as the water level in the adjacent Columbia River, suggesting that there is interconnection between the aquifer and the river.
B.2 – Suitable Arrangements to Discontinue Use of the Permit-Exempt Well [Sample Text] Once the permit-exempt well consolidation is approved, the property owner will be authorized to connect to the Water Association’s system. A water availability certificate for this parcel is contained in Appendix C. This, and any future permit-exempt wells, will not be used for water supply on the parcel, as explained under Sections B.3 and B.4.
B.3 – Legally Enforceable Agreement to Prevent Use of Permit-Exempt Well on Property [Sample Text] Once the permit exempt well consolidation is approved, the property owner will file a covenant on the property preventing the drilling or use of water from a permit-exempt well on the property. A copy of the covenant to be filed is contained in Appendix M.
B.4 – Permit-Exempt Well Will Be Properly Decommissioned [Sample Text] The property owner has obtained quotes from well drillers and has selected [COMPANY] to perform the decommissioning work. This company is properly licensed in Washington State, and the decommissioning water well report will be filed with Ecology upon completion.
[Applicant] Supporting Document for Change to [Water Right Number] [Date]
32 ECY 040-1-97B August 2020
B.5 – Impacts to Other Water Rights Due to the Consolidation [Sample Text] This permit-exempt well consolidation will move the withdrawal of 15 gpm and 1 ac-ft/yr from the permit-exempt well to the Water Association’s Well No. 3 (Section B.6). Well No. 3 has a water right and is currently authorized to be pumped at 900 gpm. The specific capacity of the well is 25 gpm/ft. Therefore, pumping an additional 15 gpm from the well should only cause the pumping water level in the well to drop by approximately 0.6 feet. This dynamic water level drop will decrease with distance from the well. Due to the aquifer’s hydraulic connection with the Columbia River, there will be no decline from year to year.
B.6 – Use of Water From Permit-Exempt Well [Sample Text] No water flow meter was installed on the permit-exempt well. Therefore, the water use had to be estimated. The permit-exempt well system consists of a submersible pump installed in the well. From the well, the water is routed into a pressure tank before it is distributed to the home and yard hydrants. The submersible pump motor is assumed to be 1 horsepower, based on a nameplate sticker attached to an electrical box in the pumphouse (Appendix D). The make and model of the submersible pump is not known. To determine the maximum pumping rate of the well, a hose was attached to all three yard hydrants and routed to a common location. The yard hydrants were then fully opened and water was allowed to discharge from the hoses onto the ground. A 5-gallon bucket and a stopwatch was used to measure how quickly the water from the three hoses was able to fill the 5-gallon bucket. The average time measured to fill the 5-gallon bucket was 20 seconds. This equals a total pumping rate from the well of 15 gpm, which is reasonable for a permit-exempt well serving one home. The current property being served by the permit-exempt well is 0.8 acres in size with a home and some lawn and landscaping. The property is consistent with other properties served by the Water Association. According to the Water Association’s 2018 Water System Plan (Appendix C) the average day demand for an equivalent residential unit (ERU) is 893 gallons per day. Converting this average day demand to an annual volume is equal to 1 ac-ft/yr.
B.7 – Is the Consolidation Consistent with Local Plans [Sample Text] The parcel served by the permit-exempt well is located within the Water Association’s retail service area as described in its 2018 Water System Plan (Appendix C). Therefore, water service to this parcel is consistent with the water system plan.

[Applicant] Supporting Document for Change to [Water Right Number] [Date]
33 ECY 040-1-97B August 2020
Attachment C – Quincy Basin Change Authorizations You should have completed Sections 1 through 5, Section 7 (Related Water Rights), and Section 11 (Maps and Other Documentation) of the water right change application (Ecology Form No. ECY 040-1-97 (Rev 01-2020). In addition, you need to complete Sections C1 and C2 below.
General Information
C.1 – Describe the Change Requested [Sample Text] The current Quincy Basin permit authorizes seasonal irrigation of 120 acres from one well. The change requests to change the purpose of use from irrigation to industrial and the period of use from seasonal to year-round. The place of use for the water right will remain the same since the center pivot will be taken out of service and a data server building will be constructed on the same property.
C.2 – If Previously Changed, Have the Prior Changes Been Made? [Sample Text] No prior changes have been made to this Quincy Basin permit.

[Applicant] Supporting Document for Change to [Water Right Number] [Date]
34 ECY 040-1-97B August 2020
Attachment D – Drought Change Authorizations You should have completed Sections 1 through 5 and Section 11 (Maps and Documentation) of the water right change application (Ecology Form No. ECY 040-1-97 (Rev 01-2020). In addition, you need to complete all sections in this Attachment.
General Information
D.1 – Describe Specific Circumstances Pertaining to Water Shortage [Sample Text] On [DATE], the Governor declared a drought for the entire State. Due to the less than normal snowpack, and early melt, our aquifer water level is currently 25 feet lower than normal for this time of year and we do not believe that the aquifer water level will fill above this level due to the warmer than usual spring and early summer. The low groundwater level means that we will have to reduce our pumping to avoid pumping air and damaging our pump. If we have to limit our irrigation to one-half of our normal supply, we will have to focus on saving orchard trees and our crop for this year will be a total loss.
D.2 – Describe How Proposed Change Will Address Water Shortage [Sample Text] The proposed change is requesting to use an additional well that was drilled in an area where the aquifer is thicker. This aquifer has shown heavy declines during periods of drought. Being able to use both the existing and backup well will allow us to spread our pumping over a larger extent of the aquifer.
D.3 – Any Previous Drought-Specific Authorizations for the Subject Parcels? [Sample Text] During the 2015 drought, a drought-specific change authorization was approved. The drought change authorization that year was CG4-23432C. The current request is the same as the 2015 drought change authorization. We were not contacted by Ecology or any other water right holders during the 2015 drought claiming that our drought change authorization was causing impairment.
D.4 – Irrigation only – What Types of Crop(s) Are Bring Grown and How Will the Water Shortage Impact Them [Sample Text] Ruby Red Orchard grows a variety of apples and cherries. These are perennial crops that must be irrigated, or else the orchard trees will die and the investment will be lost.

Figures


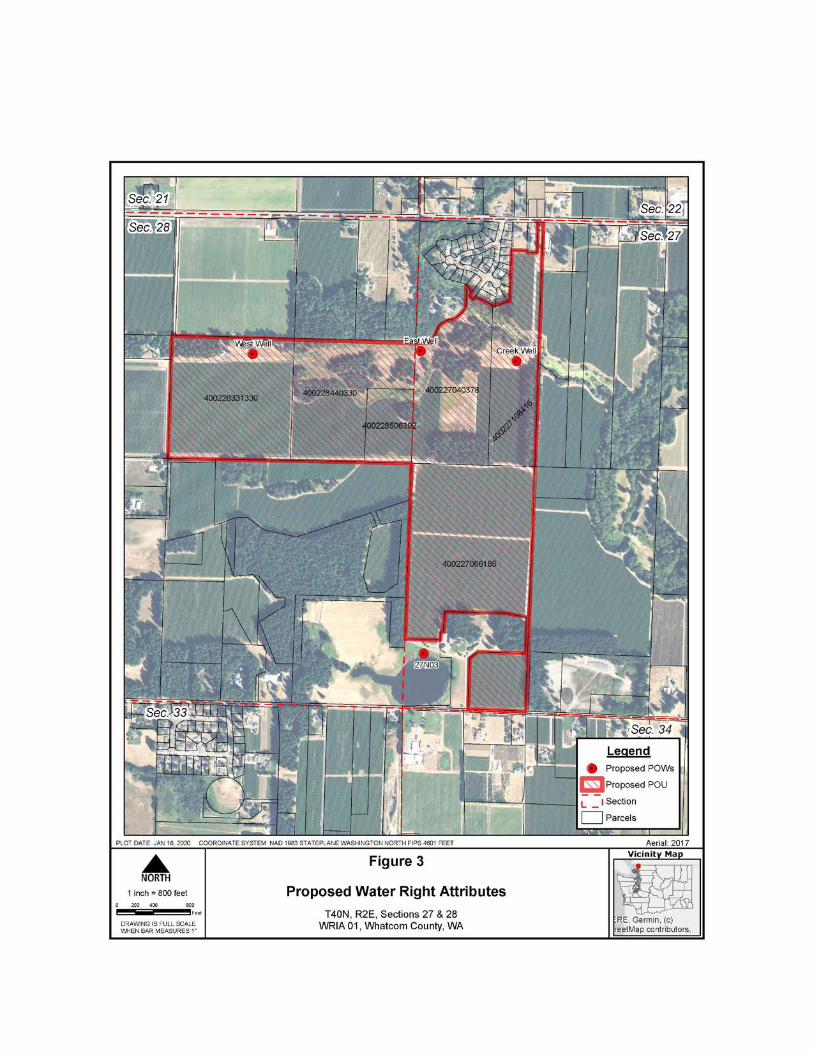


Appendices

Appendix A Water Right Record


Appendix B State Environmental Policy Act
Documents

Appendix C Water System Planning
Documents

Appendix D Photos

Appendix E Technical Specifications on
Equipment

Appendix F Historic Use Documents

Appendix G Streamflow Records

Appendix H Water Metering Data
Appendix I Power Meter to Water Use Data
and Calculations

Appendix J Alternative Water Use Data and
Calculations

Appendix K Aerial Photos Supporting Historic
Use

Appendix L Water Well Reports and Testing
Reports

Appendix M Property Ownership Documents